arxiv: v1 [astro-ph.sr] 31 Mar 2013
|
|
|
- Franklin Lindsey
- 6 years ago
- Views:
Transcription
1 Astronomy & Astrophysics manuscript no. mano 25mar2011 rev10 c ESO 2013 April 2, 2013 arxiv: v1 [astro-ph.sr] 31 Mar 2013 Eruption of a plasma blob, associated M-class flare, and large-scale EUV wave observed by SDO Pankaj Kumar 1 and P.K. Manoharan 2 1 Korea Astronomy and Space Science Institute (KASI), Daejeon, , Republic of Korea pankaj@kasi.re.kr 2 Radio Astronomy Centre, National Centre for Radio Astrophysics, Tata Institute of Fundamental Research, Udhagamandalam (Ooty) , India mano@ncra.tifr.res.in Preprint online version: April 2, 2013 ABSTRACT We present a multiwavelength study of the formation and ejection of a plasma blob and associated extreme ultraviolet (EUV) waves in active region (AR) NOAA 11176, observed by SDO/AIA and STEREO on 25 March The EUV images observed with the AIA instrument clearly show the formation and ejection of a plasma blob from the lower atmosphere of the Sun at 9 min prior to the onset of the M1.0 flare. This onset of the M-class flare happened at the site of the blob formation, while the blob was rising in a parabolic path with an average speed of 300 km s 1. The blob also showed twisting and de-twisting motion in the lower corona, and the blob speed varied from km s 1. The faster and slower EUV wavefronts were observed in front of the plasma blob during its impulsive acceleration phase. The faster EUV wave propagated with a speed of 785 to 1020 km s 1, whereas the slower wavefront speed varied in between 245 and 465 km s 1. The timing and speed of the faster wave match the shock speed estimated from the drift rate of the associated type II radio burst. The faster wave experiences a reflection by the nearby AR NOAA In addition, secondary waves were observed (only in the 171 Å channel), when the primary fast wave and plasma blob impacted the funnel-shaped coronal loops. The Helioseismic Magnetic Imager (HMI) magnetograms revealed the continuous emergence of new magnetic flux along with shear flows at the site of the blob formation. It is inferred that the emergence of twisted magnetic fields in the form of arch-filaments/ anemone-type loops is the likely cause for the plasma blob formation and associated eruption along with the triggering of M-class flare. Furthermore, the faster EUV wave formed ahead of the blob shows the signature of fast-mode MHD wave, whereas the slower wave seems to be generated by the field line compression by the plasma blob. The secondary wave trains originated from the funnel-shaped loops are probably the fast magnetoacoustic waves. Key words. Sun: flares Sun: magnetic topology Sun: filaments, prominences sunspots Sun: coronal mass ejections (CMEs) 1. Introduction It is widely accepted that magnetic reconnection plays an important role in releasing the energy stored in sheared magnetic fields on the solar surface. In a magnetic reconnection process, oppositely directed field lines come closer and join, resulting in the release of magnetic energy in the form of thermal energy and particle acceleration (e.g., Sweet 1958, Parker 1963, Petschek 1964). The standard solar flare model, known as the CSHKP model, explains the energy release process (Carmichael 1964; Sturrock 1966; Hirayama 1974; Kopp & Pneuman 1976), and it is supported by various observational findings, such as cusp-shaped loops (Tsuneta et al. 1992), inflows (Yokoyama et al. 2001), down-flow signatures (McKenzie 2000; McKenzie & Hudson 2001; Asai et al. 2004), plasmoid ejections (Shibata et al. 1995), loop-top hard X-ray sources (Masuda et al. 1994; Sui & Holman 2003), X-ray jets (Shibata et al. 1992; Shimojo et al. 1996), and flux rope/loop interactions (Manoharan et al. 1996; Kumar et al. 2010a,b,c; Török et al. 2011). The exact triggering mechanisms of solar flares/cmes are however not well understood. A filament in the solar active region often show slow rising motions before the onset of the eruption (Kahler et al. 1988; Schmieder et al. 2008; Schrijver et al. 2008; Cheng et al. 2010). This suggests that a global magnetohydrodynamics (MHD) instability (e.g., kink instability) can trigger an AR filament eruption, leading to two-ribbon flares and an associated CME (Moore 1988; Kliem et al. 2004; Török & Kliem 2005; Kumar et al. 2012a). A strong correlation between the magnetic flux emergence and filament eruption has been observed (Feynman & Martin 1995). Therefore, based on the flux rope 2D MHD simulation model proposed by Chen & Shibata (2000), it is suggested that the flux emergence is an efficient mechanism to trigger the onset of CMEs/flares. The tethercutting magnetic reconnection, which occurs beneath the erupting filament, has also been employed to explain several eruptions (Moore & Roumeliotis 1992; Moore et al. 2001). Using SDO/AIA observations, Sterling et al. (2011) recently studied a filament eruption that was broadly consistent with the flux cancellation leading to the formation of a helical flux rope that subsequently erupted due to the onset of magnetic instability and/or runaway tether cutting. For more details about the triggering of M- and X-class solar flares and associated flux-rope destabilization, see the review by Schrijver (2009). According to the standard flare model (e.g., CSHKP), the magnetic reconnection occurs in a vertical current sheet above a closed underlying loop, and the filament/prominence eruption plays an important role in the triggering of fast reconnection (Forbes & Lin 2000). Shibata et al. (1995) and Shibata & Tanuma (2001) extended the CSHKP model by unifying reconnection and plasmoid ejection and emphasized the importance of 1
2 a plasmoid ejection in the reconnection process, which is called the plasmoid-induced-reconnection model. In this model, the bursty reconnection is initiated by the ejection of a plasmoid and leads to the build-up of magnetic energy in the vertical current sheet. When a plasmoid is ejected, the inflow is induced due to the conservation of mass, which results in enhancing the reconnection rate. In consequence, the plasmoid formed above the current sheet can also become accelerated by the faster reconnection outflow. Nishida et al. (2009) performed MHD simulations of the solar flares by changing the values of resistivity and plasmoid velocity and found that the reconnection rate positively correlated with the plasmoid velocity. Therefore, plasmoid ejection plays a key role in the triggering of fast magnetic reconnection and is an observational support for magnetic reconnection in a solar flare. Since plasmoid ejections have been observed in both long-duration events and compact flares (e.g., Shibata et al. 1995), the magnetic reconnection model may be applicable even for compact flares, which often do not show the other typical features of magnetic reconnection, such as particle acceleration or loop-top source. For example, in the soft X-ray image, upwardmoving blobs of hot plasma have often been observed (Shibata et al. 1995; Ohyama & Shibata 1998; Kim et al. 2005), and the white-light coronagraph observations have also recorded rising blob-like features in the wake of CMEs (Ko et al. 2003; Lin et al. 2005). Slowly drifting pulsating structures (DPSs), occasionally observed in the decimetric frequency range, are also interpreted as the signature of upward or downward moving plasmoid (Kliem et al. 2000; Karlický 2004; Karlický & Bárta 2007; Ning et al. 2007). Another important characteristic associated with the eruption are the large-scale coronal disturbances that are often observed. For example, the Extreme-ultraviolet Imaging Telescope (EIT) onboard the Solar and Heliospheric Observatory (SOHO) mission (Thompson et al. 1998) has recorded EIT waves in a number of eruptive events. There has been a long debate on the nature of coronal waves (for more detail see the recent reviews by Warmuth 2010, Chen & Wu 2011). According to the fast-mode coronal magnetohydrodynamical (MHD) wave model, developed by Uchida (1968), EIT waves are thought to be the coronal counterparts of the Hα Moreton waves. However, the speed of a Moreton wave ( km s 1 ) is found to be about three times faster than the typical speed of an EIT wave ( km s 1 ) (Klassen et al. 2000; Thompson & Myers 2009). Therefore, the interpretation of the EIT wave is divided into two categories, i.e., wave versus non-wave models. According to the non-wave scenario, the EIT wave can be explained by the large-scale coronal magnetic restructuring (or field-line stretching) due to the eruption of a CME that causes the observed successive brightenings either through plasma compression, heating, or localized energy release (e.g. Delannée & Aulanier 1999, Chen et al. 2002, Chen et al. 2005, Attrill et al. 2007). On the other hand, some authors have explained the EIT waves in terms of fast-mode MHD waves or shocks (Warmuth et al. 2004; Grechnev et al. 2008; Temmer et al. 2009). Such a wave could be launched and/or driven by flares, CMEs, or smallscale ejecta. Recently, EUV observations from STEREO have made it possible to view the three-dimensional (3D) structure and evolution of EUV waves (Patsourakos et al. 2009; Kienreich et al. 2009; Ma et al. 2009; Temmer et al. 2011), including an event in which a full 3D coronal wave dome structure has been observed (Veronig et al. 2010). The origin of coronal shock waves (usually evident in the form of type II radio bursts) is also under debate. It may be driven by two possible physical mechanisms, (i) a blast wave ignited by the pressure pulse of a flare (Khan & Aurass 2002; Narukage et al. 2002; Hudson et al. 2003; Magdalenić et al. 2012), or (ii) a piston-driven shock generated by a CME (Klassen et al. 1999, 2003; Cho et al. 2011). Coronal shock waves may be associated with solar flares, CMEs, or some combination of these phenomena (Magara et al. 2000; Magdalenić et al. 2008; Vršnak & Cliver 2008). Recent observations from SDO/AIA suggest the EUV shock is formed (in the low corona) ahead of an erupting flux rope, which was correlated with a type II radio burst (Kozarev et al. 2011; Ma et al. 2011; Bain et al. 2012; Gopalswamy et al. 2012). In this paper, we present the unique multiwavelength observations of the plasma blob ejection that was associated with the triggering of an M-class flare. It is interesting to observe the formation of EUV waves associated with a plasma blob eruption. This type of dynamical evolution of the plasma blob ejection and associated EUV waves have been rarely recorded in earlier observations. However, the recent high-sensitivity and cadence images from the SDO and STEREO missions have made it possible to detect and track the plasma blob and associated EUV waves. Observations presented here support the formation of a fast-mode MHD shock associated with the plasma blob ejection. In section 2, we present the multiwavelength observational data sets, and in the last section, we discuss the results. 2. Observations and data sets The active region NOAA was located at S16E31 on 25 March On this day, its magnetic configuration was rather complex (i.e., βγ), which produced several C- and M-class flares. We report the analysis of an M1.0 flare on 25 March 2011 that originated near the edge of the leading sunspot group. According to the GOES soft X-ray profile in the wavelength range of 1-8 Å, the flare started at 23:08 UT, attained the peak intensity at 23:22 UT, and ended around 23:30 UT. However, the important point to be mentioned here is that a plasma blob was formed and its ejection was observed before the onset of the flare AIA observations of the plasma blob The Atmospheric Imaging Assembly (AIA) instrument onboard the Solar Dynamic Observatory (SDO) mission observes the full-disk image of the Sun at a resolution of 1.5 (0.6 pixel 1 ), and its field of view covers up to 1.3 R. In this study, we employ images from AIA 171 Å (Fe IX, T 0.6 MK), 193 Å (Fe XII/XXIV, T 1.2 & 20 MK), 131 Å (Fe VIII/XXI, T 0.4 & 10 MK), 335 Å (Fe XVI, T 2.5 MK), 304 Å (He II, T 0.05 MK) and 1600 Å (C IV, 0.1 MK). Thus, images of these wavelengths cover from chromospheric to coronal heights (Lemen et al. 2011). They are extremely useful for studying the evolutionary aspects of an eruption in different energy bands. Figure 1 displays some of the selected AIA 304 Å images of the formation/eruption of the plasma blob and the associated flare event. These images represent the lower solar atmosphere, i.e., the chromosphere and transition region. In these images, the blob formation was observed at about 22:53 UT, at the site of a fan-shaped emerging group of a small loop system (marked by the arrow). The plasma blob also exhibited a slow upward motion starting from 22:59 UT and became detached from the active region at 23:08 UT. Moreover, at the time of blob separation, the flare brightening started at the site of the blob formation, indicating an increasing reconnection rate. The length and width of the blob are 70 and 30, respectively. The ejection of the plasma blob seems to trigger/enhance the reconnection pro- 2
3 cesses. The impulsive phase of the flare was recorded at 23:14 UT, when the blob reached a distance of 0.21 R from the flare center. The blob disappeared at 23:18 UT and the flare continued to be intensified and peaked at the site of the blob eruption. The AIA movie taken at 304 Å shows the formation of three ribbon-like structures. The first ribbon was formed during the slow rising phase of the blob, the second ribbon when the blob started to accelerate. The third ribbon was formed in the southward direction. These ribbons are indicated by R1, R2 and R3 in the image taken at 23:11:08 UT (Figure 1). Figure 2 displays the selected AIA 131 Å EUV basedifference images of the AR site of the plasma blob eruption. This wavelength is sensitive to cool and hot plasma of 0.4 MK and 10 MK (flaring region). These images show the full episode of the plasma blob formation and its eruption as shown in the AIA 304 Å images (Figure 1). We were able to measure the position of the leading edge of the blob from the flare center (the measurement direction is indicated by the red dotted line). We visually tracked the structure at the leading edge of the blob in these base-difference images. The height-time plot of the blob in the sky plane is shown in the middle panel of Figure 3. The top panel shows the profile of GOES soft-x-ray flux, measured in the 1-8 Å channel. To understand the relation between the blob dynamics in producing the non-thermal emission, the hard X-ray flux profile in the energy range of kev is also shown in the same panel. The hard X-ray flux profile is obtained from the Fermi Gamma-ray Burst Monitor (GBM) (Meegan et al. 2009). The height-time profile reveals the blob that moves in a parabolic path and the soft X-ray flare seems to start with the acceleration of the plasma blob at 23:08 UT. The hard X-ray emission peaks at 23:14 UT and continues till 23:16 UT, after the acceleration phase of the blob. There is a delay of 8 min between the peak of hard X-ray emission and the start time of the blob acceleration. This indicates that most of the nonthermal particles are accelerated after the plasma blob acceleration phase. The bottom panel shows the temporal evolution of the blob speed during its eruption, which is computed from the height-time measurements using a numerical differentiation with three-point Lagrangian interpolation (Zhang et al. 2004). Initially, it shows a slow rise-up with a speed of 10 km s 1 and attains the maximum speed of 540 km s 1 during its acceleration phase. However, the average speed of the blob is 300 km s 1. The movie from AIA 131 Å shows about three counterclockwise rotations in the blob structure during its eruption, which is probably related to the three peaks in the speed profile. During the upward motion, the orientation of the blob changes and is reflected in the speed profile as an increase and decrease in the speed. Very likely the changes in orientation and resulting projection have caused speed variations. We also plot the mean counts of the AIA 1600 Å images during the blob eruption, which correspond to the emission from the photospheric (5000 K) and transition regions (10000 K). The EUV flux slowly rises at 23:09 UT and its peak time matches the hard X-ray profile. This suggests that the hard X-ray emission comes from the footpoint sources, which are usually cospatial with flare ribbons. Thus, the above data sets reveal the kinematic evolution of the plasma blob, its association with the flare, and hard X-ray emission. Moreover, to investigate the source region of the blob, we checked AIA images before and after the M-class flare. Figure 4 displays selected snapshots of the AIA 304 and 335 Å, which provide chromospheric and coronal views of the blob formation site. The emerging anemone-type loops start to grow in size continuously from 09:00 UT onward on 25 March The top panel shows the AIA images before the flare at 22:40 UT. We observe several arch filaments in the emerging fan, in which one arch filament (indicated by arrows) is evident prior to the blob-eruption. The middle panel shows the plasma blob formation most likely above the arch filament, which is visible in AIA hot and cool channels. The bottom panels display the postflare loops and the weakening of the emerging fan at the blob eruption site after the flare. In the middle panel, the AIA 304 Å image is overlaid with the HMI magnetogram contours. The color codes white and black show positive and negative magnetic polarity regions, respectively. The originating location of the blob is near the small-satellite sunspot of the negative polarity region. The essential point to consider is that the blob originates from the lower solar atmosphere (i.e., chromosphere), which is clearly shown in 304 Å image Evolution of magnetic fields The time sequence of the HMI magnetograms were analyzed to see the evolution of the magnetic field before and after the flare. The HMI has been designed to study the oscillations and the magnetic field at the solar surface or photosphere (Schou et al. 2012; Scherrer et al. 2012). It observes the full disk of the Sun ( pixels) at 6173 Å with a resolution of 1 (0.5 pixel 1 ) and a typical cadence of 45 s. Figure 5 displays some of the selected HMI magnetograms of 25 March The evolution of magnetic field at the blob formation site shows a significant amount of flux emergence. This started at 4 UT on 25 March 2011, which was nearly 19 hours before the flare occurrence. These magnetograms also show the emergence of negative flux toward the north of the main positive polarity sunspot P (shown within the ellipse indicated by N at 6:00 UT). Additionally, a small bipole emerged, indicated by P1 and N1 at 18:00 UT. To show the temporal evolution of the emerging flux, we estimated the positive, unsigned negative and total unsigned magnetic fluxes (in Mx) for the field of view shown in Figure 5. These quantities are plotted in the bottom-left panel of Figure 5. It clearly shows the flux emergence at the northern side of the big positive polarity spot. As revealed by the magnetic-flux profile, the negative flux emergence was rapid after about 5:00 UT and continued till 20:00 UT. Thus, the negative flux increased from to Mx ( 75%). However, the positive flux increase was lower by 15% than that of the negative flux. In addition, the HMI movie shows the motion of the big positive sunspot (P) toward the west, whereas the emerged negative field region moved toward the east. Therefore, the rapidly emerging/moving fields, particularly negative fields, seem to play the main role in the energy build-up at the site of blob formation and its subsequent eruption that leads to the M-class flare. It is evident that the main emerging fluxes are N1 and P1, but if we carefully look into the footpoint polarities of the emerged fan shaped loop system/arch filaments, we see the connectivity of the emerged negative fields with the ambient positive field region on both the sides (north and south of the negative field) (refer to Figure 4). Moreover, the initial phase of the blob eruption reveals two ribbons R1 and R2 in the AIA 1600/304 Å images, and later we see mainly R2 and R3 during the impulsive phase of the flare (in the hard X-ray flux). The polarities of the ribbons R1, R2 and R3 are positive, negative (N1), and positive (P1), respectively. In addition, at R1 we observe only a weak positive flux region, which does not show changes with time. Therefore, the main emerging fluxes are located at R2 and R3. 3
4 2.3. AIA observations of coronal EUV waves The images observed with AIA at 193, 335 and 171 Å are useful for investigating the coronal EUV disturbance/wave associated with the blob eruption. The top panels in Figure 6 show the AIA 193 Å intensity image (left) and the HMI magnetogram (right). It is evident that the blob is formed at the leading edge of AR NOAA and moves in the northeast direction in a parabolic path. As depicted by the magnetogram, the nearby AR is also located to the north of AR 11176, and the EUV image shows the location of a coronal hole (CH) close to AR We display these images to show the typical magnetic environment around the blob eruption site and its propagation path. To show more details of the blob eruption site, in Figure 6 some of the selected median filtered running difference images obtained from AIA at 193 Å are shown. The running difference image at 23:13:55 UT (middle panel) shows the flare site and erupted plasma blob (indicated by arrows). The flare occurred during the impulsive acceleration phase of the blob and an EUV wave/shock was formed in front of the blob (indicated by arrows). We see a clear expanding wavefront associated with the blob eruption at 23:15:31 UT. The shock was formed at a distance of 0.23 R away from the flare center. The accelerating blob seems to be the driver for the generation of the shock in the corona. The shock-wave front expands and moves up as the plasma blob propagates away from the flare site. However, after about 23:18 UT, the blob disappeared. The expansion of the blob very likely tends to decrease the associated density and the blob could not be observed in good contrast. However, the circular wavefront moved toward AR NOAA and was compressed and deflected at its boundary (AIA images at 23:18:19 UT). Additionally, the CH, located nearby AR 11177, seems to further deflect the path of the wavefront. Thus the locations of AR and the CH affect the wave propagation in the west and east of the CH (refer to image at 23:19:07 UT). Figure 7 shows the selected running-difference images at AIA 335 and 171 Å to show the formation/propagation of EUV waves in these channels. We have noticed some interesting and novel features in these channels. (i) The top panels show the formation of a thick wavefront (indicated by S ) ahead of the plasma blob that moves in a northeast direction. Another wavefront (marked by F ) seems to be deflected from AR and the CH boundary similar to that observed in AIA 193 Å (see AIA running-difference composite movie). Therefore, two wavefronts ( F and S ) are observed in AIA 335 Å running-difference image at 23:17:39 UT. The thick wavefront S seems to be the slower and stopped at the boundary of another AR, whereas wavefront F was deflected at both sides (east and west) of the AR (ii) The middle and bottom panels display the formation of EUV waves in AIA 171 Å. Surprisingly, some of the wave features are observed only in the AIA 171 Å channel, not in other AIA channels. There is a clear wave signal that appears to be transmitted (indicated by T ) across the AR (from the funnel-shaped loops) during 23:18-23:21 UT. Before and after the passage from the AR, the wave signal in running difference images turns from dark to bright at the leading edge, indicating a switch from emission reduction to enhancement at the wavefront. In other EUV channels, the wave seems to be deflected from the AR, and turned to the east and west of it. (iii) Another remarkable feature is observed at 23:18 UT, when the erupting blob impacted the funnel-shaped loops emanating from the trailing (eastern) polarity of this AR. These loops become a new epicenter and emitted a thick wavefront marked by F1 that moved in a northeast direction. This is most likely a secondary wave train. At 23:21:12 UT, another wave pulse was observed to be ejected from the same funnel-shaped loops (marked by F2 ) behind F1. Obviously, the funnel-shaped loops are the sources of the secondary waves that move in the northeast direction. To compare the spatial location of the wavefronts, we overplot the position of slower wavefront ( S ) observed in the 335 Å channel (at 23:20:03 UT) at the top of the AIA 171 Å image (23:20:00 UT). The bottom-left panel clearly shows that the slower component (marked by + symbol) was separated from the fast components observed in the AIA 193 and 171 Å channels. To show the kinematic evolution of the plasma blob and formation of the EUV wave, we created space-time plots using the AIA 171, 193, and 335 Å running difference images. The slices used for the space-time plots are shown in the top-right panel of Figure 7 marked by S1 to S5. We used the straight slices to obtain the stack plots to estimate the speed. We measured the plane-of-sky velocities of the EUV wavefronts, which are lower limits of the wave velocities in real 3D space. In Figure 8, we display the stack plots obtained for slices S1, S2, and S3 using the AIA 171, 193, and 335 Å running-difference images. The first panel shows the stack plot along slice S1 for 171, 193, and 335 Å. The fast wave ( F ) was observed in all three channels. From the linear fit to the data points, the mean speed of the wave was 912±33 km s 1. The error in the position measurement was assumed to be four pixels (i.e., 2.4 ). In the second panel, the stack plot shows the transmitted wave (through AR 11177) observed only in the 171 Å channel at 23:18 UT. The speed of the transmitted wave ( T ) was 1245±28 km s 1, which is faster than the speed of the primary wave. The stack plot along slice S3 shows the slowly rising plasma blob in a parabolic path (indicated by the arrow) during 23:00-23:18 UT. The onset of the EUV wave was observed in front of the plasma blob at 23:12-23:13 UT, which is indicated by a vertical line. Additionally, the coronal dimming was also observed behind the moving plasma blob. The apparent dimming in the running-difference images could indicate a recovery to the preevent level of the emission after the passage of a bright wave front. To confirm the true dimming signatures, we also investigated the base-difference images. We observed clear dimming signatures behind the slow wavefront S. However, the apparent dimming behind the plasma blob and fast wavefronts in the running-difference images is mainly due to a recovery to the preevent level of the emission. The impulsive phase of the flare is evident at 23:13-23:14 UT. In Figure 9, the bottom panel of slice S4, we track the wavefront ( S ) ahead of the plasma blob (335 Å). The wavefront propagates with a speed of 341±11 km s 1 during 23:13 23:18 UT and finally it seems to be stopped at the boundary of another AR. The AIA 171 Å stack plot shows the two fast wavefronts F1 and F2 (at 23:18 and 23:21 UT, respectively), which propagate beyond the limb across the existing AR. The speeds of F1 and F2 are 1173±15 and 1211±17 km s 1, respectively. These two wavefronts originate from the funnel-shaped loops. The initial path of these wavefronts is shown in the slice S5. The typical speed of these wavefronts are 1296±25 and 1011±32 km s 1, respectively. The comparison of the wavefronts in AIA 335 and 193 Å reveals two main wavefronts, moving with different speeds in different directions. The faster wavefront (indicated by F ) is observed clearly in AIA 193 Å images, whereas the slower one 4
5 is observed in the AIA 335 Å images. Both wavefronts initially originate at the front of the plasma blob. However, it is observed that initially the faster wavefront is generated by the blob during its impulsive acceleration phase, later the faster wavefront arrives at the boundary of the other AR and then is deflected toward the west from the CH site. The AIA 335 Å running difference movie and space-time plot clearly show the plasma blob running behind the slower wavefront till 23:18 UT. On the other hand, the transmitted wavefront ( T ) and wave trains ( F1 and F2 ) observed in 171 Å originate from the funnel-shaped loops. These wavefronts may be interpreted as secondary waves generated by the impact of the primary fast wave and the plasma blob. Using AIA 171 Å observations, Liu et al. (2011) observed the quasi-periodic fast-wave trains (phase speed 2200 ±130 km s 1, period 3 minute) that emanate near the flare kernel and propagate outward along a funnel of coronal loops. These fastwave trains temporally coincided with quasi-periodic pulsations of the flare (hard X-ray flux), suggesting a common origin. Liu and collaborators concluded that these are fast-mode magnetosonic waves that are excited by quasi-periodic magnetic reconnection and energy release. Recently, Liu et al. (2012) reported quasi-periodic fast wave trains (period 2 minute) both ahead (within the broad global EUV wave pulse) and behind the expanding CME bubble. In our observation, the quasi-periodic wavefronts ( F1 and F2 ) are observed (i) away from the flare site, i.e., not originating exactly from the flare energy release site, as observed in Liu et al. (2011), (ii) and F1 appeared exactly at the same time (at 23:18 UT) as the plasma blob impacted the funnel-shaped loops (moving in the northeast direction). For more details, we refer to AIA running difference multi-panel movie. However, the period of the wave trains in our observation is 3 minute, and the waves move across the AR, beyond the eastern limb, suggesting a true wave nature. Therefore, these waves may be interpreted as the fast magnetoacoustic waves. But in our case, their origin seems to be different from the site reported in Liu et al. (2011) (i.e., plasma blob). As suggested in the numerical simulation by Ofman et al. (2011), the quasi-periodic-wave trains are driven by motions at lower coronal boundary that propagate outward in a magnetic funnel and are evident through density fluctuations caused by the compressibility. The waves are best observed in 171 Å, which is associated with the cool coronal temperature of 0.6 MK, which results in stronger gravitational stratification of the density compared to hotter ARs, leading to the faster magnetosonic speed that depends on density in low-β plasma (Ofman et al. 2011) Plasma blob and EUV waves observed by STEREO We used STEREO (Solar TErrestrial RElations Observatory, Kaiser et al. 2008) observations at 195 Å to investigate the coronal EUV wave associated with the eruption of the plasma blob. In the STEREO-B view of the Sun on 25 March 2011, the active region was located close to the solar western limb. Figure 10 displays running-difference EUV images taken at 195 Å of the eruption site as seen in the STEREO-B view. These images have a typical cadence of 5 min and a spatial resolution of 1.6 pixel 1. The top-left image recorded at 23:05 UT shows the plasma blob close to the west limb of the Sun. This then moves up in a parabolic path, as observed in the AIA images. The shock formation can be also seen in the bottom-right image at 23:15:30 UT. The structure is like a bow-shock formed in front of the blob. The faster shock front ( F ) is indicated by arrows. The next image at 23:18 UT shows the formation of a bright wavefront that moves toward the east. This is the slower wavefront as observed in AIA 335 Å (indicated by S ) running ahead of the plasma blob. A comparison between AIA and STEREO running difference images confirms the shock formation ahead of the blob. The eastward deflection of the shock wave, observed as the bright front, is clearly visible in the images at 23:18 and 23:20 UT and is consistent with the findings obtained from the AIA images. However, we were unable to see the westward-propagating wavefront in the STEREO images, probably because of the limb side projection. From these images, we also measured the propagation of the leading edge of the blob in the sky plane (from the flare center, indicated by red dotted line) as a function of time (shown in Figure 11) along with the GOES soft X-ray flux profile in 1-8 Å (top panel). The soft X-ray flare started at 23:08 UT, when the blob reached a projected height of km away from the flare center. The soft X-ray flux enhanced with the acceleration of blob. The blob disappeared at 0.35 R from the center of the flare (AIA running-difference images). A secondorder polynomial fit to these measurements yields the relationship h=( )t 2 +(4.1)t+0.2, where h is the height (in km) and t is the time (in sec) from 23:03 UT. This suggests the motion of the blob in a typical parabolic path. The middle panel shows the blob speed profile derived from the height-time measurements using a three-point Lagrangian interpolation method. The blob slowly rises with an initial speed of 70 km s 1 and accelerates to a maximum speed of 345 km s 1. Another important point to note is that we observe no deceleration here as seen in AIA images, probably because of the limitation of the low-cadence STEREO images Type II radio-burst and CME The top panel of Figure 12 shows the radio dynamic spectrum from the Learmonth observatory, Australia, in the frequency range of MHz. The GOES soft X-ray flux in the wavelength band of 1-8 Å is also included in the plot. This radio spectrum shows a narrow type III radio burst at 23:14-23:15 UT during the impulsive phase of the flare, which suggests a narrow acceleration region along the opening of field lines. A fast-drifting type II radio burst observed in the frequency range of MHz, near the flare maximum between 23:16 and 23:25 UT, nicely matches the timing and location of the shock formation ahead of the blob as observed in the AIA images. We estimated the speed of the type II radio burst source using its frequency-drift rate and compared it with the speed of the EUV wave observed in the corona. The bottom panel shows the height of the type II radio burst (using the fundamental band) in the corona. The shock height (speed also) depends on the choice of the coronal density model. Therefore, we used Newkirk one-fold and two-fold density models (Newkirk & Altschuler 1970) to estimate the source height. First of all, we converted the plasma frequency of the type II burst into the corresponding electron density (f p =9 N e MHz with the electron density N e in m 3 ). Then, using the Newkirk coronal electron density models, we obtained the corresponding source heights (i.e., heliocentric distances). The shock heights derived from the Newkirk one-fold (circle) and two-fold (triangle) density models are plotted in the bottom panel of Figure 12. The distance-time profile of the faster coronal wave is also included ( + symbol, blue color) for comparison. Using a linear fit to the height-time data points, we calculated the shock speed. The mean speed of the shock wave 5
6 obtained from the Newkirk one-fold and two-fold density models is 660 and 820 km s 1. The speed of the faster coronal wave in AIA 193 Å is km s 1. These speeds almost agree with each other. The results (height and speed) from the Newkirk two-fold density model fit the observed wave kinematics well. Moreover, the formation time of the shock wave agrees with these measurements and is consistent with the formation signature of the coronal shock at the leading edge of the blob. In general, EUV waves have been observed to interact with coronal structures during their propagation (Thompson et al. 1998, 1999; Wills-Davey & Thompson 1999; Veronig et al. 2006). Thompson et al. (1999) reported EUV waves that were stopped by coronal holes. Furthermore, the above result also was demonstrated by numerical simulations (Wang 2000; Wu et al. 2001). The slowing-down of the EUV wave by an AR was also reported by Ofman & Thompson (2002). In addition, these authors found strong reflection and refraction of the primary wave from an AR, as well as the generation of secondary waves by the dynamic distortion of the AR magnetic field. In the present study, the high cadence of the AIA images provides the opportunity to track the shock wave and study the deflection of the fastmode shock wave in the vicinity of the high Alfvén-speed region as well as reflection in the region of the steep gradient of the Alfvén speed (Uchida et al. 1973; Uchida 1974; Wu et al. 2001; Zhang et al. 2011). We observed the transmission of the wave through AR observed in AIA 171 Å. Additionally, we observed the fast secondary wave trains probably generated by the impact of the plasma blob on the funnel-shaped loops. Using STEREO observations, Gopalswamy et al. (2009) reported the strong reflection of the EUV wave by the boundary of a CH, which suggested that the nature of the EUV wave is a fast-mode MHD wave. In the present study, the type II radio burst during the EUV wave formation is consistent with the fast-mode MHD wave possibly driven by the ejection of the plasmoid. In the analysis of the type II radio burst, the Newkirk onefold and two-fold density models were used to estimate the shock height with respect to the center of the Sun (i.e., in heliocentric distance units), whereas for the EUV images we measured the projected shock height from the center of the flare site. We considered the same reference point for the coronal shock observed in radio and the wave seen in EUV as well as their overlapping time and confirm the detection of the fast-mode MHD wave in the EUV measurements. For example, recently Gopalswamy et al. (2012) found the shock formation in EUV images in a limb event that coincided with the onset of a type II radio burst. Moreover, the estimated height of the type II source matched the formation height of the EUV wave in the AIA 193 Å images well. In their study, the fundamental band formed at a frequency of 150 MHz, which implied a local plasma density of cm 3, which was consistent with the shock formation close to the solar surface (0.19 R above the surface, or 1.19 R from the Sun center). In this study, we observed the fundamental emission at 100 MHz, which corresponds to a source height of R using different density models (from the Sun center, Figure 12). The projected height of the shock formation as observed in EUV images is 0.23 R above the surface of the Sun. Therefore, the present estimate of shock formation heights in radio and EUV are consistent with the results from Gopalswamy et al. (2012). Additionally, the plasma blob follows a parabolic path during its propagation. The shock formed in front of the blob also propagates obliquely near another AR and CH at the north (i.e., it is deflected by the existing active region and CH). No CME was recorded by SOHO/LASCO associated with the plasma blob eruption. In Figure 13, the top panels display the 195 Å EUV images from STEREO A and B. In the first two images (at 23:20 UT), a tip of the EUV ray is marked with a + symbol. The coronal ray initially seems to be stretched upward and then some of its threads showed southward deflection (at 23:40 UT) during the passage of the reflected EUV wave from the AR (see the STEREO movies). In addition, bunches of loop/thread, located south of the EUV ray, are also deflected southward, and showed transverse oscillation. Transverse loop oscillations are usually observed during the passage of the shock through the coronal structures (Patsourakos & Vourlidas 2012; Kumar et al. 2012b). This confirms the passage of the shock through the coronal structures, which leads to the onset of oscillations. The bottom panels display the composite STEREO EUVI and COR1 running-difference images. The first panel (at 23:20 UT) shows a bright streamer (marked by the arrow) above the eruption site. In the next three panels, we observe the passage of a weak CME and associated disturbance through the streamer in the southward direction (the front is marked by F ). The COR1 movie shows the heating and deflection of the streamer (which persists for 1-2 hours) possibly because of the passage of the disturbance/shock through it in the southward direction. As we observed the reflection of the fast wave in the AIA images from AR 11177, it is possible that the passage of the reflected fast EUV wave causes the deflection in the EUV ray in the southward direction and the associated heating/deflection of the streamer. Moreover, we observed the spectral bump in the type II radio burst structure that may be interpreted as the interaction between the shock and streamer. The timings of the type II radio burst bump and the shock-streamer interaction observed in the COR1 images closely match. A similar kind of spectral bump was recently reported by Feng et al. (2012), who provided a schematic cartoon (see Figure 5 of their paper) for the magnetic topology of the streamer structure, the outward propagation of the coronal shock wave, and the location where the type II spectral bump took place during the shock-streamer interaction. The same scenario as for the type II bump was suggested by Kong et al. (2012) for the 27 March 2011 eruption that occurred in the same AR, that we studied here on 25 March Therefore, the above observational findings support our interpretation of the shockstreamer interaction, which leads to the bump in the type II radio burst. 3. Results and discussion We presented a multiwavelength analysis of a plasma blob ejection associated with an M-class flare and EUV waves on 25 March This event shows observational evidence of the formation of a plasma blob and its ejection followed by an intense flare. The blob formation was observed 9 min prior to the flare onset. Initially, the blob slowly rises with a mean speed of 70 km s 1 and attains a maximum speed of 540 km s 1. It also shows untwisting motion during the eruption/propagation and both acceleration and deceleration patterns in the low corona. The plasma blob shows impulsive acceleration just before the onset of the flare impulsive phase. The arch filaments are usually observed in the new emerging flux region (EFR) in chromospheric Hα images (Chou & Zirin 1988). This filamentary structure arises spontaneously from the magnetic Rayleigh-Taylor instability (Isobe et al. 2005, 2007). The ends of an arch filament are anchored to the opposite polarities of EFR. In the EUV, the Ω-shaped emerged loops are 6
7 generally observed in the corona above the EFR. In the present study, the HMI observations clearly show the newly emerging flux at the blob formation site and AIA images reveal expanding emerged anemone-shaped loops/arch filaments. The plasma blob is formed just above the arch filament, which strongly supports the scenario that the emerging flux plays an important role in the formation of the blob. The flare was initiated by the eruption of the blob. Sakajiri et al. (2004) also found a tiny two-ribbon flare driven by the emerging flux that accompanied the miniature filament eruption (equivalent to plasmoid). In our analysis, we obtained much clearer observational evidence of the flux emergence and the associated plasma blob formation/ejection. The plasma blob was observed mostly in all coronal EUV channels (hot and cold), which reveals its multi-thermal nature. Shibata (1998) showed the ejection of soft-x-ray reconnection jets (T 1-10 MK) above the anemone-shaped emerging loops, which have speeds of the order of the Alfvén speed ( 1000 km s 1 ). The collimated plasma ejections along the fan-spine topology (Antiochos 1998; Pariat et al. 2010) are usually interpreted as jets/surges generated by low-altitude reconnection. On the other hand, the ejection of a detached hot plasma is interpreted as a plasmoid/blob (Shibata 1998). As discussed by Shibata (1998), the plasmoid ejection could play an important role in triggering the main energy release during the impulsive phase. During the pre-flare phase, Ohyama & Shibata (1998) found that the plasmoid ejection started ( 10 km s 1 ) well before the impulsive phase. However, in Shibata et al. (1995), the plasmoid is the top portion of an erupting (twisted) flux-rope or filament. In our case, the initial morphology looks like a jet with unwinding twists, because of its multiple bright strands elongated along the direction of motion (Shimojo et al. 1996; Patsourakos et al. 2008). In contrast, it lacks the shape of the closed flux-rope/loop with both ends anchored on the solar surface. Its eruption direction is closely aligned with the nearby coronal loops, as expected for a jet erupting along the magnetic field lines. Moreover, it is known that (helical) surges/jets often occur in the emerging flux region and are often associated with flares/cmes (e.g., Shibata & Uchida 1986). Therefore, the eruption studied here may be interpreted as a jet rather than a plasmoid. The plasma blob acceleration starts with the slow rising of soft-x-ray flux (brightening below the blob, formation of ribbons R1 and R2 ), which is probably associated with the tether-cutting reconnection usually seen below the filaments in the initial phase of eruptions (Moore et al. 2001; Sterling & Moore 2004). After the ejection of the blob, the reconnection rate seems to be enhanced in the current-sheet presumably formed below it, along the fan-spine topology, leading to the abrupt release of magnetic energy and acceleration of the charged particles along the footpoints, forming ribbons R2 and R3. The EUV images of our study also show the formation of coronal shock wave at the front/leading edge of the plasma blob during its impulsive acceleration phase. Additionally, a metric type II radio burst is observed during the formation of EUV shock in the corona. The speeds of the EUV shock wave and the type II radio burst source are comparable. This provides evidence of shock formation in front of the plasma blob. In the model of solar eruptive flares with the plasmoid ejection (Yokoyama & Shibata 2001), the current sheet is formed below the ejected plasmoid. As the reconnection progresses, the plasmoid is simultaneously pushed upward by the plasma reconnection outflows. In a uniform medium, the plasmoid would need to have super-alfvénic speed to generate a fast-mode shock at its leading edge. However, for a non-uniform medium, the shock can be formed from an ordinary simple wave and steepen into a shock wave, if there is continuous energy supply (Vršnak & Cliver 2008). For example, when a CME is suddenly accelerated, it can lead to a simple wave of small-scale sizes (Chen 2011). Additionally, in the numerical simulation of Chen & Shibata (2000), it is shown that a plasmoid with a speed of 300 km s 1 in the corona, generates the shock above it. Moreover, Klein et al. (1999) suggested that the origin of the type II burst is closely related to the dynamics of the X-ray plasma blob moving with a speed of 770 km s 1. In the present study, the fastest sky-plane speed of the plasma blob is 540 km s 1, which may be sufficient to generate a shock in the corona. We observed both the faster ( 912 km s 1 ) and the slower ( 341 km s 1 ) wavefronts formed in front of the moving plasma blob. Initially, both wavefronts are cospatial and later the faster wavefront arrives at the boundary of another AR, is reflected by the AR 11177/CH boundary, and moves toward the west. The slower wavefront moves in a northeast direction, which has been revealed by the AIA 335 and STEREO 195 Å images. The faster wavefront is the coronal Moreton wave as predicted in the numerical simulation of Chen et al. (2002, 2005), which was recently confirmed from the AIA observations (Chen & Wu 2011; Kumar et al. 2012b). Moreover, the speed and timing of the faster wave matches the type II radio burst. Therefore, the coronal Moreton wave (i.e., the fast MHD wave) is the source of the type II radio burst. The faster wavefront is possibly triggered by the impulsive acceleration of the blob, and later this wavefront propagates freely, because the plasma blob has been observed to run behind the slower wavefront in AIA 335 Å and STEREO till 23:18 UT. There may be different possibilities to observe the slower wavefront. (i) This may be the signature of the same shock (fast) propagating in the low corona, (i.e., anisotropy of the wave propagation/different local fast-mode speeds). But it seems to be stopped at the boundary of another AR and does not propagate further across it. This is in contrast to its wave nature. (ii) This may be the slower EUV wave, running behind the faster MHD shock wave, as predicted from 2D and 3D simulations (Chen et al. 2005; Cohen et al. 2009; Downs et al. 2011, 2012), which was recently confirmed by Chen & Wu (2011) and Kumar et al. (2012b). The slower EUV wave is found to be cospatial with the CME leg because of the field line stretching. However, initially the slower component is probably merged with the faster component, and when the direction of the plasma blob changes to a northeast direction, it decouples (running in front of the blob). In the numerical simulation, the radial expansion speed of the shock is generally about three times the lateral expansion speed, i.e., the speed of the coronal Moreton wave is about three times the speed of the EIT wave (Chen et al. 2005), which is consistent with our observations. The lateral expansion of the CME leg may be analogous to the blob propagation in the low corona. Therefore, the slower wavefront indicates stronger heating in the northeast direction caused by the plasma blob impact/compression, which is responsible for the bright emissions observed in the AIA 335 and STEREO 195 Å channels. Furthermore, we observed the transmitted EUV wave (171 Å) from the funnel-shaped loops of another AR. We also found the emergence of two fast EUV waves/ripples ( F1 and F2 ) from the funnel-shaped loops originating from the trailing (eastern) polarity of the flaring AR, possibly generated by the impact of the primary wave. These two wavefronts move in a northeast direction (limb side) across the existing AR that shows the signatures of fast MHD waves. Recently, Olmedo et al. (2012) reported the reflection/refraction of the EUV wave from the CH 7
8 that was associated with the X2.2 flare on 15 February They found for the first time the transmission of part of the primary wave through the CH. In the 07 June 2011 eruption, Li et al. (2012) observed a 3D dome-shaped EUV wave and found the apparent disappearance of the primary EUV wave upon arrival at an AR on its path. A secondary wave rapidly re-emerged within the AR boundary at the same speed. Moreover, they also observed the reflection of some part of the primary EUV wave. Most importantly, though, they observed the secondary wave in four EUV channels, i.e., AIA 193, 211, 171, and 335 Å. However, in our case, we observed the secondary EUV waves only in the 171 Å channel that originates from the funnel-shaped loops, with the speed faster than about 20-30% the primary wave speed. The speed of the driver is always slower than the speed of the generated shock in the case of piston-driven shocks, which is the reason why we see the clear shock signature. Veronig et al. (2008) studied an eruption and found the filament speed to be faster than the speed of the EUV wave, they proposed that the filament might not be the possible driver of the shock wave. They suggested that the propagating perturbation (disturbance) was powered only temporarily by a source region expansion, which could be generated by the flare-related pressure pulse, by small-scale flare ejecta, or by the CME expanding flanks (which propagate laterally only over a limited distance). Additionally, if the CME speed approaches that of the associated EUV wave, the wave signatures are very likely merged with the associated phenomena of the CME. When the CME propagates much slower than the EUV wave, the wave signatures would show well (Zheng et al. 2011). Patsourakos & Vourlidas (2012) also mentioned that the EUV wave was decoupled from the CME once the CME was sufficiently decelerated. Our observational findings are consistent with the numerical simulation results of Chen et al. (2002). In their numerical simulation, the speed of the generated shock (in front of the flux-rope) is about 2-3 times faster than the speed of the piston (P.F. Chen 2012, private communication). The present event most likely belongs to the small-scale ejection, i.e., the plasma blob ejection. Moreover, in our case, the blob speed is slower than the speed of the EUV shock wave, and additionally, the shock is formed exactly in front of the blob and moves in the same direction. Furthermore, we estimated the kinetic energy of the plasma blob from the calculated mass and speed. We assumed a cylindrical shape of the blob with the volume V b =π(d/2) 2 L, where d and L are the diameter and length of the cylindrical plasma blob. The length and width of the blob are 70 and 30 (AIA 131 Å image at 23:10:09 UT in Figure 2). The mass of the blob can be estimated by m b =V b ρ. We adopted an average electron density n e = cm 3, and ρ n e m p = g cm 3. Thus, the approximate mass of the blob is m b = g. We took the average and maximum speed of the blob v b 300 to 540 km s 1 from the observation. We estimated the kinetic energy of the blob by K.E.=m b v b 2 /2, which is ergs to ergs. Using TRACE and AIA observations, the estimated energy of the global fast EUV wave (in other events) is about ergs and ergs according to the properties of the kink oscillation of the coronal loop and cavity (Nakariakov et al. 1999; Liu et al. 2012). Therefore, from the estimated energy, it seems that the plasma blob has sufficient energy to trigger the EUV wave. It is widely accepted that EUV waves are strongly associated with CMEs (Cliver et al. 2005). Without a CME, even M- and X-class flares cannot generate an EUV wave (Chen 2006). Recently, Zheng et al. (2012a) observed four EUV waves associated with surge activities and suggested that the continuous emergence and cancellation of magnetic flux in the EFR could supply sufficient energy to trigger the surge and associated EUV waves. They suggested that the surges could also generate an initially driven disturbance, which continued to propagate freely after the surge stopped and fell back. Moreover, plasma jets can also generate EUV waves in a similar way as the CMEs drive (Vršnak & Cliver 2008; Zhukov 2011). EUV waves associated with the minifilament/jet eruptions have recently been reported (Zheng et al. 2011, 2012b), which were interpreted as fast-mode MHD waves. In Zheng et al. (2011), the EUV wave propagates at a uniform velocity of km s 1 with very little angular dependence. Zheng et al. (2012b) observed the speed of the EUV wave from 1100 to 550 km s 1 and discussed that the EUV was presumably driven by the rapid expansion of the CME loops, observed in STEREO/COR1. However, they did not observe multiple EUV waves in different EUV channels. Our observations clearly show the flux emergence and formation of the EUV waves in front of the plasma blob. However, the peak time of the flare is very close to the wave initiation, but the initial location of the wave was far away from the associated flare site, i.e., in front of the plasma blob. The impulsive acceleration of the blob may be sufficient to trigger the EUV wave. From our observation, the acceleration phase duration of the blob is about 12 minutes and the shock formation distance is 0.23 R (from the flare center). However, the shock formation time is comparable with the time predicted in the numerical simulation of the piston-driven shock (for 500 km s 1 Alfvén speed, 100 Mm piston size) by Žic et al. (2008), whereas the shock formation distance is shorter than the predicted value. On the other hand, it is interesting to note that the small-scale plasma blob ejected in a collimated (slightly curved) path can cause a largescale global EUV wave propagating in a wide angular range across the solar surface. For a piston-driven shock, the shock is strongest and fastest in the forward direction of the piston and has a narrow angular extent around it. In this event, the highest wave speed of 912 km s 1 is in the northwest direction seen in AIA 193 Å channel, while the plasma blob is ejected toward the northeast, where the slower wave ( 341 km s 1 ) is observed. This seems inconsistent with the piston-driven shock scenario. It is more likely if a coronal volume greater than the observed plasma blob is acting as the actual piston. This expanding volume was not clearly detected in the available AIA channels and the observed plasma blob may be only a small portion of it. It is also possible that the plasma blob ejection is the initial trigger that destabilizes the surrounding coronal volume and leads to its eruption as the weak CME, which may be the actual driver of the EUV/shock wave. Indeed, COR1 observations show a weak CME structure associated with the blob eruption. The CME disappeared in the low corona (i.e., in COR1 field of view) and could not propagate further into the SOHO/LASCO and COR2 field of view. In conclusion, we presented a multiwavelength study of the ejection of a plasma blob associated with an M-class flare and the observations of EUV waves (i.e., fast and slow waves, transmitted and secondary waves). These observations revealed the multi-thermal nature of EUV wavefronts, which are observed in different EUV channels. The nature of the EUV waves is not well explored and other explanations are possible. However, more observations and analyses of these eruptive events using highresolution data from SDO, STEREO, and Hinode can provide 8
9 a better understanding of the energy build-up/release processes and the nature/driver of EUV waves. Acknowledgements. We express our gratitude to the referee for his/her valuable suggestions and help in the proper interpretation of the observations, which improved the manuscript considerably. SDO is a mission for NASA s Living With a Star (LWS) program. RHESSI is a NASA Small Explorer. We acknowledge the STEREO mission, Fermi GBM, and the Learmonth dynamic radio spectrum data used in this study. PK thanks P.F. Chen for several helpful discussions. This work is partially supported by the CAWSES-India Program, which is sponsored by ISRO. References Antiochos, S. K. 1998, ApJ, 502, L181 Asai, A., Yokoyama, T., Shimojo, M., & Shibata, K. 2004, ApJ, 605, L77 Attrill, G. D. R., Harra, L. K., van Driel-Gesztelyi, L., & Démoulin, P. 2007, Astrophys. J., 656, L101 Bain, H. M., Krucker, S., Glesener, L., & Lin, R. P. 2012, ApJ, 750, 44 Carmichael, H. 1964, NASA Special Publication, 50, 451 Chen, P. F. 2006, ApJ, 641, L153 Chen, P. F. 2011, Living Reviews in Solar Physics, 8, 1 Chen, P. F., Fang, C., & Shibata, K. 2005, ApJ, 622, 1202 Chen, P. F. & Shibata, K. 2000, ApJ, 545, 524 Chen, P. F., Wu, S. T., Shibata, K., & Fang, C. 2002, Astrophys. J., 572, 99 Chen, P. F. & Wu, Y. 2011, Astrophys. J., 732, L20 Cheng, X., Ding, M. D., & Zhang, J. 2010, ApJ, 712, 1302 Cho, K.-S., Bong, S.-C., Moon, Y.-J., et al. 2011, A&A, 530, A16+ Chou, D.-Y. & Zirin, H. 1988, ApJ, 333, 420 Cliver, E. W., Laurenza, M., Storini, M., & Thompson, B. J. 2005, ApJ, 631, 604 Cohen, O., Attrill, G. D. R., Manchester, IV, W. B., & Wills-Davey, M. J. 2009, ApJ, 705, 587 Delannée, C. & Aulanier, G. 1999, Sol. Phys., 190, 107 Downs, C., Roussev, I. I., van der Holst, B., Lugaz, N., & Sokolov, I. V. 2012, ApJ, 750, 134 Downs, C., Roussev, I. I., van der Holst, B., et al. 2011, ApJ, 728, 2 Feng, S. W., Chen, Y., Kong, X. L., et al. 2012, ApJ, 753, 21 Feynman, J. & Martin, S. F. 1995, J. Geophys. Res., 100, 3355 Forbes, T. G. & Lin, J. 2000, Journal of Atmospheric and Solar-Terrestrial Physics, 62, 1499 Gopalswamy, N., Nitta, N., Akiyama, S., Mäkelä, P., & Yashiro, S. 2012, ApJ, 744, 72 Gopalswamy, N., Yashiro, S., Temmer, M., et al. 2009, Astrophys. J., 691, L123 Grechnev, V. V., Uralov, A. M., Slemzin, V. A., et al. 2008, Sol. Phys., 253, 263 Hirayama, T. 1974, Sol. Phys., 34, 323 Hudson, H. S., Khan, J. I., Lemen, J. R., Nitta, N. V., & Uchida, Y. 2003, Sol. Phys., 212, 121 Isobe, H., Miyagoshi, T., Shibata, K., & Yokoyama, T. 2005, Nature, 434, 478 Isobe, H., Miyagoshi, T., Shibata, K., & Yokoyama, T. 2007, in Astronomical Society of the Pacific Conference Series, Vol. 369, New Solar Physics with Solar-B Mission, ed. K. Shibata, S. Nagata, & T. Sakurai, 355 Kahler, S. W., Moore, R. L., Kane, S. R., & Zirin, H. 1988, ApJ, 328, 824 Kaiser, M. L., Kucera, T. A., Davila, J. M., et al. 2008, Space Sci. Rev., 136, 5 Karlický, M. 2004, A&A, 417, 325 Karlický, M. & Bárta, M. 2007, A&A, 464, 735 Khan, J. I. & Aurass, H. 2002, A&A, 383, 1018 Kienreich, I. W., Temmer, M., & Veronig, A. M. 2009, Astrophys. J., 703, L118 Kim, Y.-H., Moon, Y.-J., Cho, K.-S., Bong, S.-C., & Park, Y. D. 2005, ApJ, 635, 1291 Klassen, A., Aurass, H., Mann, G., & Thompson, B. J. 2000, A&AS, 141, 357 Klassen, A., Karlický, M., Aurass, H., & JiřiČka, K. 1999, Sol. Phys., 188, 141 Klassen, A., Pohjolainen, S., & Klein, K.-L. 2003, Sol. Phys., 218, 197 Klein, K.-L., Khan, J. I., Vilmer, N., Delouis, J.-M., & Aurass, H. 1999, A&A, 346, L53 Kliem, B., Karlický, M., & Benz, A. O. 2000, A&A, 360, 715 Kliem, B., Titov, V. S., & Török, T. 2004, A&A, 413, L23 Ko, Y.-K., Raymond, J. C., Lin, J., et al. 2003, ApJ, 594, 1068 Kong, X. L., Chen, Y., Li, G., et al. 2012, ApJ, 750, 158 Kopp, R. A. & Pneuman, G. W. 1976, Sol. Phys., 50, 85 Kozarev, K. A., Korreck, K. E., Lobzin, V. V., Weber, M. A., & Schwadron, N. A. 2011, ApJ, 733, L25 Kumar, P., Cho, K.-S., Bong, S.-C., Park, S.-H., & Kim, Y. H. 2012a, ApJ, 746, 67 Kumar, P., Cho, K.-S., Chen, P. F., Bong, S.-C., & Park, S.-H. 2012b, Sol. Phys., 264 Kumar, P., Manoharan, P. K., & Uddin, W. 2010a, ApJ, 710, 1195 Kumar, P., Srivastava, A. K., Filippov, B., & Uddin, W. 2010b, Sol. Phys., 266, 39 Kumar, P., Srivastava, A. K., Somov, B. V., et al. 2010c, ApJ, 723, 1651 Lemen, J. R., Title, A. M., Akin, D. J., et al. 2011, Sol. Phys., 106 Li, T., Zhang, J., Yang, S., & Liu, W. 2012, ApJ, 746, 13 Lin, J., Ko, Y.-K., Sui, L., et al. 2005, ApJ, 622, 1251 Liu, W., Ofman, L., Nitta, N. V., et al. 2012, ApJ, 753, 52 Liu, W., Title, A. M., Zhao, J., et al. 2011, ApJ, 736, L13 Ma, S., Raymond, J. C., Golub, L., et al. 2011, ApJ, 738, 160 Ma, S., Wills-Davey, M. J., Lin, J., et al. 2009, ApJ, 707, 503 Magara, T., Chen, P., Shibata, K., & Yokoyama, T. 2000, Astrophys. J., 538, 175 Magdalenić, J., Marqué, C., Zhukov, A. N., Vršnak, B., & Veronig, A. 2012, ApJ, 746, 152 Magdalenić, J., Vršnak, B., Pohjolainen, S., et al. 2008, Sol. Phys., 253, 305 Manoharan, P. K., van Driel-Gesztelyi, L., Pick, M., & Demoulin, P. 1996, ApJ, 468, L73+ Masuda, S., Kosugi, T., Hara, H., Tsuneta, S., & Ogawara, Y. 1994, Nature, 371, 495 McKenzie, D. E. 2000, Sol. Phys., 195, 381 McKenzie, D. E. & Hudson, H. S. 2001, Earth, Planets, and Space, 53, 577 Meegan, C., Lichti, G., Bhat, P. N., et al. 2009, ApJ, 702, 791 Moore, R. L. 1988, ApJ, 324, 1132 Moore, R. L. & Roumeliotis, G. 1992, in Lecture Notes in Physics, Berlin Springer Verlag, Vol. 399, IAU Colloq. 133: Eruptive Solar Flares, ed. Z. Svestka, B. V. Jackson, & M. E. Machado, 69 Moore, R. L., Sterling, A. C., Hudson, H. S., & Lemen, J. R. 2001, ApJ, 552, 833 Nakariakov, V. M., Ofman, L., Deluca, E. E., Roberts, B., & Davila, J. M. 1999, Science, 285, 862 Narukage, N., Hudson, H. S., Morimoto, T., et al. 2002, Astrophys. J., 572, 109 Newkirk, G. & Altschuler, M. D. 1970, Sol. Phys., 13, 131 Ning, Z., Wu, H., Xu, F., & Meng, X. 2007, Sol. Phys., 241, 77 Nishida, K., Shimizu, M., Shiota, D., et al. 2009, ApJ, 690, 748 Ofman, L., Liu, W., Title, A., & Aschwanden, M. 2011, ApJ, 740, L33 Ofman, L. & Thompson, B. J. 2002, ApJ, 574, 440 Ohyama, M. & Shibata, K. 1998, ApJ, 499, 934 Olmedo, O., Vourlidas, A., Zhang, J., & Cheng, X. 2012, ApJ, 756, 143 Pariat, E., Antiochos, S. K., & DeVore, C. R. 2010, ApJ, 714, 1762 Parker, E. N. 1963, ApJS, 8, 177 Patsourakos, S., Pariat, E., Vourlidas, A., Antiochos, S. K., & Wuelser, J. P. 2008, ApJ, 680, L73 Patsourakos, S. & Vourlidas, A. 2012, Sol. Phys., 281, 187 Patsourakos, S., Vourlidas, A., Wang, Y. M., Stenborg, G., & Thernisien, A. 2009, Sol. Phys., 259, 49 Petschek, H. E. 1964, NASA Special Publication, 50, 425 Sakajiri, T., Brooks, D. H., Yamamoto, T., et al. 2004, ApJ, 616, 578 Scherrer, P. H., Schou, J., Bush, R. I., et al. 2012, Sol. Phys., 275, 207 Schmieder, B., Bommier, V., Kitai, R., et al. 2008, Sol. Phys., 247, 321 Schou, J., Scherrer, P. H., Bush, R. I., et al. 2012, Sol. Phys., 275, 229 Schrijver, C. J. 2009, Advances in Space Research, 43, 739 Schrijver, C. J., Elmore, C., Kliem, B., Török, T., & Title, A. M. 2008, ApJ, 674, 586 Shibata, K. 1998, in ESA Special Publication, Vol. 421, Solar Jets and Coronal Plumes, ed. T.-D. Guyenne, 137 Shibata, K., Ishido, Y., Acton, L. W., et al. 1992, PASJ, 44, L173 Shibata, K., Masuda, S., Shimojo, M., et al. 1995, ApJ, 451, L83+ Shibata, K. & Tanuma, S. 2001, Earth, Planets, and Space, 53, 473 Shibata, K. & Uchida, Y. 1986, Sol. Phys., 103, 299 Shimojo, M., Hashimoto, S., Shibata, K., et al. 1996, PASJ, 48, 123 Sterling, A. C. & Moore, R. L. 2004, ApJ, 613, 1221 Sterling, A. C., Moore, R. L., & Freeland, S. L. 2011, ApJ, 731, L3 Sturrock, P. A. 1966, Nature, 211, 695 Sui, L. & Holman, G. D. 2003, ApJ, 596, L251 Sweet, P. A. 1958, in IAU Symposium, Vol. 6, Electromagnetic Phenomena in Cosmical Physics, ed. B. Lehnert, Temmer, M., Veronig, A. M., Gopalswamy, N., & Yashiro, S. 2011, Sol. Phys., 273, 421 Temmer, M., Vršnak, B., Žic, T., & Veronig, A. M. 2009, ApJ, 702, 1343 Thompson, B. J., Gurman, J. B., Neupert, W. M., et al. 1999, Astrophys. J., 517, L151 Thompson, B. J. & Myers, D. C. 2009, ApJS, 183, 225 Thompson, B. J., Plunkett, S. P., Gurman, J. B., et al. 1998, Geophys. Res. Lett., 25, 2465 Török, T., Chandra, R., Pariat, E., et al. 2011, ApJ, 728, 65 Török, T. & Kliem, B. 2005, ApJ, 630, L97 Tsuneta, S., Hara, H., Shimizu, T., et al. 1992, PASJ, 44, L63 Uchida, Y. 1968, Sol. Phys., 4, 30 Uchida, Y. 1974, Sol. Phys., 39, 431 9
10 Uchida, Y., Altschuler, M. D., & Newkirk, Jr., G. 1973, Sol. Phys., 28, 495 Žic, T., Vršnak, B., Temmer, M., & Jacobs, C. 2008, Sol. Phys., 253, 237 Veronig, A. M., Muhr, N., Kienreich, I. W., Temmer, M., & Vršnak, B. 2010, ApJ, 716, L57 Veronig, A. M., Temmer, M., & Vršnak, B. 2008, Astrophys. J., 681, L113 Veronig, A. M., Temmer, M., Vršnak, B., & Thalmann, J. K. 2006, ApJ, 647, 1466 Vršnak, B. & Cliver, E. W. 2008, Sol. Phys., 253, 215 Wang, Y.-M. 2000, Astrophys. J., 543, L89 Warmuth, A. 2010, Advances in Space Research, 45, 527 Warmuth, A., Vršnak, B., Magdalenić, J., Hanslmeier, A., & Otruba, W. 2004, A&A, 418, 1117 Wills-Davey, M. J. & Thompson, B. J. 1999, Sol. Phys., 190, 467 Wu, S. T., Zheng, H., Wang, S., et al. 2001, J. Geophys. Res., 106, Yokoyama, T., Akita, K., Morimoto, T., Inoue, K., & Newmark, J. 2001, ApJ, 546, L69 Yokoyama, T. & Shibata, K. 2001, ApJ, 549, 1160 Zhang, J., Dere, K. P., Howard, R. A., & Vourlidas, A. 2004, ApJ, 604, 420 Zhang, Y., Kitai, R., Narukage, N., et al. 2011, PASJ, 63, 685 Zheng, R., Jiang, Y., Hong, J., et al. 2011, ApJ, 739, L39 Zheng, R., Jiang, Y., Yang, J., et al. 2012a, ApJ, 747, 67 Zheng, R., Jiang, Y., Yang, J., et al. 2012b, ApJ, 753, 112 Zhukov, A. N. 2011, Journal of Atmospheric and Solar-Terrestrial Physics, 73,


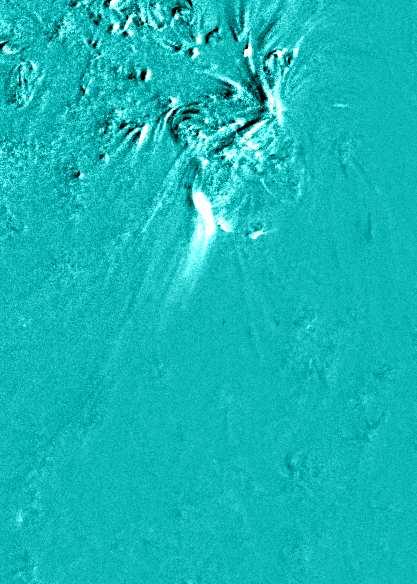
11 R1 R2 R3 Fig. 1. SDO/AIA EUV images at 304 Å showing the formation and eruption of the plasma blob on 25 March


12 Fig. 2. SDO/AIA 131 Å base-difference images showing the formation and eruption of the plasma blob on 25 March
13 Fig. 3. Top: GOES soft X-ray flux profile in the 1-8 Å wavelength channel. Middle: Projected height-time of the blob plotted with the hard X-ray flux profile in the energy range of kev observed with the Fermi Gamma-ray Burst Monitor. Bottom: Temporal evolution of the blob speed derived by the height-time measurements using AIA 131 Å images. The AIA 1600 Å average integrated counts profile is plotted as a blue curve. The uncertainty in the speed estimate is mainly due to the error in the height measurement, which is assumed to be four pixels (i.e., 2.4 ). The vertical dotted line shows start time of the flare at 23:08 UT. 13
 postflare loops Fig. 4.")

 at the site of the emerging anemone-type loops.")
 and negative")
14 "anemone-type" emerged loops (before flare) arch filament plasma blob (after flare) postflare loops Fig. 4. SDO/AIA 304 and 335 Å images of the blob formation site before and after the flare. The plasma blob was formed above the arch filament (indicated by arrows) at the site of the emerging anemone-type loops. The AIA 304 Å image in the middle panel is overlaid with the HMI magnetogram contours of positive (white) and negative (black) polarities. The contour levels are ±200, ±500, ±1000, and ±2000 G. 14


15 flux emergence N P N1 P1 R1 R2 R3 Fig. 5. HMI magnetograms showing the magnetic flux emergence at the site of the blob eruption. The magnetogram at 23:00 UT is overlaid with the AIA 1600 Å EUV flare ribbons near the flux emergence site. Bottom: The temporal evolution of positive, unsigned negative, and total unsigned flux derived from the HMI magnetograms on 25 March Two vertical dotted lines indicate the duration of blob eruption and the associated flare. 15


16 Kumar & Manoharan: Eruption of a plasma blob and associated large-scale EUV wave CH AR AR shock formation blob flare AR CH deflection Fig. 6. AIA 193 Å intensity, HMI magnetogram and AIA 193 Å running difference images showing the eruption of the plasma blob 16 and the formation of EUV wave in front of the blob on 25 March X and Y axes are given in arcsecs.


.")
17 Kumar & Manoharan: Eruption of a plasma blob and associated large-scale EUV wave AIA 335 Å S2 S4 S3 S5 S1 F S AIA 171 Å T F1 F1 dimming T F1 F1 S F2 Fig. 7. AIA 335 and 171 Å EUV running-difference images showing the propagation of EUV waves on 25 March F and S indicate the faster and slower wavefronts, respectively. The slices selected for the space-time intensity plots are marked by S1 to S5 (top-right). F1 and F2 also represent the fast wavefronts, while T shows the transmitted wavefront from AR NOAA X and Y axes are given in arcsecs. 17


18 AIA 171 Å S1 AR transmitted wave T S2 1245±28 km/s S3 plasma blob flare flare AIA 193 Å 912±33 km/s F AIA 335 Å EUV wave onset plasma blob Fig. 8. Temporal evolution of the intensity along slices S1, S2, and S3 for the AIA 171, 193, and 335 Å running-difference images. The faster wave is indicated by F while the transmitted wave from AR NOAA is marked with T. 18


19 S4 F1 1173±15 km/s F2 S5 1211±17 km/s F1 F2 1296±25 km/s 1011±32 km/s S 341±11 km/s plasma blob Fig. 9. Temporal evolution of the intensity along slices S4 and S5 for the AIA 171, 193, and 335 Å running-difference images. The faster wavefronts are indicated by F1 and F2, while the slower wavefront in front of the plasma blob is marked with S. 19


20 blob shock formation F deflection S Fig. 10. STEREO-B 195 Å EUV running-difference images showing the eruption of the plasma blob and the formation of EUV wavefronts (indicated by F and S for the faster and slower front) ahead of it. 20
 and t is the time (in sec) from 23:03 UT. The red curve shows the GOES soft X-ray flux profile in 1-8 Å.")

21 Fig. 11. Top: Blob projected height-time (derived from the STEREO-B 195 Å images) plot with quadratic fit to the measurements. The equation of the fitted curve is h=( )t 2 +(4.1)t+0.2, where h is the height (in km) and t is the time (in sec) from 23:03 UT. The red curve shows the GOES soft X-ray flux profile in 1-8 Å. Bottom: Temporal evolution of the blob speed derived from height-time measurements. The typical error in the height estimate is four pixels (6.4 ). Type III F Type II H Fig. 12. Top: Radio dynamic spectrum from the Learmonth observatory, Australia in the MHz frequency range plotted against the GOES soft X-ray flux in 1-8 Å. The radio spectrum shows narrow type III and type II radio bursts during the M-class flare. F and H indicate the fundamental and second-harmonic band emission, respectively. Bottom: Emission heights of type II radio burst (from fundamental band) in the corona estimated from the Newkirk one-fold and two-fold coronal density models. The distance-time profile of the coronal wave is also included. 21


22 AR deflection deflection flare + + AR oscillations oscillations EUVI B/ 23:20:30 UT EUVI A/ 23:20:30 UT EUVI B/ 23:40:30 UT EUVI A/ 23:40:30 UT streamer F EUVI 23:20:30 UT COR1 23:20:00 UT EUVI 23:35:30 UT COR1 23:35:00 UT EUVI 23:40:30 UT COR1 23:40:00 UT EUVI 23:45:30 UT COR1 23:45:00 UT Fig. 13. Top: 195 Å EUV images from STEREO A and B. Bottom: STEREO EUVI and COR1 running-difference composite images. F shows the southward propagating front passing through the streamer. 22
Multi-wavelength VLA and Spacecraft Observations of Evolving Coronal Structures Outside Flares
 Multi-Wavelength Investigations of Solar Activity Proceedings of IAU Symposium No. 223, 2004 A.V. Stepanov, E.E. Benevolenskaya & A.G. Kosovichev, eds. Multi-wavelength VLA and Spacecraft Observations
Downflow as a Reconnection Outflow
 The Solar-B Mission and the Forefront of Solar Physics ASP Conference Series, Vol. 325, 2004 T. Sakurai and T. Sekii, eds. Downflow as a Reconnection Outflow Ayumi Asai and Kazunari Shibata Kwasan and
arxiv: v1 [astro-ph.sr] 24 Jan 2019
![arxiv: v1 [astro-ph.sr] 24 Jan 2019](/thumbs/93/117971999.jpg "arxiv: v1 [astro-ph.sr] 24 Jan 2019") Draft version January 25, 2019 Typeset using L A TEX preprint style in AASTeX62 First Unambiguous Imaging of Large-Scale Quasi-Periodic Extreme-Ultraviolet Wave or Shock Yuandeng Shen, 1, 2, 3 P. F. Chen,
Draft version January 25, 2019 Typeset using L A TEX preprint style in AASTeX62 First Unambiguous Imaging of Large-Scale Quasi-Periodic Extreme-Ultraviolet Wave or Shock Yuandeng Shen, 1, 2, 3 P. F. Chen,
arxiv: v1 [astro-ph.sr] 15 Jul 2013
![arxiv: v1 [astro-ph.sr] 15 Jul 2013](/thumbs/72/66341175.jpg "arxiv: v1 [astro-ph.sr] 15 Jul 2013") Astronomy & Astrophysics manuscript no. 03nov2011 aa print rev1 c ESO 2014 January 11, 2014 Simultaneous EUV and radio observations of bidirectional plasmoids ejection during magnetic reconnection Pankaj
Astronomy & Astrophysics manuscript no. 03nov2011 aa print rev1 c ESO 2014 January 11, 2014 Simultaneous EUV and radio observations of bidirectional plasmoids ejection during magnetic reconnection Pankaj
Modelling the Initiation of Solar Eruptions. Tibor Török. LESIA, Paris Observatory, France
 Modelling the Initiation of Solar Eruptions Tibor Török LESIA, Paris Observatory, France What I will not talk about: global CME models Roussev et al., 2004 Manchester et al., 2004 Tóth et al., 2007 numerical
TRACE DOWNFLOWS AND ENERGY RELEASE
 TRACE DOWNFLOWS AND ENERGY RELEASE Ayumi Asai (1), T. Yokoyama (2), M. Shimojo (3), R. TanDokoro (4), M. Fujimoto (4), and K. Shibata (1) (1 ) Kwasan and Hida Observatories, Kyoto University, Kyoto, 607-8471
arxiv: v1 [astro-ph.sr] 16 Jun 2016
![arxiv: v1 [astro-ph.sr] 16 Jun 2016](/thumbs/74/69878474.jpg "arxiv: v1 [astro-ph.sr] 16 Jun 2016") Draft version June 17, 2016 Preprint typeset using L A TEX style emulateapj v. 04/17/13 FLARE GENERATED SHOCK WAVE PROPAGATION THROUGH SOLAR CORONAL ARCADE LOOPS AND ASSOCIATED TYPE II RADIO BURST PANKAJ
Draft version June 17, 2016 Preprint typeset using L A TEX style emulateapj v. 04/17/13 FLARE GENERATED SHOCK WAVE PROPAGATION THROUGH SOLAR CORONAL ARCADE LOOPS AND ASSOCIATED TYPE II RADIO BURST PANKAJ
Microwave and hard X-ray imaging observations of energetic electrons in solar flares: event of 2003 June 17
 Microwave and hard X-ray imaging observations of energetic electrons in solar flares: event of 2003 June 17 Kundu, M R., Schmahl, E J, and White, S M Introduction We discuss one large flare using simultaneous
EVOLUTION OF SOLAR MAGNETIC FIELD AND ASSOCIATED MULTIWAVELENGTH PHENOMENA: FLARE EVENTS ON 2003 NOVEMBER 20
 The Astrophysical Journal, 710:1195 1204, 2010 February 20 C 2010. The American Astronomical Society. All rights reserved. Printed in the U.S.A. doi:10.1088/0004-637x/710/2/1195 EVOLUTION OF SOLAR MAGNETIC
A UNIFIED MODEL OF CME-RELATED TYPE II RADIO BURSTS 3840, USA. Kyoto , Japan. Japan
 1 A UNIFIED MODEL OF CME-RELATED TYPE II RADIO BURSTS TETSUYA MAGARA 1,, PENGFEI CHEN 3, KAZUNARI SHIBATA 4, AND TAKAAKI YOKOYAMA 5 1 Department of Physics, Montana State University, Bozeman, MT 59717-3840,
Observation of An Evolving Magnetic Flux Rope Prior To and During A Solar Eruption
 arxiv:1203.4859v1 [astro-ph.sr] 22 Mar 2012 Observation of An Evolving Magnetic Flux Rope Prior To and During A Solar Eruption March 23, 2012 Jie Zhang 1,, Xin Cheng 1,2, Ming-de Ding 2 1 School of Physics,
High Cadence Radio Observations of an EIT Wave
 December 23, 2004 High Cadence Radio Observations of an EIT Wave S. M. White 1 and B. J. Thompson 2 ABSTRACT Sensitive radio observations of the 1997 September 24 EIT wave show its velocity to be 830 km
arxiv: v1 [astro-ph.sr] 2 Sep 2013
![arxiv: v1 [astro-ph.sr] 2 Sep 2013](/thumbs/88/117784401.jpg "arxiv: v1 [astro-ph.sr] 2 Sep 2013") arxiv:1309.0417v1 [astro-ph.sr] 2 Sep 2013 ISSN 1845 8319 SIMULTANEOUS YOHKOH /SXT AND TRACE OBSERVATIONS OF SOLAR PLASMA EJECTIONS E. CHMIELEWSKA 1, M. TOMCZAK 1, T. MROZEK 1,2 1 Astronomical Institute,
arxiv:1309.0417v1 [astro-ph.sr] 2 Sep 2013 ISSN 1845 8319 SIMULTANEOUS YOHKOH /SXT AND TRACE OBSERVATIONS OF SOLAR PLASMA EJECTIONS E. CHMIELEWSKA 1, M. TOMCZAK 1, T. MROZEK 1,2 1 Astronomical Institute,
Astronomy. Astrophysics. Multiwavelength observation of a large-scale flux rope eruption above a kinked small filament. Pankaj Kumar and Kyung-Suk Cho
 A&A 572, A83 (2014) DOI: 10.1051/0004-6361/201323269 c ESO 2014 Astronomy & Astrophysics Multiwavelength observation of a large-scale flux rope eruption above a kinked small filament Pankaj Kumar and Kyung-Suk
Solar Flare. A solar flare is a sudden brightening of solar atmosphere (photosphere, chromosphere and corona)
") Solar Flares Solar Flare A solar flare is a sudden brightening of solar atmosphere (photosphere, chromosphere and corona) Flares release 1027-1032 ergs energy in tens of minutes. (Note: one H-bomb: 10
Solar Flares Solar Flare A solar flare is a sudden brightening of solar atmosphere (photosphere, chromosphere and corona) Flares release 1027-1032 ergs energy in tens of minutes. (Note: one H-bomb: 10
arxiv: v1 [astro-ph.sr] 17 Jun 2014
![arxiv: v1 [astro-ph.sr] 17 Jun 2014](/thumbs/82/86745937.jpg "arxiv: v1 [astro-ph.sr] 17 Jun 2014") Draft version June 18, 214 Preprint typeset using L A TEX style emulateapj v. 8/13/6 Online-only material: animations, color figures ON THE RELATIONSHIP BETWEEN A HOT-CHANNEL-LIKE SOLAR MAGNETIC FLUX ROPE
Draft version June 18, 214 Preprint typeset using L A TEX style emulateapj v. 8/13/6 Online-only material: animations, color figures ON THE RELATIONSHIP BETWEEN A HOT-CHANNEL-LIKE SOLAR MAGNETIC FLUX ROPE
Science with Facilities at ARIES
 Science with Facilities at ARIES Wahab Uddin Aryabhatta Research Institute of Observational Sciences(ARIES), Nainital ARIES Science Goals with ARIES Solar Observations: [1] Ground based observations of
EIT WAVES AND FAST-MODE PROPAGATION IN THE SOLAR CORONA Y.-M. Wang
 The Astrophysical Journal, 543:L89 L93, 000 November 1 Copyright is not claimed for this article. Printed in U.S.A. EIT WAVES AND FAST-MODE PROPAGATION IN THE SOLAR CORONA Y.-M. Wang E. O. Hulburt Center
arxiv: v1 [astro-ph.sr] 28 Apr 2013
![arxiv: v1 [astro-ph.sr] 28 Apr 2013](/thumbs/96/128014024.jpg "arxiv: v1 [astro-ph.sr] 28 Apr 2013") Accepted for publication in ApJ Letters on April 28th Preprint typeset using L A TEX style emulateapj v. 08/13/06 Online-only material: animations, color figures INVESTIGATING TWO SUCCESSIVE FLUX ROPE
Accepted for publication in ApJ Letters on April 28th Preprint typeset using L A TEX style emulateapj v. 08/13/06 Online-only material: animations, color figures INVESTIGATING TWO SUCCESSIVE FLUX ROPE
NUMERICAL SIMULATION OF CORONAL WAVES INTERACTING WITH CORONAL HOLES: III. DEPENDENCE ON INITIAL AMPLITUDE OF THE INCOMING WAVE.
 Draft version December 3, 2018 Typeset using LATEX twocolumn style in AASTeX61 NUMERICAL SIMULATION OF CORONAL WAVES INTERACTING WITH CORONAL HOLES: III. DEPENDENCE ON INITIAL AMPLITUDE OF THE INCOMING
First Simultaneous Observation of Hα Moreton Wave, EUV Wave, and Filament/Prominence Oscillations
 AA: 211/9/14 First Simultaneous Observation of Hα Moreton Wave, EUV Wave, and Filament/Prominence Oscillations Ayumi Asai 1, Takako T. Ishii 2, Hiroaki Isobe 1, Reizaburo Kitai 2, Kiyoshi Ichimoto 2, Satoru
Solar eruptive phenomena
 Solar eruptive phenomena Andrei Zhukov Solar-Terrestrial Centre of Excellence SIDC, Royal Observatory of Belgium 26/01/2018 1 Eruptive solar activity Solar activity exerts continous influence on the solar
Some open problems for magnetic reconnection in solar flares
 Some open problems for magnetic reconnection in solar flares Bernhard Kliem Astrophysical Institute Potsdam 1. Introduction 2. Reconnection outflow termination shock 3. Supra-arcade downflows 4. Impulsive
Coronal Holes. Detection in STEREO/EUVI and SDO/AIA data and comparison to a PFSS model. Elizabeth M. Dahlburg
 Coronal Holes Detection in STEREO/EUVI and SDO/AIA data and comparison to a PFSS model Elizabeth M. Dahlburg Montana State University Solar Physics REU 2011 August 3, 2011 Outline Background Coronal Holes
Coronal Signatures of a Flare Generated Type-II Solar Radio Burst
 8th East-Asia School and Workshop on Laboratory, Space, and Astrophysical Plasmas July 30 (Mon), 2018 ~ August 03 (Fri), 2018 Coronal Signatures of a Flare Generated Type-II Solar Radio Burst V. Vasanth
Paper Review: Block-induced Complex Structures Building the Flare-productive Solar Active Region 12673
 Paper Review: Block-induced Complex Structures Building the Flare-productive Solar Active Region 12673 Shuhong Yang, Jun Zhang, Xiaoshuai Zhu, and Qiao Song Published 2017 November 2 ApJL, 849, L21. Introduction
arxiv: v1 [astro-ph.sr] 20 Dec 2018
![arxiv: v1 [astro-ph.sr] 20 Dec 2018](/thumbs/95/125112160.jpg "arxiv: v1 [astro-ph.sr] 20 Dec 2018") Submitted to ApJL The initial morphologies of the wavefronts of extreme ultraviolet waves Ruisheng Zheng 1, Zhike Xue 2, Yao Chen 1, Bing Wang 1, and Hongqiang Song 1 arxiv:1812.08371v1 [astro-ph.sr] 20
Submitted to ApJL The initial morphologies of the wavefronts of extreme ultraviolet waves Ruisheng Zheng 1, Zhike Xue 2, Yao Chen 1, Bing Wang 1, and Hongqiang Song 1 arxiv:1812.08371v1 [astro-ph.sr] 20
arxiv: v1 [astro-ph.sr] 31 Oct 2018
![arxiv: v1 [astro-ph.sr] 31 Oct 2018](/thumbs/89/100545743.jpg "arxiv: v1 [astro-ph.sr] 31 Oct 2018") Draft version November 1, 2018 Typeset using LATEX default style in AASTeX61 SUCCESSIVE FLUX ROPE ERUPTIONS FROM δ-sunspots REGION OF NOAA 12673 AND ASSOCIATED X-CLASS ERUPTIVE FLARES ON 2017 SEPTEMBER
Draft version November 1, 2018 Typeset using LATEX default style in AASTeX61 SUCCESSIVE FLUX ROPE ERUPTIONS FROM δ-sunspots REGION OF NOAA 12673 AND ASSOCIATED X-CLASS ERUPTIVE FLARES ON 2017 SEPTEMBER
Solar-B. Report from Kyoto 8-11 Nov Meeting organized by K. Shibata Kwasan and Hida Observatories of Kyoto University
 Solar-B Report from Kyoto 8-11 Nov Meeting organized by K. Shibata Kwasan and Hida Observatories of Kyoto University The mission overview Japanese mission as a follow-on to Yohkoh. Collaboration with USA
EIT Waves: A Changing Understanding over a Solar Cycle
 EIT Waves: A Changing Understanding over a Solar Cycle M. J. Wills-Davey and G. D. R. Attrill Smithsonian Astrophysical Observatory, 60 Garden St., Cambridge, MA, 01238, USA +1-617-495-7852 +1-617-496-7577
Observation of the origin of CMEs in the low corona
 Astron. Astrophys. 355, 725 742 (2000) ASTRONOMY AND ASTROPHYSICS Observation of the origin of CMEs in the low corona C. Delannée 1,, J.-P. Delaboudinière 1, and P. Lamy 2 1 Institut d Astrophysique Spatiale,
ASPIICS: a Giant Solar Coronagraph onboard the PROBA-3 Mission
 SOLI INVICTO ASPIICS: a Giant Solar Coronagraph onboard the PROBA-3 Mission Andrei Zhukov Principal Investigator of PROBA-3/ASPIICS Solar-Terrestrial Centre of Excellence SIDC, Royal Observatory of Belgium
CMEs, solar wind and Sun-Earth connections: unresolved issues
 CMEs, solar wind and Sun-Earth connections: unresolved issues Rainer Schwenn Max-Planck Planck-Institut für Sonnensystemforschung, Katlenburg-Lindau, Germany Schwenn@mps.mpg.de In recent years, an unprecedented
arxiv: v1 [astro-ph.sr] 31 May 2018
![arxiv: v1 [astro-ph.sr] 31 May 2018](/thumbs/95/125112242.jpg "arxiv: v1 [astro-ph.sr] 31 May 2018") New Astronomy 00 (2018) 1?? New Astronomy arxiv:1805.12314v1 [astro-ph.sr] 31 May 2018 Formation and Eruption of a Double-decker Filament Triggered by Micro-bursts and Recurrent Jets in the Filament Channel
New Astronomy 00 (2018) 1?? New Astronomy arxiv:1805.12314v1 [astro-ph.sr] 31 May 2018 Formation and Eruption of a Double-decker Filament Triggered by Micro-bursts and Recurrent Jets in the Filament Channel
Using This Flip Chart
 Using This Flip Chart Sunspots are the first indicators that a storm from the Sun is a possibility. However, not all sunspots cause problems for Earth. By following the steps in this flip chart you will
Study of a Large Helical Eruptive Prominence Associated with Double CME on 21 April 2001
 J. Astrophys. Astr. (2006) 27, 347 352 Study of a Large Helical Eruptive Prominence Associated with Double CME on 21 April 2001 Syed Salman Ali, Wahab Uddin & Ramesh Chandra Aryabhatta Research Institute
RECURRENT SOLAR JETS INDUCED BY A SATELLITE SPOT AND MOVING MAGNETIC FEATURES
 2015. The American Astronomical Society. All rights reserved. doi:10.1088/0004-637x/815/1/71 RECURRENT SOLAR JETS INDUCED BY A SATELLITE SPOT AND MOVING MAGNETIC FEATURES Jie Chen 1, Jiangtao Su 1, Zhiqiang
Observations of Solar Jets
 Observations of Solar Jets Coronal Jets X-ray and EUV images Davina Innes Transition Region Jets explosive events UV spectra and since IRIS images Active Region jets Coronal hole jets Everywhere about
Flare Energy Release in the Low Atmosphere
 Flare Energy Release in the Low Atmosphere Alexander G. Kosovichev, Viacheslav M. Sadykov New Jersey Institute of Technology Ivan N. Sharykin, Ivan V. Zimovets Space Research Institute RAS Santiago Vargas
Observation of an evolving magnetic flux rope before and during a solar eruption
 ARTICLE Received 31 Oct 211 Accepted 16 Feb 212 Published 2 Mar 212 DOI: 1.138/ncomms1753 Observation of an evolving magnetic flux rope before and during a solar eruption Jie Zhang 1, Xin Cheng 1,2 & Ming-de
EVIDENCE FOR MAGNETIC RECONNECTION IN THREE HOMOLOGOUS SOLAR FLARES OBSERVED BY RHESSI
 The Astrophysical Journal, 612:546 556, 2004 September 1 # 2004. The American Astronomical Society. All rights reserved. Printed in U.S.A. A EVIDENCE FOR MAGNETIC RECONNECTION IN THREE HOMOLOGOUS SOLAR
The soft X-ray characteristics of solar flares, both with and without associated CMEs
 A&A 400, 779 784 (2003) DOI: 10.1051/0004-6361:20030095 c ESO 2003 Astronomy & Astrophysics The soft X-ray characteristics of solar flares, both with and without associated CMEs H. R. M. Kay, L. K. Harra,
arxiv: v1 [astro-ph.sr] 4 Sep 2014
![arxiv: v1 [astro-ph.sr] 4 Sep 2014](/thumbs/93/113737525.jpg "arxiv: v1 [astro-ph.sr] 4 Sep 2014") Formation of Compound Flux Rope by The Merging of Two Filament Channels, Associated Dynamics and its Stability Navin Chandra Joshi 1 arxiv:1409.1359v1 [astro-ph.sr] 4 Sep 2014 School of Space Research,
Formation of Compound Flux Rope by The Merging of Two Filament Channels, Associated Dynamics and its Stability Navin Chandra Joshi 1 arxiv:1409.1359v1 [astro-ph.sr] 4 Sep 2014 School of Space Research,
Observations and models of solar coronal jets
 Tuesday October 27 th 2015 12th Postdam Thinkshop Postdam, Germany Observations and models of solar coronal jets Etienne Pariat 1 LESIA, Observatoire de Paris, PSL*, CNRS, UPMC, U. Denis Diderot, France
School and Conference on Analytical and Computational Astrophysics November, Coronal Loop Seismology - State-of-the-art Models
 9-4 School and Conference on Analytical and Computational Astrophysics 14-5 November, 011 Coronal Loop Seismology - State-of-the-art Models Malgorzata Selwa Katholic University of Leuven, Centre for Plasma
Statistical Study of X-ray Jets using. Hinode/XRT
 Statistical Study of X-ray Jets using Hinode/XRT Nobuharu Sako The Graduate University for Advanced Studies [SOKENDAI] Department of Astronomical Science August 13, 2014 Abstract X-ray jets have been first
arxiv: v1 [astro-ph.sr] 24 Apr 2012
![arxiv: v1 [astro-ph.sr] 24 Apr 2012](/thumbs/88/115201580.jpg "arxiv: v1 [astro-ph.sr] 24 Apr 2012") Accepted by ApJ, April 24, 2012 Preprint typeset using L A TEX style emulateapj v. 5/2/11 QUASI-PERIODIC FAST-MODE WAVE TRAINS WITHIN A GLOBAL EUV WAVE AND SEQUENTIAL TRANSVERSE OSCILLATIONS DETECTED BY
Accepted by ApJ, April 24, 2012 Preprint typeset using L A TEX style emulateapj v. 5/2/11 QUASI-PERIODIC FAST-MODE WAVE TRAINS WITHIN A GLOBAL EUV WAVE AND SEQUENTIAL TRANSVERSE OSCILLATIONS DETECTED BY
Solar flares have been phenomena of both academic
 eruptive events It s long been known that the Sun plays host to the most energetic explosions in the solar system. But key insights into how they work have only recently become available. Gordon D. Holman
arxiv: v1 [astro-ph.sr] 26 Dec 2018
![arxiv: v1 [astro-ph.sr] 26 Dec 2018](/thumbs/95/125112354.jpg "arxiv: v1 [astro-ph.sr] 26 Dec 2018") Transition from circular-ribbon to parallel-ribbon flares associated with a bifurcated magnetic flux rope Z. Zhong 1,2, Y. Guo 1,2, M. D. Ding 1,2, C. Fang 1,2, Q. Hao 1,2 1 School of Astronomy and Space
Transition from circular-ribbon to parallel-ribbon flares associated with a bifurcated magnetic flux rope Z. Zhong 1,2, Y. Guo 1,2, M. D. Ding 1,2, C. Fang 1,2, Q. Hao 1,2 1 School of Astronomy and Space
Radio Observations and Space Weather Research
 Radio Observations and Space Weather Research Jasmina Magdalenić Solar-Terrestrial Centre of Excellence SIDC, Royal Observatory of Belgium What is space weather and why is it important? Eruptive processes:
Magnetic Untwisting in Solar Jets that Go into the Outer Corona in Polar Coronal Holes. Short title: Magnetic Untwisting in Solar Jets
 Magnetic Untwisting in Solar Jets that Go into the Outer Corona in Polar Coronal Holes Short title: Magnetic Untwisting in Solar Jets Ronald L. Moore 1,2, Alphonse C. Sterling 1, and David A. Falconer
arxiv: v1 [astro-ph.sr] 16 Dec 2013
![arxiv: v1 [astro-ph.sr] 16 Dec 2013](/thumbs/87/97224441.jpg "arxiv: v1 [astro-ph.sr] 16 Dec 2013") Nature of Prominences and Their Role in Space Weather Proceedings IAU Symposium No. 300, 2013 B. Schmieder, J.-M. Malherbe, & S. T. Wu, eds. c 2013 International Astronomical Union DOI: 10.1017/S1743921313010983
Nature of Prominences and Their Role in Space Weather Proceedings IAU Symposium No. 300, 2013 B. Schmieder, J.-M. Malherbe, & S. T. Wu, eds. c 2013 International Astronomical Union DOI: 10.1017/S1743921313010983
База данных свойств вспышечных лент, основанная на наблюдениях Солнечной Динамической обсерватории
 Online Seminar 22 Feb 2017, Ioffe Institute A Database of Flare Ribbons Observed by Solar Dynamics Observatory База данных свойств вспышечных лент, основанная на наблюдениях Солнечной Динамической обсерватории
STCE Newsletter. 9 Jun Jun 2014
 Published by the STCE - this issue : 19 Jun 2014. Available online at http://www.stce.be/newsletter/. The Solar-Terrestrial Centre of Excellence (STCE) is a collaborative network of the Belgian Institute
EUV Blast Waves in Impulsive Solar Energetic Particle Events
 EUV Blast Waves in Impulsive Solar Energetic Particle Events Radoslav Bučík D. E. Innes, L. Guo G.M. Mason (JHU/APL) M. E. Wiedenbeck (Caltech/JPL) X-ray: NASA/CXC/SAO/T.Temim et al. and ESA/XMM- Newton
Magnetic twists and energy releases in solar flares
 Hinode seminar 2 September 2015 Magnetic twists and energy releases in solar flares Toshifumi Shimizu (ISAS/JAXA, Japan) 2015.9.2 Hinode seminar 1 Eruptive solar flares! General scenario Formation of magnetic
Evolution of the Sheared Magnetic Fields of Two X-Class Flares Observed by Hinode/XRT
 PASJ: Publ. Astron. Soc. Japan 59, S785 S791, 2007 November 30 c 2007. Astronomical Society of Japan. Evolution of the Sheared Magnetic Fields of Two X-Class Flares Observed by Hinode/XRT Yingna SU, 1,2,3
arxiv: v2 [astro-ph.sr] 26 Jun 2012
![arxiv: v2 [astro-ph.sr] 26 Jun 2012](/thumbs/72/67724498.jpg "arxiv: v2 [astro-ph.sr] 26 Jun 2012") LOW-ALTITUDE RECONNECTION INFLOW-OUTFLOW OBSERVATIONS DURING A 2010 NOVEMBER 3 SOLAR ERUPTION arxiv:1111.1945v2 [astro-ph.sr] 26 Jun 2012 1 Sabrina L. Savage, 1 Gordon Holman, 2 Katharine K. Reeves, 3
LOW-ALTITUDE RECONNECTION INFLOW-OUTFLOW OBSERVATIONS DURING A 2010 NOVEMBER 3 SOLAR ERUPTION arxiv:1111.1945v2 [astro-ph.sr] 26 Jun 2012 1 Sabrina L. Savage, 1 Gordon Holman, 2 Katharine K. Reeves, 3
arxiv: v1 [astro-ph.sr] 30 Jun 2016
![arxiv: v1 [astro-ph.sr] 30 Jun 2016](/thumbs/94/119002870.jpg "arxiv: v1 [astro-ph.sr] 30 Jun 2016") Fractal Reconnection in Solar and Stellar Environments Kazunari Shibata and Shinsuke Takasao arxiv:1606.09401v1 [astro-ph.sr] 30 Jun 2016 Abstract Recent space based observations of the Sun revealed that
Fractal Reconnection in Solar and Stellar Environments Kazunari Shibata and Shinsuke Takasao arxiv:1606.09401v1 [astro-ph.sr] 30 Jun 2016 Abstract Recent space based observations of the Sun revealed that
AIA DATA ANALYSIS OVERVIEW OF THE AIA INSTRUMENT
 AIA DATA ANALYSIS OVERVIEW OF THE AIA INSTRUMENT SDO SUMMER SCHOOL ~ August 2010 ~ Yunnan, China Marc DeRosa (LMSAL) ~ derosa@lmsal.com WHAT IS SDO? The goal of Solar Dynamics Observatory (SDO) is to understand:
November 2, Monday. 17. Magnetic Energy Release
 November, Monday 17. Magnetic Energy Release Magnetic Energy Release 1. Solar Energetic Phenomena. Energy Equation 3. Two Types of Magnetic Energy Release 4. Rapid Dissipation: Sweet s Mechanism 5. Petschek
Solar and Stellar Flares - nanoflares to superflares -
 MFUIII, 2011 Aug 22-25, Zakopane, Poland Magnetic Field in the Universe, III. Invited talk (25min) Solar and Stellar Flares - nanoflares to superflares - Kazunari Shibata Kyoto University, Kyoto, Japan
Initiation and Energy Release of Solar Coronal Mass Ejections (CMEs) & Relevant Solar Radio Bursts Yao Chen Institute of Space Sciences, Shandong
 & Relevant Solar Radio Bursts Yao Chen Institute of Space Sciences, Shandong") Initiation and Energy Release of Solar Coronal Mass Ejections (CMEs) & Relevant Solar Radio Bursts Yao Chen Institute of Space Sciences, Shandong University Initiation and Energy Release of CMEs Outline
Initiation and Energy Release of Solar Coronal Mass Ejections (CMEs) & Relevant Solar Radio Bursts Yao Chen Institute of Space Sciences, Shandong University Initiation and Energy Release of CMEs Outline
Theories of Eruptive Flares
 Coronal and Stellar Mass Ejections Proceedings IAU Symposium No. 226, 2005 K. P. Dere, J. Wang & Y. Yan, eds. c 2005 International Astronomical Union DOI: 00.0000/X000000000000000X Theories of Eruptive
Solar-Terrestrial Physics. The Sun s Atmosphere, Solar Wind, and the Sun-Earth Connection
 Week 2 Lecture Notes Solar-Terrestrial Physics The Sun s Atmosphere, Solar Wind, and the Sun-Earth Connection www.cac.cornell.edu/~slantz The Solar Corona is the Sun s Extended Atmosphere Scattered light
What do we see on the face of the Sun? Lecture 3: The solar atmosphere
 What do we see on the face of the Sun? Lecture 3: The solar atmosphere The Sun s atmosphere Solar atmosphere is generally subdivided into multiple layers. From bottom to top: photosphere, chromosphere,
The Birth of A Coronal Mass Ejection
 The Birth of A Coronal Mass Ejection Tingyu Gou 1,2, Rui Liu 1,3, Bernhard Kliem 4,5, Yuming Wang 1,3,6, Astrid M. Veronig 2 arxiv:1811.477v1 [astro-ph.sr] 12 Nov 18 1 CAS Key Laboratory of Geospace Environment,
Exploring the Role of Magnetic Reconnection in Solar Eruptive Events
 Exploring the Role of Magnetic Reconnection in Solar Eruptive Events Jiong Qiu Physics Department, Montana State University, Bozeman MT 59717-3840, USA Abstract. We summarize our recent progress in investigating
Coronal Magnetic Field Measurement from EUV Images made by the Solar Dynamics. Observatory
 Coronal Magnetic Field Measurement from EUV Images made by the Solar Dynamics Observatory Nat Gopalswamy 1, Nariaki Nitta 2, Sachiko Akiyama 1,3, Pertti Mäkelä 1,3, and Seiji Yashiro 1,3 1 NASA Goddard
Toward Interplanetary Space Weather: Strategies for Manned Missions to Mars
 centre for fusion, space and astrophysics Toward Interplanetary Space Weather: Strategies for Manned Missions to Mars Presented by: On behalf of: Jennifer Harris Claire Foullon, E. Verwichte, V. Nakariakov
A broken solar type II radio burst induced by a coronal shock propagating across the streamer boundary
 A broken solar type II radio burst induced by a coronal shock propagating across the streamer boundary X. L. Kong 1,2, Y. Chen 1, G. Li 3,1, S. W. Feng 1, H. Q. Song 1, F. Guo 4, and F. R. Jiao 1 ABSTRACT
Astronomy 404 October 18, 2013
 Astronomy 404 October 18, 2013 Parker Wind Model Assumes an isothermal corona, simplified HSE Why does this model fail? Dynamic mass flow of particles from the corona, the system is not closed Re-write
Solar Astrophysics with ALMA. Sujin Kim KASI/EA-ARC
 Solar Astrophysics with ALMA Sujin Kim KASI/EA-ARC Contents 1. The Sun 2. ALMA science targets 3. ALMA capabilities for solar observation 4. Recent science results with ALMA 5. Summary 2 1. The Sun Dynamic
ISOON-BASED INVESTIGATION OF SOLAR ERUPTIONS
 AFRL-RV-PS- TR-2014-0007 AFRL-RV-PS- TR-2014-0007 ISOON-BASED INVESTIGATION OF SOLAR ERUPTIONS Edward W. Cliver 30 October 2013 Final Report APPROVED FOR PUBLIC RELEASE; DISTRIBUTION IS UNLIMITED. AIR
Photospheric and chromospheric polarimetry of solar flares
 Photospheric and chromospheric polarimetry of solar flares Lucia Kleint, Fachhochschule Nordwestschweiz Alberto Sainz Dalda, Stanford University Phil Judge, HAO/NCAR Kevin Reardon, National Solar Observatory
1. Solar Atmosphere Surface Features and Magnetic Fields
 1. Solar Atmosphere Surface Features and Magnetic Fields Sunspots, Granulation, Filaments and Prominences, Coronal Loops 2. Solar Cycle: Observations The Sun: applying black-body radiation laws Radius
Radoslav Bucik (MPS) in collaboration with Davina E. Innes (MPS) & Glenn M. Mason (JHU)
 in collaboration with Davina E. Innes (MPS) & Glenn M. Mason (JHU)") -MPS SGS 2014 Oct 14- MPS PRESS RELEASE STEREO & ACE SCIENCE HIGHLIGHTS nominated to NASA HELIOPHYSICS GPRAMA ITEM Radoslav Bucik (MPS) in collaboration with Davina E. Innes (MPS) & Glenn M. Mason (JHU)
-MPS SGS 2014 Oct 14- MPS PRESS RELEASE STEREO & ACE SCIENCE HIGHLIGHTS nominated to NASA HELIOPHYSICS GPRAMA ITEM Radoslav Bucik (MPS) in collaboration with Davina E. Innes (MPS) & Glenn M. Mason (JHU)
Quasi-Periodic Pulsations in Solar Flares RHESSI 15 Meeting. Peter T. Gallagher, Brian Dennis, Jack Ireland, Andrew Inglis 29 July 2016
 RHESSI 15 Meeting Peter T. Gallagher, Brian Dennis, Jack Ireland, Andrew Inglis 29 July 2016 Quasi-Periodic Pulsations (QPP) in Solar Flares Outline Observational Introduction to QPP & Why Interesting
arxiv: v1 [astro-ph.sr] 8 Jul 2017
![arxiv: v1 [astro-ph.sr] 8 Jul 2017](/thumbs/83/87091540.jpg "arxiv: v1 [astro-ph.sr] 8 Jul 2017") Elongation of Flare Ribbons Jiong Qiu 1, Dana W. Longcope 1, Paul A. Cassak 2, Eric R. Priest 3 arxiv:1707.02478v1 [astro-ph.sr] 8 Jul 2017 1. Department of Physics, Montana State University, Bozeman MT
Elongation of Flare Ribbons Jiong Qiu 1, Dana W. Longcope 1, Paul A. Cassak 2, Eric R. Priest 3 arxiv:1707.02478v1 [astro-ph.sr] 8 Jul 2017 1. Department of Physics, Montana State University, Bozeman MT
Energy release and transport in solar flares & CMEs
 UCL DEPARTMENT OF SPACE AND CLIMATE PHYSICS MULLARD SPACE SCIENCE LABORATORY Energy release and transport in solar flares & CMEs Sarah Matthews Red RHESSI 6-12 kev, blue 50-100 kev, gold images TRACE 195A
EFFECTS OF MAGNETIC TOPOLOGY ON CME KINEMATIC PROPERTIES
 EFFECTS OF MAGNETIC TOPOLOGY ON CME KINEMATIC PROPERTIES Wei Liu (1), Xue Pu Zhao (1), S. T. Wu (2), Philip Scherrer (1) (1) W. W. Hansen Experimental Physics Laboratory, Stanford University, Stanford,
Temperature Reconstruction from SDO:AIA Filter Images
 Temperature Reconstruction from SDO:AIA Filter Images A report by Chris Gilbert Astrophysical and Planetary Sciences, University of Colorado Boulder ASTR 5700; Stellar Astrophysics, Spring 2016 Abstract
High energy particles from the Sun. Arto Sandroos Sun-Earth connections
 High energy particles from the Sun Arto Sandroos Sun-Earth connections 25.1.2006 Background In addition to the solar wind, there are also particles with higher energies emerging from the Sun. First observations
Double Coronal Hard and Soft X-Ray Source as Evidence of Magnetic Reconnection: The M1.4 Flare 1
 Chapter 4 Double Coronal Hard and Soft X-Ray Source as Evidence of Magnetic Reconnection: The 2002-04-30 M1.4 Flare 1 4.1 Introduction In the classical reconnection model (e.g., Petschek, 1964) magnetic
Understanding Eruptive Phenomena with Thermodynamic MHD Simulations
 Understanding Eruptive Phenomena with Thermodynamic MHD Simulations Jon Linker, Zoran Mikic, Roberto Lionello, Pete Riley, and Viacheslav Titov Science Applications International Corporation San Diego,
Solar Radio Bursts from the Ground
 Solar Radio Bursts from the Ground Introduce new facility relevant for SHINE community: GBSRBS Quick review of solar radio bursts Revisit the CME/Type II discussion Green Bank Solar Radio Burst Spectrometer
arxiv: v1 [astro-ph.sr] 27 Jun 2015
![arxiv: v1 [astro-ph.sr] 27 Jun 2015](/thumbs/87/95691016.jpg "arxiv: v1 [astro-ph.sr] 27 Jun 2015") Extreme Ultraviolet Imaging of Three-dimensional Magnetic Reconnection in a Solar Eruption J. Q. Sun 1, X. Cheng 1, M. D. Ding 1, Y. Guo 1, E. R. Priest 2, C. E. Parnell 2, S. J. Edwards 3, J. Zhang 4,
Extreme Ultraviolet Imaging of Three-dimensional Magnetic Reconnection in a Solar Eruption J. Q. Sun 1, X. Cheng 1, M. D. Ding 1, Y. Guo 1, E. R. Priest 2, C. E. Parnell 2, S. J. Edwards 3, J. Zhang 4,
arxiv: v1 [astro-ph.sr] 22 Oct 2018
![arxiv: v1 [astro-ph.sr] 22 Oct 2018](/thumbs/89/99429614.jpg "arxiv: v1 [astro-ph.sr] 22 Oct 2018") Draft version October 23, 218 Typeset using LATEX default style in AASTeX61 GENESIS AND IMPULSIVE EVOLUTION OF THE 217 SEPTEMBER 1 CORONAL MASS EJECTION Astrid M. Veronig, 1, 2 Tatiana Podladchikova, 3
Draft version October 23, 218 Typeset using LATEX default style in AASTeX61 GENESIS AND IMPULSIVE EVOLUTION OF THE 217 SEPTEMBER 1 CORONAL MASS EJECTION Astrid M. Veronig, 1, 2 Tatiana Podladchikova, 3
Publ. Astron. Obs. Belgrade No. 90 (2010), A CASE OF FILAMENT ACTIVE REGION INTERACTION
, A CASE OF FILAMENT ACTIVE REGION INTERACTION") Publ. Astron. Obs. Belgrade No. 90 (2010), 125-130 Contributed Paper A CASE OF FILAMENT ACTIVE REGION INTERACTION Astronomical Institute of the Romanian Academy, Str. Cuţitul de Argint 5, 040557 Bucharest,
Publ. Astron. Obs. Belgrade No. 90 (2010), 125-130 Contributed Paper A CASE OF FILAMENT ACTIVE REGION INTERACTION Astronomical Institute of the Romanian Academy, Str. Cuţitul de Argint 5, 040557 Bucharest,
STRONGLY BLUESHIFTED PHENOMENA OBSERVED WITH HINODE EIS IN THE 2006 DECEMBER 13 SOLAR FLARE
 The Astrophysical Journal, 685:622Y628, 2008 September 20 # 2008. The American Astronomical Society. All rights reserved. Printed in U.S.A. STRONGLY BLUESHIFTED PHENOMENA OBSERVED WITH HINODE EIS IN THE
arxiv: v1 [astro-ph.sr] 10 Nov 2014
![arxiv: v1 [astro-ph.sr] 10 Nov 2014](/thumbs/81/83192540.jpg "arxiv: v1 [astro-ph.sr] 10 Nov 2014") Imaging and spectroscopic observations of magnetic reconnection and chromospheric evaporation in a solar flare arxiv:4.30v [astro-ph.sr] 0 Nov 04 Hui Tian, Gang Li, Katharine K. Reeves, John C. Raymond,
Imaging and spectroscopic observations of magnetic reconnection and chromospheric evaporation in a solar flare arxiv:4.30v [astro-ph.sr] 0 Nov 04 Hui Tian, Gang Li, Katharine K. Reeves, John C. Raymond,
Fractal Structure (Turbulence) and SOC of a Current Sheet in a Solar Flare via Dynamic Magnetic Reconnection
 and SOC of a Current Sheet in a Solar Flare via Dynamic Magnetic Reconnection") 16-20 Sep 2013 ISSI team meating@bern ``Turbulence and Self-Organized Criticality 17 Sep 2013 (Tue), 09:30h-10:30h Fractal Structure (Turbulence) and SOC of a Current Sheet in a Solar Flare via Dynamic
16-20 Sep 2013 ISSI team meating@bern ``Turbulence and Self-Organized Criticality 17 Sep 2013 (Tue), 09:30h-10:30h Fractal Structure (Turbulence) and SOC of a Current Sheet in a Solar Flare via Dynamic
The Structure of the Sun. CESAR s Booklet
 How stars work In order to have a stable star, the energy it emits must be the same as it can produce. There must be an equilibrium. The main source of energy of a star it is nuclear fusion, especially
RADIO PULSATIONS IN THE m dm BAND: CASE STUDIES
 RADIO PULSATIONS IN THE m dm BAND: CASE STUDIES M. Messerotti, P. Zlobec, A. Veronig, and A. Hanslmeier Abstract Radio pulsations are observed during several type IV bursts in the metric and decimetric
STUDY OF RIBBON SEPARATION OF A FLARE ASSOCIATED WITH A QUIESCENT FILAMENT ERUPTION Haimin Wang, 1,2,3 Jiong Qiu, 3 Ju Jing, 2,3 and Hongqi Zhang 1
 The Astrophysical Journal, 593:564 570, 2003 August 10 # 2003. The American Astronomical Society. All rights reserved. Printed in U.S.A. STUDY OF RIBBON SEPARATION OF A FLARE ASSOCIATED WITH A QUIESCENT
Long term data for Heliospheric science Nat Gopalswamy NASA Goddard Space Flight Center Greenbelt, MD 20771, USA
 Long term data for Heliospheric science Nat Gopalswamy NASA Goddard Space Flight Center Greenbelt, MD 20771, USA IAU340 1-day School, Saturday 24th February 2018 Jaipur India CMEs & their Consequences
Solar flare mechanism based on magnetic arcade reconnection and island merging
 Earth Planets Space, 53, 597 604, 2001 Solar flare mechanism based on magnetic arcade reconnection and island merging C. Z. Cheng and G. S. Choe Princeton Plasma Physics Laboratory, Princeton University,
Explosive Solar Phenomena. Nat Gopalswamy NASA/GSFC
 Explosive Solar Phenomena Nat Gopalswamy NASA/GSFC Africa Space Science School Kigali Rwanda July 1 2014 What are explosive phenomena? These phenomena represent sudden release of energy on the sun, confined
Why is the Solar Corona So Hot? James A. Klimchuk Heliophysics Divison NASA Goddard Space Flight Center
 Why is the Solar Corona So Hot? James A. Klimchuk Heliophysics Divison NASA Goddard Space Flight Center Total Solar Eclipse Aug. 1, 2008 M. Druckmuller Coronal Soft X-rays Yohkoh / SXT Surface Magnetic
Height of Shock Formation in the Solar Corona Inferred from Observations of Type II Radio Bursts and Coronal Mass Ejections
 Height of Shock Formation in the Solar Corona Inferred from Observations of Type II Radio Bursts and Coronal Mass Ejections N. Gopalswamy, H. Xie, P. Mäkelä, S. Yashiro, S. Akiyama Code 671, NASA Goddard