A Deep Hubble Space Telescope H-Band Imaging Survey of Massive Gas-Rich Mergers. II. The QUEST QSOs 1
|
|
|
- Vivien Griffin
- 6 years ago
- Views:
Transcription
1 A Deep Hubble Space Telescope H-Band Imaging Survey of Massive Gas-Rich Mergers. II. The QUEST QSOs 1 S. Veilleux 2, D.-C. Kim 3, and D. S. N. Rupke 4 Department of Astronomy, University of Maryland, College Park, MD 20742; veilleux@astro.umd.edu, ddk3wc@mail.astro.virginia.edu, drupke@ifa.hawaii.edu C. Y. Peng Herzberg Institute of Astrophysics, National Research Council of Canada, 5071 West Saanich Rd., Victoria, BC V9E 2E7, Canada; cyp@nrc-cnrc.gc.ca L. J. Tacconi, R. Genzel, D. Lutz, E. Sturm, A. Contursi, and M. Schweitzer Max-Planck-Institut für extraterrestrische Physik, Postfach 1312, D Garching, Germany; linda@mpe.mpg.de, genzel@mpe.mpg.de, lutz@mpe.mpg.de, sturm@mpe.mpg.de, contursi@mpe.mpg.de, schweitzer@mpe.mpg.de K. M. Dasyra Spitzer Science Center, Mail Code 220-6, California Institute of Technology, 1200 East California Boulevard, Pasadena, CA 91125; dasyra@ipac.caltech.edu L. C. Ho The Observatories of the Carnegie Institution of Washington, 813 Santa Barbara St., Pasadena, CA 91101; lho@ociw.edu D. B. Sanders Institute for Astronomy, University of Hawaii, 2680 Woodlawn Drive, Honolulu, HI 96822; sanders@ifa.hawaii.edu A. Burkert University Observatory Munich, Scheinerstrasse 1, D Munich, Germany; burkert@usm.uni-muenchen.de ABSTRACT We report the results from a deep HST NICMOS H-band imaging survey of 28 z < 0.3 QSOs from the Palomar-Green (PG) sample. This program is
2 2 part of QUEST (Quasar / ULIRG Evolution STudy) and complements a similar set of data on 26 highly-nucleated ULIRGs presented in Paper I. Our analysis indicates that the fraction of QSOs with elliptical hosts is higher among QSOs with undetected far-infrared (FIR) emission, small infrared excess (L IR /L B < 10), and luminous hosts. The hosts of FIR-faint QSOs show a tendency to have less pronounced merger-induced morphological anomalies and larger QSO-to-host luminosity ratios on average than the hosts of FIR-bright QSOs, consistent with late-merger evolution from FIR-bright to FIR-faint QSOs. The spheroid sizes ( kpc) and total host luminosities ( L H ) of the radio-quiet PG QSOs in our sample are statistically indistinguishable from the ULIRG hosts presented in Paper I, while those of radio-loud PG QSOs are systematically larger and more luminous. ULIRGs and PG QSOs with elliptical hosts fall near, but not exactly on, the fundamental plane of inactive spheroids. We confirm the systematic trend noted in Paper I for objects with small ( 2 kpc) spheroids to be up to 1 mag. brighter than inactive spheroids. The host colors and wavelength dependence of their sizes support the idea that these deviations are due at least in part to non-nuclear star formation. However, the amplitudes of these deviations depend mainly on host sizes, and possibly on infrared excess, but not on merger phase, QSO-to-host luminosity ratio, optical spectral type, AGN fractional contribution to the bolometric luminosity, or host R H color. Taken at face value (i.e., no correction for extinction or the presence of a young stellar population), the H-band spheroid-host luminosities imply black hole masses M and sub-eddington mass accretion rates for both QSOs and ULIRGs. These results are compared with published black hole mass estimates derived from other methods. Subject headings: galaxies: active galaxies: interactions galaxies: quasar galaxies: starburst infrared: galaxies 1 Based on observations with the NASA/ESA Hubble Space Telescope, obtained at the Space Telescope Science Institute, which is operated by the Association of Universities for Research in Astronomy, Inc. under NASA contract No. NAS Also: Max-Planck-Institut für extraterrestrische Physik, Postfach 1312, D Garching, Germany 3 New address: Department of Astronomy, University of Virginia, Charlottesville, VA New address: Institute for Astronomy, University of Hawaii, 2680 Woodlawn Drive, Honolulu, HI
3 3 1. Introduction In this series of papers, the structural properties of massive gas-rich mergers in the local universe are derived to provide insights into galaxy merging, a key driving force of galaxy evolution over the history of the universe. This study is part of a comprehensive program called QUEST - Quasar/ULIRG Evolution Study. This program combines optical and nearinfrared imaging and spectroscopic data obtained from the ground with H-band imaging and mid-infrared spectroscopic data obtained with the Hubble Space Telescope (HST) and Spitzer Space Telescope, respectively (see Veilleux et al and references therein, for a more detailed discussion of QUEST). In Veilleux et al. (2006; hereafter Paper I), we reported the results from a Cycle 12 HST NICMOS H-band imaging survey of 26 z < 0.3 ULIRGs and 7 infrared-bright Palomar- Green (PG) QSOs. Unsuspected double nuclei were detected in 5 ULIRGs. The great majority (81%) of the single-nucleus systems showed a prominent elliptical-like morphology. However, low-surface-brightness exponential disks were detected on large scale in at least 4 of these sources. The hosts of warm (IRAS 25-to-60 µm flux ratio, f 25 /f 60 > 0.2), AGN-like systems were found to be elliptical-like and have less pronounced merger-induced morphological anomalies than the hosts of cool systems with LINER or HII region-like nuclear optical spectral types, suggestive of merger-driven evolution from cool to warm ULIRGs. The host sizes and luminosities of the 7 PG QSOs in the sample were statistically indistinguishable from those of the ULIRG hosts. The hosts of ULIRGs and PG QSOs were found to lie close to the locations of intermediate-luminosity ( L ) spheroids in the photometric projection of the fundamental plane (FP) of ellipticals. However, ULIRGs with small hosts were found to be generally brighter than normal inactive spheroids, possibly due to excess near-infrared emission from a circumnuclear starburst. The 7 PG QSOs in the Cycle 12 sample were selected to be far-infrared (FIR) brighter than typical PG QSOs. Netzer et al. (2007) have recently argued that the bulk of the infrared luminosity, L IR L(8 1000µm), in PG QSOs is produced by a massive starburst. So it is not clear whether the Cycle 12 results can be generalized to PG QSOs as a whole. Here we report the results from an analysis of 21 additional PG QSOs to address this issue. In Section 2, we describe the sample of QSOs used in our study along the extensive ancillary dataset on these objects. Our methods to obtain, reduce, and analyze the data are very similar to those used in Paper I, so we discuss them only briefly in Section 3. The results are presented in Section 4 and discussed and compared with those of earlier studies in Section 5. The main conclusions are summarized in Section 6. Throughout this paper, we adopt H 0 = 75 km s 1 Mpc 1, Ω M = 0.3, and Ω Λ = 0.7.
4 4 2. QSO Sample & Ancillary Data The QSO component of QUEST has already been discussed in detail in Schweitzer et al. (2006, 2008), Netzer et al. (2007), and Veilleux et al. (2009) and this detailed discussion will not be repeated here. The Cycle 15 HST sample consists of 23 z 0.3 quasars, including 22 Palomar-Green (PG) quasars from the Bright Quasar Sample (Schmidt & Green 1983) and another one (B A = 4C 31.63) with a B magnitude that actually satisfies the PG QSO completeness criterion of Schmidt & Green (1983). Failure to acquire guide stars with the Fine Guidance Sensors severely degraded the observations for two of these objects (PG and PG ), so they are not discussed any further in the paper. The combined sample of 28 PG QSOs successfully observed during Cycles 12 and 15 covers the low-redshift and low B-band luminosity ends of the PG QSO sample (see Figure 2 in Veilleux et al. 2009), and they are well matched in redshift with the 1-Jy ULIRGs studied in Paper I (Figure 3 of Veilleux et al. 2009). The combined sample of QSOs is representative of the entire PG QSO sample in terms of infrared excess (i.e., the infrared-to-blue luminosity ratio, L IR /L B ), and FIR brightness [L(60 µm)/l(15 µm), Netzer et al. 2007]. Table 1 lists some of the properties of the QSOs in our study, including those observed during Cycle 12. Note that three of the QSOs in the HST sample (PG , , and ) have absolute B-band magnitudes which are fainter than the traditional luminosity threshold of QSOs (M B = 23 for H 0 = 50 km s 1 Mpc 1 and q 0 = 0 or M B = for the cosmology adopted here). An extensive set of data already exists on these objects. Ground-based optical and near-infrared images of many of these objects have been obtained in tip-tilt mode (Surace et al. 2001) and adaptive-optics mode (Guyon et al. 2006), providing a spatial resolution of and , respectively, i.e., only slightly poorer than that of the HST data presented here ( 0. 14). However, a key advantage of the present data over previous data sets is the stability of the HST point-spread function, which allows us to derive reliable structural parameters of the QSO hosts well within 1 of the center. Archival optical HST images of several local type 1 AGN, including some from the present sample, were recently analyzed by two in our group (C.Y.P., L.C.H.) and published as Kim et al. (2008a), and also independently studied by Hamilton et al. (2008). The results from these previous studies are compared with those from our HST survey in Sections 4 and 5. All of these QSOs have also been studied spectroscopically at optical wavelengths from the ground (Boroson & Green 1992) and in the mid-infrared with Spitzer (Schweizer et al. 2006, 2008; Netzer et al. 2007; Veilleux et al. 2009). This last dataset provides valuable information on the AGN contribution to the bolometric luminosities of these objects; we make use of this information in Section 5. In addition, VLT/Keck near-infrared spectroscopic data exist for a number of
5 5 these objects. Dynamical estimates of the masses of the hosts were derived from these data (Dasyra et al. 2007) and are compared with our photometric estimates in Section Data Acquisition, Reduction, and Analysis The methods used to acquire, reduce and analyze the present data are nearly identical to those of Paper I, so only a summary is given below; interested readers should refer to Paper I for more detail. The main driver of our Cycle 15 program on the QSOs was to match the observational setup (instrument, filter, detection level, dither pattern) used for our Cycle-12 data to facilitate comparisons between the two datasets. Our Cycle-12 results have confirmed that the excellent spatial resolution and sensitivity of HST NICMOS in the non-thermal infrared are required to extract the central point sources from our targets and derive accurate structural parameters on the hosts. NICMOS is better suited for this program than ACS to reduce the impact of dust extinction and star formation on the measurements (especially in the cores of ULIRGs and infrared bright QSOs) and to exploit the contrast between QSO and elliptical hosts (e.g., McLeod & McLeod 2001 and references therein). The strong thermal background makes deep observations at K unrealistic; our program therefore focuses on the H band, roughly matching the waveband of our VLT and Keck spectra. The need for deep images can hardly be overstated. Comparisons of our Cycle-12 data with the results derived from shallow (e.g., SNAP) HST images from the archives show that the shallow HST data underestimate the luminosities and half-light radii of the hosts, make profile fitting ambiguous (e.g., Sérsic spheroid versus exponential disk), and can even completely overlook low surface brightness, tidal distortions or exponential disks extending significantly beyond galactic bulges. To avoid these problems, we tried to match the detection level (S/N 3) of our Cycle-12 data ( 22.0 H mag. arcsec 2 ) by observing each target for one full orbit (on-target exposure time of 2650 seconds). NIC2 was selected for our Cycle 15 program, based on the requirements of good sensitivity to low surface brightness features, excellent spatial resolution ( pixel 1 ) for accurate PSF (FWHM = 0. 14) removal, and a field of view ( ) large enough to encompass most of the structures in our targets. To help with the PSF subtraction, we also requested an additional orbit to obtain a deep exposure of a star (SA ) and fully characterize the PSF at H. Given the redshifts of our targets (z ; Table 1) and the strengths of the emission features in ULIRGs and QSOs (see, e.g., Veilleux et al. 1997, 1999; Dasyra et al.
6 6 2007), contamination by emission lines (e.g., [Fe II] λ1.644, Paβ) is at most 10% for the F160W filter, and is therefore not an issue here. We used the logarithmic MULTIAC- CUM sequences to provide the largest dynamic range and allow the calibration software to recover the bright central point source. The telescope was dithered between exposures to better sample the instrumental PSF, and to aid with the recognition and elimination of data artifacts. The raw HST NICMOS data were first processed with the IDL procedure undopuft.pro written by Eddie Bergeron at STScI (Space Telescope Science Institute) to remove the electronic echoes of bright sources and associated stripes, and subsequently processed with the standard pipeline processing task calnica within IRAF/STSDAS to correct for nonlinearity of the detector and removes bias value, dark current, amplifier glow, and shading. The IDL procedure saa clean.pro was used to remove the effects of cosmic ray persistence (Bergeron & Dickinson 2003). Next, the four dithered exposures of each object were combined using the drizzle technique (Gonzaga et al. 1998). For the photometric calibration of the reduced data, a Vega-normalized magnitude for F160W (NIC2) was derived following the recipe in the HST Data Handbook for NICMOS (Dickinson et al. 2002) using the calibration appropriate for Cycle 15. The two-dimensional fitting algorithm GALFIT (Peng et al. 2002) was used to accurately remove the central point source in each object and determine the structural parameters of the underlying host. In some cases, the analysis was carried out a second time by other members of our group to independently verify the significance of the results. The analysis of each object followed a number of well-defined steps. First, we constructed a mask to exclude bright stars or small foreground/background galaxies within the field of view. Next, we proceeded to fit the surface brightness distribution of each object using a single Sérsic component (observed intensity profile I exp[ R 1/n ]) to simulate the galaxy host and a PSF model to account for the possibility of an unresolved nuclear starburst or AGN. The high- S/N PSF model was derived from our deep images of SA The Sérsic component was convolved with the PSF before comparison with the data. Three Sérsic components were examined: n = free (i.e., left unconstrained), n = 1 (exponential disk profile), and n = 4 (de Vaucouleurs profile). In all cases, the centroids of the PSF and Sérsic components were left unconstrained. This relatively simple one galaxy component analysis allowed us to get a general sense of the complexity of each system and whether the system is disk- or spheroid-dominated. As was the case for the ULIRGs and infrared-bright QSOs in Paper I, the residuals from the one component galaxy fit to the QSOs are often quite significant. This is generally the results of merger-induced morphological anomalies. However, in other cases, these
7 7 residuals may indicate the presence of a second low-surface-brightness galaxy component (e.g., disk). So we decided to look into this possibility by adding a second (PSF-convolved) galaxy component to the fits for each object and examining the effects on the goodness of the fits. To limit our search, we only studied the (n = 1) + (n = 4) case. Here again, the centroids of the various components were left unconstrained. Not surprisingly given the larger number of free parameters, these two-component models generally provide better fits to the data. However, a careful examination of the fitted components often indicate that the second galaxy component is not physically meaningful (see list of telltale signs in Section 5.2 of Paper I). The surest way to recognize when a second galaxy component is real is to put back into the residual image the model components individually to see which structure was being fitted. The components have to be fairly distinct both spatially (e.g. axis ratio, size, centering) and morphologically (concentration) for us to accept the two components as being real in our assessment. This procedure provided reliable host-galaxy structural parameters for all but 3 objects in our sample (see Section 4.1 for a discussion of the measurement uncertainties). For PG , PG , and PG , significant residuals due to PSF mismatches were found near the cores of these objects. The structural parameters derived for these objects are considered unreliable and not included in our search for trends (Section 4) and discussion (Section 5). 4. Results 4.1. General Considerations & Uncertainties The main results from the GALFIT analysis are shown in Figures 1 and 2 and listed in Tables 2 5 (readers who are looking for a quick summary of the results should refer to Table 5). Figure 1 presents the residuals found after subtracting one galaxy component models (PSF + Sérsic with n = free, 1, or 4) from the surface brightness distributions of singlenucleus systems in our sample. In several cases, we find that adding another Sérsic component significantly improves the goodness of the fits; the results of this more sophisticated two galaxy component analysis are shown in Figure 2. The structural parameters derived from the one and two galaxy component fits are listed in Tables 2 and 3, respectively. Note that the exact value of n > 4 is not too significant. It generally indicates the galaxy has either a strong core (e.g., bulge dominated) or an extended wing (e.g. elliptical galaxies or interacting/neighboring galaxies), or both. Large n can be caused by bad AGN subtraction, but we tried to minimize that likelihood by using multiple components for the core. We also tried to minimize neighboring contamination by fitting the neighbors and/or masking.
8 8 Indeed, our images often show small galaxies in the vicinity of the PG QSOs, but they are considerably fainter ( m H 4 mags) than the QSO hosts. We have no data to determine if these small objects are associated or not with the QSOs, so we list the magnitudes of the objects in a separate table, Table 4, but do not discuss them any further in this paper. Table 5 provides a summary of the best-fitting model for each object in the sample along with a visual (hence subjective) assessment of the presence of a stellar bar, spiral arms, and strong merger-induced disturbances. The best-fitting models listed in this table were adopted by inspecting the residuals in Figures 1 and 2 and the reduced chi-squares, χ 2 ν, listed in Tables 2 and 3. The first of these χ 2 ν values takes into account residuals over the entire galaxy whereas the second one excludes the central portion which is affected by errors in the subtraction of the central PSF. These reduced chi-squares values should be used with caution when choosing the best fits. First, we note that they are generally significantly larger than unity so the fits are not formally very good. This is due in large part to the presence of merger-induced morphological anomalies; we return to this important point below (Section 4.3). We also notice that the chi-squares tend to be higher for larger, brighter, and more PSF-dominated objects. This is not unexpected given the definition of χ 2 ν, which is not normalized by the intensity, and given that the fraction of the detector area that is free of galaxy emission is more limited for large systems than for small ones. Thus, χ 2 ν cannot be used to compare the goodness of fits between objects. However, it is a useful quantity to compare the quality of fits for the same object (the interested readers should refer to Sections 5 and 6 of Paper I for a more detailed discussion of the factors involved in our morphological classification). The NIC2 observations of the QUEST sample have very high signal-to-noise, therefore the uncertainties in the fit parameters are generally dominated by systematic errors rather than random errors due to Poisson noise. Systematic errors come about from several factors, the most common ones being a mismatch in the PSF between the data and the model, a mismatch between the galaxy profile with the model assumptions, or when the sky background cannot be determined accurately for various reasons. Even though the errors are systematic, in AGN studies where PSF mismatch is great, there is some randomness involved in the sense that different PSF choices we make are drawn from a distribution around some average PSF shape. In high signal-to-noise, the amount of systematic error depends on the luminosity contrast between the host galaxy and the AGN component. The typical contrast in the QUEST sample of AGN-to-host luminosity (Table 5, Col. 6) ranges mostly between 1 and 5, with a median of 1.5. Kim et al. (2008b) performed very detailed AGN image fitting simulations which can be used to estimate the uncertainty in the fitting parameters. Their study quantified the degree
9 9 of measurement uncertainty by drawing on different PSFs. The scatter and systematic errors are also presented as a function of signal-to-noise, AGN-to-host contrast, and the size of the host galaxy, due to different PSF choices. Therefore we mostly draw upon that study to infer that the systematic uncertainty for the QUEST sample to be about 10% for the host galaxy luminosity. The random uncertainty due to our ignorance about the PSF are roughly: 20-50% for the effective radius, 15% for the host galaxy luminosity, and < 10% for the AGN luminosity. We can also empirically quantify the uncertainty in the host luminosity Columns 4 (host luminosity including tidal features) and 5 (model host luminosity) in Table 5, from which we obtain an uncertainty of roughly 15%. Note that the host galaxies of PG , PG , PG , PG , and PG cover a significant fraction of the field of view of NIC2. The sky background is therefore difficult to determine accurately in these images and the structural parameters of these objects are more uncertain. This is noted in Tables 2, 3, and Morphological Type of Host Galaxy The one galaxy component analysis indicates that a single spheroidal component often provides a good fit to the surface brightness distribution of the central portion of the PG QSO hosts. However, the excellent sensitivity limit of our data allows us to also detect the presence of faint, low-surface-brightness disks in 9/28 (32%) objects The results of our attempts to fit this second component as an exponential disk are listed in Table 3 and shown in Figure 2. Table 5 only lists the results for those nine cases where the addition of a second, n = 1 component improved the fit significantly and the result was physically meaningful (e.g., the disk had to be concentric with, and larger than, the bulge). Note that stellar bars are present in at least two of these QSOs (PG and PG ; already pointed out by Surace et al. 2001). A stellar bar may also be present in the elliptical host of PG , but the presence of small-scale features in this last object limits the analysis. Trends are seen between morphological classification and infrared properties. QSOs with elliptical hosts have slightly smaller infrared excesses (Figure 3d). The median L IR /L B ratio among elliptical, bulge + disk, ambiguous hosts is 8.5, 10.5, and 10.4, respectively. This trend fits naturally with the results of Paper I, where we found that ULIRGs with warm 25-to-60 µm ratios, small infrared excesses, and optical Seyfert characteristics tend to have elliptical hosts (Figures 3a and 3b). This trend is also consistent with, although weaker than, that from the study of Guyon et al. (2006). Interestingly, QSOs with elliptical hosts do not have larger 25-to-60 µm ratios than
10 10 those with bulge + disk or ambiguous hosts (Figure 3c, median ratios of 0.32, 0.50, and 0.41, respectively). So it appears that the trend seen in Paper I between this ratio and the morphological classification of ULIRGs breaks down at the smaller infrared excesses of typical QSOs. We also note in Figure 3e that all FIR-undetected QSOs have elliptical hosts. But this may be due to the fact that most of these QSOs are also bolometrically luminous. Indeed, we find that the more luminous QSOs in our sample favor elliptical hosts over late-type hosts (Figure 3f). Three of the five radio-loud QSOs in our sample have elliptical hosts. These results bring further support for a luminosity and radio-loudness dependence of the host morphological type among QSOs (e.g., Dunlop et al. 2003, Guyon et al. 2006, Paper I; Best et al. 2007; Wolf & Sheinis 2008 and references therein; see also Section 5.1 below) Strength of Tidal Features Signs of galactic interactions such as tidal tails and bridges, lopsided disks, distorted outer isophotes, or double nuclei are visible in the majority (16/28 = 57%) of the QSOs (and in all ULIRGs, Paper I). The residual maps in Figures 1 and 2 are a particularly good indicator of these tidal features. Following Paper I, we quantified the importance of these features by first adding up the absolute values of the residuals from the best one or two galaxy component fits over the region unaffected by the PSF subtraction and then normalizing this quantity to the total host luminosities (including tidal features); the results are listed in column (11) of Tables 2 and 3. Although this quantity is sensitive to the presence of spiral structure, dust lanes, and bright star clusters, we find in our objects that R 2 is dominated by the presence of large-scale merger-induced anomalies. In Figure 4a and 4b, we plot R 2 versus the IRAS 25-to-60 µm colors for all QSOs and ULIRGs in our sample. PG QSOs and warm quasar-like ULIRGs systems tend to have smaller residuals than the other objects in the sample. All PG QSOs and Seyfert ULIRGs have R 2 < 30%. In Paper I, we found that ULIRGs with late-type or ambiguous morphologies show larger residuals than elliptical systems (Figure 5b), suggesting that galaxies with a prominent spheroid are in the later stages of a merger than the late-type and ambiguous systems. Our new data on the PG QSOs do show a similar difference between elliptical and ambiguous systems (the residuals from the two galaxy component fits are expected to be smaller than those from the one galaxy component fits, so the bulge + disk systems are not considered in our discussion). In Figures 4c and 4d, we compare the fit residuals with the magnitude of the infrared
11 11 excess as a function of morphological classification and FIR strength, respectively. We find a slight trend of increasing residuals with increasing infrared excess and FIR strength, indicating that stronger merger-induced morphological disturbances are found among FIRbright QSOs with large infrared excesses, as was suggested by Guyon et al. (2006). The FIR emission in QSOs is now believed to be primarily associated with starburst activity (Netzer et al. 2007), so this result indicates that starburst activity declines during the final phases of the merger process, consistent with recent numerical simulations of major equal-mass ( 1:1) mergers (e.g., Johansson et al. 2009). Note that the presence of discernible disks in several low-luminosity PG QSOs can also be explained in the major merger scenario if significant re-accretion of residual cold gas formed these disks (e.g., Governato et al. 2008). In these systems, local processes such as gas inflows along nuclear bars or spiral arms may also be contributing to the feeding of the AGN (e.g., Storchi-Bergmann et al and references therein) Strength of Unresolved Nucleus Following Paper I, we quantified the importance of the PSF by calculating the flux ratio of the PSF to the host, I PSF /I host using the best one or two galaxy component model for each object. In Paper I, we found that this ratio is less than unity for all ULIRGs, except for all 5 ULIRGs optically classified as Seyfert 1s. Figure 5a shows that most PG QSOs have PSF-to-host ratios above unity, indistinguishable from those of Seyfert 1 ULIRGs. The PG QSOs strengthen the positve correlation noted in Paper I between the PSF-to-host ratio and IRAS 25-to-60 µm color. The AGN therefore dominates the central H-band emission in Seyfert 1 ULIRGs and QSOs. As noted in Paper I, this result does not rule out the possibility that a nuclear starburst is also contributing to the PSF emission, but this starburst does not produce the bulk of the H-band emission in the nucleus of these objects. This is consistent with the strong dilution of the CO bandheads observed in the near-infrared spectra of Seyfert 1 ULIRGs and PG QSOs of Dasyra et al. (2007). A slight trend is also seen between PSF-to-host ratios and infrared excesses (or FIR brightnesses) among QSOs: those with large infrared excesses tend to have smaller PSFto-host ratios (Figure 5b). This is consistent with the merger scenario if FIR-bright QSOs represent an earlier phase of QSO/merger evolution when the QSOs have not fully emerged from their dusty cocoons.
12 Host Sizes, Magnitudes, and Colors Figure 6 shows the distributions of host sizes (spheroid component only) and total (spheroid + tidal features + disk, if relevant) host absolute magnitudes for all ULIRGs and PG QSOs in the HST sample. The full range in QSO spheroid half-light radii and total host luminosities is very broad, from r1 = 0.3 to 9.9 kpc and from M H = to or L H, respectively (we used M H = 23.7 mag. as the H-band absolute magnitude of a L galaxy in a Schechter function description of the local field galaxy luminosity function; Cole et al. 2001; Veilleux et al. 2006). The average (median) spheroid half-light radii and total H-band absolute magnitudes of the QSO hosts in the sample are 2.87 ± 2.59 (2.14) kpc and ± 0.77 ( 24.46) mag. For comparison, the same quantities for the ULIRGs in Paper I are 2.55 ± 1.43 (1.84) kpc and ± 0.56 ( 24.21) mag. These average QSO and ULIRG host magnitudes correspond to 2.3 ± 1 and 1.5 ± 1 L H, respectively. A Kologorov-Smirnov (K-S) analysis shows that the hosts of the PG QSOs in our sample are statistically different from the hosts of the 1-Jy ULIRGs in terms of absolute magnitudes but not in terms of sizes [P(null) = 2.2% and 59%, respectively]. A closer look at Figures 6a and 6b shows that the difference comes entirely from the inclusion of radio-loud QSOs in our sample. The hosts of these systems are systematically larger and brighter than those of the radio-quiet QSOs in our sample (r1 = 3.0 to 9.9 kpc and from M H = to or 1 9 L H versus = 0.3 to 5.5 kpc and from M r1 H = to or L H ). Similar differences have been found in the past (e.g., Dunlop et al. 2003; Guyon et al. 2006; Best et al. 2007; Wolf & Sheinis 2008 and references therein). Figure 6b also shows that QSOs with elliptical hosts display the broadest range of luminosity, while the bulge + disk systems and the ambiguous systems tend to populate the low- and high-luminosity ends of the distribution, respectively. We generally find good agreement on an object-by-object basis when comparing our host H-band magnitudes with those of McLeod & McLeod (2001; two objects in common), Surace et al. (2001; 8 objects), and Guyon et al. (2006; 20 objects). The comparisons with Surace et al. (2001) and Guyon et al. (2006) are shown in Figure 7. The Surace et al. host magnitudes plotted in Figure 7a were calculated by subtracting the nuclear magnitudes from the integrated magnitudes in their Table 2. An excellent match is found, except for one object, PG , which is 1 mag. brighter in the Surace et al. data. This is an optically violently variable source so the difference may be due to uncertainties in the removal of the central PSF in the ground-based data. The Guyon et al. values tend to be 0.4 mag. brighter than our measurements. Given the good agreement between our data and those of Surace et al. and the noted variability of the PSF in the AO data of Guyon et al., we suspect that this shift is due to uncertainties in the PSF subtraction from these
13 13 latter data. Systematic underestimate of the background level in these latter data could also explain the shift. There are 13 and 10 objects in common between the present H-band study and the archival optical HST imaging studies of Kim et al. (2008a) and Hamilton et al. (2008), respectively. The R-band (V-band) total host magnitudes of Kim et al. (Hamilton et al.) are compared with our H-band magnitudes in Figure 7c (7d). The average (median) R H color derived from Figure 7c is 1.80 ± 0.53 mag. (1.92 mag.). This median value is the same as that found by Jahnke et al. (2004) among 19 low-redshift (z < 0.2) quasar host galaxies. It is 0.3 mag. bluer than the k-corrected R H colors of elliptical galaxies with M H 24.5 mag. at z 0.2 (Lilly & Longair 1984; Fukugita et al. 1995; Fioc & Rocca-Volmerange 1999; Jahnke et al. 2004; Hyvönen et al. 2007, 2008). Similarly, the median V H color derived from Figure 7d is 1.9 mag., considerably bluer than the k-corrected V H colors of elliptical galaxies with M H 24.5 mag. at z 0.2 (V H 2.8). A comparison of the half-light radii of the spheroidal components from the various data sets suggests a systematic difference between the near-infrared and optical measurements, where the H-band sizes are 50% smaller than the optical sizes, but the statistics are poor. These shifts in colors and possibly sizes provide independent confirmation of the presence of a young circumnuclear stellar population in the hosts of many low-z QSOs (e.g., Surace et al. 2001; Miller & Sheinis 2003; Canalizo et al. 2006, 2007; Schweitzer et al. 2006; Jahnke et al. 2004, 2007, and references therein). A young stellar population is a natural by-product of gas-rich galaxy mergers. One would therefore naively expect correlations between R H and V H colors and indicators of the merger phase, such as PSF-masked residuals, PSFto-host ratios, infrared excesses, and FIR strength. No obvious trend is observed when combining ULIRGs and PG QSOs, but (1) the statistics are poor (the number of objects is never more than 11), (2) variations in the dust content and dust spatial distribution may be masking underlying correlations (this possible cosmic conspiracy between stellar evolution and extinction was also mentioned in Tacconi et al. 2002), and (3) the host colors exclude any emission from point-source nuclear starbursts since this nuclear emission was removed during the PSF subtraction procedure. So the host colors of these systems need not be correlated with the merger phase if the bulk of the emission from merger-induced star formation is in the nuclear regions (this is the case for most if not all ULIRGs, e.g., Soifer et al. 2000, and possibly also in some PG QSOs). These three factors may also explain the lack of any obvious color difference with morphological class or radio-loudness.
14 14 5. Discussion In Paper I, we tried to answer two important questions: (1) are ULIRGs/QSOs elliptical galaxies in formation, and (2) are ULIRGs related to QSOs? Here, we revisit these questions following the same procedure as in Paper I, but this time the QSO population is better sampled by the new NICMOS data and near- and mid-infrared spectroscopic data recently published by our group are used to add important physical constraints on these objects. First, in Section 5.1, we use the FP traced by inactive spheroids to address these issues. Next, in Section 5.2, we characterize the black hole masses and level of black-hole driven activity likely to be taking place in the cores of these sources The Fundamental Plane We focus our discussion on ULIRGs and QSOs with pure elliptical hosts, i.e., excluding the bulge + disk and ambiguous systems, to avoid uncertainties related to the bulge/disk decomposition (e.g., Kim et al. 2008a, 2008b) at the cost of reducing the sample size. Figure 8a shows that ULIRGs and QSOs with elliptical hosts lie near, but not exactly on, the photometric projection of the FP for spheroids as traced by the K -band data of Pahre (1999, using H K = 0.35 mag.), the z-band data of Bernardi et al. (2003; using z H = 1.8 mag.) and the H-band data of Zibetti et al. (2002). As found in Paper I, small ULIRG and QSO hosts are systematically brighter than inactive spheroids of the same size. The shift in surface brightness reaches 1 mag. for objects with half-light radii of 1 kpc. This systematic trend with half-light radii for both ULIRGs and PG QSOs is also seen in the linear fits through the data. The fits through the ULIRGs and PG QSOs (dashed and solid lines in Figure 8a, respectively) are indistinguishable from each other, but they are considerably steeper than the fit through the data of the inactive spheroids (dotted line). Interestingly, the K-band data of Rothberg & Joseph (2006) on optically-selected mergers (using H-K = 0.50) show a similar shift at small half-light radii as that of our ULIRGs and PG QSOs. In Paper I, we speculated that the shift to brighter magnitudes among the small ULIRG/QSO hosts was due to excess H-band emission from a young stellar population, but did not have the relevant data to test this statement (see also discussion in Tacconi et al and the relevant new results of Graves et al and Hopkins et al and Choi et al on quiescent and UV-excess early-type galaxies, respectively). We now revisit this issue. In Figure 8b, we combine the photometric measurements of Figure 8a with the stellar velocity dispersion measurements of Dasyra et al. (2006b, 2007) and Rothberg & Joseph (2006) and compare the results with the data on intermediate-size inactive spheroids from
15 15 Zibetti et al. (2002) and Bernardi et al. (2003). Here again, deviations are seen at small halflight radii in the sense that our ULIRGs and PG QSOs and the optically-selected mergers of Rothberg & Joseph (2006) fall systematically below the FP of inactive spheroids. This effect was noted by Rothberg & Joseph (2006) and attributed to differences in the effective radius and brighter surface brightness, rather than a lower velocity dispersion; this is consistent with the explanation of excess H-band emission from a young circumnuclear stellar population. Additional support for this idea comes from our result in Section 4.5 that the colors of the PG QSO hosts are bluer than those of inactive spheroids of similar size. However, if we define surface brightness deviation as the difference between the observed surface brightness and the surface brightness expected of a inactive spheroidal galaxy with the same half-light radius, as determined by the linear fit through the data of Pahre (1999), Bernardi et al. (2003), and Zibetti et al. (2002) in Figure 8a, we find no obvious trend between surface brightness deviations and R H host colors (derived by combining the data of Veilleux et al. 2002, 2006, Kim et al. 2008a, and the present paper), contrary to what would be expected if the surface brightness deviation was indeed due solely to excess H-band emission from a young stellar population. This is illustrated in Figure 9f. In this panel and all others of Figure 9, ULIRGs are open symbols and PG QSOs are filled symbols. The other panels of Figure 9 confirm the clear trend with half-light radii (a, the probability that this correlation is fortuitous is P[null] = 0.02%) and reveal a possible tendency for PG QSOs with large infrared excesses to have brighter hosts than inactive spheroids (b). But there is no obvious correlation between surface brightness deviation and merger phase [as determined by the PSF-masked residuals (c) and the PSF-host flux ratios (d)] or the AGN fractional contribution to the bolometric luminosity (e) derived from the Spitzer data of Veilleux et al. (2009) 5. As mentioned above, ULIRGs and PG QSOs show no displacement in the FP from each other. These results seem inconsistent at first with the idea that the surface brightness deviations in small hosts are caused solely by excess H-band emission from star formation. If ULIRGs are the precursors of PG QSOs (the Spitzer data of Veilleux et al are indeed largely consistent with this scenario), the ULIRGs should have more star formation and therefore we naively expect that ULIRG hosts should deviate more from the FP of inactive spheroids than PG QSO hosts. However, as pointed out in the last paragraph of Section 4.5., removal of the nuclear starbursts in these objects during the PSF subtraction may be wiping out the expected surface brightness shift between ULIRGs and PG QSOs in 5 These AGN contributions are calculated using six independent mid-infrared AGN indicators that give consistent results. The bolometric luminosities of ULIRGs are assumed to be 1.15 L(IR), while the bolometric luminosities of PG QSOs are assumed to be 7 L(5100 Å) + L(IR) (Netzer et al. 2007). See Table 1 for a list of the bolometric luminosities.
16 16 the FP. Moreover, dust may be affecting the observed surface brightnesses and colors, particularly in ULIRG hosts, which are systematically redder than PG QSO hosts (Figure 9f; see also Scoville et al. 2000). A closer examination of Figure 8a seems to indicate that the hosts of the more radio/xray luminous QSOs from Dunlop et al. (2003) are systematically fainter than inactive spheroids of the same size and fit rather well the extension to larger radii of the linear fit through the NICMOS data on ULIRGs and PG QSOs. If real, this result cannot be explained by excess H-band emission from star formation. However, a number of assumptions are made when plotting the data points of Dunlop et al. on Figure 8a. Following Paper I, we used the half-light radii measured from the R-band data of Dunlop et al. directly, without applying any color corrections, while the R-band surface brightness measurements of Dunlop et al. were shifted assuming R H = 2.8, typical of M R 23.5 elliptical systems at z 0.2 (Lilly & Longair 1984; Fukugita et al. 1995; Fioc & Rocca-Volmerange 1999; Hyvönen et al. 2007, 2008). Note that a smaller R H, more in line with the average value found for the lower luminosity PG QSO hosts (Section 4.5 and Figure 7), would bring the data points of Dunlop et al. further down in Figure 8 i.e., systematically fainter than the corresponding spheroids. Positive R H radial gradients within the hosts would increase the H-band half-light radii, but the shift between the Dunlop et al. QSOs and the inactive spheroids is too large to be explained solely by this effect. Moreover, inactive elliptical galaxies are usually redder near the center than on the outskirts so the color gradients are usually negative rather than positive (e.g., Peletier et al. 1990). The results from our comparisons of the QSO spheroid sizes at V, R, and H (Section 4.5) suggest a similar negative color gradient in QSO hosts. Another source of uncertainty in this discussion is the exact location of the FP at halflight radii larger than 10 kpc. The catalogs of Bernardi et al. (2003) and especially Pahre (1999) contain relatively few objects of this size so the FP is not well determined from these data. Also, we assumed a color correction from z-band to H-band for the Bernardi et al. surface brightness measurements that was independent of galaxy size (and environment); this is probably an oversimplification (e.g., Figure 5 of Hyvönen et al suggests redder colors for the more luminous hosts; see also Bernardi et al for a discussion of a dependence on environment). Recent compilations of FP parameters among luminous inactive and active spheroids by Bernardi et al. (2006), Hamilton et al. (2008), and Wolf & Sheinis (2008) do not show any significant systematic shift between the r-band properties of active and inactive spheroids. In fact, the Hamilton et al. and Wolf & Sheinis data appear to be consistent with the FP shown in Figure 8, assuming V H = 3.5 and r H = 3.0, respectively. So one should be cautious in attaching too much importance to the apparent shift between the Dunlop et al. data and the FP data of Figure 8a.
17 17 Nevertheless, the shift to brighter magnitudes among the small ULIRG/QSO hosts is definitely real. The fact that this shift does not correlate strongly with star formation/dust reddening, merger phase, and AGN strength indicators seems to indicate that it is not solely due to excess H-band emission from star formation. Figure 9d and 9e also seem to rule out the possibility that systematic residuals associated with the PSF fitting and removal procedure are causing these surface brightness deviations. At this stage, we cannot rule out the possibility that a combination of possibly severe and counteracting effects of population age, dust extinction and geometry, and residual scattered emission by the central AGN/starburst is causing this systematic shift. However, we favor a more conservative scenario where all of these effects are relatively modest. If the bulk of the emission from merger-induced star formation is nuclear, as it is known to be the case for most if not all ULIRGs and possibly also in some PG QSOs, then the host colors and excess H-band emission need not be correlated with the merger phase since the bulk of this emission was removed in the PSF subtraction procedure Black Hole Masses and Accretion Rates The host magnitudes derived from our data can in principle be used to derive the black hole masses in the cores of these objects, assuming the relation between black hole mass and the mass of the spheroidal component in normal inactive galaxy (e.g., Magorrian et al. 1998; Kormendy & Gebhardt 2001; Marconi & Hunt 2003; Häring & Rix 2004) also applies to recent mergers. Following Paper I, we use the H-band elliptical host magnitude black hole mass relation in Marconi & Hunt (2003), log(m BH ) = 2.80 (0.464 M H ), and deduce photometrically derived black hole masses ranging from (PG ) to M (B A) (Table 6). The average (median) black hole mass is M BH = 4.4 ± M ( M ; Table 7). This derivation neglects dust extinction outside the nuclear regions of the hosts (which would cause an underestimate of M BH ) and the presence of recent or on-going non-nuclear star formation (which would have the opposite effect). Also listed in Table 6 are the photometric black hole mass estimates for the 1-Jy ULIRGs from Paper I and Veilleux et al. (2002), and the black hole mass estimates for these ULIRGs and PG QSOs derived from three other methods, when available. The dynamical estimates are from Dasyra et al. (2006a, 2006b, 2007). They are based on stellar velocity dispersions, σ, measured from VLT/Keck near-infrared spectra and the M BH σ relation of Tremaine et al. (2002). Next, we list the black hole mass estimates for the 13 PG QSOs from the detailed reverberation mapping study of Peterson et al. (2004; updated by Bentz et al. 2006; 3C 273 is the only ULIRG with a black hole mass estimate based on this method). Finally, in
18 18 the last column of these tables, we list the black hole masses of PG QSOs from Vestergaard & Peterson (2006) based on the virial method. These virial estimates are derived from the widths of the single-epoch Hβ profiles measured by Boroson & Green (1992) and an empirical relationship between broad-line region (BLR) size and 5100 Å luminosity that is calibrated to the improved mass measurements of nearby AGNs based on emission-line reverberation mapping. Table 6 lists the black hole mass estimates from the four different methods. Table 7 lists the averages, medians, and standard deviations from the averages of the black hole mass estimates derived from each method. Figure 10 compares the results from the various methods on an object-by-object basis using the data in Table 6. Figures 10b and 10c indicate that the photometric, reverberation, and virial black hole mass estimates generally agree with each other to within a factor of 3 or better. On the other hand, the dynamical black hole mass estimates in ULIRGs (PG QSOs) are systematically smaller by a factor of 7 ( 3 4) on average than the other estimates. Figures 10a and 10d suggest that the discrepancies between the dynamical measurements and the photometric and reverberation mapping measurements increase with increasing black hole masses, while Figure 10e shows no obvious trend with the virial black hole masses. Note in passing that the large scatter in Figure 10a implies that the Faber-Jackson relation does not apply to these systems. It is beyond the scope of this paper to try to explain the origins of these discrepancies. Here we simply describe the principal sources of uncertainties for each method. The photometric method relies on the unproven assumption that the M BH M spheroid relation of Marconi & Hunt (2003) applies to recent mergers. In addition, as discussed in Section 5.1, the photometric measurements from our data may be affected by a number of effects (non-nuclear star formation and dust extinction, PSF subtraction) which could therefore add uncertainties to the photometric black hole mass estimates [similar results are found when we exclude bulge + disk systems so the uncertainties in the bulge/disk decomposition (Kim et al. 2008a, 2008b) doe not appear to be a major issue here]. Note, however, that if the surface brightness deviations seen in Figure 8a are due to a combination of these effects, then one would expect the photometric black hole mass estimates to be overestimated in the smaller hosts with the smaller black hole masses, the opposite of what is needed to explain the trends of increasing discrepancies at larger black hole masses. To further test this hypothesis we took the worst possible scenario and assumed that the surface brightness deviations inferred from Figure 8a were due entirely to excess H-band emission from a young stellar population and corrected the photometric black hole masses accordingly. The results are shown by the horizontal segments in Figures 10a c. These shifts do not significantly improve the agreement with the other methods.
19 19 The dynamical black hole mass measurements are based on two important but largely unproven assumptions: the young star probed by the CO observations of Dasyra et al. trace the full velocity dispersion of the spheroid and the M BH σ relation(s) apply to recent mergers. Recent simulations (e.g., Dasyra et al. 2006b; Johansson et al. 2009) provide support for this last assumption, but it is far from being the final word given the difficulty in modeling the complex processes associated with star formation and black hole growth on sub-pc to kpc scales. The first assumption has been discussed in the context of opticallyselected merger remnants, where Ca II triplet velocity dispersion measurements are found to be systematically larger than CO measurements by a factor of up to 2 (Rothberg & Joseph 2006; Dasyra et al. 2006b; Rothberg 2009; see also Silge & Gebhardt 2003 in elliptical galaxies). The dynamically-derived black hole masses scale with the fourth power of the velocity dispersions, so this systematic shift between optical and near-infrared measurements could conceivably explain some of the discrepancy between the dynamical measurements and the other measurements. Finally, the reverberation mapping and virial measurements are widely considered to be the most reliable estimates of black hole masses. However, they too are subject to possibly significant uncertainties. In particular, the scale factor f, which accounts for the unknown geometry, kinematics, inclination of the broad-line region, may depend on luminositiy and accretion rate (e.g., Collin et al. 2006). The value adopted by Peterson et al. (2004) and Vestergaard & Peterson (2006), f = 5.5, was derived from lower luminosity AGN (Onken et al. 2004) and may not apply to the higher luminosity PG QSOs of our sample (see Dasyra et al and Watson et al for a more detailed discussion of the origins of the discrepancies between the dynamical and reverberation mapping methods). Given the substantial uncertainties affecting all of the black hole mass measurements, it is in fact remarkable that a large subset of these measurements agree with each other to within of 3 or better. In the following discussion, we adopt our photometric black hole mass estimates at face value, keeping in mind of the possibly large uncertainties on these black hole mass estimates, and derive the Eddington ratio i.e., the ratio of AGN bolometric luminosity to the Eddington luminosity, L Edd = M BH /M L, for each system. This ratio is an objective indicator of the level of nuclear activity in these systems. The AGN fractional contributions to the bolometric luminosities of the PG QSOs and ULIRGs are taken directly from our Spitzer study (Veilleux et al. 2009; see details in footnote #5 in Section 5.1). Some of the results have already been discussed in Veilleux et al. (2009) and are not repeated here. Figure 11 focuses exclusively on the ULIRGs and radio-quiet and radio-loud PG QSOs in the HST sample. These three classes of objects have statistically the same photometric Eddington ratios, of order 3-30% ( 10% on average). This result is similar to those derived by McLeod & McLeod (2001). Interestingly, none of the ULIRGs
20 20 and PG QSOs in our sample require super-eddington mass accretion rates. This remains true for all but two objects after we correct the spheroid host magnitudes for possible excess H-band emission from young stellar population (indicated by the horizontal segments in Figure 11). The corrected Eddington ratios are then 30% on average. 6. Conclusions As part of QUEST, we have supplemented our original HST NICMOS H-band imaging data set on 7 PG QSOs from Paper I with an additional set of 21 PG QSOs, for a total of 28 objects. The results from our detailed two-dimensional analysis of this larger PG QSO sample were then compared with the data from Paper I on ULIRGs, which were analyzed exactly in the same way, and those from literature. The main conclusions of our study are the followings: The majority (57%) of the PG QSOs show signs of a recent galactic interaction. Eleven (39%) PG QSOs show a prominent elliptical morphology, nine (32%) have a distinct stellar disk in addition to a central bulge, and the others have a morphology that is ambiguous either due to severe merger-induced disturbances (5/28, 18%) or mismatch in the point-spread function (3/28, 11%).. The fraction of QSOs with elliptical host is larger among QSOs with undetected FIR emission, small infrared excess, and luminous hosts. The hosts of FIR-bright QSOs show a tendency to have more pronounced mergerinduced morphological anomalies and smaller QSO-to-host luminosity ratios on average than the hosts of FIR-faint QSOs. The host sizes and luminosities of the radio-quiet (radio-loud) PG QSOs in our sample are statistically indistinguishable from (larger than) those of the 26 highly-nucleated ULIRG hosts presented in Paper I. ULIRGs, radio-quiet PG QSOs, and radio-loud PG QSOs with elliptical hosts lie close to, but not exactly on, the FP of inactive spheroids. We confirm the tendency noted in Paper I for objects with small ( 2 kpc) spheroids to be up to 1 mag. brighter than normal inactive spheroids. Comparisons of our H-band host magnitudes and sizes with similar R- and V-band data taken from the literature support the existence of a young stellar population outside the nuclear region of several PG QSOs and ULIRGs which may contribute to the observed excess H-band emission. However, no obvious trend is seen between this excess H-band emission
21 21 and host R H color, merger phase, or AGN indicators in ULIRGs and PG QSOs, suggesting that other effects like dust extinction are also at play. PSF subtraction may also wipe out correlations with merger phase in systems with strong merger-induced nuclear starbursts (i.e., most ULIRGs and possibly some PG QSOs). The H-band spheroid-host luminosities of the PG QSOs, uncorrected for extinction or the presence of a young stellar population, imply black hole masses ranging from 5 to M. These values are similar to those of the ULIRGs from Paper I, within a factor of 3 from black hole mass estimates based on the reverberation mapping and virial methods, but significantly larger than those derived from the stellar velocity dispersion method. These discrepancies are arguably within the range of the large uncertainties on all these measurements. Sub-Eddington mass accretion rates of order 3 30% are implied for all PG QSOs and ULIRGs in our sample when the photometric black hole mass estimates are combined with our published Spitzer estimates of the AGN contributions to the bolometric luminosities in these objects. Corrections due to possible excess H-band emission from a young circumnuclear stellar population increase the average mass accretion rate by a factor of 3. By and large, these results and those of Paper I support the merger scenario where QSO activity of moderate luminosity is triggered by major galaxy mergers that result in the formation of intermediate-mass spheroids. The weaker merger-induced morphological anomalies found among Seyfert-like ULIRGs (Paper I) and PG QSOs with elliptical hosts and small infrared excess indicate that nuclear activity is indeed seen preferentially in late-stage mergers. The disk components, detected in all QSOs with AGN bolometric luminosities less than L, can be explained in this merger scenario if substantial and rapid accretion of residual gas took place after the merger. S.V., D.C.K., and D.S.N.R. were supported in part by NASA through grant HST-GO A. S. V. acknowledges support from a Senior Award from the Alexander von Humboldt Foundation and thanks the host institution, MPE Garching, where some of this work was performed. C.Y.P. is grateful to Space Telescope Science Institute for support through the Institute Fellowship program and to the National Research Council of Canada through the Plaskett Fellowship program at the Herzberg Institute of Astrophysics. We thank R. Davies, K. Jahnke, and E. Bell for comments on an earlier version of the manuscript, and the anonymous referee for a thoughtful review. This work has made use of NASA s Astrophysics Data System Abstract Service and the NASA/IPAC Extragalactic Database (NED),
22 22 which is operated by the Jet Propulsion Laboratory, California Institute of Technology, under contract with the National Aeronautics and Space Administration.
23 23 Bentz, M. C., et al. 2006, ApJ, 651, 775 REFERENCES Bergeron, L. E., & Dickinson, M. E. 2003, Instrument Science Report NICMOS Best, P. N., et al. 2007, MNRAS, 379, 894 Canalizo, G., Stockton, A., Brotherton, M. S., & Lacy, M. 2006, NewA Rev., 50, 650 Canalizo, G., et al. 2007, ApJ, 669, 801 Choi, Y., Goto, T., & Yoon, S.-J. 2009, preprint (astro-ph/ ) Collin, S., Kawaguchi, T., Peterson, B. M., & Vestergaard, M. 2006, A&A, 456, 75 Dasyra, K. M., et al. 2006a, ApJ, 638, 745 Dasyra, K. M., et al. 2006b, ApJ, 651, 835 Dasyra, K. M., et al. 2007, ApJ, 657, 102 Dickinson, M. E., et al. 2002, in HST NICMOS Data Handbook v. 5.0, ed. B. Mobasher, Baltimore, STScI Dunlop, J. S., McLure, R. J., Kukula, M. J., Baum, S. A., O Dea, C. P., & Hughes, D. H. 2003, MNRAS, 340, 1095 Fioc, M., & Rocca-Volmerange, B. 1999, A&A, 351, 869 Fukugita, M., Shimasaku, K., & Ichikawa, T. 1995, PASP, 107, 945 Gonzaga, S., Biretta, J. A., Wiggs, M. S., Hsu, J. C., Smith, T. E., Bergeron, L., and the WFPC2 Group, 1998, Instrument Science Report WFPC Governato, F., et al. 2008, MNRAS, preprint (astro-ph/ ) Graves, G. J., Faber, S. M., & Schiavon, R. P. 2009, preprint (astro-ph/ ) Guyon, O., Sanders, D. B., & Stockton, A. 2006, ApJS, 166, 89 Hamilton, T. S., Casertano, S., & Turnshek, D. A. 2008, ApJ, 678, 22 Häring, N., & Rix, H.-W. 2004, ApJ, 604, L89 Hopkins, P. F., et al. 2009, ApJ, 691, 1424 Hyvönen, T., et al. 2007, A&A, 476, 723 Hyvönen, T., et al. 2008, RMxAC, 32, 161 Jahnke, K., Kuhlbrodt, B., & Wisotzki, L. 2004, MNRAS, 352, 399 Jahnke, K., Wisotzki, L., Courbin, F., & Letawe, G. 2007, MNRAS, 378, 23 Johansson, P. H., Naab, T., & Burkert, A. 2009, ApJ, 690, 802
24 24 Kim, M., et al. 2008a, ApJ, 687, 767 Kim, M., et al. 2008b, ApJS, 179, 283 Kormendy, J., & Gebhardt, K. 2001, Texas Symposium on relativistic astrophysics, 20th, held in Austin, Texas, Ed JC Wheeler and H Martel, New York, American Institute of Physics, Vol. 586, 363 Lilly, S. J., & Longair, M. S. 1984, MNRAS, 211, 833 Magorrian, J., et al. 1998, AJ, 115, 2285 Marconi, A., & Hunt, L. K. 2003, ApJ, 589, L21 McLeod, K. K., & McLeod, B. A. 2001, ApJ, 546, 782 Miller, J. S., & Sheinis, A. I. 2003, ApJ, 588, L9 Netzer, H., et al. 2007, ApJ, 666, 806 Onken, C. A., et al. 2004, ApJ, 615, 645 Pahre, M. A. 1999, ApJS, 124, 127 Peletier, R., Valentijn, E., & Jameson, R. 1990, A&A, 233, 62 Peng, C., Ho, L. C., Impey, C. D., & Rix, H.-W. 2002, AJ, 124, 266 Peterson, B. M., et al. 2004, ApJ, 613, 682 Rothberg, B. 2009, preprint (astro-ph/ ) Rothberg, B., & Joseph, R. D. 2006, AJ, 131, 185 Sanders, D. B., et al. 1988, ApJ, 325, 74 Schmidt, M., & Green, R. F. 1983, ApJ, 269, 352 Schweitzer, M., et al. 2006, ApJ, 649, 79 Schweitzer, M., et al. 2008, ApJ, 679, 101 Scoville, N. Z., et al. 2000, AJ, 119, 991 Silge, J. D., & Gebhardt, K. 2003, AJ, 125, 2809 Soifer, B. T., et al. 2000, AJ, 119, 509 Storchi-Bergmann, et al. 2007, ApJ, 670, 959 Surace, J. A., Sanders, D. B., & Evans, A. S. 2001, AJ, 122, 2791 Tremaine, S., et al. 2002, ApJ, 574, 740 Veilleux, S., Kim, D.-C., & Sanders, D. B. 2002, ApJS, 143, 315 Veilleux, S., Sanders, D. B., & Kim, D.-C. 1997, ApJ, 484, 92
25 25 Veilleux, S., Sanders, D. B., & Kim, D.-C. 1999, ApJ, 522, 139 Veilleux, S., et al. 2006, ApJ, 643, 707 (Paper I) Veilleux, S., et al. 2009, ApJS, June issue, in press (astro-ph/ ) Watson, L. C., et al. 2008, ApJ, 682, L21 Wolf, M. J., & Sheinis, A. I. 2008, AJ, 136, 1587 Zibetti, S., et al. 2002, ApJ, 579, 261 This preprint was prepared with the AAS L A TEX macros v5.2.
26 26 L Table 1. Sample Name Other Name z log LB log LIR L IR L IR f 25 Radio FIR Class L B L BOL f 60 (1) (2) (3) (4) (5) (6) (7) (8) (9) (10) (11) L log LBOL L PG III Zw L Weak PG < <3.31 <0.25 <0.410 Q Undetected PG I Zw Q Strong PG Mrk Q Strong PG VII Zw Q Weak PG Q Weak PG < <20.9 <0.47 <0.322 Q Undetected PG Q Strong PG < <7.59 <0.26 <0.486 Q Undetected PG Mrk Q Weak PG Mrk Q Strong PG Mrk Q Weak PG L Strong PG Q Weak PG < <7.41 <0.36 <0.681 L Undetected PG Q Weak PG Mrk Q Weak PG < <8.51 < Q Strong PG Mrk Q Strong PG Mrk Q Strong PG Mrk < <5.62 <0.32 <0.526 Q Undetected PG < <6.17 < : Q? PG Q Weak PG Mrk Q Weak B A 4C < <0.18 <0.279 L Undetected PG Mrk < <7.08 < Q? PG C < <8.13 <0.15 <0.772 L Undetected PG C L Strong Col 1: Object name. Col 2: Other name. Col 3: Redshift. Col 4: Blue luminosity. Col 5: Infrared luminosity calculated from prescription of Sanders & Mirabel (1996). Col 6: Bolometric luminosity calculated from 7 L(5100Å) + L(IR) (Netzer et al. 2007). Col 7: Ratio of infrared to blue luminosities. Col 8: Ratio of infrared to bolometric luminosities. Col 9: f 25 /f 60 flux ratio. Object with colon is uncertain. Col 10: Radio loudness (Q: radio quiet, L: radio loud) from Kellermann et al (1994) except for two objects (B A and PG from Becker et al., 1991). Col 11: FIR strength according to Netzer et al. (2007).
27 27 Table 2. One Galaxy Component Fits Name n r 1/2 b/a PA m n M n m PSF M PSF R 1 R 2 χ 2 ν1 χ 2 ν2 (1) (2) (3) (4) (5) (6) (7) (8) (9) (10) (11) (12) (13) PG PG PG (a) PG PG (a) PG PG PG PG PG PG PG (a) PG PG PG
28 28 Table 2 Continued Name n r 1/2 b/a PA m n M n m PSF M PSF R 1 R 2 χ 2 ν1 χ 2 ν2 (1) (2) (3) (4) (5) (6) (7) (8) (9) (10) (11) (12) (13) PG PG (a) PG PG PG PG PG PG PG B A PG (a) PG PG Col 1: Object name. Col 2: Sérsic index. Col 3: Half-light radius in kpc of Sérsic component. Col 4: Axis ratio of Sérsic component. Col 5: Position angle (East of North) of major axis of Sérsic component.
29 29 Col 6: Apparent H magnitude of Sérsic component. Col 7: Absolute H magnitude of Sérsic component. Col 8: Apparent H magnitude of PSF component. Col 9: Absolute H magnitude of PSF component. Col 10: Absolute residuals normalized to total host galaxy flux (%). See Section 4.3 for more detail. Col 11: PSF-masked absolute residuals normalized to total host galaxy flux (%). The central PSF region brighter than 11 H mag arcsec 2 was masked for these calculations. See Section 4.3 for more detail. Col 12: Reduced χ 2 value. Col 13: PSF-masked reduced χ 2 value. The central PSF region brighter than 11 H mag arcsec 2 was masked for these calculations. (a) Entries for this object are uncertain because the host galaxy fills most of the field of view so the sky background is not well determined.
30 30 Table 3. Two Galaxy Components Fits Name n r 1 2 b/a PA m n M n m PSF M PSF R 1 R 2 χ 2 ν1 χ 2 ν2 (1) (2) (3) (4) (5) (6) (7) (8) (9) (10) (11) (12) (13) PG PG PG (a) PG PG (a) PG PG PG PG PG (a) PG (a) PG PG PG Col 1: Object name. Col 2: Sérsic index. Col 3: Half-light radius in kpc of Sérsic component. Col 4: Axis ratio of Sérsic component. Col 5: Position angle (East of North) of major axis of Sérsic component. Col 6: Apparent H magnitude of Sérsic component. Col 7: Absolute H magnitude of Sérsic component. Col 8: Apparent H magnitude of PSF component. Col 9: Absolute H magnitude of PSF component. Col 10: Absolute residuals normalized to total host galaxy flux (%). See Section 4.3 for more detail. Col 11: PSF-masked absolute residuals normalized to total host galaxy flux (%). The central PSF region brighter than 11 H mag arcsec 2 was masked for these calculations. See Section 4.3 for more detail. Col 12: Reduced χ 2 value.
31 31 Col 13: PSF-masked reduced χ 2 value. The central PSF region brighter than 11 H mag arcsec 2 was masked for these calculations. (a) Entries for this object are uncertain because the host galaxy fills most of the field of view so the sky background is not well determined.
32 32 Table 4. Details of PG QSO Small Structure Name R.A. Dec. r1 m H 2 (1) (2) (3) (4) (5) PG PG # PG # PG PG PG PG Col 1: Object name. Col 2 - Col 3: Offsets relative to the QSO nucleus. Col 4: Half-light radius in kpc of Sérsic component. Col 5: Apparent H magnitude of component.
33 33 Table 5. Summary (a) Visual Features Name M total M P SF M host M model I PSF I host I model I host r 12 < µ 12 > Bar Arms Dis. MC IC (1) (2) (3) (4) (5) (6) (7) (8) (9) (10) (11) (12) (13) (14) PG No Yes Yes E IVb PG No No Yes E V PG (b) No Yes Str B+D IVb PG No Yes Str E IVb PG (b) Yes Yes Yes B+D IVb PG No Yes Yes B+D IVb PG No No No E V PG Yes? Yes? Yes? E V PG No No No? V PG No No No B+D V PG No Yes? Yes? B+D V PG (b) Yes Yes No B+D V PG No No Yes? A V PG No No No E V PG No No No E V PG No No Str A IVb PG (b) No No Str B+D IVb PG No No No E V PG No No No B+D V PG No No Str A IVb PG No No No? V PG No No No E V PG No No Yes A IVb PG No Yes No B+D IVb B A No No Yes E V PG (b) No No Yes E V PG No No No? V PG No No Str A IVb Col 1: Object name. Col 2: Total absolute magnitude (host + PSF - companions). Col 3: Absolute magnitude of PSF component. Col 4: Absolute magnitude of host galaxy (including tidal features). Col 5: Absolute magnitude of best-fitting galaxy host model. Col 6: PSF-to-host intensity ratio. Col 7: Model-to-host intensity ratio. Col 8: Half-light radius in kpc of n=4 Sérsic component. Col 9: Mean surface brightness of n=4 Sérsic component within half-light radius in H mag. arcsec 2. Col 10: Presence of a stellar bar. Col 11: Presence of spiral arms. Col 12: Presence of merger-induced disturbance (Str=strongly disturbed). Col 13: Morphological class: E = elliptical, B+D = bulge+disk, D = disk, A = ambiguous. Question marks (? ) indicate uncertain classification due to PSF mismatch (see Sections 3 and 4.1). Col 14: Interaction class (see VSK02 for details on the definitions). (a) Entries in this table are the parameters from the best-fitting one or two galaxy component models (Tables 2 and 3). (b) Entries for this object are uncertain because the host galaxy fills most of the field of view so the sky background is not well determined.
34 34 Table 6. Black Hole Mass M BH /10 7 M Galaxy phot dyn rev vir References (1) (2) (3) (4) (5) (6) ULIRGs IRAS IRAS IRAS IRAS IRAS IRAS SW IRAS NE IRAS IRAS IRAS IRAS NW IRAS SE IRAS SW IRAS NE IRAS IRAS IRAS IRAS IRAS PG IRAS IRAS N IRAS S IRAS IRAS IRAS IRAS IRAS IRAS IRAS IRAS IRAS IRAS IRAS IRAS IRAS NE IRAS SW IRAS IRAS IRAS IRAS
35 35 Table 6 Continued M BH /10 7 M Galaxy phot dyn rev vir References (1) (2) (3) (4) (5) (6) IRAS IRAS IRAS IRAS E IRAS W IRAS IRAS IRAS IRAS IRAS IRAS IRAS NE IRAS SW IRAS IRAS E IRAS W IRAS IRAS IRAS IRAS IRAS IRAS NE IRAS SW IRAS IRAS IRAS E IRAS W IRAS E IRAS W IRAS IRAS IRAS IRAS IRAS IRAS IRAS IRAS N IRAS S IRAS IRAS NE IRAS SW IRAS NE IRAS SW C
36 36 Table 6 Continued M BH /10 7 M Galaxy phot dyn rev vir References (1) (2) (3) (4) (5) (6) IRAS N IRAS S IRAS Mrk IRAS IRAS IRAS IRAS IRAS N IRAS S IRAS Mrk IRAS NE IRAS SW IRAS IRAS E IRAS W IRAS N IRAS S IRAS IRAS IRAS IRAS IRAS IRAS IRAS IRAS IRAS IRAS IRAS IRAS NE IRAS SW IRAS IRAS E IRAS W IRAS IRAS E IRAS IRAS IRAS IRAS IRAS Arp IRAS
37 37 Table 6 Continued M BH /10 7 M Galaxy phot dyn rev vir References (1) (2) (3) (4) (5) (6) IRAS IRAS IRAS NW IRAS SE IRAS IRAS IRAS IRAS IRAS NGC IRAS E IRAS W IRAS IRAS E IRAS IRAS IRAS N IRAS S IRAS W IRAS IRAS IRAS IRAS NE IRAS SW IRAS IRAS N IRAS S IRAS IRAS IRAS N IRAS S IRAS E IRAS W IRAS IRAS IRAS IRAS IRAS E IRAS W IRAS NW IRAS SE IRAS IRAS N IRAS S
38 38 Table 6 Continued M BH /10 7 M Galaxy phot dyn rev vir References (1) (2) (3) (4) (5) (6) IRAS IRAS IRAS IRAS IRAS N IRAS S IRAS N IRAS S IRAS IRAS IRAS IRAS PG QSOs PG PG PG PG PG PG PG PG PG PG PG PG PG PG PG PG PG PG PG PG PG PG PG PG PG PG PG PG PG
39 39 Table 6 Continued M BH /10 7 M Galaxy phot dyn rev vir References (1) (2) (3) (4) (5) (6) B A PG PG References. 1 = Dasyra et al. 2006b; 2 = Veilleux et al. 2002; 3 = Veilleux et al. 2006; 4 = Dasyra et al. 2006a; 5 = This paper; 6 = Peterson et al. 2004; 7 = Dasyra et al. 2007; 8 = Vestergaard & Peterson, 2006 Note. Col.(1): Galaxy name. Col.(2-5): Black hole mass, in units of 10 7 M, as determined from spheroid luminosity, spheroid velocity dispersion, reverberation mapping, and virial relation. Col.(6): M BH references.
40 40 Table 7. Black Hole Mass Statistics log(m BH /10 7 M ) Quantity phot dyn rev vir (1) (2) (3) (4) (5) ULIRGs No. Gals Average Median Std. Dev PG QSOs No. Gals Average Median Std. Dev ULIRGs + PG QSOs No. Gals Average Median Std. Dev Note. Col.(1): Quantity. Col.(2 5): Black hole mass statistics, where individual M BH values are first divided by 10 7 M and then logged. Masses are determined from spheroid luminosity, spheroid velocity dispersion, reverberation mapping, and virial relation.


, (c) PSF +")
, and (d) PSF + Sérsic component with")

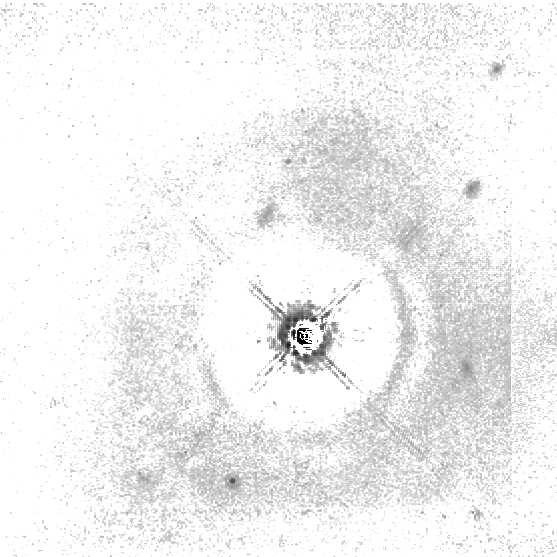
41 41 Fig. 1. Results from the GALFIT one galaxy component analysis. For each object, panel (a) shows the original data while the other panels show the residuals after subtracting three different models: (b) PSF + Sérsic component with n = 1 (exponential disk), (c) PSF + Sérsic component with n = 4 (de Vaucouleurs spheroid), and (d) PSF + Sérsic component with unconstrained index. The intensity scale is logarithmic and the horizontal segment between panels (b) and (c) represents 10 kpc. The tickmarks in the panels are separated by 5.

42 Fig


43 Fig


44 Fig


45 Fig


46 Fig


47 Fig


48 48 Fig. 2. Results from the GALFIT two galaxy component analysis for 16 PG QSOs with possible low-surface-brightness exponential disks. A disk is detected unambiguously in 9 of these objects: PG , , , , , , , , and (see details in Table 5). In the other systems presented here, the addition of a disk component did not improve the fits significantly. Panel (a) shows the original data and panel (b) shows the residuals after subtracting a model with a PSF, a bulge-like Sérsic component with n = 4, and a disk-like Sérsic component with n = 1. Panels (c) and (d) show the surface brightness distributions of the two Sérsic components used in the model. The centroids of the components are left unconstrained. The intensity scale is logarithmic and the vertical segment between panels (b) and (c) represents 10 kpc. The tickmarks in each panel are separated by 5.


49 Fig


50 Fig


51 Fig
Molecular Gas and the Host Galaxies of Infrared-Excess Quasi-Stellar Objects
 Molecular Gas and the Host Galaxies of Infrared-Excess Quasi-Stellar Objects A. S. Evans (Stony Brook) J. A. Surace & D. T. Frayer (Caltech) D. B. Sanders (Hawaii) Luminous Infrared Galaxies Properties
A Monster at any other Epoch:
 A Monster at any other Epoch: Are Intermediate Redshift ULIRGs the Progenitors of QSO Host Galaxies? Barry Rothberg Large Binocular Telescope Observatory/George Mason University Co-Is: J. Fischer (NRL),
Active Galaxies & Emission Line Diagnostics
 Active Galaxies & Emission Line Diagnostics Review of Properties Discussed: 1) Powered by accretion unto a supermassive nuclear black hole 2) They are the possible precursors to luminous massive galaxies
Stellar populations of quasar host galaxies
 Knud Jahnke AIP Galaxies division Hauskolloquium 10.01.2003 Introduction/motivation Multicolour imaging On-nucleus spectroscopy What does this teach us? Outlook Overview Introduction Introduction HE 1043
The Evolution of BH Mass Scaling Relations
 The Evolution of BH Mass Scaling Relations Nicola Bennert UCSB in collaboration with Tommaso Treu (UCSB), Jong-Hak Woo (UCLA), Alexandre Le Bris (UCSB), Matthew A. Malkan (UCLA), Matthew W. Auger (UCSB),
Measuring Black Hole Masses in Nearby Galaxies with Laser Guide Star Adaptive Optics
 Measuring Black Hole Masses in Nearby Galaxies with Laser Guide Star Adaptive Optics Claire Max Anne Medling Mark Ammons UC Santa Cruz Ric Davies Hauke Engel MPE-Garching Image of NGC 6240: Bush et al.
Multi-wavelength Surveys for AGN & AGN Variability. Vicki Sarajedini University of Florida
 Multi-wavelength Surveys for AGN & AGN Variability Vicki Sarajedini University of Florida What are Active Galactic Nuclei (AGN)? Galaxies with a source of non-stellar emission arising in the nucleus (excessive
Modern Image Processing Techniques in Astronomical Sky Surveys
 Modern Image Processing Techniques in Astronomical Sky Surveys Items of the PhD thesis József Varga Astronomy MSc Eötvös Loránd University, Faculty of Science PhD School of Physics, Programme of Particle
Hubble Space Telescope ultraviolet spectroscopy of blazars: emission lines properties and black hole masses. E. Pian, R. Falomo, A.
 Hubble Space Telescope ultraviolet spectroscopy of blazars: emission lines properties and black hole masses E. Pian, R. Falomo, A. Treves 1 Outline Extra Background Introduction Sample Selection Data Analysis
Astro2010 Science White Paper: Tracing the Mass Buildup of Supermassive Black Holes and their Host Galaxies
 Astro2010 Science White Paper: Tracing the Mass Buildup of Supermassive Black Holes and their Host Galaxies Anton M. Koekemoer (STScI) Dan Batcheldor (RIT) Marc Postman (STScI) Rachel Somerville (STScI)
Massive Neutral and Molecular Winds in Nearby Galaxies
 Massive Neutral and Molecular Winds in Nearby Galaxies S. Veilleux (U. Maryland) Powerful wide-angle outflow in Mrk 231 Gemini Press Release February 2011 (Rupke & SV 2011) QUEST: Quasar and ULIRG Evolution
The Correlation Between Supermassive Black Hole Mass and the Structure of Ellipticals and Bulges
 1 The Correlation Between Supermassive Black Hole Mass and the Structure of Ellipticals and Bulges Peter Erwin 1, Alister W. Graham 2, Nicola Caon 1 (1) Instituto de Astrofísica de Canarias, La Laguna,
Surface Photometry Quantitative description of galaxy morphology. Hubble Sequence Qualitative description of galaxy morphology
 Hubble Sequence Qualitative description of galaxy morphology Surface Photometry Quantitative description of galaxy morphology Galaxy structure contains clues about galaxy formation and evolution Point
SUPPLEMENTARY INFORMATION
 doi:10.1038/nature11096 Spectroscopic redshifts of CDF-N X-ray sources We have taken a recent compilation 13 as our main source of spectroscopic redshifts. These redshifts are given to two decimal places,
Thus Far. Intro / Some Definitions Hubble Classification Components of Galaxies. Specific Galaxy Types Star Formation Clusters of Galaxies
 Thus Far Intro / Some Definitions Hubble Classification Components of Galaxies Stars Gas Dust Black Holes Dark Matter Specific Galaxy Types Star Formation Clusters of Galaxies Components of Galaxies:
ACTIVE GALACTIC NUCLEI: optical spectroscopy. From AGN classification to Black Hole mass estimation
 ACTIVE GALACTIC NUCLEI: optical spectroscopy From AGN classification to Black Hole mass estimation Second Lecture Reverberation Mapping experiments & virial BH masses estimations Estimating AGN black hole
High Redshift Universe
 High Redshift Universe Finding high z galaxies Lyman break galaxies (LBGs) Photometric redshifts Deep fields Starburst galaxies Extremely red objects (EROs) Sub-mm galaxies Lyman α systems Finding high
The Hosts of Ultraluminous Infrared Galaxies
 Galaxy Dynamics: from the Early Universe to the Present ASP Conference Series, Vol. 3 10 8, 1999 F. Combes, G. A. Mamon and V. Charmandaris, eds. The Hosts of Ultraluminous Infrared Galaxies D. B. Sanders
Feeding the Beast. Chris Impey (University of Arizona)
") Feeding the Beast Chris Impey (University of Arizona) Note: the box is growing due to cosmic expansion but this is factored out. Heirarchical Structure Active Galactic Nuclei (AGN) Nuclear activity in
Feeding the Beast Chris Impey (University of Arizona) Note: the box is growing due to cosmic expansion but this is factored out. Heirarchical Structure Active Galactic Nuclei (AGN) Nuclear activity in
Lecture 15: Galaxy morphology and environment
 GALAXIES 626 Lecture 15: Galaxy morphology and environment Why classify galaxies? The Hubble system gives us our basic description of galaxies. The sequence of galaxy types may reflect an underlying physical
Black Holes in Hibernation
 Black Holes in Hibernation Black Holes in Hibernation Only about 1 in 100 galaxies contains an active nucleus. This however does not mean that most galaxies do no have SMBHs since activity also requires
TEMA 3. Host Galaxies & Environment
 TEMA 3. Host Galaxies & Environment AGN Dr. Juan Pablo Torres-Papaqui Departamento de Astronomía Universidad de Guanajuato DA-UG (México) papaqui@astro.ugto.mx División de Ciencias Naturales y Exactas,
Active Galaxies & Quasars
 Active Galaxies & Quasars Normal Galaxy Active Galaxy Galactic Nuclei Bright Active Galaxy NGC 5548 Galaxy Nucleus: Exact center of a galaxy and its immediate surroundings. If a spiral galaxy, it is the
The Redshift Evolution of Bulges and Disks of Spiral Galaxies in COSMOS
 Pathways through an Eclectic Universe ASP Conference Series, Vol. 390, c 2008 J. H. Knapen, T. J. Mahoney, and A. Vazdekis, eds. The Redshift Evolution of Bulges and Disks of Spiral Galaxies in COSMOS
Quantifying the Assembly History of Elliptical Galaxies
 Quantifying the Assembly History of Elliptical Galaxies Michael Pierce (University of Wyoming) A Science Use Case for GMT and TMT Origin of Elliptical Galaxies! Elliptical Galaxies Form Through Mergers!
C. Watson, E. Churchwell, R. Indebetouw, M. Meade, B. Babler, B. Whitney
 Reliability and Completeness for the GLIMPSE Survey C. Watson, E. Churchwell, R. Indebetouw, M. Meade, B. Babler, B. Whitney Abstract This document examines the GLIMPSE observing strategy and criteria
Dust properties of galaxies at redshift z 5-6
 Dust properties of galaxies at redshift z 5-6 Ivana Barisic 1, Supervisor: Dr. Peter L. Capak 2, and Co-supervisor: Dr. Andreas Faisst 2 1 Physics Department, University of Zagreb, Zagreb, Croatia 2 Infrared
Observing the Formation of Dense Stellar Nuclei at Low and High Redshift (?) Roderik Overzier Max-Planck-Institute for Astrophysics
 Roderik Overzier Max-Planck-Institute for Astrophysics") Observing the Formation of Dense Stellar Nuclei at Low and High Redshift (?) Roderik Overzier Max-Planck-Institute for Astrophysics with: Tim Heckman (JHU) GALEX Science Team (PI: Chris Martin), Lee Armus,
Observing the Formation of Dense Stellar Nuclei at Low and High Redshift (?) Roderik Overzier Max-Planck-Institute for Astrophysics with: Tim Heckman (JHU) GALEX Science Team (PI: Chris Martin), Lee Armus,
Major Review: A very dense article" Dawes Review 4: Spiral Structures in Disc Galaxies; C. Dobbs and J Baba arxiv "
 The Components of a Spiral Galaxy-a Bit of a Review- See MBW chap 11! we have discussed this in the context of the Milky Way" Disks:" Rotationally supported, lots of gas, dust, star formation occurs in
Journal Club Presentation on The BIMA Survey of Nearby Galaxies. I. The Radial Distribution of CO Emission in Spiral Galaxies by Regan et al.
 Journal Club Presentation on The BIMA Survey of Nearby Galaxies. I. The Radial Distribution of CO Emission in Spiral Galaxies by Regan et al. ApJ, 561:218-237, 2001 Nov 1 1 Fun With Acronyms BIMA Berkely
ASTRON 449: Stellar (Galactic) Dynamics. Fall 2014
 Dynamics. Fall 2014") ASTRON 449: Stellar (Galactic) Dynamics Fall 2014 In this course, we will cover the basic phenomenology of galaxies (including dark matter halos, stars clusters, nuclear black holes) theoretical tools
ASTRON 449: Stellar (Galactic) Dynamics Fall 2014 In this course, we will cover the basic phenomenology of galaxies (including dark matter halos, stars clusters, nuclear black holes) theoretical tools
Galaxies with Active Nuclei. Active Galactic Nuclei Seyfert Galaxies Radio Galaxies Quasars Supermassive Black Holes
 Galaxies with Active Nuclei Active Galactic Nuclei Seyfert Galaxies Radio Galaxies Quasars Supermassive Black Holes Active Galactic Nuclei About 20 25% of galaxies do not fit well into Hubble categories
Lecture 19: Galaxies. Astronomy 111
 Lecture 19: Galaxies Astronomy 111 Galaxies What is a galaxy? Large assembly of stars, gas and dust, held together by gravity Sizes: Largest: ~1 Trillion stars (or more) Smallest: ~10 Million stars Milky
Galaxies. Need a (physically) meaningful way of describing the relevant properties of a galaxy.
 meaningful way of describing the relevant properties of a galaxy.") Galaxies Aim to understand the characteristics of galaxies, how they have evolved in time, and how they depend on environment (location in space), size, mass, etc. Need a (physically) meaningful way of
Galaxies Aim to understand the characteristics of galaxies, how they have evolved in time, and how they depend on environment (location in space), size, mass, etc. Need a (physically) meaningful way of
Cross-Talk in the ACS WFC Detectors. I: Description of the Effect
 Cross-Talk in the ACS WFC Detectors. I: Description of the Effect Mauro Giavalisco August 10, 2004 ABSTRACT Images acquired with the Wide Field Channel (WFC) of the Advanced Camera for Surveys (ACS) are
Ultra Luminous Infared Galaxies. Yanling Wu Feb 22 nd,2005
 Ultra Luminous Infared Galaxies Yanling Wu Feb 22 nd,2005 The Biggest and the brightest Biggest and the best & best and the brightest Definition: LIRG: L8-1000umL
Low-Ionization BAL QSOs in Ultraluminous Infrared Systems
 Mass Outflow in Active Galactic Nuclei: New Perspectives ASP Conference Series, Vol. TBD, 2001 D.M. Crenshaw, S.B. Kraemer, and I.M. George Low-Ionization BAL QSOs in Ultraluminous Infrared Systems Gabriela
Fundamental Planes and Galaxy Formation
 Fundamental Planes and Galaxy Formation Philip Hopkins, NoviCosmo 2007 Fundamental Planes = Scaling Laws Obeyed by Galaxies vs Origin of scaling laws: Ideally, we d understand every galaxy as an individual:
Lecture 11: SDSS Sources at Other Wavelengths: From X rays to radio. Astr 598: Astronomy with SDSS
 Astr 598: Astronomy with SDSS Spring Quarter 4, University of Washington, Željko Ivezić Lecture : SDSS Sources at Other Wavelengths: From X rays to radio Large Surveys at Many Wavelengths SDSS: UV-IR five-band
New Results on the AGN Content of Galaxy Clusters
 Carnegie Observatories Astrophysics Series, Vol. 3: Clusters of Galaxies: Probes of Cosmological Structure and Galaxy Evolution ed. J. S. Mulchaey, A. Dressler, and A. Oemler (Pasadena; Carnegie Observatories:
This figure "fig1_1.jpg" is available in "jpg" format from:
 This figure "fig1_1.jpg" is available in "jpg" format from: arxiv:astro-ph/0207373v2 19 Aug 2002 TABLE 1 Observing Log IRAS z log( Lir ) Optical Near-Infrared L F SC Date Exp. Seeing Date Exp. Seeing (1)
Techniques for measuring astronomical distances generally come in two variates, absolute and relative.
 Chapter 6 Distances 6.1 Preliminaries Techniques for measuring astronomical distances generally come in two variates, absolute and relative. Absolute distance measurements involve objects possibly unique
Chapter 10: Unresolved Stellar Populations
 Chapter 10: Unresolved Stellar Populations We now consider the case when individual stars are not resolved. So we need to use photometric and spectroscopic observations of integrated magnitudes, colors
NICMOS Status and Plans
 1997 HST Calibration Workshop Space Telescope Science Institute, 1997 S. Casertano, et al., eds. NICMOS Status and Plans Rodger I. Thompson Steward Observatory, University of Arizona, Tucson, AZ 85721
The cosmic distance scale
 The cosmic distance scale Distance information is often crucial to understand the physics of astrophysical objects. This requires knowing the basic properties of such an object, like its size, its environment,
The Role of Dissipation in Spheroid Formation
 The Role of Dissipation in Spheroid Formation Philip Hopkins 4/08/08 Lars Hernquist, TJ Cox, John Kormendy, Tod Lauer, Suvendra Dutta, Dusan Keres, Volker Springel Ellipticals & Bulges: Formation in Mergers?
Part two of a year-long introduction to astrophysics:
 ASTR 3830 Astrophysics 2 - Galactic and Extragalactic Phil Armitage office: JILA tower A909 email: pja@jilau1.colorado.edu Spitzer Space telescope image of M81 Part two of a year-long introduction to astrophysics:
Extended Molecular Gas Distribution in Mrk 273 and Merger-Luminosity Evolution
 University of Massachusetts Amherst From the SelectedWorks of Min S. Yun October 1, 1995 Extended Molecular Gas Distribution in Mrk 273 and Merger-Luminosity Evolution Min S. Yun, University of Massachusetts
Energy Sources of the Far IR Emission of M33
 Energy Sources of the Far IR Emission of M33 Hinz, Reike et al., ApJ 154: S259 265 (2004). Presented by James Ledoux 24 µm 70 µm 160 µm Slide 1 M33 Properties Distance 840kpc = 2.7 Mlyr (1'' ~ 4 pc) Also
Quantifying the (Late) Assembly History of Galaxies. Michael Pierce (University of Wyoming)
 Assembly History of Galaxies. Michael Pierce (University of Wyoming)") Quantifying the (Late) Assembly History of Galaxies Michael Pierce (University of Wyoming) What I Think We Already Know: Morphology Density Relation (Assembly Depends on Environment) (Dressler 1980) Ratio
Quantifying the (Late) Assembly History of Galaxies Michael Pierce (University of Wyoming) What I Think We Already Know: Morphology Density Relation (Assembly Depends on Environment) (Dressler 1980) Ratio
Deep Surveys or How We Learn About the Early Universe When We Can t Measure All that Would Be Nice!
 Deep Surveys or How We Learn About the Early Universe When We Can t Measure All that Would Be Nice! Presented at the AAS Seminar on Infrared Astronomy, AAS Meeting, Jan 7, 2003, Seattle Marcia Rieke mrieke@as.
ASTRO504 Extragalactic Astronomy. 2. Classification
 ASTRO504 Extragalactic Astronomy 2. Classification Morphological classification Elliptical (E) galaxies Lenticular (SO) galaxies Spiral (S) galaxies Irregular (Im) galaxies The realm of nebulae Hubble
Extragalactic Sub-Committee, Keck NGAO
 Extragalactic Sub-Committee, Keck NGAO Claire Max, Tommaso Treu, Aaron Barth, David Koo, Chuck Steidel, Richard Ellis, Rich Dekaney CfAO Workshop on Keck NGAO March 30-31, 2006 We are focusing on four
Demographics of radio galaxies nearby and at z~0.55. Are radio galaxies signposts to black-hole mergers?
 Elaine M. Sadler Black holes in massive galaxies Demographics of radio galaxies nearby and at z~0.55 Are radio galaxies signposts to black-hole mergers? Work done with Russell Cannon, Scott Croom, Helen
Gas Accretion & Outflows from Redshift z~1 Galaxies
 Gas Accretion & Outflows from Redshift z~1 Galaxies David C. Koo Kate Rubin, Ben Weiner, Drew Phillips, Jason Prochaska, DEEP2, TKRS, & AEGIS Teams UCO/Lick Observatory, University of California, Santa
Underneath the Monster: In which galaxies are black holes growing?
 Underneath the Monster: In which galaxies are black holes growing? Mauricio Cisternas Ins:tuto de Astrofisica de Canarias, Spain + Nacho Trujillo Jürgen Fliri Johan Knapen dagalnetwork.eu ESO San:ago,
Quantifying Secular Evolution Through Structural Decomposition
 Quantifying Secular Evolution Through Structural Decomposition University of St Andrews / ICRAR (UWA) o How do structures form? bulge disk bar pseudo-bulge disk bulge??? o Are ellipticals and bulges essentially
Galaxies. Hubble's measurement of distance to M31 Normal versus other galaxies Classification of galaxies Ellipticals Spirals Scaling relations
 Galaxies Hubble's measurement of distance to M31 Normal versus other galaxies Classification of galaxies Ellipticals Spirals Scaling relations Cepheids in M31 Up to 1920s, the Milky Way was thought by
A PRELIMINARY CLASSIFICATION SCHEME FOR THE CENTRAL REGIONS OF LATE-TYPE GALAXIES
 A PRELIMINARY CLASSIFICATION SCHEME FOR THE CENTRAL REGIONS OF LATE-TYPE GALAXIES SIDNEY VAN DEN BERGH* Dominion Astrophysical Observatory, National Research Council 5071 West Saanich Road, Victoria, B.C.,
Chapter 19 Galaxies. Hubble Ultra Deep Field: Each dot is a galaxy of stars. More distant, further into the past. halo
 Chapter 19 Galaxies Hubble Ultra Deep Field: Each dot is a galaxy of stars. More distant, further into the past halo disk bulge Barred Spiral Galaxy: Has a bar of stars across the bulge Spiral Galaxy 1
Institute for Advanced Study, Princeton, NJ 08540
 Space Telescope Science Institute ewsletter May 1995, Vol. 12, o. 1, pages 1{3 What Causes a Quasar? John. Bahcall Institute for Advanced Study, Princeton, J 08540 Space Telescope Science Institute ewsletter,
9. Evolution with redshift - z > 1.5. Selection in the rest-frame UV
 11-5-10see http://www.strw.leidenuniv.nl/ franx/college/galaxies10 10-c09-1 11-5-10see http://www.strw.leidenuniv.nl/ franx/college/galaxies10 10-c09-2 9. Evolution with redshift - z > 1.5 Selection in
Introduction to AGN. General Characteristics History Components of AGN The AGN Zoo
 Introduction to AGN General Characteristics History Components of AGN The AGN Zoo 1 AGN What are they? Active galactic nucleus compact object in the gravitational center of a galaxy that shows evidence
UNIVERSITY OF SOUTHAMPTON
 UNIVERSITY OF SOUTHAMPTON PHYS2013W1 SEMESTER 1 EXAMINATION 2012/13 GALAXIES Duration: 120 MINS Answer all questions in Section A and two and only two questions in Section B. Section A carries 1/3 of the
Multi-wavelength analysis of Hickson Compact Groups of Galaxies.
 Multi-wavelength analysis of Hickson Compact Groups of Galaxies. Thodoris Bitsakis Department of Physics, University of Crete Paper: Bitsakis T., Charmandaris V., da Cunha E., Diaz-Santos T., Le Floc h
Black Hole and Host Galaxy Mass Estimates
 Black Holes Black Hole and Host Galaxy Mass Estimates 1. Constraining the mass of a BH in a spectroscopic binary. 2. Constraining the mass of a supermassive BH from reverberation mapping and emission line
Lecture Outlines. Chapter 25. Astronomy Today 7th Edition Chaisson/McMillan Pearson Education, Inc.
 Lecture Outlines Chapter 25 Astronomy Today 7th Edition Chaisson/McMillan Chapter 25 Galaxies and Dark Matter Units of Chapter 25 25.1 Dark Matter in the Universe 25.2 Galaxy Collisions 25.3 Galaxy Formation
The Most Luminous Radio Galaxies
 The Most Luminous Radio Galaxies The physics of radio galaxies and quasars The origin of their strong cosmological evolution Where they fit into the scheme of galaxy formation and evolution How does it
Galaxy Collisions & the Origin of Starburst Galaxies & Quasars. February 24, 2003 Hayden Planetarium
 Galaxy Collisions & the Origin of Starburst Galaxies & Quasars February 24, 2003 Hayden Planetarium Normal massive galaxy types elliptical & spiral galaxies Spiral Bulge of old stars Large black hole Very
Black Holes and Active Galactic Nuclei
 Black Holes and Active Galactic Nuclei A black hole is a region of spacetime from which gravity prevents anything, including light, from escaping. The theory of general relativity predicts that a sufficiently
Galaxies. Galaxy Diversity. Galaxies, AGN and Quasars. Physics 113 Goderya
 Galaxies, AGN and Quasars Physics 113 Goderya Chapter(s): 16 and 17 Learning Outcomes: Galaxies Star systems like our Milky Way Contain a few thousand to tens of billions of stars. Large variety of shapes
2. Active Galaxies. 2.1 Taxonomy 2.2 The mass of the central engine 2.3 Models of AGNs 2.4 Quasars as cosmological probes.
 2. Active Galaxies 2.1 Taxonomy 2.2 The mass of the central engine 2.3 Models of AGNs 2.4 Quasars as cosmological probes Read JL chapter 3 Active galaxies: interface with JL All of JL chapter 3 is examinable,
Astr 2320 Thurs. April 27, 2017 Today s Topics. Chapter 21: Active Galaxies and Quasars
 Astr 2320 Thurs. April 27, 2017 Today s Topics Chapter 21: Active Galaxies and Quasars Emission Mechanisms Synchrotron Radiation Starburst Galaxies Active Galactic Nuclei Seyfert Galaxies BL Lac Galaxies
More Galaxies. Scaling relations Extragalactic distances Luminosity functions Nuclear black holes
 More Galaxies Scaling relations Extragalactic distances Luminosity functions Nuclear black holes Tully-Fisher relation velocity profile of gas Luminosity vs velocity width WR In spirals, luminosity L ~
Nuclear Star Formation, The Torus, & Gas Inflow in Seyfert Galaxies
 Nuclear Star Formation, The Torus, & Gas Inflow in Seyfert Galaxies Richard Davies 1, H. Engel 1, M. Schartmann 1, G. Orban de Xivry 1, E. Sani 2, E. Hicks 3, A. Sternberg 4, R. Genzel 1, L. Tacconi 1,
Active Galactic Nuclei
 Active Galactic Nuclei Optical spectra, distance, line width Varieties of AGN and unified scheme Variability and lifetime Black hole mass and growth Geometry: disk, BLR, NLR Reverberation mapping Jets
LeMMINGs the emerlin radio legacy survey of nearby galaxies Ranieri D. Baldi
 LeMMINGs the emerlin radio legacy survey of nearby galaxies Ranieri D. Baldi in collaboration with I. McHardy, D. Williams, R. Beswick and many others The radio-loud / radio-quiet dichotomy Among the many
The AGN / host galaxy connection in nearby galaxies.
 The AGN / host galaxy connection in nearby galaxies. A new view of the origin of the radio-quiet / radio-loud dichotomy? Alessandro Capetti & Barbara Balmaverde (Observatory of Torino Italy) The radio-quiet
Active Galactic Alexander David M Nuclei
 d.m.alexander@durham.ac.uk Durham University David M Alexander Active Galactic Nuclei The Power Source QuickTime and a YUV420 codec decompressor are needed to see this picture. Black hole is one billionth
Star systems like our Milky Way. Galaxies
 Galaxies Star systems like our Milky Way Galaxies Contain a few thousand to tens of billions of stars,as well as varying amounts of gas and dust Large variety of shapes and sizes Gas and Dust in
Massive Outflows from Radio-Loud Quasars. Alan Stockton Hai Fu Institute for Astronomy University of Hawaii
 Massive Outflows from Radio-Loud Quasars Alan Stockton Hai Fu Institute for Astronomy University of Hawaii 4C 37.43 Continuum 4C 37.43 [O III] 4C 37.43 Continuum 4C 37.43 [O III] Characteristics of EELRs
IRS Spectroscopy of z~2 Galaxies
 IRS Spectroscopy of z~2 Galaxies Houck et al., ApJ, 2005 Weedman et al., ApJ, 2005 Lutz et al., ApJ, 2005 Astronomy 671 Jason Marshall Opening the IR Wavelength Regime for Discovery One of the primary
MIT Invitational, Jan Astronomy C. 2. You may separate the pages, but do not forget to put your team number at the top of all answer pages.
 MIT Invitational, Jan 2019 Astronomy C Competitors: School name: Team number: INSTRUCTIONS 1. Please turn in all materials at the end of the event. 2. You may separate the pages, but do not forget to put
Source plane reconstruction of the giant gravitational arc in Abell 2667: a condidate Wolf-Rayet galaxy at z 1
 Source plane reconstruction of the giant gravitational arc in Abell 2667: a condidate Wolf-Rayet galaxy at z 1 Speaker: Shuo Cao Department of Astronomy Beijing Normal University Collaborators: Giovanni
Paul Sell. University of Wisconsin-Madison Advisor: Christy Tremonti
 A SAMPLE OF EXTREME MERGER-DRIVEN STARBURST GALAXIES AS VIEWED BY THE CHANDRA AND HUBBLE SPACE TELESCOPES Paul Sell University of Wisconsin-Madison Advisor: Christy Tremonti Collaboration: Aleks Diamond-Stanic,
Astr Resources
 Astr 8400 - Resources Course web page: http://www.astro.gsu.edu/~crenshaw/astr8400.html Electronic papers: http://adsabs.harvard.edu/abstract_service.html NASA Extragalactic Database: http://nedwww.ipac.caltech.edu
An analogy. "Galaxies" can be compared to "cities" What would you like to know about cities? What would you need to be able to answer these questions?
 An analogy "Galaxies" can be compared to "cities" What would you like to know about cities? how does your own city look like? how big is it? what is its population? history? how did it develop? how does
Frequency of Seyfert Type Transitions in a Sample of 102 Local Active Galactic Nuclei
 Frequency of Seyfert Type Transitions in a Sample of 102 Local Active Galactic Nuclei Jordan Runco A Thesis presented for the degree of Physics Department of Physics California Polytechnic State University
arxiv:astro-ph/ v1 14 Jan 2002
 The Central kpc of Starbursts and AGN ASP Conference Series, Vol. xxx, 2001 J. H. Knapen, J. E. Beckman, I. Shlosman, and T. J. Mahoney Molecular Gas in The Central Kpc of Starbursts and AGN Shardha Jogee
The symbiotic nature of AGN and SF activities of AGNs probed by the PAH 3.3 micron emission feature
 The symbiotic nature of AGN and SF activities of AGNs probed by the PAH 3.3 micron emission feature Ji Hoon Kim Subaru Telescope National Astronomical Observatory of Japan Along with Myungshin Im, Dohyeong
Quasars and Active Galactic Nuclei (AGN)
") Quasars and Active Galactic Nuclei (AGN) Astronomy Summer School in Mongolia National University of Mongolia, Ulaanbaatar July 21-26, 2008 Kaz Sekiguchi Hubble Classification M94-Sa M81-Sb M101-Sc M87-E0
Quasars and Active Galactic Nuclei (AGN) Astronomy Summer School in Mongolia National University of Mongolia, Ulaanbaatar July 21-26, 2008 Kaz Sekiguchi Hubble Classification M94-Sa M81-Sb M101-Sc M87-E0
arxiv: v1 [astro-ph.co] 27 May 2009
![arxiv: v1 [astro-ph.co] 27 May 2009](/thumbs/93/114480446.jpg "arxiv: v1 [astro-ph.co] 27 May 2009") **FULL TITLE** ASP Conference Series, Vol. **VOLUME**, **YEAR OF PUBLICATION** **NAMES OF EDITORS** The Pedigrees of DOGs (Dust-Obscured Galaxies) arxiv:0905.453v [astro-ph.co] 27 May 2009 Arjun Dey National
**FULL TITLE** ASP Conference Series, Vol. **VOLUME**, **YEAR OF PUBLICATION** **NAMES OF EDITORS** The Pedigrees of DOGs (Dust-Obscured Galaxies) arxiv:0905.453v [astro-ph.co] 27 May 2009 Arjun Dey National
Ay 127 Systematics of Galaxy Properties and Scaling Relations
 Ay 127 Systematics of Galaxy Properties and Scaling Relations Morphological Classification and Galaxy Types The first step in any empirical science: look for patterns and trends, then try to understand
A Supermassive Black Hole in the Dwarf Starburst Galaxy Henize Amy Reines Einstein Fellow National Radio Astronomy Observatory
 A Supermassive Black Hole in the Dwarf Starburst Galaxy Henize 2-10 Amy Reines Einstein Fellow National Radio Astronomy Observatory Supermassive black holes and galaxy evolution Supermassive black holes
The Classification of Galaxies
 Admin. 11/9/17 1. Class website http://www.astro.ufl.edu/~jt/teaching/ast1002/ 2. Optional Discussion sections: Tue. ~11.30am (period 5), Bryant 3; Thur. ~12.30pm (end of period 5 and period 6), start
arxiv:astro-ph/ v1 5 Nov 2003
 Mon. Not. R. Astron. Soc. 000, 1 19 (200?) Printed 5 February 2008 (MN LATEX style file v2.2) Quasar host galaxy star formation activity from multicolour data arxiv:astro-ph/0311123v1 5 Nov 2003 K. Jahnke,
SKINAKAS OBSERVATORY. Astronomy Projects for University Students PROJECT GALAXIES
 PROJECT 7 GALAXIES Objective: The topics covered in the previous lessons target celestial objects located in our neighbourhood, i.e. objects which are within our own Galaxy. However, the Universe extends
Chapter 19 Lecture. The Cosmic Perspective. Seventh Edition. Our Galaxy Pearson Education, Inc.
 Chapter 19 Lecture The Cosmic Perspective Seventh Edition Our Galaxy 19.1 The Milky Way Revealed Our goals for learning: Where are we located within our galaxy? What does our galaxy look like? How do stars
12.1 Elliptical Galaxies
 12.1 Elliptical Galaxies Elliptical Galaxies Old view: ellipticals are boring, simple systems Ellipticals contain no gas & dust Ellipticals are composed of old stars Ellipticals formed in a monolithic
Galaxies. CESAR s Booklet
 What is a galaxy? Figure 1: A typical galaxy: our Milky Way (artist s impression). (Credit: NASA) A galaxy is a huge collection of stars and interstellar matter isolated in space and bound together by