arxiv: v1 [astro-ph.he] 21 Apr 2013
|
|
|
- Melvin Osborne
- 5 years ago
- Views:
Transcription
1 Astronomy & Astrophysics manuscript no. cdfscat c ESO 2018 September 5, 2018 The XMM-Newton deep survey in the Chandra Deep Field South. III. Point source catalogue and number counts in the hard X-rays P. Ranalli 1,2,3, A. Comastri 2, C. Vignali 3,2, F. J. Carrera 4, N. Cappelluti 2, R. Gilli 2, S. Puccetti 6, W. N. Brandt 7,8, H. Brunner 9, M. Brusa 3,2,9, I. Georgantopoulos 1,2, K. Iwasawa 5, and V. Mainieri 10 arxiv: v1 [astro-ph.he] 21 Apr Institute for Astronomy, Astrophysics, Space Applications and Remote Sensing, National Observatory of Athens, Palaia Penteli, Athens, Greece piero.ranalli@oabo.inaf.it 2 INAF Osservatorio Astronomico di Bologna, via Ranzani 1, Bologna, Italy 3 Università di Bologna, Dipartimento di Fisica e Astronomia, via Berti Pichat 6/2, Bologna, Italy 4 Instituto de Física de Cantabria (CSIC-UC), Santander, Spain 5 ICREA and Institut de Ciències del Cosmos (ICC), Universitat de Barcelona, (IEEC-UB), Martí y Franquès 1, Barcelona, Spain 6 ASI Science Data Center, via Galileo Galilei, 00044, Frascati, Italy 7 Department of Astronomy and Astrophysics, Pennsylvania State University, University Park, PA 16802, USA 8 Institute for Gravitation and the Cosmos, Pennsylvania State University, University Park, PA 16802, USA 9 Max-Planck-Institut für extraterrestrische Physick, Garching, Germany 10 ESO, Karl-Schwarschild-Strasse 2, 85748, Garching bei Mnchen, Germany Received ; accepted ABSTRACT Nuclear obscuration plays a key role in the initial phases of AGN growth, yet not many highly obscured AGN are currently known beyond the local Universe, and their search is an active topic of research. The XMM-Newton survey in the Chandra Deep Field South (XMM-CDFS) aims at detecting and studying the spectral properties of a significant number of obscured and Compton-thick (N H cm 2 ) AGN. The large effective area of XMM-Newton in the 2 10 and 5 10 kev bands, coupled with a 3.45 Ms nominal exposure time (2.82 and 2.45 Ms after lightcurve cleaning for MOS and PN respectively), allows us to build clean samples in both bands, and makes the XMM-CDFS the deepest XMM-Newton survey currently published in the 5 10 kev band. The large multiwavelength and spectroscopic coverage of the CDFS area allows for an immediate and abundant scientific return. In this paper, we present the data reduction of the XMM-CDFS observations, the method for source detection in the 2 10 and 5 10 kev bands, and the resulting catalogues. A number of 339 and 137 sources are listed in the above bands with flux limits of and erg s 1 cm 2, respectively. The flux limits at 50% of the maximum sky coverage are and erg s 1 cm 2, respectively. The catalogues have been cross-correlated with the Chandra ones: 315 and 130 identifications have been found with a likelihoodratio method, respectively. A number of 15 new sources, previously undetected by Chandra, is found; 5 of them lie in the 4 Ms area. Redshifts, either spectroscopic or photometric, are available for 92% of the sources. The number counts in both bands are presented and compared to other works. The survey coverage has been calculated with the help of two extensive sets of simulations, one set per band. The simulations have been produced with a newly-developed simulator, written with the aim of the most careful reproduction of the background spatial properties. For this reason, we present a detailed decomposition of the XMM-Newton background into its components: cosmic, particle, and residual soft protons. The three components have different spatial distributions. The importance of these three components depends on the band and on the camera; the particle background is the most important one (80 90% of the background counts), followed by the soft protons (4 20%). Key words. Catalogs surveys galaxies: active methods: data analysis X-rays: general 1. Introduction The understanding that the X-ray background (XRB) is due to unresolved emission by discrete extragalactic sources (Giacconi & Zamorani 1987; Schwartz et al. 1976; Maccacaro et al. 1991), and that obscured AGN are a key ingredient to produce the observed shape of the XRB spectrum (Setti & Woltjer 1989; Comastri et al. 1995) has put a strong focus on the role of absorption as a driver of the observable properties. This idea has shaped the original model of AGN unification (Antonucci 1993; Urry & Padovani 1995) and keeps its importance unaltered in Based on observations obtained with XMM-Newton, an ESA science mission with instruments and contributions directly funded by ESA Member States and NASA. the current modelling of AGN and of their evolving populations (Treister & Urry 2005; Gilli et al. 2007; Treister et al. 2009a). Nuclear obscuration might be associated with the initial phases of AGN emission (Page et al. 2004; Hopkins et al. 2006; Menci et al. 2008). The idea is that a large gas reservoir is available at high redshift to feed (and obscure) an accreting supermassive black hole. The same gas reservoir would also sustain high star formation rates in the host galaxy, leading to the broad similarity between the cosmic histories of accretion and star formation. Deep X-ray surveys are a primary tool for the census of AGN and the study of the properties of their populations. Since the launch of the Einstein observatory, the first imaging X-ray tele- 1
2 scope, many surveys have been perfomed with different combinations of area and flux limit and in many locations on the sky. The Chandra Deep Field South (CDFS) survey started with 1 Ms of observations (Giacconi et al. 2002) and was afterwards extended to 2 Ms (Luo et al. 2008) and finally to 4 Ms (Xue et al. 2011, hereafter X11). It currently reaches the deepest X- ray fluxes ever probed, with a flux limit of erg s 1 cm 2 in the soft (0.5 2 kev) band. However, given the energy dependence of its effective area, Chandra is much less sensitive in the hard and very hard bands (2 10 kev and 5 10 kev, respectively) which are the most important for obscured objects. The flux limit for 2 10 kev is currently erg s 1 cm 2 (X11). The only analysis for the 5 10 kev band was done for the initial 1 Ms survey (Rosati et al. 2002) and yielded a flux limit of erg s 1 cm 2 ; however, the 4 Ms survey was analysed in the 4 8 kev band, moving the flux limit to erg s 1 cm 2 (Lehmer et al. 2012). A larger area centred around the CDFS was surveyed with Chandra and with much shorter exposure times as the Extended CDFS (ECDFS; Lehmer et al. 2005). XMM-Newton is better suited to collect photons in the hard and very hard bands, because at energies 5 kev the XMM-Newton effective area drops less sharply than Chandra s. However, it has a larger point spread function (PSF), which makes it suffer more from source confusion, and it has a higher instrumental background. While XMM-Newton surveys cannot probe very faint fluxes as Chandra, they provide good quality spectroscopy in the whole kev band for a large number of sources. The large effective area of XMM-Newton has been exploited in several surveys, including the Lockman Hole (with 1 Ms of exposure, Brunner et al. 2008), the ELAIS-S1 field (Puccetti et al. 2006), COSMOS (Cappelluti et al. 2007, 2009), and 2XMM (Mateos et al. 2008). The XMM-Newton survey in the CDFS (hereafter XMM- CDFS) has been started with the main aim of finding obscured AGN, especially the Compton-thick ones, and studying their properties. With a nominal exposure of 3.45 Ms centred on a single point on the sky it is currently the deepest XMM-Newton observation ever performed. Moreover, it has the advantage of having almost pan-chromatic coverage and a large number of available optical spectra and redshifts. The first results of the XMM-CDFS survey have been published in Comastri et al. (2011). Different approaches to the selection and study of obscured sources are being employed (Iwasawa et al. 2012; Georgantopoulos et al. 2013; spectral stacking (Falocco et al., submitted to A&A) and spectral analysis of a flux limited sample (Comastri et al., in prep.) are also ongoing. Extended sources will be discussed in Finoguenov et al. (in prep.). In the present paper, we present the hard and very hard catalogues, and the Log N Log S in the two bands. A number of 339 and 137 sources are detected, respectively, with a significance threshold roughly equivalent to 4.8σ. Supplementary catalogues are provided for sources with lower significance (4σ). In Sect. 2 we present the observation details and the data reduction procedure. In Sect. 3 we describe the source detection procedure and present the catalogues in the hard and very hard bands. The survey coverage and number counts are presented in Sect. 4. Simulations of mock XMM-CDFS fields are instrumental in determining the coverage, and are presented in Sect. 5. The simulations also used in Sect. 6 for a first estimate of the number of spurious sources. We present in Sect. 7 an analysis of the source confusion in the hard band. In Sect. 8 we identify the Chandra counterparts to the XMM-Newton sources. We Fig. 1. Total surface brightness in the 2 10 kev band for the 33 obsids of the XMM-CDFS, after excluding th epositions around the 30 brightest sources. The increase in background intensity between 2002 and 2008 is evident. The obsids are numbered from 1 to 33 according to observation date; the vertical dotted line marks the separation between the and observations. Filled triangles: PN; filled circles: MOS1. The MOS2 camera has values very similar to the MOS1. summarize our conclusions in Sect. 9. Finally, in Appendix A we present the simulator that we have developed. 2. Observations and data reduction The Chandra Deep Field South was initially observed by XMM- Newton in the years (P.I.: J. Bergeron) with an exposure of 541 ks. It was observed again, for the proposal which led to this series of papers, in the years (P.I.: A. Comastri), to reach a nominal exposure of 3.45 Ms. Table 1 shows the observation dentification number (hereafter obsid), date, pointing and exposure for all observations. The number of obsids is 33; considering the MOS1, MOS2 and PN cameras, the XMM-CDFS survey comprises a total of 99 event files. We used the XMM-Newton SAS software for our analysis (version 10 for the initial processing and the catalogue; version 11 for the simulations; there have not been significant changes between the two versions which could affect this work), with the help of many custom-developed scripts to automate most of the data processing Background flares and quiescent level Each one of the 99 event files was screened individually for background flares. Full-field light curves were generated in the kev interval. A 3σ-clipping procedure was applied to the light curves to identify and reject the high-background periods. This procedure worked well most times, though it failed for some event files which were severely flared. In such cases, we adopted the nominal count rate thresholds given by the 2

3 Fig. 2. Images of the XMM-CDFS in the 2 10 (left) and 5 10 kev (right) bands. The colour wedges show the total counts as the sum of data from the MOS1, MOS2 and PN cameras. XMM-Newton documentation 1 to identify and reject the highbackground periods; these observations are marked in Table 1. A relevant and unexpected feature is an increase by a factor of 2 in the quiescent background level in the observations with respect to the years (Fig. 1). The increase is seen in all three cameras and is due to the instrumental ( particle ) component of the background (see Sect. 5). The reason for this increase is not clear, though one possibility is that it is related to the Solar cycle. The images in the 2 10 and 5 10 kev bands, showing the total counts from the MOS and PN cameras, are presented in Fig. 2. The total exposure, after the high-background period filtering, is thus 2.82 and 2.45 Ms for the two MOS and the PN, respectively. The exposure maps for the 2 10 and 5 10 kev bands are shown in Fig Copper lines complex For the PN camera, the strongest background feature in the 2-10 kev interval is a complex of lines (Cu Kα, Ni Kα, Zn Kα, the Cu being the strongest one) around 8 kev, due to fluorescence from the mirror holding structure, and which alone can make 30% of the total counts in the 2-10 kev band. This complex has a well-defined spatial pattern with a central region where it is virtually absent 2. Throughout this paper, in PN data we have excluded the energy intervals pertaining to this complex. We have chosen different trade-offs for the 2 10 and 5 10 kev bands. For the 2 10 kev band, we have excluded the Cu complex (energy intervals and kev) across all the field, to favour a uniform 1 EPIC filterbackground.shtml 2 XMM-Newton Users Handbook, Issue 2.10, Sect ; external/ xmm user support/ documentation/ uhb/ epicintbkgd.html coverage. For the 5 10 kev band, given the smaller energy band and the lower signal/noise ratio, we have been more aggressive in excluding the Cu complex (energy intervals , and kev), but we have done so only in the outer detector regions where the line is present. Our aim for 5 10 kev has been to retain the photons around 8 kev in the centre of the FOV at the expense of a less uniform coverage of the field Pointings and astrometry The XMM-CDFS observations have been taken with some differences in the pointing direction, in order to have a field coverage as uniform as possible with the PN detector. Because of the field visibility, the observations have been performed in the months of January, February and July. The orbit of XMM- Newton modulates the position angle, so that the satellite rotates along its optical axis by about 180 deg every six months. Therefore, when looked at in detector coordinates, observations performed in summer appear upside-down with respect to the winter ones. While the MOS detectors are centred on the respective telescope optical axes, the PN is shifted by 2. The pointing coordinates have thus to be shifted by twice that amount in order to position the PN on the same sky region in the two seasons. This, however, has the effect of making the MOS detectors offset with respect to the nominal CDFS coordinates. Minor shifts of 1 were added to all observations, to smooth the chip gaps and to avoid the possibility that any source could fall in a gap for a major part of the survey. On top of these patterns, there are smaller random errors ( 1, with 4 obsids in which they were 4 ) in the pointing direction. These have been estimated by running a source detection on the inner 5 of each obsid, and cross-correlating the results with the Chandra catalogue (X11) using a modified version of Chandra s routine align evt. The event and attitude files have been corrected for these shifts. All coordinates have 3

4 6.86e+06 27:30:00.0 ECDFS 6.17e+06 35:00.0 CDFS 4Ms 5.49e+06 Declination 50: : :00.0 B C D A 4.80e e e+06 55: e+06 28:00: e+06 05: : :33: : : e e+05 Right ascension 0.00e e+06 27:30:00.0 ECDFS 6.00e+06 35:00.0 CDFS 4Ms 5.34e+06 Declination 50: : :00.0 B C D A 4.67e e e+06 55: e+06 28:00: e+06 05: : :33: : : e e+05 Right ascension 0.00e+00 Fig. 3. Exposure maps of the XMM-CDFS in the 2 10 (left) and 5 10 kev (right) bands. The Chandra 4 Ms and ECDS areas, and the 4 pointing positions and groups are superimposed with different symbols and letter marks according to the observing season (see Table 1). The colour wedges show the exposure time in s as the sum of the MOS1, MOS2 and PN exposures.
5 been aligned to those from X11 (which was itself aligned to VLA radio frame). The XMM-Newton PSF has a 5 FWHM on-axis, which degrades at large off-axis angles 3. We measured the observed 2 10 kev FWHM of the 50 brightest sources for the total 3Ms image and we found that the median FWHM, across the whole field, is Colour image A colour image of the XMM-CDFS has been derived from the cleaned, astrometry-aligned data. Three images in the 0.4-1, 1-2 and 2-8 kev energy intervals have been produced. To better enhance the sources, the background has been suppressed up to different thresholds in the three bands. Finally, the non-linear scaling and colour-mixing procedure by Lupton et al. (2004), whose main advantage is that bright sources are not whited-out, has been applied producing the colour image shown in Fig Catalogue The 2-10 and 5-10 kev catalogues have been produced independently. A two-stage process has been used: the first step is a detection with a wavelet code (PWXDetect), followed by maximum likelihood fitting (EMLDetect) of the sources. This detection method can be regarded as a variant of the standard XMM-Newton detection process, which uses a sliding box detection algorithm for the first stage instead of the wavelet (see e.g. Brunner et al and Cappelluti et al for applications to the Lockman Hole and COSMOS surveys, respectively). The advantage of using a wavelet-based tool is that it produces more accurate source positions (Puccetti et al. 2009), and that it is especially suited for crowded fields, as happens in a few small areas of the CDFS. Another difference with respect to the Lockman Hole and COSMOS applications is that we chose a higher threshold (i.e., more conservative) for the first stage than for the second (see below); doing so means that the selection is mostly done at the first stage, and that the second is used mainly for the counts estimate. First, we ran the Palermo Wavelet XMM Detect (PWXDetect) software to identify source candidates. PWXDetect is a version of the PWDetect tool (Damiani et al. 1997), specially tuned for XMM-Newton data. It can combine data from the three EPIC detectors and from different observations, even taken with different pointings, provided that the pointing boresights are close enough that a single model for the off-axis angle dependence of the PSF can be used (in practice, this amounts to a few arcmins). We used this feature to perform the detection on all obsids and cameras. We chose a significance threshold for source detection at the 4σ level, corresponding 4 to a probability of for a random fluctuation to be detected as a source ( false-positive ). The first stage source lists include 411 and 196 sources for the 2-10 and 5-10 kev bands, respectively. The source identification numbers (ID210 for 2 10 kev and ID510 for 5 10 kev) were assigned at this stage. For the second stage we used EMLDetect, a standard tool from the XMM-Newton SAS software. Originally developed for ROSAT (Cruddace et al. 1988; Hasinger et al. 1993), the current 3 The XMM-Newton Users HandBook. external/ xmm user support/ documentation/uhb/xmm UHB.html 4 The correspondence between probability and number of sigmas only applies for Gaussian probability distributions. Our use should just be regarded as a handy mnemonic. version of EMLDetect 5 includes many improvements in terms of PSF models, ability to simultaneously fit data from different cameras and pointings, deblend sources, and fit extended sources 6. EMLDetect gives more accurate estimates of net source counts, with lower systematic and random uncertainties (Puccetti et al. 2009). Since EMLDetect was not designed to run on a large number of input files, we grouped the observations in four sets according to the pointing direction (see Table 1), in order to have homogeneous PSFs across a single set. We summed together the images from the MOS1, MOS2 and PN cameras, obtaining four images which were used as the input to EMLDetect. The background maps for EMLDetect were calculated with the method of Cappelluti et al. (2007). We ran EMLDetect using the PWXDetect coordinates as input and without re-fitting the positions; thus the EMLDetect source list is a subset of the PWXDetect one. EMLDetect uses a maximum-likelihood estimator to assign a significance value to a detection. The EMLDetect source list was cut at a likelihood value of L = 4.6. This likelihood obeys the law L = ln(p), where p is the probability of a false-positive detection. The threshold L = 4.6 corresponds to a probability of The number of sources detected at the second stage is 337 and 135 for the 2-10 and 5-10 kev bands, respectively. After visual inspection, we identified two cases of source blending, which correspond to ID210s 228 and 276. These blends were detected in the 2 10 kev band at 29.1σ and 22.3σ by PWXDetect, and with likelihoods L = and by EMLDetect, respectively. In both cases, two sources whose cores can be visually separated were identified by PWXDetect as a single one. The separation between the two components is 11.5 and 18.1 for ID210s 228 and 276, respectively (see also Sect. 7). Both blends are detected also in the 5 10 kev band, as ID and 1134, respectively. In the catalogue, we do not list the blends; instead we provide counts, rates and fluxes estimated with aperture photometry for the four individual sources, which in the 2 10 kev catalogue are numbered 501, 502 (components of 228) and 503, 504 (components of 276). These sources have been de-blended also in the 5 10 kev band, and their components are numbered with ID510s The main catalogues are defined as the sources detected at the second stage, minus the two blends, plus the four blend components, and thus contain 339 and 137 sources in the 2 10 and 5 10 kev bands, respectively. A comparison of the source counts derived by PWXDetect and EMLDetect showed a 1-to-1 correlation, as expected, but with a few outliers. Three of these sources (ID210: 4, 105; ID510: 1001) lie at the south-west rim of the field and are probably just fluctuations in an area with a strong exposure gradient. A few others (ID210: 154, 184, 280, 290, 328, 406; ID510: 1066, 1089, 1100, 1124, 1146) lie in a crowded area, or very close to brighter sources, and they were also flagged as extended by EMLDetect. Their EMLDetect-derived counts are about one order of magnitude larger than the PWXDetect estimate, probably because EMLDetect fits them as tails of the PSF of a larger and brighter source. Aperture photometry showed agreement with the counts derived by PWXDetect. Therefore, in the catalogue these 6 sources are listed with the PWXDetect counts; count rates and fluxes were calculated accordingly. 5 The XMM SAS reference manual for EMLDetect; 6 While the CDFS field containes some extended sources, none of them was present in the PWXDetect output. 5
 procedure.")
6 Fig. 4. Colour image of the XMM-CDFS. Red: kev; green: 1 2 kev; blue: 2 8 kev. The colour scaling is non-linear, and is done first by using a quadratic polynomial to suppress the background, and then by following the Lupton et al. (2004) procedure. The flux to count rate conversion factors have been calculated for a power-law spectrum with slope Γ = 1.7 (Mainieri et al. 2007); their values are and counts cm 2 erg 1 for the 2 10 and 5 10 kev bands, respectively. Had we used a different slope (for example, 1.4 or 2.0), the conversion factors would differ by 8 9%. The Galactic column density in the CDFS direction is cm 2, so that the bands 2 10 and 5 10 kev are not significantly affected and no correction for Galactic absorption is needed. A histogram of the fluxes of the XMM-CDFS 2-10 kev catalogue is shown in Fig. 5. The number of detected sources drops at fluxes erg s 1 cm 2, with the faintest source at erg s 1 cm 2 giving the survey flux limit. For comparison, we also plot the flux distribution from X11 and Brunner et al. (2008). While the Chandra 4 Ms survey is deeper as expected, the XMM-CDFS contains a considerable larger number of sources at medium-faint fluxes ( erg s 1 cm 2 ), most of which are anyway detected in the ECDFS. The Lockman hole survey has a distribution similar to the XMM-CDFS, though a larger number of sources (mainly at faint fluxes) is detected in the latter than in the former Catalogue significance It is not easy to compute analytically the joint probability of a false-positive detection in the two stages, though some hints can be obtained using conditioned probability: P(detection) = P(P) P(E P) (1) where P(P) is the probability of a PWXDetect false-positive detection ( ), and P(E P) is the probability of an EMLDetect false-positive after the PWXDetect selection. The value of P(detection) can be bounded considering the two extreme cases of P(E P) = 1 (i.e., accepting all PWXDetect Fig kev fluxes of the sources detected in the XMM- CDFS, compared with other surveys. Solid black histogram: main XMM-CDFS catalogue; dashed red histogram: Chandra catalogue (X11); dotted blue histogram: Lockman hole (Brunner et al. 2008). sources) and P(E P) = P(P) P(E) (i.e., considering the two detection stages as independent experiments; P(E) = ): P(P) P(E) < P(detection) < P(P) (2) 6
7 which, in terms of σ, give a threshold significance for the catalogues in the interval 4σ 5σ. The number of spurious detections can be used to obtain an approximation for P(E P). This number will be first estimated in Sect. 6 using simulations, and then refined in Sect. 8.3 by comparing with the Chandra catalogues and by inspecting the signal/noise ratios of the sources. Therefore, considering 12 (4) spurious sources in the 2 10 (5 10) kev band: P(detection; 2 10) / (3) P(detection; 5 10) / (4) which may be quoted as the approximate significance threshold for the catalogues presented here, and roughly correspond to 4.77σ and 4.84σ for the 2 10 and 5 10 kev bands, respectively Main catalogues The XMM-CDFS 2-10 kev and 5-10 kev catalogues include 339 and 137 sources, respectively, detected in both stages. The catalogues are available in electronic form from the Centre de Donneés Astronomiques de Strasbourg (CDS), and from the XMM-CDFS website 7, where we will publish updates to the redshifts whenever they become available. The column description is for both as follows: 1. IAU IDENTIFIER source identifier following International Astronomical Union conventions; 2. ID210 (2 10 kev catalogue) or ID510 (5 10 kev catalogue) PWXDetect source number; 3. RA right ascension (degrees); 4. DEC declination (degrees); 5. RADEC ERR error on position (arcsec; 1σ) 6. COUNTS EMLDetect sum of the net source counts from MOS1, MOS2 and PN; 7. COUNTS ERR error on the COUNTS (1σ); 8. BKG (EMLDetect) background counts/arcsec 2 ; 9. EXPOSURE exposure time, averaged over the three cameras; 10. RATE (EMLDetect) net count rate, summed on the three cameras; 11. RATE ERR error on the RATE (1σ); 12. FLUX (EMLDetect) flux (erg s 1 cm 2 ); 13. FLUX ERR error on the FLUX (1σ); 14. SIGNIFICANCE (PWXDetect) detection significance (no. of sigma); 15. DET ML (EMLDetect) detection likelihood; 16. DET SCALE (PWXDetect) wavelet detection scale; 17. CID Chandra source number (see Sect. 8). If the letter E appended to the number, then the ID is from Lehmer et al. (2005); otherwise, it is from X11; 18. REDSHIFT; 19. REDSHIFT REF reference for choice of redshift; 20. ID510 (5 10 kev catalogue) or ID210 (2 10 kev catalogue) source number in the other band; 21. NOTES mainly about source blends and counterparts Supplementary catalogues The catalogues of the kev, and kev sources detected only in the first stage are also available in electronic form. These supplementary sources are on average detected at 7 low significance; many of them are on the borders of the field of view; and a few are in crowded fields where EMLDetect has trouble separating the different PSF components. Nonetheless, 4 of these sources are bright enough that a spectrum could be extracted (Comastri et al., in prep.). The columns whose values in the main catalogue were derived with EMLDetect have been replaced, where possible, with analogous quantities derived with PWXDetect. The main differences between the output columns of PWXDetect and EMLDetect are i) that PWXDetect rescales the MOS counts to the PN response before summing them, while EMLDetect does not, and ii) that PWXDetect sums the exposure times while EMLDetect averages them. For consistency, we renormalized the source counts and exposure times to the same scale of EMLDetect. The column description is as follows: 1. IAU IDENTIFIER source identifier following International Astronomical Union conventions; 2. ID210 (2 10 kev catalogue) or ID510 (5 10 kev catalogue) PWXDetect source number; 3. RA right ascension (degrees); 4. DEC declination (degrees); 5. RADEC ERR error on position (arcsec; 1σ); 6. COUNTS net source counts from MOS1, MOS2 and PN; 7. COUNTS ERR error on the COUNTS (1σ); 8. BKG background counts/arcsec 2 ; 9. SUMMED EXPOSURE exposure time, summed on the three cameras; 10. RATE net count rate; 11. RATE ERR error on the RATE (1σ); 12. FLUX flux (erg s 1 cm 2 ); 13. FLUX ERR error on the FLUX (1σ); 14. SIGNIFICANCE detection significance (no. of sigma); 15. DET SCALE wavelet detection scale; 16. CID Chandra source number (see Sect. 8). If the letter E appended to the number, then the ID is from Lehmer et al. (2005); otherwise, it is from X11; 17. REDSHIFT; 18. REDSHIFT REF reference for choice of redshift; 19. ID510 (5 10 kev catalogue) or ID210 (2 10 kev catalogue) source number in the other band; 20. NOTES mainly about source blends and counterparts. 4. Coverage and number counts The survey coverage has been estimated with extensive simulations, which are described in Sect. 5. In Fig. 6 we show the coverage in deg 2, defined as the average fraction of sources per simulation with a successful match between the output and input catalogues, times the surveyed area, as function of the flux. The confidence intervals for the coverage, estimated according to the Fieller (1954) formula for the ratio of two average quantities, are of the order of the line width and thus they are not plotted. The coverage is normalized to deg 2, i.e. the area with exposure min(t), where T is the exposure column in the 2 10 kev catalogue. In Fig. 6 we also show, for comparison, the coverage for the Chandra 4 Ms survey in the 2 10 kev band (X11) and that for the XMM-Newton Lockman Hole 1 Ms survey for the 5 10 kev band (Brunner et al. 2008). The number counts can be derived from the 2 10 and 5 10 kev catalogues and the coverage curves derive above. The 7
8 Fig. 6. Coverage of the XMM-CDFS survey (solid black lines) in the 2 10 kev (left panel) and 5 10 kev band (right panel), defined as the fraction of simulated sources which were successfully detected as a function of their output flux, and normalized to the area probed by the catalogues. The dotted red lines show, for comparison, the same quantity for Chandra (left panel: 4 Ms survey, X11; right panel: 1 Ms survey, Rosati et al. 2002). The dashed blue line in the right panel shows the coverage for the XMM-Newton Lockman Hole (Brunner et al. 2008). We have not shown in the right panel the CDFS 4 Ms (Lehmer et al. 2012) since formally it is in a softer band (4 8 kev). cumulative number counts are the sum of the inverse areas in which the sources could be detected: 1 N(> S ) = (5) A i S i >S where S i and A i are the flux and area for a given source i. With this definition, cumulative counts are not binned. For the differential counts, we bin the sources according to their fluxes, and define n(s ) = 1 S 1 A i (6) where the sum is performed on all sources with flux S i [S S/2, S + S/2]. The Poissonian error on the counts in any bin can be computed with the Gehrels (1986) approximation. The number counts are shown in Fig. 7 (upper panels: cumulative number counts; lower panels: differential). The cumulative and differential number counts observed by Chandra (Lehmer et al. 2012) and the cumulative model for AGN (Gilli et al. 2007) are also shown. The Chandra number counts have been converted from the 2 8 and 4 8 kev bands to the 2 10 and 5 10 kev bands, respectively, assuming the same spectrum used for the XMM-CDFS catalogue. In both bands there is, as expected, a near-perfect agreement between the Chandra and XMM-Newton estimates. Some lowsignificance deviations at fluxes around (2 10 kev) and erg s 1 cm 2 (5 10 kev) might be due to the larger field of view of the XMM-CDFS with respect to Chandra. A cross-correlation analysis between the Chandra ACIS-S3 detector chip and the three XMM-Newton cameras in the 2 8 kev band (Tsujimoto et al. 2011) showed that Chandra finds fluxes which are larger than the XMM-Newton ones by 10 20%. The 4 Ms survey however was performed with the ACIS-I detector, which was not analyzed by Tsujimoto et al. (2011). If the ACIS-S3 results also hold for the ACIS-I detector, than the larger fluxes found by Chandra would be consistent with the minor deviations found in the Log N Log S. As to the 5 10 kev band, Fig. 7 (upper right panel) would suggest that any deviation would go in the opposite direction (Chandra fluxes being lower than the XMM-Newton ones); however the very hard band was not considered by Tsujimoto et al. (2011). In both bands the number counts are also in agreement with the model. The Lockman Hole was also observed with XMM-Newton; Brunner et al. (2008) presented a 5 10 kev Log N Log S which is in agreement, within poissonian errors, with the XMM- CDFS. At brighter fluxes, we compare with the counts from the Hellas2XMM (Baldi et al. 2002) and 2XMM (Mateos et al. 2008) surveys; all of them are in agreement, within errors, with the XMM-CDFS. Poissonian errors are plotted only for the CDFS and Hellas2XMM, to avoid cluttering the figure. One interesting thing to note is that in the interval , the CDFS and the XMM-CDFS 5 10 kev number counts stay below all other determinations. This may be a low-significance feature of the CDFS field (though formally all number counts are consistent with each other within Poissonian errors). Finally, we show the differential number counts derived by Georgakakis et al. (2008) from a combination of deep (CDFS and Chandra Deep Field North) and shallow surveys. 8
9 Georgakakis et al. (2008) report as their best-fit model a broken power-law of the form: { dn S ds Γ 1, S S break S Γ 2 (7), S S break with slopes Γ 1 = 1.56 ± 0.04 and Γ 2 = , and with a break flux Log(S/erg s 1 cm 2 ) = for the 2 10 kev band ( , , respectively for the 5 10 kev band). The XMM-CDFS data points are consistent within 1 or 2σ with the broken power-law model. A binned χ 2 fit yields for the XMM-CDFS (quoted errors are 1σ): Γ 1 = 0.85 ± 1.2, Γ 2 = 2.29 ± 0.36 and break flux Log(S/erg s 1 cm 2 ) = ± 0.30 for the 2 10 kev band, and 0.77 ± 2.6, 2.49 ± 0.48 and ± 0.41 for the 5 10 kev band. The best-fit parameter are in agreement, within errors, with the Georgakakis et al. (2008) ones, with the possible exception for the 2 10 kev break flux which differs by 2σ. This may be the result of the smaller number of data points at fluxes fainter than the break in the XMM-CDFS than in Georgakakis et al. (2008), and of the larger error on the faintest data point. 5. Simulations We have performed extensive simulations to address the XMM- CDFS properties in terms of survey coverage and source confusion. For each simulation we built a mock survey, and ran the two-stage detection process. We have used a simulator developed with the aim to reproduce the background and the PSFs of any given observation as closely as possible. Though currently tuned for XMM-Newton, the simulator can be adapted to other missions. While more details are given in the Appendix, the main features are: the simulator attempts to reproduce the source and background distribution for each of the 99 exposures (33 obsids times 3 cameras) of the XMM-CDFS independently; the background level is decomposed into its constituents (cosmic, particle and residual soft protons), whose spatial distributions are reproduced separately; the cosmic X-ray background is modeled after Gilli et al. (2007); the particle and proton backgrounds are resampled from maps distributed as part of the XMM-Newton calibration; the distribution of the XMM-CDFS background counts is reproduced by the simulator with an error of 10%; the two-stage source detection is run on each simulation; a sizable number of simulations is run so that average quantities (number of sources, coverage, number of confused sources) can be derived. Given the long exposure time ( 3 Ms) of the XMM-CDFS survey, the average number of counts per pixel is much larger than that for other XMM-Newton survey projects. Because of the difference in the pointing positions among the 33 obsids, the background counts have a complex spatial pattern, mainly given by the chip gaps and borders occurring in slightly shifted positions. In any XMM-Newton observation, the following background components are present in addition to the detectable sources: cosmic X-ray background (CXB), produced by the many sources which are below the survey flux limit; particle background (PB; sometimes also called non X-ray background ), which basically includes the electronic noise and a few fluorescent lines produced by the telescope assembly; residual soft protons (SP): a quiescent background due to soft proton clouds; solar wind charge-exchange, negligible at energies 2 kev and therefore not considered here. The modelling of each simulated component will be discussed in detail in the next Sections. Our treatment of the different background components builds directly on the work by De Luca & Molendi (2004), Snowden et al. (2004) and Snowden et al. (2008); see also Snowden & Kuntz (2012) X-ray sources and cosmic background For each simulation, an input catalogue of cosmic sources is generated from a Log N Log S obtained as the sum of: i) the 2-10 kev Log N Log S of AGN, calculated with the Gilli et al. (2007) model over its full range of parameters, and ii) the 2-10 kev galaxies number counts computed from the Ranalli et al. (2005) model. This Log N Log S extends from to erg s 1 cm 2, thus allowing simulation of both the detectable sources, and the cosmic X-ray background. It is sampled on a square area slightly larger than the CDFS, assuming uniform distributions in RA and DEC, thus giving a number of sources per simulation. Most of these sources are too faint to contribute, on average, even a single photon to an observation; however when they are taken together, the sources below the survey flux contribute to the total (cosmic+particle+proton) observed background. The flux to count rate conversion factors have been calculated for a power-law spectrum with slope Γ = 1.7, as done for the real catalogue (considering Γ = 1.4 or 2.0 would change the fluxes by 8%); in doing this, we have assumed a single average spectral slope for all sources, which is acceptable since we are interested only in broad-band detections Particle background The PB is mainly due to the instrument electronics and to reflection lines from the telescope and its mounting. The spatial distribution of the PB has been taken from the Filter Wheel Closed (FWC) observations provided by the ESAS CALDB 8. The FWC were made with the filter wheel in the closed position, and without the calibration source on 9. The actual PB level in any observation may be determined by considering the corner areas, i.e., the parts of the MOS and PN detectors which lie outside of the FOV and are neither exposed to the CXB nor to the protons. The data for the corner areas are normally filtered out by the XMM-Newton pipeline, but can be obtained by reprocessing the raw data (i.e., the Observation Data Files, ODF). The surface brightness of the corner areas needs to be appropriately rescaled to obtain the PB brightness inside of the FOV. Let us define the total average surface brightnesses which are observed inside and outside of the FOV as Σ in and Σ out, respectively. The value of both Σs is different for any obsid and 8 The Extended Source Analysis Software (ESAS), developed by S. Snowden and K. Kuntz, is a part of the standard XMM-Newton SAS software and includes several calibration files. 9 Conversely, the more common CALCLOSED observations do have the calibration source visible, in addition to the PB. 9
10 n n Fig. 7. Upper panels: cumulative number counts in the 2 10 kev (left) and 5 10 kev (right) bands. Lower panels: differential number counts (left: 2 10; right: 5 10 kev band) in Euclidean scale (i.e., S 2.5 dn/ds ). For comparison, in all panels we plot the Chandra number counts (Lehmer et al. 2012, red circles). In the upper panels, we also show the cumulative number counts from the XMM-Newton survey in the Lockman Hole (Brunner et al. 2008, blue stars), and the model cumulative counts for AGN (Gilli et al. 2007, black dotted line). In the upper right panel, we also plot the number counts from the Hellas2XMM (Baldi et al. 2002) and 2XMM (Mateos et al. 2008). In the lower panels, we also show the differential number counts from Georgakakis et al. (2008). camera, and can also be measured for the FWC. To minimize uncertainties due to small number statistics for bright sources, the positions corresponding to the 30 brightest sources have been masked out during the determination of the above surface brightnesses. This corresponds to removing sources brighter than the erg s 1 cm 2 threshold; at this flux level, 43% of the background is resolved (using the HEAO-1 value, Gruber et al. 1999). On the one hand, the FWC only contain PB, therefore: { Σin,FWC = Σ PB,FWC Σ out,fwc = k Σ in,fwc = k Σ PB,FWC (8) where k accounts for spatial variations of the PB surface brightness. On the other hand, for a generic observation, the FOV will contain PB, proton and cosmic background components, while 10
 where Σ PB, Σ SP, and Σ CXB are surface brightnesses.")
11 Fig. 8. Comparison of the real XMM-CDFS (A) with one simulation (B). The colour scale is the same for both panels and maps the 2 10 kev intensity. the corners will only have PB: { Σin = Σ PB + Σ SP + Σ CXB Σ out = k Σ PB (9) where Σ PB, Σ SP, and Σ CXB are surface brightnesses. The important assumption here is that the k is the same for the FWC and for all the observations, which is equivalent to assuming that the spatial distribution of the PB is the same in all observations. Taking k from Eq. (8), from Eq. (9) we get Σ PB = Σ out Σ in,fwc Σ out,fwc. (10) The average fractions of PB with respect to the total of CXB+PB+protons are reported in Table 2. The number of PB photons to be simulated is Σ PB A E where A is the FOV area and E the exposure time Soft protons Clouds of soft protons are often encountered by XMM-Newton, especially when the satellite is close to perigee, and cause strong background flares. When such a flare is detected, the time intervals in which it occurs are usually excluded from further analysis. However, there is also a quiescent component of soft proton background, with much smaller brightness, that may occur for the entire length of an observation, and for which the standard recipe of identifying and excluding high-background periods is not applicable or which may remain even after the flares are excluded. The quiescent soft protons are subject to the telescope vignetting, though to a lesser extent than X-ray photons (see Fig. 17 in Kuntz & Snowden 2008). Both De Luca & Molendi (2004) and Snowden et al. (2004) have considered this problem and we refer to these papers for further details. Here we estimate the residual soft proton level from Eq. (9): Σ SP = Σ in Σ out k Σ CXB (11) which is also shown in Fig. A.1 and Table 2. We assume the value Σ CXB = erg s 1 cm 2 deg 2 for the CXB brightness, which results from integrating the AGN and galaxy number counts from zero to the erg s 1 cm 2 threshold (Sect. 5.2). The number counts are normalized to the HEAO-1 value for the X-ray background (Gruber et al. 1999); had we normalized to any of the higher values derived from XMM-Newton data (e.g., Lumb et al or De Luca & Molendi 2004), this number would have been proportionally larger. However, the increase would have been compensated by a decrease in the soft proton component, with the net effect of a slight change in the amount of background vignetting. This effect is probably within the uncertainties with which the background brightness is measured. We now can determine the number of photons contributed by the soft protons as Σ SP A E, where A and E are again the FOV area and the exposure time. A simulation produced with this recipe is shown in Fig. 8, where an image of the real XMM-CDFS is shown with the same colour scale for comparison. Table 2. Average percentage contribution of the different background components to the overall level. Camera Band (kev) CXB Particle Proton MOS ± ± ± 10 MOS ± ± 9 18 ± 9 PN ± ± ± 6.0 MOS ± ± 8 12 ± 8 MOS ± ± 8 12 ± 8 PN ± ± Notes. All values are per cent. When calculating the brightness levels, the areas around the 30 brightest sources have been excluded. Thus, the cosmic background refers to sources with fluxes erg s 1 cm 2. 11
12 Fig. 9. Distribution of the counts per arcsec 2 in the simulations (average over 5 simulations), compared with the XMM-CDFS, for the 2 10 and 5 10 kev bands. The vertical axis shows the area covered by each bin Simulated fields and catalogues A comparison between the distribution of counts reproduced by the simulator and that of the XMM-CDFS is shown in Fig. 9, where the histograms of the counts per arcsec 2 are plotted in the 2 10 and 5 10 kev bands. The counts include both the background (mainly the peak of the distribution) and the sources (the right tail). In both bands, the agreement seems good, with a horizontal shift between simulations and the XMM-CDFS of 10% around the peaks. We ran about 150 simulations in the 2 10 and 5 10 kev bands, respectively, to assess the survey properties. For each simulation, the two-stage detection process was performed in the same way as for the (real) XMM-CDFS main catalogue. The output catalogues were cross-correlated with the (input) list of simulated sources. For each detected source, its input counterpart is defined as the one which minimizes the score S (Cappelluti et al. 2009): ( ) 2 ( ) 2 ( ) 2 RA DEC RATE S = + + (12) σ RA σ DEC σ RATE where (RA, DEC, RATE) are the differences between the output and input right ascension, declination, and count rate, respectively, and the σ are the corresponding errors. We show in Fig. 10 the histogram of the spatial separation between the output and input positions. Most sources show a displacement of 1.25, which was already highlighted by Cappelluti et al. (2009) and Pineau et al. (2011), and therefore it seems to be a characteristic of XMM-Newton. The displacement does not occur in any particular direction and occurs even if the source detection is run on just one single camera, or on just one obsid. The number of matches drops sharply for displacements 2. The input and output fluxes of the simulated sources are shown in Fig. 11; only sources with displacements 6 are con- Fig. 10. Spatial separation between the input and output positions of simulated sources. Table 3. Number of spurious sources in the 2 10 kev band simulations. Exp. CDFS Total sim. W.count. Spurious Fract. any ± ± ± 5 8.4% ± ± ± 3 3.3% Notes. The column CDFS gives the number of sources found in the XMM-CDFS which respect the same selection of the simulations (i.e. extent< 0.5 and no de-blending; see text). The columns Total sim., W.count., Spurious give the average and standard deviation of the number of sources per simulation, the number of sources with a counterpart in the input catalogues, and the number of spurious, respectively. The column Fract. gives the fraction of spurious sources over the total number. Exposure thresholds are expressed in ks. sidered here. A few outlier per simulations are present, which is compatible with the amount found in the XMM-CDFS (Sect. 3). These outliers are mainly due to EMLDetect identifying some sources, especially in crowded areas, as extended sources. In the compute of the coverage, we identify the outliers has having an EMLDetect flux larger than 3 times the PWXDetect flux; the latter is then used for the calculation. At bright fluxes ( erg s 1 cm 2 ), the output values are systematically larger by about 20% than the input ones. This uncertainty does not affect the flux range where most of the sources (82%) are detected. 6. Number of spurious sources We estimate the number of spurious sources in the 2 10 kev band by running the detection process on the simulated observations. The total number of sources detected in the simulations is reported in Table 3. In the 2 10 kev band, the simulations produce catalogues which contain on average 358 ± 16 src sim 1, i.e. a larger number of sources than the XMM-CDFS, though the difference is less than twice the simulations standard deviation; in around 10% of the simulations a number of sources 12
13 Fig. 11. Input vs. output fluxes of the simulated sources, from kev simulations. Only sources with a match within 6 are considered. Some outliers are present, due to EMLDetect uncorrectly associating the source with extended emission especially in crowded regions, and for which we rather use the PWXDetect fluxes; the number of outliers is a few per simulation. The red line shows the identity relation. At bright fluxes ( erg s 1 cm 2 ), the output values are about 20% larger than the input ones. lower than or equal to the XMM-CDFS is detected. The number of detected sources is in general dependent on the background level; residual variations between the simulations and XMM- CDFS background (see Sect. 5.4) may help to explain the difference observed in the 2 10 kev band. In the Chandra-COSMOS survey, which used the same detection software as this paper, Puccetti et al. (2009) found that a large number of spurious sources, only present in simulations, were characterized by source sizes smaller than the PSF sizes a clear indication of fluctuations detected as sources and removed them. PWXDetect uses the extent column to express the source size in PSF units (i.e., adimensional); in particular, all sources with extent< 0.5 are likely to be spurious. Thus, in all simulations we filtered the catalogue to remove source candidates satisfying this criterion. Spurious sources may arise mainly from background fluctuations, or from an incorrect reproduction of the spatiallydependent background level. For instance, the simulations made use of spatial maps of the soft proton background, which were derived by time filtering of highly flared observations, and may still contain small local enhancements originally due to astronomical sources. Local enhancements are also present in the particle background maps, and further investigation would be needed to determine wether these are representative of any given observation. In general, any background enhancement in the proton and particle maps is likely to appear in many simulations, since these maps were used as probability distributions without smoothing on significantly large scales (e.g., larger than a few PSF cores). The number of this kind of spurious sources is non-trivial to estimate; for this reason, the numbers of spurious sources quoted in Table 3 should be regarded as upper limits if applied to the XMM-CDFS; and in Sect. 9 the comparison of the Chandra and XMM-Newton catalogues will be used to further refine the estimate of the spurious fraction. A check on the position of the candidate spurious sources shows that about half of them (i.e. 20 ± 4 in the 2 10 kev band) lie in the outer parts of the field, where the exposure is 300 ks. Under the latter threshold, the number of sources detected in the simulations with a counterpart in the input catalogues, and the number of sources in the XMM-CDFS, match more closely. The main reason for the larger fraction of spurious sources at low exposure ( 300 ks) is that fluctuations are more important at the borders of the FOV than in the inner area or, in other words, that fluctuations are averaged out when the exposure is large. The spatial distribution of spurious sources has welldefined peaks, falling in the low-exposure areas, which can be traced back to localized high background features. For the rest of this Sect., we define spurious sources as those detected in the simulations, but without any counterpart in the input catalogues within 6 from their position; the numbers are reported in Table 3. The threshold of 6 was chosen after the check for Chandra counterparts (Sect. 8.2), in which a tail of reliable associations is present up to 6 especially for sources at large off-axis angles. For the 2 10 kev, the average number of spurious sources is 30±5 src sim 1. The number of XMM-CDFS sources to which the comparison can be done is 335 (337 sources detected at the second stage, without de-blending sources no , and with 2 sources not considered because they have extent< 0.5). Confused sources may also give rise to spurious sources, in the case that a pair of input sources is detected as a single one, and that the detected position is distant more than 6 from both the components of the input pair (see Sect. 7, double-detection pairs ). The number of this kind of spurious sources is 3 per simulation, and does not depend on the position in the field. A check on the number of spurious sources, based on the probability of association with Chandra counterparts and on the signal/noise ratio in the XMM-Newton images, is discussed in Sect The fraction of spurious sources is higher in the 5 10 kev band than in the 2 10 kev, probably because localized background features contribute with a larger proportion to the total counts. Improving this would require a deeper study of the XMM-Newton background and an update of the simulator, which we defer to a future paper. 7. Source confusion Because of the size of the XMM-CDFS average angular resolution (8.5 FWHM, which is the median across the FOV; see Sect. 2.3) and the faint flux limit of the XMM-CDFS, it is important to understand how the detection process treats close sources. Depending on the distance of its components, a pair of sources may be mistakenly detected as a single source ( source confusion ); the off-axis angle dependence of the PSF and local smallscale variations of the background also play a role. This may also impact the estimated number of spurious sources, if the detected position is distant enough from that of the pair components. Here, we use the simulations to estimate the amount of source confusion in the XMM-CDFS survey, and compare at end with Chandra data. In this Section, we only consider the 2 10 kev band; the 5 10 kev range is expected to be less affected by source confusion. 13
14 Fig. 12. Left panel: Number of pairs of sources, as function of the flux ratio between pairs of sources. Sources with fluxes 10 times fainter than the local (i.e. position-dependent) flux limits are included. Solid histogram: pairs of input sources. Dotted histogram: pairs detected as a single output source. Dashed histogram: pairs where both components have a detection. Right panel: Number of pairs of sources, as function of the spatial separation between the two pair components. Line styles as in the left panel. Only pairs with flux ratios lower than 3, and whose components are brighter than erg s 1 cm 2 are considered. The larger number of input pairs with respect to output ones in the 3 10 range is due to pairs where the distance between the centroid and the position of the detection is larger than 6 ; this happens for 3 sources per simulations. We start our analysis by considering input sources with fluxes greater than 10% that of the faintest source detected in the real XMM-CDFS, and scaled for lower sensitivity areas through an exposure map (i.e., /Exp(RA, DEC) erg s 1 cm 2, where Exp(RA, DEC) is normalized so that max(exp(ra, DEC)) = 1). This avoids cluttering the results with sources too faint to have a significant impact on the detection process. For simplicity, we also do not consider triplets of sources, nor groups with a larger number of members. With these constraints, we identify an average of 61 (108) pairs per simulation with separation 10 ( 15 ) in the input catalogues. The number of pairs per simulation, as function of the flux ratio between the two components of the pair, is shown in Fig. 12 (left panel) as the solid histogram ( input pairs ). Most pairs have a flux ratio 10 between the two components. Pairs with a larger difference between the fluxes of the components are considerably more rare. The right panel of Fig. 12 shows the number of pairs as function of the separation between the pair components. To be more representative of what is observable in practice in the XMM- CDFS, we restrict this panel to pairs with a flux ratio < 3, and we also drop any pair with a component fainter than the XMM- CDFS flux limit ( erg s 1 cm 2 ). In the following we will refer to this sub-selection as the detectable pairs. The number of pairs with very small separation ( 2 ) is quite small ( 0.4 pairs/sim). It grows rapidly at larger separations, stabilizing at 8 with a value of 1.7 pairs/sim/arcsec (i.e., every arcsec of separation adds 1.7 pairs). We consider the following possibilities for the detection of a pair of input sources: 1. detected as two distinct sources; 2. detected as one single source Pairs detected as two distinct sources We have searched for source pairs where both components are individually detected in the output catalogues of simulated sources ( double-detections ). The number of double-detection pairs, when seen as a function of the pair flux ratio (Fig. 12, left panel, dashed histogram), roughly follows the number of input pairs, though it stays lower by 1.5 orders of magnitude and has a sharper drop (a factor 10 vs. a factor 2 for the double-detections and input pairs, respectively, at flux ratios < 10). Thus, double detections are more probable when the flux ratio is small. While the number of detectable input pairs rises with the separation from 0 to 8 and remains constant afterwards, the number of double-detections is consistent with 0 up to 11 and only starts to rise afterwards (Fig. 12, right panel). This means that input pairs are not recognised as such by the detection process if the separation is Pairs detected as a single source Input pairs detected as a single output source are what is usually referred to as confused sources. We have searched for them by requiring: i) one output source within 6 from the pair centroid; ii) no other output sources within 6 from the positions of the two input sources. The pair centroid is defined as the weighted mean of the pair coordinates, using the count rates as the weights. The number of single-detection pairs is also shown in Fig. 12 (both panels, dotted histograms). By considering only pairs with separation 15 arcsec, their average number is 13 pairs/simulation. When comparing with the XMM-CDFS (see Sect. 8.2), this number should be taken as a lower limit, since the 14
15 simulations do not include clustering; in Sect. 8.2, the number of XMM-Newton sources with two or more Chandra counterparts is estimated to be 21. Almost all pairs with a large flux ratio ( 10) are detected as a single source (Fig. 12, left panel), probably because the fainter source cannot be distinguished from a fluctuation in the wings of the PSF of the brighter source. Conversely, at small flux ratios the fraction of single-detections drops, and 1/4 of the input pairs with flux ratio 2.5 are single-detected. The reason is probably that it is easier to have a double-detection at small flux ratios, where the cores of the two PSFs can be better recognised. Also, part of the explanation might involve the inclusion of very faint sources in the input list. Considering the detectable pairs, the number of singledetections as function of the pair separation (Fig. 12, right panel) peaks at 9 arcsec, and it always stays lower than the number of input pairs, probably because our selection of detectable pairs is conservative and allows for pairs where one of the components is just below the local flux limit. At separations 9 the number of single-detections starts to decline, and matches the number of double-detections at 14. The total number of single-detections with separation 20 is 14, which may taken as an estimate of the expected number of confused sources in the XMM-CDFS. Summarizing, sources closer than 11 cannot be individually detected. Sources separated by larger angles may be individually detected, the odds for it increasing with the separation, though the PSFs may still be blended. Confusion is no longer an issue at angles larger than Chandra and optical identification and redshifts In the catalogue tables we include the most probable association between our catalogue and the Chandra 4 Ms and ECDFS ones, determined with the procedure explained in Sect. 8.1 (blends and other possible associations are reported in the NOTES column). For the optical identification and for the redshift determination, we rely mainly on the work done by X11, and report the redshift of the optical counterparts from this catalogue. To search for more redshifts and for updates, we checked spectroscopic redshifts in Treister et al. (2009b), Silverman et al. (2010), Cooper et al. (2011), and Kurk et al. (2012); and photometric redshifts in Cardamone et al. (2010) and Rafferty et al. (2011) Theory We have cross-correlated the XMM-CDFS 2 10 kev catalogue with the Chandra 4 Ms (X11) and ECDFS (Lehmer et al. 2005) catalogues. We have used the likelihood-ratio estimator with a simple prior as described in Pineau et al. (2011) 10. Briefly, this method works in two steps. First, for each XMM-Chandra source association we define the likelihood-ratio between the probability of the association being real vs. it happening by chance: LR(r) = e r2 /2 2λ (13) (Eq. 9 in Pineau et al. 2011) where both r and λ are adimensional. r is the angular distance between both sources divided by the combined (in quadrature) positional error (i.e. r = d/ σ 2 X + σ2 C where d is the angular distance and the σ are 10 This method has been implemented in a plugin to Aladin, and is available from the positional errors), and λ is the angular density of Chandra sources with flux higher or equal to that of the Chandra member of the association (using the number counts in Luo et al ) multiplied by the combined square positional error (i.e., λ = (σ 2 X + σ2 C ) N(> S )). Second, to obtain the probability of real association we use Eq. 11 in Pineau et al. (2011). ( ) P(H cp r) = 1 + P(H cp ) P(H cp ) LR(r) (14) where P(H cp ) is the (unknown) prior probability of a Chandra source to be the counterpart of an XMM-Newton source. Given the different characteristics and depths of the X11 and ECDFS catalogues, we assume P(H cp ) with two constant values: one if the source comes from X11, another if it comes from the ECDFS. The (unknown) number of real Chandra counterparts is the sum of the probabilities of association, over all associations: N real = P(H cp r) (15) which can be approximated by using the total number of candidate Chandra counterparts N: P(H cp ) N real N We finally arrive at ( ) 1 1 N real = 1 + N real LR(r) N N real (16) (17) combining Eqs. 14, 16 and 15 above. This equation can be resolved iteratively for N real (starting with N real = N/2 for instance) to get P(H cp ) and hence P(H cp r) for each association Cross-correlation of XMM-Newton and Chandra sources We have used the method outlined above to cross-correlate independently our XMM-Newton 2 10 kev and 5 10 kev catalogue with the Chandra 4 Ms (using Tables 3 and 6 in X11) and the ECDFS (using Tables 2 and 6 in Lehmer et al. 2005) catalogues. Then the cross-correlations were merged; when a source was present in both X11 and the ECDFS, we only considered the X11 position. The cross-correlation was performed considering all XMM-Chandra associations with r 5. For each XMM- Newton source with more than one possible Chandra counterpart, we dropped the association whose probability was 3% of that of the most probable one. We flagged initially as Good the associations with probabilities of association P(H cp r) 90 per cent. The restrictions in the cross-correlation catalogue above were chosen to provide a manageable size, while likely keeping all possible associations of interest. This restricted catalogue was extensively inspected by eye (taking also into account the XMM-Newton and Chandra fluxes) to get our definitive crosscorrelation catalogue. The visual inspection was carried out by superimposing contours of signal/noise ratio (SNR) on top of the XMM-Newton and Chandra images, to help locate the peaks of 11 The 2 8 kev number counts were used if the Chandra source was detected in that band, otherwise the kev number counts were used. If the source was only an upper limit in both bands, the upper limit in the 2 8 kev band was assumed to be the flux of the source and the number counts in that band were used. 15
16 emission. The SNR contours were also the basis for the annotations on the source blending present in the NOTES column of the catalogue. As a result of this inspection, 10 Chandra counterparts to 2 10 kev XMM-Newton sources had their Good flag revoked (2 counterparts to 5 10 kev sources), because either the corresponding XMM-Newton source was spurious, the Chandra member of the association had only an upper limit to its 2 8 kev flux or the counterpart was from the ECDFS and there was a better X11 counterpart. Conversely, 13 (5) counterparts were considered Good despite having probabilities of association below 90 per cent: this was changed because the position of the XMM-Newton source from our source detection did not coincide with the peak emission on the corresponding XMM-Newton image, or blending with nearby XMM-Newton or Chandra sources. In all cases we have kept the positional information from PWXDdetect. Finally, we obtained 336 Good XMM-Chandra associations for XMM-Newton sources in the main 2 10 kev catalogue (137 in the main 5 10 kev catalogue), corresponding to 339 (137) unique XMM-Newton sources. Out of the 315 (130) XMM-Newton sources with one or more Chandra counterparts, 295 (124) had a single counterpart, 19 (5) had two and 1 (1) had three. 24 (7) XMM-Newton sources did not have any Chandra counterpart New sources To identify candidate real XMM-CDFS sources not previously detected by X11 or Lehmer et al. (2005) with Chandra (as opposed to candidate spurious XMM-Newton detections) we adopt the following baseline criterion: a source is considered real if there is at least a signal/noise ratio (SNR) contour where SNR> 3 in the band where it was detected. The SNR was computed, in the Bayesian framework, by treating a source s count rate c as a random variable constrained to be c 0. Since the background images have more than 10 counts over the area where the exposure map t kl > 10 6 s, we use a Gaussian approximation to the Poisson statistics, so that for a pixel (i, j) the probability that a source is in that pixel with count rate c is P i j (c) kl exp (ct klw kl T kl +B kl ) 2 2(T kl +B kl ) 2π(Tkl + B kl ) (18) where the (k, l) indices run over a circular aperture of radius 16 around pixel (i, j), w kl is the value of a PSF centered in (i, j) at pixel (k, l) (approximated here by a gaussian of FWHM= 8.5 ), and T kl and B kl are the total and background image values. This can be rewritten as P i j (c) = exp (c c 0,i j) 2 2σi j 2 σ i j π 2 erfc ( c0,i j σ i j (2) ) c 0 (19) where erfc(x) = 2π 1 + e t2 dt is the complementary error x function. P i j (c) is normalized taking into account that c 0 and c 0,i j and σ i j are functions of t kl, w kl, T kl and B kl around pixel (i, j). Since P i j (c) is symmetric around c 0,i j for c 0, by analogy with the pure Gaussian case, the probability of having detected a source at pixel (i, j) is then SNR i j = 2c 0,i j 0 P i j (c) dc = 2 2 erfc(c 0,i j/σ i j (2)) 2 erfc(c 0,i j /σ i j (2)) (20) We have drawn the contours in terms of Gaussian sigmas taking into account that, for example, SNR=3 corresponds to SNR i j = Of the 24 (7) sources in the 2 10 (5 10) kev main catalogue without a Chandra counterpart, a SNR > 3 contour could be drawn on the 2 10 (5 10) kev images for 11 (2) of them, namely ID210 5, 85, 176, 189, 207, 224, 280, 348, 381, 402, 407, and ID and Of this list, ID and ID correspond to the same source. Two sources from the supplementary 2 10 kev catalogue (ID , 410) also satisfy this criterion and are thus considered real. The SNR> 3 contour of source ID includes a blend of ID (from the supplementary sample) and 306 (main), but it peaks around ID ; ID has no Chandra counterpart, while 306 does (source 443 in X11, whose position coincides with a peak of kev emission in XMM-Newton). Thus we consider ID as the counterpart to ID , and include 304 among the candidate real sources. We also considered a source as real, if it has at least a SNR > 2 contour in the same band of its detection, plus a SNR > 3 contour in the other band. This happens for one source: ID (not detected in the 2 10 kev band). Thus the total number of candidate new, XMM-Newtononly sources, is 15, divided as follows: 11 main 2 10 kev, 3 supplementary 2 10 kev, 3 main 5 10 kev (two sources were detected in both bands). Conversely, the number of candidate spurious sources is 13 in the main 2 10 kev sample and 4 in the 5 10 kev. Thus, the spurious fraction in the main 2 10 kev catalogue is (24 11)/ % Chandra sensitivity limits and optical/ir counterparts for the new sources Among the 15 candidate new sources, 2 are outside the 4 Ms and ECDFS areas (ID210: 407, 410) and were not observed by Chandra. Of the remaining 13, 8 are only covered by the ECDFS (ID210/ID510: 5, 186, 189, 207/1098, 224, 348, 381, 402), and 5 have also data from the 4 Ms survey (ID210/ID510: 85, 176, 280, 304/1150, 1149; though source 280 falls in an area with a strong exposure gradient). The 4 Ms flux limits are fainter than the ECDFS ones by about two order of magnitudes, therefore we will focus on the 5 sources falling in the 4 Ms area. The source positions are shown in Fig. 14 on an XMM-Newton exposure map with the Chandra survey boundaries superimposed. Visual inspection of Chandra 4 Ms data showed lowsignificance local enhancements in the positions of the new sources. The XMM-Newton fluxes are compared to the Chandra sensitivity in the soft and hard bands in Table 4. The Chandra limits in 2 8 kev band for sources 85, 280 and 119 inside the 4 Ms area are a factor 2 3 lower than the flux observed by XMM-Newton in the 2 10 kev band, while for source 176 the Chandra limit is 15 times lower than the XMM-Newton observed flux. Only for source 304/1150 the Chandra limit is above the XMM-Newton flux. Therefore, sources 85, 176, 280 and 119 should, in principle, have been detected by Chandra. All the sources inside the Chandra-covered areas are hard sources, because no signal is present in XMM-Newton data in the kev band. Also, the hardness ratios 12 for the 5 sources inside the 4 Ms area are 0.3 (Table 4) and consistent with an obscured spectrum with N H cm 2. The Chandra flux lim- 12 Calculated following Park et al. (2006) as the median of the posterior porability distribution of the ratio (H S )/(H + S ) where H and S are the counts in the 2 10 and kev band, respectively. 16


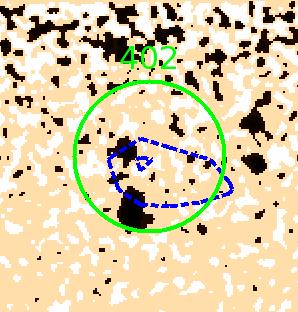
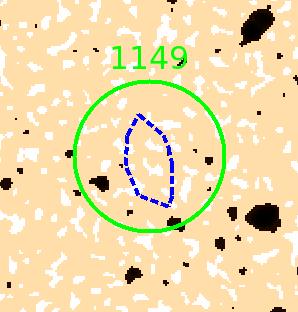
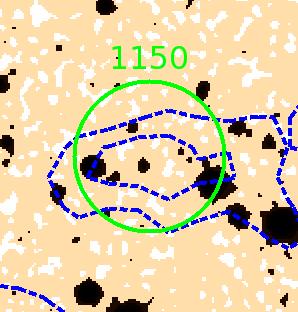
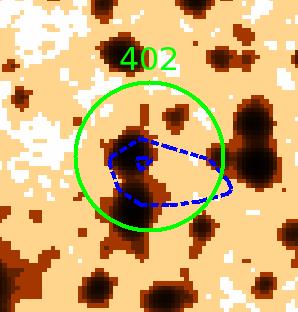
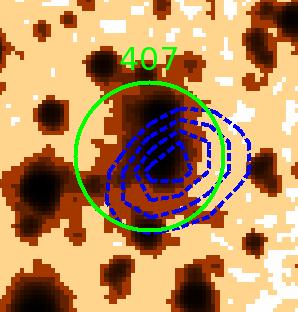
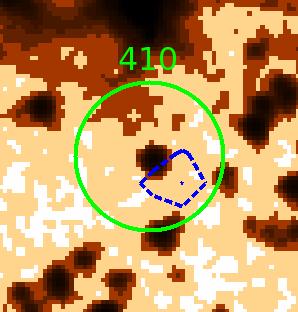
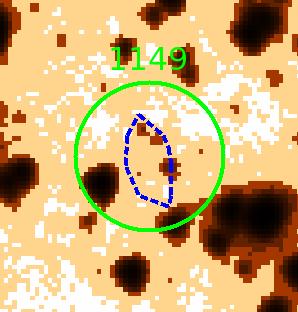

17 Fig. 13. K-band and 3.6µm cutouts of the 15 XMM-CDFS sources not previously detected by Chandra (images from the MUSYC and SIMPLE surveys). The XMM-Newton contours from the 2 10 kev band (5 10 kev for sources 1098 and 1149) are superimposed in blue. A green circle with radius 10 is drawn around the XMM-Newton position. The first, third and fifth rows show K-band images; the second, fourth and sixth rows show 3.6µm images. From left to right, and from top to bottom: ID210 5, 85, 176, 186, 189, 207, 224, 280, 348, 381, 402, 407, 410, and ID , K-band data are not available for ID and 410. Each cutout covers an area of The K-band images have been smoothed with a Gaussian kernel of size 3 pixel (0.75 ). The images are shown in histogram-equalized scaling, ranging from light (fainter fluxes) to dark brown (brighter fluxes). 17

18 348 ECDFS CDFS 4Ms / / Table 4. XMM-Newton fluxes and Chandra sensitivities for the 5 candidate new sources falling in the 4 Ms area. ID210/ID510 XMM XMM Chandra limits flux HR kev 2 8 kev / Notes. XMM-Newton fluxes are for the 2 10 kev band (except for source ID , which is in the 5 10 kev band). Chandra sensitivity limits in the 2 8 and kev bands from the 4 Ms survey. All fluxes in units of erg s 1 cm 2. Hardness ratio are from PN data e e e e e+0 Fig. 14. Positions and ID210/ID510 numbers of the 15 candidate real sources not previously detected by Chandra, superimposed on the XMM-Newton 2 10 kev exposure map. The exposure map is drawn in logarithmic scale to show also the field border where the exposure is very low. The areas previously surveyed by Chandra are also shown. its were calculated for an unabsorbed spectrum with Γ = 1.4; for obscured sources the limits would be higher depending on the column density. Thus it is possible that the differences between the Chandra and XMM-Newton effective area curves (Chandra having a higher drop at high energies than XMM-Newton) may favour the detection by XMM-Newton of very hard sources close to the nominal Chandra flux limit in the hard band. Consistently source 176, which has the largest ratio between observed XMM- Newton flux and Chandra limit, is also the hardest source with a HR 0.88 (this HR may be produced by a power-law with Γ = 1.7 and N H cm 2 ; source 176 is not detected in the 5 10 kev band probably because of its faintness, though an excess is still visible in the 5 10 kev image). If the hardness of these sources is due to obscuration, then the non-detection by Chandra in the kev band would also be justified. None of these sources was included in the Iwasawa et al. (2012) paper because their PWXDetect significance is below the threshold set in that paper (except for source 407 which has however a low number of counts). Further study of these sources may help shed light on the obscured AGN population responsible for the missing fraction of the cosmic X-ray background, and will be presented in a further paper of this series (Ranalli et al., in prep.). For the 15 new sources, we have searched for identifications in the K and 3.6µm bands from the MUSYC (Taylor et al. 2009) and SIMPLE (Damen et al. 2011) surveys. The closest possible matches are presented in Table 5; in a few case we list more than one possibility due to the crowdness of the field. Finally, in Fig. 13 we present K and 3.6µm image cutouts in the with XMM-Newton contours sumperimposed Number of chance associations We have used the simulations detailed in Sect. 5 to assess how many of these XMM-Chandra associations are due to chance: i.e., we check the reliability of the match, not that of the individual sources. We took the output XMM source lists from five of those simulations (for each band) and cross-correlated them with the CDFS 4 Ms and the ECDFS catalogues following the procedure outlined above (cross-correlation with CDFS 4 Ms and ECDFS independently, removal of the duplicated sources, merging, subselection out to r 5, removal of further counterparts with low relative probability and selection of associations with high probability). We then merged the five resulting catalogues and calculated the fraction of simulated XMM sources that had one or more counterparts with probability above 90 per cent: out of the 1793 (685) sources in those five simulations, 71 (30) had one Good Chandra counterpart and 6 (3) had two, there were none with three or more. These correspond to a total of chance associations with one or more Chandra sources of 4.3 ± 0.5 per cent 13 ( ). Therefore, for the 2 10 kev main catalogue of 339 sources, we would expect between about 13 and 16 chance associations of sources, while for the 5 10 kev main catalogue of 136 sources there would be between about 5 and 8 spurious pairs. 9. Conclusions We have presented the observations, data reduction, catalogues and number counts of the XMM-CDFS survey. Currently the deepest XMM-Newton survey, the XMM-CDFS observations pose several challenges in their reduction. The large number of independent exposures (33 obsids times 3 cameras) centred on the same field was unprecedented for XMM-Newton. The very large time span of the observations allowed us to find an increase by a factor 2 in the instrumental background in the years with respect to the years , and estimate the variations of the various background components. A careful study of the instrumental background of XMM- Newton during the XMM-CDFS observations was done to produce simulated observations, whose properties were designed to be as close as possible to the real XMM-CDFS. By using the count ratio between in-fov and out-of-fov data, 13 We have estimated the uncertainties in those fractions using a Bayesian approach and the binomial distribution (Wall & Jenkins 2003) with the shortest 68 per cent condence interval (S. Andreon, priv. comm.). 18
Few good reasons to hold the meeting in Cervia
 Few good reasons to hold the meeting in Cervia To see the sunrise on the beach Close to some of the places narrated by Nico with unflagging gusto To stay in the Grand Hotel at least once in your life Last-year
arxiv: v1 [astro-ph] 29 Nov 2007
![arxiv: v1 [astro-ph] 29 Nov 2007](/thumbs/94/118290854.jpg "arxiv: v1 [astro-ph] 29 Nov 2007") Astronomy & Astrophysics manuscript no. lhpaper n2 c ESO 2007 December 3, 2007 XMM-Newton observations of the Lockman Hole: X-ray source catalogue and number counts H. Brunner 1, N. Cappelluti 1, G. Hasinger
Astronomy & Astrophysics manuscript no. lhpaper n2 c ESO 2007 December 3, 2007 XMM-Newton observations of the Lockman Hole: X-ray source catalogue and number counts H. Brunner 1, N. Cappelluti 1, G. Hasinger
Analysis of extended sources with the EPIC cameras
 Analysis of extended sources with the EPIC cameras 7 th ESAC SAS Workshop June 19 22, 2007 Science Operations Centre 1 Status Analysis of extended sources is complex, challenging and time-consuming There
Results from the Chandra Deep Field North
 Results from the Chandra Deep Field North Brandt, Alexander, Bauer, Garmire, Hornschemeier, Immler, Lehmer, Schneider, Vignali, Wu, Barger, Cowie, Bautz, Nousek, Sargent, Townsley Chandra Deep Field North
arxiv:astro-ph/ v1 6 Dec 1999
 RESULTS FROM X-RAY SURVEYS WITH ASCA arxiv:astro-ph/9912084v1 6 Dec 1999 Yoshihiro Ueda Institute of Space and Astronautical Science, Kanagawa 229-8510, Japan ABSTRACT We present main results from X-ray
Exploring the X-ray sky with the XMM-Newton bright serendipitous survey,
 A&A 428, 383 399 (2004) DOI: 10.1051/0004-6361:20040252 c ESO 2004 Astronomy & Astrophysics Exploring the X-ray sky with the XMM-Newton bright serendipitous survey, R. Della Ceca 1, T. Maccacaro 1, A.
arxiv:astro-ph/ v3 24 Mar 2006
 Accepted for publication in The Astrophysical Journal Preprint typeset using L A TEX style emulateapj v. 6/22/04 ABSOLUTE MEASUREMENT OF THE UNRESOLVED COSMIC X-RAY BACKGROUND IN THE 0.5 8 KEV BAND WITH
Luminous Galaxy Clusters from the XMM Archive Possibilites and Limitations
 Distant X-ray X Luminous Galaxy Clusters from the XMM Archive Possibilites and Limitations Rene Fassbender (MPE) XXL Survey Workshop April 2008 Outline i. The XMM-Newton Distant Cluster Project ii. iii.
X-raying High-Redshift AGNs and the First Black Holes: From Chandra to Lynx
 X-raying High-Redshift AGNs and the First Black Holes: From Chandra to Lynx Niel Brandt, Fabio Vito, the Chandra Deep Fields Team, and the Lynx First Accretion Light Working Group Some Relevant Results
The Bright Side of the X-ray Sky The XMM-Newton Bright Survey. R. Della Ceca. INAF Osservatorio Astronomico di Brera,Milan
 The Bright Side of the X-ray Sky The XMM-Newton Bright Survey T. Maccacaro A. Caccianiga P. Severgnini V. Braito R. Della Ceca INAF Osservatorio Astronomico di Brera,Milan On behalf of the XMM-Newton Survey
SUPPLEMENTARY INFORMATION
 doi:10.1038/nature11096 Spectroscopic redshifts of CDF-N X-ray sources We have taken a recent compilation 13 as our main source of spectroscopic redshifts. These redshifts are given to two decimal places,
The quest for Type 2 quasars: What are the X-ray observations of optically selected QSOs2 telling us?
 The quest for Type 2 quasars: What are the X-ray observations of optically selected QSOs2 telling us? Cristian Vignali Dipartimento di Astronomia, Universita`degli Studi di Bologna In collaboration with
The Harvard community has made this article openly available. Please share how this access benefits you. Your story matters.
 Chandra Multiwavelength Project X Ray Point Source Number Counts and the Cosmic X Ray Background The Harvard community has made this article openly available. Please share how this access benefits you.
Selection of stars to calibrate Gaia
 Highlights of Spanish Astrophysics VIII, Proceedings of the XI Scientific Meeting of the Spanish Astronomical Society held on September 8 12, 2014, in Teruel, Spain. A. J. Cenarro, F. Figueras, C. Hernández-
A Library of the X-ray Universe: Generating the XMM-Newton Source Catalogues
 A Library of the X-ray Universe: Generating the XMM-Newton Source Catalogues Iris Traulsen Axel Schwope, Georg Lamer Leibniz-Institut für Astrophysik Potsdam (AIP) on behalf of the XMM-Newton Survey Science
The Contribution of Active Galactic Nuclei to the Excess Cosmic Radio Background at 1.4 GHz
 The Contribution of Active Galactic Nuclei to the Excess Cosmic Radio Background at 1.4 GHz David R. Ballantyne Center for Relativistic Astrophysics, School of Physics, Georgia Tech The Cosmic Backgrounds
The Astronomical Journal, 127: , 2004 January # The American Astronomical Society. All rights reserved. Printed in U.S.A.
 The Astronomical Journal, 127:213 229, 2004 January # 2004. The American Astronomical Society. All rights reserved. Printed in U.S.A. A THE 172 ks CHANDRA EXPOSURE OF THE LALA BOOTES FIELD: X-RAY SOURCE
Modern Image Processing Techniques in Astronomical Sky Surveys
 Modern Image Processing Techniques in Astronomical Sky Surveys Items of the PhD thesis József Varga Astronomy MSc Eötvös Loránd University, Faculty of Science PhD School of Physics, Programme of Particle
arxiv:astro-ph/ v1 22 Jul 2004
 1 Astronomy & Astrophysics manuscript no. dellaceca XMMBSSrev2 July 7, 2018 (DOI: will be inserted by hand later) Exploring the X-ray Sky with the XMM-Newton Bright Serendipitous Survey arxiv:astro-ph/0407481v1
X ray Survey Results on AGN Physics and Evolution Niel Brandt
 X ray Survey Results on AGN Physics and Evolution Niel Brandt Chandra XMM Newton Photon statistics Hard response ACIS Best positions Highest sens. < 6 kev 50 250 times sens. of previous missions Good positions
Astronomy. Astrophysics. The XMM-Newton serendipitous survey,, III. The AXIS X-ray source counts and angular clustering
 A&A 469, 27 46 (2007) DOI: 10.1051/0004-6361:20066271 c ESO 2007 Astronomy & Astrophysics The XMM-Newton serendipitous survey,, III. The AXIS X-ray source counts and angular clustering F. J. Carrera 1,J.Ebrero
arxiv:astro-ph/ v1 6 Oct 2002
 Astronomy & Astrophysics manuscript no. hkatayama January 18, 218 (DOI: will be inserted by hand later) Properties of the background of EPIC-pn onboard XMM-Newton H. Katayama 1, I. Takahashi 2, Y. Ikebe
The Palermo Swift-BAT Hard X-ray Catalogue
 Mem. S.A.It. Vol. 81, 215 c SAIt 2010 Memorie della The Palermo Swift-BAT Hard X-ray Catalogue Results after 39 months of sky survey G. Cusumano INAF, Istituto di Astrofisica Spaziale e Fisica Cosmica
The in-orbit wavelength calibration of the WFC G800L grism
 The in-orbit wavelength calibration of the WFC G800L grism A. Pasquali, N. Pirzkal, J.R. Walsh March 5, 2003 ABSTRACT We present the G800L grism spectra of the Wolf-Rayet stars WR45 and WR96 acquired with
arxiv: v1 [astro-ph.he] 11 May 2017
![arxiv: v1 [astro-ph.he] 11 May 2017](/thumbs/92/111039649.jpg "arxiv: v1 [astro-ph.he] 11 May 2017") Noname manuscript No. (will be inserted by the editor) A Systematic Analysis of the XMM-Newton Background: I. Dataset and Extraction Procedures arxiv:1705.04171v1 [astro-ph.he] 11 May 2017 Martino Marelli
Noname manuscript No. (will be inserted by the editor) A Systematic Analysis of the XMM-Newton Background: I. Dataset and Extraction Procedures arxiv:1705.04171v1 [astro-ph.he] 11 May 2017 Martino Marelli
X RAY EMITTING EROS AS TRACERS OF BLACK HOLES-GALAXIES COEVOLUTION
 1 X RAY EMITTING EROS AS TRACERS OF BLACK HOLES-GALAXIES COEVOLUTION M. Brusa 1, A. Comastri 2, E. Daddi 3, M. Mignoli 2, C. Vignali 4, G. Zamorani 2, F. Fiore 5, and L. Pozzetti 2 1 Max Planck Institut
THE X-RAY BACKGROUND AND THE DEEP X-RAY SURVEYS
 THE X-RAY BACKGROUND AND THE DEEP X-RAY SURVEYS R. Gilli 1 arxiv:astro-ph/0303115 v1 5 Mar 2003 1 Istituto Nazionale di Astrofisica (INAF), Osservatorio Astrofisico di Arcetri, Largo E. Fermi 5, 50125
Extended Chandra Multi-Wavelength Project (ChaMPx): Source Catalog and Applications
: Source Catalog and Applications") Extended Chandra Multi-Wavelength Project (ChaMPx): Source Catalog and Applications Dong-Woo Kim, P. Green, T. L. Aldcroft, W. Barkhouse, D. Haggard, V. Kashyap, A. Mossman, M. A. Agueros, A. Constantin,
Extended Chandra Multi-Wavelength Project (ChaMPx): Source Catalog and Applications Dong-Woo Kim, P. Green, T. L. Aldcroft, W. Barkhouse, D. Haggard, V. Kashyap, A. Mossman, M. A. Agueros, A. Constantin,
arxiv: v1 [astro-ph.he] 13 Feb 2019
![arxiv: v1 [astro-ph.he] 13 Feb 2019](/thumbs/95/124413258.jpg "arxiv: v1 [astro-ph.he] 13 Feb 2019") Astronomy & Astrophysics manuscript no. FINAL c ESO 9 February 5, 9 The source number counts at high energies: SWIFT vs. NuSTAR A. Akylas and I. Georgantopoulos Institute for Astronomy Astrophysics Space
Astronomy & Astrophysics manuscript no. FINAL c ESO 9 February 5, 9 The source number counts at high energies: SWIFT vs. NuSTAR A. Akylas and I. Georgantopoulos Institute for Astronomy Astrophysics Space
arxiv:astro-ph/ v1 28 Nov 2002
 A&A manuscript no. (will be inserted by hand later) Your thesaurus codes are: 06 (03.11.1; 16.06.1; 19.06.1; 19.37.1; 19.53.1; 19.63.1) A deep VLA survey at 6 cm in the Lockman Hole P. Ciliegi 1, G. Zamorani
arxiv:astro-ph/ v2 5 Jul 2005
 The Extended Chandra Deep Field-South Survey. Chandra Point-Source Catalogs B. D. Lehmer, 1 W. N. Brandt, 1 D. M. Alexander, 2 F. E. Bauer, 3 D. P. Schneider, 1 P. Tozzi, 4 J. Bergeron, 5 G. P. Garmire,
FIGURE 1. The total kev logn-logs determined from several ROSAT surveys as indicated in the plot. Adapted from Hasinger et al.
 X-RAY SURVEYS P. Giommi 1,F.Fiore 1,2,3 and M. Perri 1 1) BeppoSAX Science Data Center, Rome, Italy 2) Osservatorio Astronomico di Roma, Monteporzio, Italy 3) Smithsonian Astrophysical Observatory, 60
The quest for early Black Holes
 The quest for early Black Holes Andrea Comastri (INAF-Bologna) Roberto Gilli (INAF-Bologna) Cristian Vignali (Bologna University) Marcella Brusa (MPE) and many others Outline High redshift (z > 3) AGN
Identifications and Photometric Redshifts of the 2 Ms Chandra Deep Field-South Sources
 Identifications and Photometric Redshifts of the 2 Ms Chandra Deep Field-South Sources B. Luo, 1 W. N. Brandt, 1 Y. Q. Xue, 1 M. Brusa, 2,3 D. M. Alexander, 4 F. E. Bauer, 5,6 A. Comastri, 7 A. Koekemoer,
NuSTAR observation of the Arches cluster: X-ray spectrum extraction from a 2D image
 NuSTAR observation of the Arches cluster: X-ray spectrum extraction from a 2D image Space Research Institute (IKI), Moscow, Russia E-mail: krivonos@iki.rssi.ru The NuSTAR mission performed a long (200
arxiv:astro-ph/ v1 1 Nov 2000
 The New Era of Wide Field Astronomy ASP Conference Series, Vol. 000, 2001 R.G. Clowes, A.J. Adamson, G.E. Bromage The evolution of AGN in the Hard X-rays from HELLAS arxiv:astro-ph/0011008v1 1 Nov 2000
The evolution of star forming galaxies with the Wide Field X-ray Telescope
 Mem. S.A.It. Suppl. Vol. 17, 122 c SAIt 2011 Memorie della Supplementi The evolution of star forming galaxies with the Wide Field X-ray Telescope P. Ranalli Università di Bologna Dipartimento di Astronomia,
Chandra Observation of Point Sources in the X-Ray Elliptical Galaxy NGC 1407
 Chin. J. Astron. Astrophys. Vol. 4 (2004), No. 3, 221 230 ( http: /www.chjaa.org or http: /chjaa.bao.ac.cn ) Chinese Journal of Astronomy and Astrophysics Chandra Observation of Point Sources in the X-Ray
Supplementary Materials for
 Supplementary Materials for The Shortest Known Period Star Orbiting our Galaxy's Supermassive Black Hole L. Meyer, A. M. Ghez, R. Schödel, S. Yelda, A. Boehle, J. R. Lu, T. Do, M. R. Morris, E. E. Becklin,
arxiv:astro-ph/ v1 18 Aug 2001
 Accepted for publication in ApJL Preprint typeset using L A TEX style emulateapj v. 25/04/01 THE CONSEQUENCES OF THE COSMIC STAR-FORMATION RATE: X-RAY NUMBER COUNTS A. Ptak 1, R. Griffiths Carnegie Mellon
Compton-thick AGN. SWIFT/BAT 70 month survey (+ CDFS 7Ms + models) I. Georgantopoulos National Observatory of Athens
 I. Georgantopoulos National Observatory of Athens") Compton-thick AGN SWIFT/BAT 70 month survey (+ CDFS 7Ms + models) I. Georgantopoulos National Observatory of Athens A. Akylas, P. Ranalli, A. Corral, G. Lanzuisi Talk Outline Rationale: Why heavily obscured
Compton-thick AGN SWIFT/BAT 70 month survey (+ CDFS 7Ms + models) I. Georgantopoulos National Observatory of Athens A. Akylas, P. Ranalli, A. Corral, G. Lanzuisi Talk Outline Rationale: Why heavily obscured
PoS(extremesky2009)103
103") The study of the nature of sources AX J1749.1 2733 and AX J1749.2 2725 D. I. Karasev Space Research Institute, Profsoyuznaya str. 84/32, Moscow 117997, Russia E-mail: dkarasev@iki.rssi.ru Space Research
The study of the nature of sources AX J1749.1 2733 and AX J1749.2 2725 D. I. Karasev Space Research Institute, Profsoyuznaya str. 84/32, Moscow 117997, Russia E-mail: dkarasev@iki.rssi.ru Space Research
9.1 Years of All-Sky Hard X-ray Monitoring with BATSE
 9.1 Years of All-Sky Hard X-ray Monitoring with CGRO BATSE Large Area Detector (LAD) BATSE 1 of 8 BATSE Colleen A. Wilson (NASA/MSFC), for the BATSE teams at MSFC and Southampton Abstract The hard X-ray
A deep VLA survey at 6 cm in the Lockman Hole
 A&A 398, 901 918 (2003) DOI: 10.1051/0004-6361:20021721 c ESO 2003 Astronomy & Astrophysics A deep VLA survey at 6 cm in the Lockman Hole P. Ciliegi 1,G.Zamorani 1,2, G. Hasinger 3,4,I.Lehmann 3,4,G.Szokoly
Publ. Astron. Obs. Belgrade No. 86 (2009), TURKISH NATIONAL OBSERVATORY (TUG) VIEW OF CLUSTERS OF GALAXIES
, TURKISH NATIONAL OBSERVATORY (TUG) VIEW OF CLUSTERS OF GALAXIES") Publ. Astron. Obs. Belgrade No. 86 (2009), 125-130 Contributed paper TURKISH NATIONAL OBSERVATORY (TUG) VIEW OF CLUSTERS OF GALAXIES M. HUDAVERDI 1,2, E. N. ERCAN 2, M. BOZKURT 2, F. GÖK3 and E. AKTEKIN
Publ. Astron. Obs. Belgrade No. 86 (2009), 125-130 Contributed paper TURKISH NATIONAL OBSERVATORY (TUG) VIEW OF CLUSTERS OF GALAXIES M. HUDAVERDI 1,2, E. N. ERCAN 2, M. BOZKURT 2, F. GÖK3 and E. AKTEKIN
arxiv:astro-ph/ v1 15 Sep 1997
 A&A manuscript no. (will be inserted by hand later) Your thesaurus codes are: 03(04.19.1;12.04.2;13.25.2) ASTRONOMY AND ASTROPHYSICS 22.10.2018 The ROSAT Deep Survey I. X ray sources in the Lockman Field
CONTENTS AIM OF THE PROJECT. INTRODUCTION: AGNs, XMM-Newton, ROSAT. TECHNIQUES: IDL, SQL, Catalogues RESULTS SUMMARY DESIRED OUTPUTS QUESTIONS
 CONTENTS AIM OF THE PROJECT INTRODUCTION: AGNs, XMM-Newton, ROSAT TECHNIQUES: IDL, SQL, Catalogues RESULTS SUMMARY DESIRED OUTPUTS QUESTIONS AIM OF THE PROJECT Brightness of AGNs appears to change very
GOODS/VIMOS Spectroscopy: Data Release Version 2.0.1
 ESO Phase 3 Data Release Description Data Collection GOODS_VIMOS_SPEC Release Number 1 Data Provider C. Cesarsky Date 10.03.2010 Migrated to Phase 3 infrastructure 08.12.2014 GOODS/VIMOS Spectroscopy:
C. Watson, E. Churchwell, R. Indebetouw, M. Meade, B. Babler, B. Whitney
 Reliability and Completeness for the GLIMPSE Survey C. Watson, E. Churchwell, R. Indebetouw, M. Meade, B. Babler, B. Whitney Abstract This document examines the GLIMPSE observing strategy and criteria
Analysis of Off-Nuclear X-Ray Sources in Galaxy NGC Sarah M. Harrison
 SLAC-TN-6-19 August 26 Analysis of Off-Nuclear X-Ray Sources in Galaxy NGC 4945 Sarah M. Harrison Office of Science, Science Undergraduate Laboratory Internship (SULI) Massachusetts Institute of Technology
The bolometric output of AGN in the XMM-COSMOS survey
 The bolometric output of AGN in the XMM-COSMOS survey Elisabeta Lusso Dipartimento di Astronomia Università di Bologna-INAF/OABO A. Comastri, C. Vignali, G. Zamorani, M. Brusa, E. Treister, R. Gilli, M.
PoS(INTEGRAL 2010)131
131") Study of the X-ray/gamma source AX J1910.7+0917 and three newly discovered INTEGRAL sources, E. Bozzo a, C. Ferrigno a, C. Ricci a, A. Manousakis a, R. Walter a, L. Stella b a ISDC - Science data center
Study of the X-ray/gamma source AX J1910.7+0917 and three newly discovered INTEGRAL sources, E. Bozzo a, C. Ferrigno a, C. Ricci a, A. Manousakis a, R. Walter a, L. Stella b a ISDC - Science data center
e e-03. which is distributed with standard chandra processing. visual inspection are included.
 1 SUMMARY 1 SNR 0505-67.9 1 Summary Common Name: DEM L71 Distance: 50 kpc (distance to LMC, Westerlund(1990) ) Center of X-ray emission (J2000): ( 05 05 42.0, -67 52 39.8 ) X-ray size: 86 x 74 Description:
Status of the EPIC calibration
 Status of the calibration 16 October 2003 Marcus G. F. Kirsch Marcus G. F. Kirsch with the input of the whole consortium Page 1 progress in calibration general absolute timing problem seems to be solved
arxiv:astro-ph/ v1 6 May 2004
 XMM-NEWTON OBSERVATIONS OF THREE HIGH REDSHIFT RADIO GALAXIES arxiv:astro-ph/0405116 v1 6 May 2004 Abstract E. Belsole, D.M. Worrall, M. J. Hardcastle Department of Physics - University of Bristol Tyndall
XMM-Newton Calibration
 XMM-Newton Calibration Michael Smith, on behalf of XMM-SOC and Instrument Teams 18 th XMM-Newton Users Group Meeting, ESAC, 11 May 2017 ESA UNCLASSIFIED - For Official Use Outline 1. Status of calibration
The XMM-Newton (and multiwavelength) view of the nonthermal supernova remnant HESS J
 view of the nonthermal supernova remnant HESS J") The XMM-Newton (and multiwavelength) view of the nonthermal supernova remnant HESS J- Gerd Pühlhofer Institut für Astronomie und Astrophysik Kepler Center for Astro and Particle Physics Tübingen, Germany
The XMM-Newton (and multiwavelength) view of the nonthermal supernova remnant HESS J- Gerd Pühlhofer Institut für Astronomie und Astrophysik Kepler Center for Astro and Particle Physics Tübingen, Germany
The Behaviour of the XMM-Newton Background: From the beginning of the mission until May XMM-SOC-GEN-TN-0014 issue 3.10
 The Behaviour of the XMM-Newton Background: From the beginning of the mission until May 2017 XMM-SOC-GEN-TN-0014 issue 3.10 R. González-Riestra and P.M. Rodríguez-Pascual XMM-SOC User Support Group June
Received 2003 January 3; accepted 2003 April 22
 The Astronomical Journal, 126:539 574, 2003 August # 2003. The American Astronomical Society. All rights reserved. Printed in U.S.A. E THE CHANDRA DEEP FIELD NORTH SURVEY. XIII. 2 Ms POINT-SOURCE CATALOGS
PoS(INTEGRAL 2012)090
090") XMM-Newton observations of five INTEGRAL sources located towards the Scutum Arm UC Berkeley - Space Sciences Laboratory E-mail: bodaghee@ssl.berkeley.edu John A. Tomsick UC Berkeley - Space Sciences Laboratory
XMM-Newton observations of five INTEGRAL sources located towards the Scutum Arm UC Berkeley - Space Sciences Laboratory E-mail: bodaghee@ssl.berkeley.edu John A. Tomsick UC Berkeley - Space Sciences Laboratory
1. INTRODUCTION. Cambridge, MA Department of Astronomy and Astrophysics, Pennsylvania State
 The Astrophysical Journal, 583:70 84, 2003 January 20 # 2003. The American Astronomical Society. All rights reserved. Printed in U.S.A. CHANDRA SPECTRA OF THE SOFT X-RAY DIFFUSE BACKGROUND M. Markevitch,
The central region of M 31 observed with XMM-Newton
 A&A 365, L195 L201 (2001) DOI: 10.1051/0004-6361:20000243 c ESO 2001 Astronomy & Astrophysics The central region of M 31 observed with XMM-Newton I. Group properties and diffuse emission R. Shirey 1,R.Soria
Analyzing Spiral Galaxies Observed in Near-Infrared
 Analyzing Spiral Galaxies Observed in Near-Infrared Preben Grosbøl European Southern Observatory Karl-Schwarzschild-Str. 2, D-85748 Garching, Germany Abstract A sample of 54 spiral galaxies was observed
A Cluster of Galaxies, Abell 496
 A Cluster of Galaxies, Abell 496 F. Nobels and W. Mulder MSc Astronomy & Kapteyn Astronomical Institute, University of Groningen (Dated: November 11, 2015) As part of the course High-Energy Astrophysics,
MEMORANDUM. Focal-Point: Point on the focal plane where the sharpest PSF is located.
 CHANDRA X-ray Center 60 Garden St., Cambridge Massachusetts 02138 USA MEMORANDUM Date: October 16, 2017 From: Ping Zhao To: CXC Subject: Chandra Optical Axis and Aimpoint File: oxap memo 2017.tex Version:
The XMM-Newton EPIC background and the production of background blank sky event files. J. A. Carter and A. M. Read ABSTRACT
 A&A 464, 1155 1166 (2007) DOI: 10.1051/0004-6361:20065882 c ESO 2007 Astronomy & Astrophysics The XMM-Newton EPIC background and the production of background blank sky event files J. A. Carter and A. M.
Sequence Obs ID Instrument Exposure uf Exposure f Date Observed Aimpoint (J2000) (ks) (ks) (α, δ)
 (ks) (ks) (α, δ)") 1 SUMMARY 1 G120.1+01.4 1 Summary Common Name: Tycho s Distance: 2.4 kpc ( Chevalier et al., 1980 ) Center of X-ray emission (J2000): ( 00 25 19.9, 64 08 18.2 ) X-ray size: 8.7 x8.6 Description: 1.1 Summary
1 SUMMARY 1 G120.1+01.4 1 Summary Common Name: Tycho s Distance: 2.4 kpc ( Chevalier et al., 1980 ) Center of X-ray emission (J2000): ( 00 25 19.9, 64 08 18.2 ) X-ray size: 8.7 x8.6 Description: 1.1 Summary
arxiv: v1 [astro-ph] 1 Dec 2008
![arxiv: v1 [astro-ph] 1 Dec 2008](/thumbs/92/107772891.jpg "arxiv: v1 [astro-ph] 1 Dec 2008") Mon. Not. R. Astron. Soc., 1 12; (28) Printed 6 November 218 (MN LATEX style file v2.2) Radio source stacking and the infrared / radio correlation at microjy flux densities arxiv:812.281v1 [astro-ph] 1
Mon. Not. R. Astron. Soc., 1 12; (28) Printed 6 November 218 (MN LATEX style file v2.2) Radio source stacking and the infrared / radio correlation at microjy flux densities arxiv:812.281v1 [astro-ph] 1
arxiv:astro-ph/ v1 12 Aug 1999
 The ASCA Medium Sensitivity Survey (the GIS Catalog Project): Source Counts and Evidence for Emerging Population of Hard Sources Yoshihiro Ueda 1, Tadayuki Takahashi 1, Yoshitaka Ishisaki 2, Takaya Ohashi
The BAT AGN Survey - Progress Report J. Tueller, C. Markwardt, L. Winter and R. Mushotzky Goddard Space Flight Center
 The BAT AGN Survey - Progress Report J. Tueller, C. Markwardt, L. Winter and R. Mushotzky Goddard Space Flight Center The Swift BAT (Burst and Transient Telescope) has been observing the whole sky in the
arxiv: v1 [astro-ph.ga] 17 Jul 2015
![arxiv: v1 [astro-ph.ga] 17 Jul 2015](/thumbs/94/119598112.jpg "arxiv: v1 [astro-ph.ga] 17 Jul 2015") A new search for variability-selected active galaxies within the VST SUDARE-VOICE survey: the Chandra Deep Field South and the SERVS-SWIRE area arxiv:1507.04923v1 [astro-ph.ga] 17 Jul 2015 Falocco S.,
A new search for variability-selected active galaxies within the VST SUDARE-VOICE survey: the Chandra Deep Field South and the SERVS-SWIRE area arxiv:1507.04923v1 [astro-ph.ga] 17 Jul 2015 Falocco S.,
arxiv:astro-ph/ v1 29 Mar 2000
 WHAT S WRONG WITH AGN MODELS FOR THE X-RAY BACKGROUND? arxiv:astro-ph/0003437v1 29 Mar 2000 Andrea Comastri Osservatorio Astronomico di Bologna, via Ranzani 1, I 40127 Bologna, Italy ABSTRACT The origin
Calibration of ACS Prism Slitless Spectroscopy Modes
 The 2005 HST Calibration Workshop Space Telescope Science Institute, 2005 A. M. Koekemoer, P. Goudfrooij, and L. L. Dressel, eds. Calibration of ACS Prism Slitless Spectroscopy Modes S. S. Larsen, M. Kümmel
EPIC-BG Meeting June/July`05 - Introduction
 -BG Meeting June/July`05 - Introduction At the end of the last UG meeting, and in line with the conclusions from Previous UG meetings, it was highlighted that there is a need for to progress in the description
ACIS ( , ) Total e e e e-10 4.
 Total e e e e-10 4.") 1 SUMMARY 1 G21.5-0.9 1 Summary Distance: 5 kpc ( Safi-Harb et al., 2001 ) Position of Central Source (J2000): ( 18 33 34.0, -10 34 15.3 ) X-ray size: 4.7 x4.6 Description: 1.1 Summary of Chandra Observations
1 SUMMARY 1 G21.5-0.9 1 Summary Distance: 5 kpc ( Safi-Harb et al., 2001 ) Position of Central Source (J2000): ( 18 33 34.0, -10 34 15.3 ) X-ray size: 4.7 x4.6 Description: 1.1 Summary of Chandra Observations
The Hard X-Ray Luminosity Function of High-Redshift (z > 3) AGN
 AGN") The Hard X-Ray Luminosity Function of High-Redshift (z > 3) AGN Fabio Vito Dipartimento di Fisica e Astronomia - Università di Bologna INAF-OABo F Vito, RGilli, C Vignali, A Comastri, M Brusa, N Cappelluti,
The Hard X-Ray Luminosity Function of High-Redshift (z > 3) AGN Fabio Vito Dipartimento di Fisica e Astronomia - Università di Bologna INAF-OABo F Vito, RGilli, C Vignali, A Comastri, M Brusa, N Cappelluti,
Major Releases: BG analysis web page with recommended information, papers, summary tables etc:
 BGWG -Newton BackGround Working Group founded (~1.5 years ago). Steering and supervising committee to provide the user with clear information on the Background and (SAS)-Tools to treat the Background correctly
PoS(extremesky2009)013
013") Correlating the WFC and the IBIS hard X-ray surveys IASF-Roma INAF. Via Fosso del Cavaliere, 100 00133 Rome Italy E-mail: fiamma.capitanio@iasf-roma.inaf.it A. J. Bird School of Physics and Astronomy,
Correlating the WFC and the IBIS hard X-ray surveys IASF-Roma INAF. Via Fosso del Cavaliere, 100 00133 Rome Italy E-mail: fiamma.capitanio@iasf-roma.inaf.it A. J. Bird School of Physics and Astronomy,
THE SUBARU/XMM-NEWTON DEEP SURVEY (SXDS). III. X-RAY DATA
. III. X-RAY DATA") The Astrophysical Journal Supplement Series, 179:124Y141, 2008 November # 2008. The American Astronomical Society. All rights reserved. Printed in U.S.A. A THE SUBARU/XMM-NEWTON DEEP SURVEY (SXDS). III.
The Astrophysical Journal Supplement Series, 179:124Y141, 2008 November # 2008. The American Astronomical Society. All rights reserved. Printed in U.S.A. A THE SUBARU/XMM-NEWTON DEEP SURVEY (SXDS). III.
The 3XMM catalogue. Natalie Webb. Institut de Recherche en Astrophysique et Planétologie Toulouse, France
 The 3XMM catalogue Institut de Recherche en Astrophysique et Planétologie Toulouse, France and for the XMM Newton Survey Science Centre (SSC) 1 XMM Newton Survey Science Centre (SSC) The XMM Newton Survey
STUDIES OF SELECTED VOIDS. SURFACE PHOTOMETRY OF FAINT GALAXIES IN THE DIRECTION OF IN HERCULES VOID
 STUDIES OF SELECTED VOIDS. SURFACE PHOTOMETRY OF FAINT GALAXIES IN THE DIRECTION OF 1600+18 IN HERCULES VOID G.Petrov [1], A.Y.Kniazev [2], and J.W. Fried [2] 1 Institute of Astronomy, Bulgarian Academy
ATHENA Mission Design and ESA Status. David Lumb ESA Study Scientist MPE Jan 13 th 2012
 ATHENA Mission Design and ESA Status David Lumb ESA Study Scientist MPE Jan 13 th 2012 Topics covered ESA L class mission reformulation Current status & programmatics Athena Mission Design Spacecraft Optics
XMM-Newton SOC Technical Note
 XMM-Newton SOC Technical Note XMM-SOC-CAL-TN-0082 Accuracy of energy reconstruction in EPIC-MOS Timing Mode M. Guainazzi April 6, 2009 History Version Date Editor Note 1.0 April 6, 2009 M.Guainazzi SASv8.0
XMM-Newton - Chandra Synergy: Maximizing their Future Science Impact over the Next Decade
 XMM-Newton - Chandra Synergy: Maximizing their Future Science Impact over the Next Decade Norbert Schartel XMM-Newton Project Scientist, ESA, ESAC, Spain 17.8.2016 Instruments Draft N. Schartel XMM-NEWTON
ROSAT Roentgen Satellite. Chandra X-ray Observatory
 ROSAT Roentgen Satellite Joint facility: US, Germany, UK Operated 1990 1999 All-sky survey + pointed observations Chandra X-ray Observatory US Mission Operating 1999 present Pointed observations How do
Recent Observations of Supernova Remnants
 1 Recent Observations of Supernova Remnants with VERITAS Tülün Ergin (U. of Massachusetts Amherst, MA) on behalf of the VERITAS Collaboration (http://veritas.sao.arizona.edu) 2 Contents Supernova Remnants
VISTA HEMISPHERE SURVEY DATA RELEASE 1
 Release date (will be set by ESO) VISTA HEMISPHERE SURVEY DATA RELEASE 1 PROPOSAL ESO No.: 179.A-2010 PRINCIPAL INVESTIGATOR: Richard McMahon Authors: R. McMahon, M. Banerji, N. Lodieu for the VHS Collaboration
Comets observed with XMM-Newton
 A major step in cometary X-ray research Konrad Dennerl Max-Planck-Institut für extraterrestrische Physik Comets the most surprising X-ray objects in space 1996: Comet Hyakutake (C/1996 B2) EPIC Consortium
High Redshift Universe
 High Redshift Universe Finding high z galaxies Lyman break galaxies (LBGs) Photometric redshifts Deep fields Starburst galaxies Extremely red objects (EROs) Sub-mm galaxies Lyman α systems Finding high
Data Processing in DES
 Data Processing in DES Brian Yanny Oct 28, 2016 http://data.darkenergysurvey.org/fnalmisc/talk/detrend.p Basic Signal-to-Noise calculation in astronomy: Assuming a perfect atmosphere (fixed PSF of p arcsec
XMM-Newton Observations of Unidentified Gamma-Ray Objects
 XMM-Newton Observations of Unidentified Gamma-Ray Objects - New Results in X-ray Astronomy, MSSL, 11th July 2006 - R. Mignani (UCL-MSSL) N. La Palombara, P.A. Caraveo (IASF) E. Hatziminaouglou, M. Schirmer
Scientific cases for Simbol-X of interest of the Italian community
 Scientific cases for Simbol-X of interest of the Italian community Based on the High Energy Astrophysics study: Fields of interest and perspective for the national community ASI 2003-2004 Fabrizio Fiore
LAT Automated Science Processing for Gamma-Ray Bursts
 SLAC-PUB-12715 LAT Automated Science Processing for Gamma-Ray Bursts James Chiang GLAST Science Support Center SLAC, 2575 Sand Hill Rd, Menlo Park CA 9425 Abstract. The LAT Instrument Science Operations
MEMORANDUM. Focal-Point: Point on the focal plane where the sharpest PSF is located.
 CHANDRA X-ray Center 60 Garden St., Cambridge Massachusetts 02138 USA MEMORANDUM Date: November 1, 2014 From: Ping Zhao To: CXC Subject: Chandra Optical Axis, Aimpoint and Their Drifts File: oxap memo.tex
GOODS/FORS2 Final Data Release: Version 3.0
 ESO Phase 3 Data Release Description Data Collection GOODS_FORS2 Release Number 1 Data Provider C. Cesarsky Date 30.10.2007 update 11.07.2014 GOODS/FORS2 Final Data Release: Version 3.0 As part of the
Lab 4 Radial Velocity Determination of Membership in Open Clusters
 Lab 4 Radial Velocity Determination of Membership in Open Clusters Sean Lockwood 1, Dipesh Bhattarai 2, Neil Lender 3 December 2, 2007 Abstract We used the Doppler velocity of 29 stars in the open clusters
X- & γ-ray Instrumentation
 X- & γ-ray Instrumentation Used nuclear physics detectors Proportional Counters Scintillators The Dark Ages Simple collimators HEAO A1 & A2: 2 x 8 degree field of view Confusion limit is about 200 sources
1 About EDSER. 2 Processing. MEMORANDUM September 21, To: From: Subject: File
 MIT Kavli Institute Chandra X-Ray Center MEMORANDUM September 21, 21 To: From: Subject: File Revision: 1. URL: File: David P. Huenemoerder, SDS Notes on sub- event algorithm effect for Chandra grating
Chandra was launched aboard Space Shuttle Columbia on July 23, 1999!!!
 Chandra was launched aboard Space Shuttle Columbia on July 23, 1999!!! Crew Lost During Re-Entry Modern X-ray Telescopes and Detectors X-ray Telescopes X-ray Instruments Some early highlights Observations
Ivan Valtchanov Herschel Science Centre European Space Astronomy Centre (ESAC) ESA. ESAC,20-21 Sep 2007 Ivan Valtchanov, Herschel Science Centre
 ESA. ESAC,20-21 Sep 2007 Ivan Valtchanov, Herschel Science Centre") SPIRE Observing Strategies Ivan Valtchanov Herschel Science Centre European Space Astronomy Centre (ESAC) ESA Outline SPIRE quick overview Observing with SPIRE Astronomical Observation Templates (AOT)
SPIRE Observing Strategies Ivan Valtchanov Herschel Science Centre European Space Astronomy Centre (ESAC) ESA Outline SPIRE quick overview Observing with SPIRE Astronomical Observation Templates (AOT)