OXYGEN AND NEON ABUNDANCES OF PLANETARY NEBULAE IN THE ELLIPTICAL GALAXY NGC
|
|
|
- Jacob Clarke
- 5 years ago
- Views:
Transcription
1 The Astrophysical Journal, 627: , 2005 July 10 # The American Astronomical Society. All rights reserved. Printed in U.S.A. OXYGEN AND NEON ABUNDANCES OF PLANETARY NEBULAE IN THE ELLIPTICAL GALAXY NGC R. H. Méndez, 2 D. Thomas, 3 R. P. Saglia, 4 C. Maraston, 3 R. P. Kudritzki, 2 and R. Bender 4,5 Received 2005 February 10; accepted 2005 March 27 ABSTRACT This paper presents deep spectra of 14 planetary nebulae (PNs) at a variety of angular distances from the center of the flattened elliptical galaxy NGC 4697, which is located at 11 Mpc from us. Both near the center and among the most outlying PNs, we have found several examples of very strong [O iii] k5007, about 20 times brighter than H. This, together with strong [Ne iii] lines, implies a lower limit for O and Ne abundances near solar at the center and also at more than 2 effective radii from the center of NGC Thus we have found, for the first time from individual stars, direct evidence of the existence of a metal-rich population in elliptical galaxies, confirming metallicities derived from absorption-line indices and extending the information to angular distances where the stellar surface brightness is too low for absorption-line studies. A comparison with abundances obtained closer to the center of NGC 4697 from integrated absorption-line spectra indicates that the metallicity gradient, which is quite steep within 1 effective radius, becomes much less pronounced beyond 1 effective radius. The only alternative to this interpretation would be the presence of a very metal-poor PN population with ½Z/HŠ below 1, which we cannot rule out, but it would require an extremely bimodal metallicity distribution with almost no intermediate metallicities. Subject headinggs: galaxies: abundances galaxies: elliptical and lenticular, cd galaxies: individual (NGC 4697) planetary nebulae: general 1. INTRODUCTION How and when elliptical galaxies formed are matters of intense contemporary discussion. The dominant idea is the hierarchical merging of small galaxies into larger ones, frequently pictured as a long process extending down to small redshifts (White & Rees 1978). In this context, metallicity gradients in elliptical galaxies are important diagnostics. A monolithic dissipative collapse produces steep gradients (Carlberg 1984), and mergers dilute them (White 1980). Observations show that metallicity gradients are present in early-type galaxies (Davies et al. 1993; Carollo & Danziger 1994; Fisher et al. 1995; Saglia et al. 2000; Mehlert et al. 2003; Wu et al. 2005), but they appear somewhat flatter than predicted by the pure dissipational collapse (Carlberg 1984), which suggests that both dissipative processes and mergers play a role. Kobayashi (2004) gives a recent review on the subject, concluding that the observed variety of metallicity gradients requires different individual merging histories, with steeper gradients for galaxies that have not undergone major mergers. 1 Part of the data presented herein were obtained at the European Southern Observatory, Chile, Program ESO 69.B Part of the data presented herein were obtained at the W. M. Keck Observatory, which is operated as a scientific partnership among the California Institute of Technology, the University of California, and the National Aeronautics and Space Administration. The Observatory was made possible by the generous financial support of the W. M. Keck Foundation. 2 Institute for Astronomy, University of Hawaii, 2680 Woodlawn Drive, Honolulu, HI 96822; mendez@ifa.hawaii.edu. 3 Max-Planck-Institut für extraterrestrische Physik, Giessenbachstrae, D Garching, Germany; current address: University of Oxford, Denys Wilkinson Building, Keble Road, Oxford OX1 3RH, UK. 4 Max-Planck-Institut für extraterrestrische Physik, Giessenbachstrae, D Garching, Germany. 5 Universitäts-Sternwarte München, Scheinerstrae 1, D München, Germany. 767 Simulations of monolithic collapse models taking into account different escape velocities at different galactocentric radii produce results that are consistent with observed absorptionline index gradients inside 1 effective radius ( Martinelli et al. 1998; Angeletti & Giannone 2003). But they predict a significant steepening beyond that limit, which still needs to be checked observationally. On the other hand, how reliable are the observed metallicity gradients? They are based on colors and absorption-line strengths ( Mg, Fe, and H) measured on long-slit, integrated-light spectra of the galaxies. Their interpretation in terms of metallicity is affected by the well-known age-metallicity degeneracy. The introduction of Balmer lines to break the degeneracy does not necessarily solve the problem, because strong Balmer lines can be produced not only by young stars but also by blue horizontalbranch stars (de Freitas Pacheco & Barbuy 1995; Maraston & Thomas 2000; Lee et al. 2000). There is also the complication introduced by possible variations in the / Fe abundance ratio, which may affect the derived gradients (Trager et al. 2000a; Proctor & Sansom 2002; Thomas et al. 2003, hereafter TMB03). All these obstacles introduce uncertainties in the derived ages, metallicities, and metallicity gradients. It would be desirable to determine metallicities of individual stars in elliptical galaxies. Single stars, however, are too faint and cannot be resolved with current technology, with the exception of stars in the nearby NGC 5128 (e.g., Harris & Harris 2002). Planetary nebulae (PNs) in elliptical galaxies offer a possible way to obtain alternative information: we can detect them individually because of their characteristic emission-line spectra. By measuring the fluxes of adequate diagnostic emission lines, it should be possible to derive at least O and Ne abundances of PNs at different projected radii in order to directly study the metallicity gradient. In this way we would be able to circumvent the problem of the age-metallicity degeneracy. Forestini & Charbonnel (1997) explain that no significant change in surface
2 768 MÉNDEZ ET AL. O and Ne abundances is expected from asymptotic giant branch nucleosynthesis. An additional important advantage of measuring PN element abundances is the ability to cover a considerably larger range in projected radii. Because of the dramatic drop in surface brightness with increasing radius, the derivation of metallicities from the diffuse light extends to at most 1.5 effective radii, r eff, whereas PNs can be easily detected out to 3 4 r eff. There is one problem, however: the best diagnostic lines, such as [O iii] k4363 or [S ii] kk6717, 6731, are very faint. One pioneering attempt to study a few PNs in NGC 5128 with the European Southern Observatory (ESO) 3.6 m telescope was not fully successful, in the sense that no accurate estimates of electron temperatures and electron densities could be obtained (Walsh et al. 1999). In addition, the fact that NGC 5128 has suffered a recent merger with a low-metallicity galaxy complicated the interpretation of the few PN abundance estimates obtained by those authors. This kind of project clearly requires the light-collecting power of (at least) 8 10 m telescopes. Having decided to explore the PN approach to abundances in ellipticals, we chose to avoid the very tempting NGC 5128 and selected instead NGC 4697, a flattened elliptical at a distance of about 11 Mpc. Closer to us than the Virgo or Fornax ellipticals, with M B ¼ 20:1, NGC 4697 is of intermediate size and luminosity. It belongs to a loose group of 18 galaxies (García 1993). It shows a relaxed structure but has a small dust ring near the core that may be evidence of a past merger ( Pinkney et al. 2003). Earlier metallicity determinations ( Kobayashi & Arimoto 1999; Trager et al. 2000b; Thomas et al. 2005) indicate a central [Z/H] slightly above solar, and a relatively steep negative gradient. Our choice of NGC 4697 was strongly influenced by the fact that we had already found more than 500 PNs in this galaxy (Méndez et al. 2001). Knowing the fluxes of the brightest PNs in [O iii] k5007, we could estimate that we had a realistic chance of detecting [O iii] k4363, which is a factor of 100 weaker than k5007 for PN electron temperatures of about 12,000 K. This paper is organized in the following way: in x 2 we present new observations of absorption-line strengths from long-slit spectra of NGC 4697, analyzed with modern techniques to try to refine our knowledge of the metallicity gradient determined in the classical way. Then we introduce the PN observations. Section 3 describes the PN selection in NGC 4697 from our previous work, and the Very Large Telescope (VLT) Focal Reducer/ Low Dispersion Spectrograph ( FORS) observations and reductions of PN spectra. Section 4 describes in a similar way the complementary Keck I Low Resolution Imaging Spectrometer (LRIS-B) spectra of the same PNs. Section 5 describes the resulting line intensities, and x 6 explains the analysis technique. It turns out that we could not detect [O iii] k4363 in the individual PN spectra, but somewhat accidentally we can infer interesting limits on the O and Ne abundances in PNs at different angular distances from the center of NGC Section 7 presents a discussion of the results and what constraints can be derived from them. Section 8 provides a summary of the conclusions and some perspectives for future work. 2. ABSORPTION-LINE STUDIES: LONG-SLIT SPECTROSCOPY 2.1. Observations We obtained long-slit spectroscopy along the major and minor axes of NGC 4697 using the second Focal Reducer/Low Dispersion Spectrograph ( FORS2) at the Cassegrain focus of unit telescope 2 (UT2) of the ESO VLT, Cerro Paranal, Chile, on the nights of 2001 February 27/28 and February 28/March 1, under cloudy sky conditions, with B5 seeing. FORS2 with the standard collimator gives a field of 6A8 ; 6A8 on a 2080 ; 2048 CCD (pixel size 24 ; 24 m). The image scale is 0B2 pix 1. The observing mode was long-slit spectroscopy using grism 1400V+18. This grism gives a spectral resolution of 2.5 8, equivalent to instr ¼ 63 km s 1, for slits 1 00 wide (see the FORS User s Manual, ver. 2.0). The spectral coverage was from 4770 to We integrated a total of 7228 s along the major axis and 3600 s along the minor axis of NGC In addition, we acquired spectra of the star HR 3428 at several positions along the slit, to be used as kinematic templates. The data reduction was made using MIDAS and followed the usual steps: after bias subtraction and flat-fielding with dome flats, cosmic rays were eliminated using median filtering. The wavelength calibration was based on HeArHgCd lamps and gave rms residuals. After rebinning on a natural logarithmic wavelength scale, the sky measured at the ends of the slit was subtracted, and the galaxy spectra were rebinned along the spatial direction to obtain nearly constant signal-to-noise ratio with radius. We postpone a discussion of the kinematics to a future paper, where we plan to combine the long-slit spectral information with the PN kinematics Absorption-Line Indices We have measured the Lick absorption-line indices H,Mgb, Fe5270, and Fe5335, following the definitions of Worthey et al. (1994). The spectra have been smoothed to Lick spectral resolution (8 8 FWHM). Corrections for the velocity-dispersion broadening have been applied, as described in Mehlert et al Errors were derived from Monte Carlo simulations, taking into account the Poisson noise and the errors in the kinematics. Within the central aperture of 1/8 of the effective radius, our measurements agree very well with the measurements of González (1993). Our measurements and derived quantities are listed in Tables 1 and 2 (major and minor axes, respectively). Figure 1 shows the strengths of the line indices Mg b, hfei ¼ 0:5( Fe5270 þ Fe5335), and H, as a function of distance from the center of NGC 4697, along the major and minor axes. We detect weak [O iii] emission at several radii (particularly at R þ15 00 to along the major axis, where H 1:5 8), but we do not attempt any correction. In the central region, where a kinematically distinct disk is dominant, there is a sharp decrease of H together with a sharp increase of Mg b and hfei. Figure 2 shows the absorption-line index measurements in a different way. We introduce ½MgFeŠ 0 ¼½Mg b(0:72 ; Fe5270 þ 0:28 ; Fe5335)Š 1/2. The index [MgFe] 0, a slight modification of [MgFe] defined by González (1993), is a good tracer of total metallicity (still degenerate with age, of course), as it is almost completely independent of / Fe ratio variations ( TMB03). We have plotted [MgFe] 0 versus H (left), and Mg b versus hfei (right). Overplotted are the stellar population models of TMB03 for various ages, metallicities, and / Fe ratios, as indicated by the labels in the diagrams. Also, since H is almost insensitive to /Fe (TMB03), the left panel of Figure 2 is well suited to reading off ages and total metallicities independent of abundance ratio effects. The right panel of Figure 2 provides rough estimates for the / Fe ratios. The different symbols in Figure 2 correspond to quantities along the major and minor axes. The position of the galaxy s center is indicated by the arrow. Measurement errors do not exceed the symbol sizes. The [MgFe] 0 -H plot shows that the average (V-luminosity weighted) ages of the stellar populations in NGC 4697 scatter about 10 Gyr with no significant
3 TABLE 1 Integrated Stellar Populations in NGC 4697 (Major Axis) Radius (arcsec) (1) H (2) d H (3) Mg b (4) d Mg b (5) hfei (6) dhfei (7) Age (Gyr) (8) dage (9) [Z/H] (10) d[z/h] (11) [/Fe] (12) d[/fe] (13) Note. The radii in column (1) are measured from the center of the galaxy and defined positive toward NE. Stellar population parameters (cols. [8], [10], and [12]) and their uncertainties (cols. [9], [11], and [13]) are derived from the absorption-line indices (cols. [2] [7]) using the stellar population models of TMB03.
4 TABLE 2 Integrated Stellar Populations in NGC 4697 ( Minor Axis) Radius (arcsec) (1) H (2) dh (3) Mg b (4) dmg b (5) hfei (6) dhfei (7) Age (Gyr) (8) dage (9) [Z/H] (10) d[z/h] (11) [/Fe] (12) d[/fe] (13) Note. The radii in column (1) are measured from the center of the galaxy and defined positive toward NW. Stellar population parameters (cols. [8], [10], and [12]) and their uncertainties (cols. [9], [11], and [13]) are derived from the absorption-line indices (cols. [2] [7]) using the stellar population models of TMB03. Fig. 1. Strengths of the line indices Mg b, hfei, andh, as a function of the distance in arcseconds from the center of the galaxy, along the major (left panels) and the minor (right panels) axes of NGC Filled circles are positive radii; the positive sense is defined toward NE along the major axis and toward NW along the minor axis.
5 O AND Ne ABUNDANCES IN NGC Fig. 2. Lick absorption-line indices [ MgFe] 0 vs. H (left), and Mg b vs. hfei ¼0:5(Fe5270 þ Fe5335) (right). Overplotted are the TMB03 stellar population models for various ages, metallicities, and /Fe ratios, as indicated by the labels in the diagrams. In the left panel, /Fe is solar, while in the right panel the age is fixed to 12 Gyr. Diamonds and squares are along the major and minor axes, respectively. dependence on galaxy radius, while metallicities clearly vary between about 2 and1/2 solar. The /Fe ratios are about 1.5 solar with a slight tendency to higher values in the outer parts of the galaxy. The two radial directions are consistent. The apparently older ages above 15 Gyr at large positive radii (diamonds) are most likely not real and are probably an artifact caused by emission-line filling of the H absorption line Stellar Population Parameters The explicit gradients are shown in Figure 3, in which the stellar population parameters age, total metallicity, and /Fe ratio are plotted as functions of galactic radius (see also Table 1). The former are derived from the indices of Figure 2 in a twofold iterative procedure. First, we arbitrarily fix the / Fe ratio and determine ages and metallicities for the index pairs (H, Mgb) and ( H, hfei) by starting with arbitrary age-metallicity pairs, which we modify iteratively until both index pairs are reproduced. The two metallicities obtained from Mg b and hfei, respectively, are used to adjust the /Fe ratio and to start a new iteration. These steps are repeated until the age-metallicity pairs derived from (H,Mgb) and (H, hfei) at a given /Fe ratio are consistent within 1% accuracy. For ages and metallicities between the grid points quoted above, we interpolate linearly. Figure 3 shows only a very small radial gradient in age, with ages around 9 Gyr in the center (in good agreement with Kobayashi & Arimoto 1999 and Trager et al. 2000a, 2000b) and 10 Gyr at larger radii. Also the /Fe ratio does not vary significantly with galactic radius; hence NGC 4697 appears globally /Fe-enhanced by about a factor of 1.6. This lack of significant gradients in both age and /Fe ratio agrees very well with a recent study by Mehlert et al. (2003), in which, on average, no age and no /Fe ratio gradients have been found for a sample of 35 early-type galaxies in the Coma Cluster. This lack of age gradients in early-type galaxies gets further support from Wu et al. (2005), who obtained the same result analyzing color gradients of 36 early-type galaxies drawn from the Sloan Digital Sky Survey. Fig. 3. Stellar population parameters derived from Fig. 2 as functions of galactic radius. The effective radius is at Diamonds and plus signs are positive and negative radial directions, respectively, along the major axis.
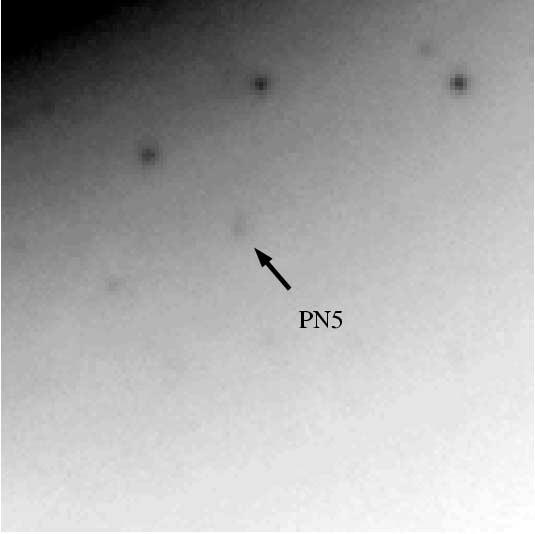
6 772 MÉNDEZ ET AL. Vol. 627 More interesting for the aim of this paper is the metallicity gradient. We obtain central metallicities of about 1.5 solar (½Z/HŠ0:2) at log r 0:5 and a relatively steep gradient. As a consequence, the average metallicity of the stellar light in NGC 4697 around the effective radius (log r 1:5) at about distance from the center is about 2/3 solar (½Z/HŠ 0:2). Extrapolating the average gradient to 2.5 effective radii, we would predict ½Z/HŠ 0:5 or 0.6. But the data hint of a saturation at about 1 effective radius, and extrapolation to higher radii is certainly risky. We conclude that the average stellar metallicity beyond 1 effective radius, derived from the integrated absorption-line spectra, is at least a factor of 1.5 below solar. In the following sections we investigate to what extent these predictions are confirmed by the PN abundances. Object Name TABLE 3 Observed PNs in NGC 4697 R.A. (2000.0) Decl. (2000.0) AD a m(5007) 1... W W W W W W W W W W W W W W Note. Units of right ascension are hours, minutes, and seconds, and units of declination are degrees, arcminutes, and arcseconds. a AD is the angular distance from the center of light of NGC 4697, measured in arcseconds. Fig. 4. Positions of the 14 bright PNs relative to the core of NGC The area and orientation of this figure are as in Fig. 7 of Méndez et al. (2001). The ellipse is a schematic representation of NGC The origin of coordinates is located at the light center of the galaxy. The effective radius of NGC 4697 is VLT OBSERVATIONS AND REDUCTIONS OF PNs IN NGC 4697 Reliable PN abundance determinations require detection of rather weak diagnostic lines such as [O iii] k4363. In our attempt to detect such faint emission lines, we selected the brightest of the several hundred PNs in NGC 4697 (Méndez et al. 2001) that could be found at different angular distances from the core of the galaxy along a narrow band in the sky, so as to ensure adequate spectral coverage for all the targets in multislit spectroscopy. Table 3 provides the coordinates of the 14 selected bright PNs; the angular distance of each PN from the core of the galaxy, as defined by the center of light; and the [O iii] k5007 fluxes expressed in magnitudes m(5007), as measured by Méndez et al. (2001). Finding charts for the 14 PNs are given in the Appendix. Figure 4 shows schematically the positions of the 14 PNs relative to the core of NGC The size and orientation of Figure 4 imitate Figure 7 in Méndez et al. (2001). The effective radius r eff of NGC 4697 is (Binney et al. 1990). The VLT observations were made with the first Focal Reducer/ Low Dispersion Spectrograph ( FORS1) at the Cassegrain focus of unit telescope 3 (Melipal) of the ESO VLT, Cerro Paranal, Chile, on the nights of 2002 April 15/16, 16/17, and 17/18. FORS1, with the standard collimator, gives a field of 6A8 ; 6A8 on a 2080 ; 2048 CCD (pixel size 24 ; 24 m). The image scale is 0B2 pixel 1. The observing mode was multiobject spectroscopy (MOS) using grism 300V and filter gg375. This grism gives a spectral resolution of about 10 8 at , for slits 1 00 wide. The slit positions for the selected PNs were determined from direct inspection of the discovery image, a combination of narrow-band exposures taken with FORS1. This spectrograph allows defining of 19 slits per exposure; 14 slits were given to our PN targets, and the rest were assigned to faint foreground stars in order to check the slit positioning (which was done by taking short exposures without grism through the slits) and to help locate the dispersion lines as a function of position across the field (which is important in the case of spectra consisting of isolated emission lines). All three nights were of photometric quality, with seeing of about 1B1 on the first night, and 0B6 and0b8 on the second and third. We were able to complete 23 MOS exposures, each with an exposure time of 3000 s, all of them at air masses smaller than 1.6. Two additional exposures during the third night were stopped at exposure times of about 1500 s (tracking problems) and 1800 s (near the end of the night, because the air mass was becoming >2). We also took many spectra of the spectrophotometric standard stars LTT 3218, LTT 7379, CD (Hamuy et al. 1992), with typical exposure times between 10 and 30 s. Note that this spectrograph is used in combination with an atmospheric dispersion compensator in front of the Cassegrain focus. The reductions were made using Image Reduction and Analysis Facility (IRAF) 6 standard tasks. After bias subtraction we carefully built a normalized flat field ( IRAF tasks response and illum applied separately to each of the 19 individual slits), where all pixels without a useful lamp signal were set equal to 1. All the science exposures were divided by this normalized flat field. 6 IRAF is distributed by the National Optical Astronomy Observatories, which are operated by the Association of Universities for Research in Astronomy, Inc., under cooperative agreement with the National Science Foundation.
7 No. 2, 2005 O AND Ne ABUNDANCES IN NGC Given the mechanical stability of FORS1 we decided to register (IRAF task imshift) the science exposures, using the strong [O iii] kk4959, 5007 emissions, visible in all individual exposures, as our reference points. The images were then combined, assigning weights proportional to the strength of [O iii] k5007. The image combination helped to eliminate cosmic-ray events, and the increased signal allowed an easier control of the spectrum extractions. In spectroscopy of extremely faint emission-line objects the most delicate step is the background modeling and subtraction, especially in our case, because the galaxy stellar light contributes a nonuniform background. Fortunately NGC 4697 shows a rather smooth surface brightness distribution, which makes background modeling easier. The only complication was the occasional foreground star falling partly or completely on the slit. Even in such cases the rather long slits provided by FORS1 (20 00 ) made it possible to model the continuum and subtract it using the IRAF task apall. In some particularly difficult cases, close to the galaxy core, we tried to use the long-slit task background for an alternative background subtraction, but the results were not significantly different from what is produced by apall. The wavelength calibration was done using He-Ar-Hg comparison spectra. Standard-star spectra were used for the flux calibration. Since we had combined all the science exposures, we used the following procedure: first, we took an individual MOS science exposure, taken in very good seeing at the same air mass as a standard spectrum, and compared the flux of the standard star with the flux of the control stars in some of the 19 FORS1 slits, used to check the slit positioning. This flux calibration, being performed at the same air mass, needs no atmospheric extinction correction. Second, we compared the flux of the control stars in the individual science exposure with the corresponding flux in the combined science exposure; this comparison provides a correction factor as a function of wavelength, which takes care of atmospheric extinction and also possible wavelength-dependent slit losses. The correction factors derived from control stars in different slits across the CCD (specifically slits 5, 14, and 16) were similar, and therefore we averaged them, to obtain a final correction factor, which we applied to all the PN slits. Having obtained the flux-calibrated spectra, the emission lines were shifted to the rest wavelengths, and the final fluxes in ergs cm 2 s 1 were obtained by integrating the emission lines over wavelength. Initial inspection of the final reduced spectra showed many PNs with [O iii] k5007 almost 20 times as strong as H.Thisis rather unusual in nearby galaxies with lower-than-solar metallicities like the Large Magellanic Cloud (LMC) and Small Magellanic Cloud (SMC); see, e.g., the histogram in Figure 3 of Méndez & Soffner (1997). The only similar case with high frequency of very strong k5007 appears to be the sample observed by Richer et al. (1999) in the metal-rich bulge of M31. We did not get any convincing detection of [O iii] k4363 on individual spectra. The UV response of FORS1 was not enough for reliable measurements of [Ne iii] kk3868, And of course we could not detect [O ii] k3727. For all these reasons, we judged it convenient to complement the FORS1 spectra with spectra taken with the new blue camera of LRIS. These spectra are described in x KECK OBSERVATIONS AND REDUCTIONS OF PNs IN NGC 4697 Knowing the coordinates of the PNs, we used the software AUTOSLIT3 to produce files for the LRIS slit mask mill machine and the slit mask alignment program. The slit mask allowed us to reobserve the same PNs observed with FORS1. Some slits were assigned to control stars, like we did with FORS1. The Keck I LRIS-B observations were made on the night of 2003 April 2/3. LRIS-B gives an 8 0 field on a mosaic of two 2k ; 4k CCDs (pixel size 15 ; 15 m). The image scale is 0B135 pixel 1. The observing mode was MOS using dichroic filter D680 and grism 400/3400. This grism gives a spectral resolution of about 2 8 at , for slits 1 00 wide. The night was clear and of photometric quality, with seeing from 1 00 to 0B8.Wecompleted11MOSexposures,eachwithan exposure time of 1800 s, all of them at air masses smaller than 1.6 except the last one, with an air mass near 2. We also took spectra of the spectrophotometric standard star G (Oke 1990), with exposure times of 150 and 300 s. The LRIS-B spectrograph does not have an atmospheric dispersion compensator. In this case we took the standard-star spectra through the same mask used for the PN spectra and at a low air mass. By comparing to a science exposure also taken at a similarly low air mass, the effect of atmospheric dispersion is minimized. Other science exposures, taken mostly at higher air masses, were corrected using the control stars, as described in the previous section. The spectra were reduced in a way similar to that already described for FORS1. The only difference is that we made individual extractions for each exposure. We did this extra work because LRIS suffers mechanical deformations that result in image shifts of several pixels as the telescope moves away from the meridian; there was no easy way of registering the science exposures for combination. This also forced us to spend some time carefully eliminating cosmic-ray events from the individual frames. After extraction, wavelength calibration, extinction correction, flux calibration, and reduction to rest wavelengths, all spectra for each slit were combined, assigning weights proportional to the strength of [O iii] k5007. The final fluxes in ergs cm 2 s 1 were obtained by integrating the emission lines over wavelength. For comparison with the FORS1 spectra, the higher resolution LRIS-B spectra were smoothed with a boxcar ¼ RESULTS It was reassuring to find that, for each PN, the FORS1 and LRIS-B spectra are in good agreement in the wavelength range where they can be compared. The visible emission lines in that range are H,[Oiii] kk4959, 5007, and H. Figures 5 7 show the comparison of FORS1 versus LRIS-B spectra. PN 1 was not seen by FORS1; it fell outside the end of the first slit. Some LRIS-B spectra did not reach H because of the PN positions in the field (our fault). The LRIS-B spectra confirm that many PNs in our sample have very strong k5007/h ratios and provide clear detection of [Ne iii] in most PNs, as shown in Figure 8; [O ii] k3727 is not visible, except very probably in PN 5. Tables 4 and 5 show the measured relative intensities, in the scale H ¼ 1, calculated in the following way: first calculate the intensity relative to k5007, which is the strongest and most reliable line; then average if two measurements are available; then multiply by the ratio k5007/h. No correction for reddening has been applied. We consider first the ratio H/H. In most cases it is consistent with zero or small reddening. The foreground reddening produced by our Galaxy is E(B V ) ¼ 0:03 (see Méndez et al. 2001), and NGC 4697 shows no evidence of interstellar reddening, except for the dust disk very close to the center. This leads us to expect a H intensity of about 0.47, marginally detectable in individual PN spectra. In order to improve the signal
8 774 MÉNDEZ ET AL. Vol. 627 Fig. 5. Comparison of individual PN spectra taken with FORS1 (solid lines) and LRIS-B (dotted lines). The PNs are designated with the numbers shown in Fig. 4. The fluxes are expressed in units of ergs cm 2 s The levels of zero intensity are separated by 10 flux units for easier comparison. The higher-resolution LRIS-B spectra have been smoothed with a boxcar ¼ 7. PN 1 could not be observed with FORS1. we averaged all the PN spectra taken with both spectrographs from 4200 to Figure 9 shows the resulting composite spectrum, where H is indeed visible with the expected intensity. Also, at the limit of detection lies a weak [O iii] k4363. If we take its intensity as an upper limit for k4363, its relation to k4959 and k5007 permits us to establish an upper limit for the nebular electron temperature. We measure a ratio (k4959 þ k5007)/k4363 of the order of 120; from the Osterbrock (1989) textbook we obtain T e ¼ 12;000 K. We cannot apply this result to any individual nebula, but we can argue that no PN in our sample has a very high T e, because k4363 is not visible in any individual spectrum, and that for any PN with T e slightly higher than 12,000 K there must be a few with fainter k4363 and therefore with T e lower than 12,000 K. In Figure 9 we also measure the average ratio k5007/h, which turns out to be 16. This is a very large value, if we compare with what is observed throughout the Local Group. The only case we know with a similarly high average ratio is the M31 bulge sample of Richer et al. (1999). Let us discuss our result more carefully. Is it possible that we are being misled by a faint H absorption component in the background light, which would induce a fainter H emission? We do not think so, for two reasons: first, the effect would be even stronger for H, although we admit that one could imagine high internal reddening in some PNs. But second, and most important, many PNs with very strong k5007 are in the outskirts of the galaxy, where there is no significant background. In fact Tables 4 and 5 show that the strong k5007 is more frequent outside than inside, Fig. 6. Comparison of individual PN spectra taken with FORS1 (solid lines) and LRIS-B (dotted lines). The PNs are designated with the numbers shown in Fig. 4. The fluxes are expressed in units of ergs cm 2 s The levels of zero intensity are separated by 10 flux units for easier comparison. The higher-resolution LRIS-B spectra have been smoothed with a boxcar ¼ 7. which is contrary to what we would expect if such a background contamination were playing a role. Note also that the largest source of uncertainty in our measurements is the determination of the zero intensity level. Given the increase in signal-to-noise ratio provided by the addition of all the spectra, to find such a large average ratio of k5007/h confirms that for some PNs the individual ratio must be larger than the average, because we see in Tables 4 and 5 some cases of ratios below the average (those are easier to believe because H is stronger and therefore more reliably measured). For all these reasons we believe the existence of these high ratios of k5007/h is well established, and we must try to explain it. Figure 10 shows the average of all the LRIS-B spectra between 3700 and It shows prominently [Ne iii] kk 3868, 3967, with the expected relative intensities, as well as a weak H, also with the expected intensity. But [O ii] k3727 is not clearly present. In fact most of the signal at k3727 is provided by only one of our sources, namely PN 5 (see Fig. 8). Note in Table 4 that PN 5 has the lowest intensity of k5007, which makes sense; a stronger k3727 and weaker k5007 clearly indicate a lower excitation class. 6. ANALYSIS Since we cannot detect [O iii] k4363 in the individual spectra, and we also lack electron density diagnostics, we cannot make nebular abundance determinations in the normal way. However, we have found many examples of very high ratios k5007/h, and we will derive lower limits for the abundances of those PNs. That this is possible can be seen, e.g., in Figure 3 of Dopita et al.
9 No. 2, 2005 O AND Ne ABUNDANCES IN NGC Fig. 7. Comparison of individual PN spectra taken with FORS1 (solid lines) and LRIS-B (dotted lines). The PNs are designated with the numbers shown in Fig. 4. The fluxes are expressed in units of ergs cm 2 s The levels of zero intensity are separated by 5 flux units for easier comparison. The higher-resolution LRIS-B spectra have been smoothed with a boxcar ¼ 7. The feature longward of H k6563 is not [ N ii] k6584; it is due to residual sky emission. The sky emissions are blueshifted because the PN emission lines have been shifted to their rest values. (1992), which shows the ratio k5007/h as a function of abundance and stellar effective temperature. Any PN with k5007/ H > 18 must have a metallicity near solar. We can illustrate this conclusion in more detail using the CLOUDY code (Ferland et al. 1998). The use of CLOUDY for PN abundance determinations has been very well described by Jacoby & Ciardullo (1999). Here we simply outline the essential steps in our procedure. In Figure 11 we show our own version of Dopita et al. s Figure 3. From our Figure 11, built using CLOUDY, it is obvious that given low k5007 intensities we cannot say much about the O abundance. We will start our analysis with the very strong k5007 PNs in our sample, namely PNs 1, 3, 7, 9, 10, 11, 13, and 14. In our spectra we can set upper limits on the intensities of several important lines relative to H:[Oii] k3727 < 0:4; [O iii] k4363 < 0:3; He ii k4686 < 0:2. These upper limits for faint lines are based on the detectability of stronger lines such as H and [Ne iii] k3967. For example, H k4340 is barely seen in most PN spectra, at an average intensity of 0.47, while k4363 is not seen in any of them. The average intensity of k4363onthe composite PN spectrum (Fig. 9) is at most Therefore we estimate that the upper limit for k4363 cannot be higher than 0.3. In a similar way, we estimate upper limits for kk4686, 3727 (using in this last case the detectability of [Ne iii] k3967 in most PN spectra at 0.6, always relative to H). Our purpose is to obtain a lower limit to the O and Ne abundances by adjusting several nebular and stellar parameters Fig. 8. Individual LRIS-B PN spectra from 3700 to The fluxes are expressed in units of ergs cm 2 s The levels of zero intensity are separated by 5 flux units for easier comparison. The visible features are [ Ne iii] k3868 and (marginally) [ Ne iii] k3967. PN 5 may show some [O ii] k3727. (nebular density and radius, stellar luminosity and temperature) until we obtain a CLOUDY run whose line intensities reproduce the observed O and Ne lines and do not violate any of the intensity limits we have determined for the weaker lines. After a few dozen CLOUDY runs we converged on the following solution: a small nebular radius, pc, and high electron density, 4 ; 10 4 cm 3,bothneededtokeepk3727 at low intensity; a central star luminosity of at least 7000 L (it will be higher if the nebula leaks some H-ionizing photons), required to reproduce the nebular H luminosity, ergs s 1, which we know from the distance to NGC 4697 and the k5007 flux (Méndez et al. 2001) plus the k5007/h ratio measured in our spectra; and a stellar temperature not higher than 10 5 K, in order to keep He ii k4686 at low intensity. With these parameters, and assuming that these PNs have typical dust grain contents, CLOUDY confirms that in order to produce k5007 and k3868 intensities of 19 and 1.9, respectively, we need O and Ne abundances of 8.60 and 7.88, in the usual logarithmic scale where H ¼ 12. Lowering the central star temperature or the nebular density (if we allow for a TABLE 4 Observed Relative Intensities Line PN 1 PN 2 PN 3 PN 4 PN 5 PN 6 PN 7 [Ne iii] k H k [O iii] k [O iii] k H k
10 776 MÉNDEZ ET AL. Vol. 627 TABLE 5 Observed Relative Intensities Line PN 8 PN 9 PN 10 PN 11 PN 12 PN 13 PN 14 [Ne iii] k H k [O iii] k [O iii] k H k stronger k3727) would require an increase in the abundances. A hotter star, apart from producing a too strong k4686, would also require higher abundances. Therefore we are confident that the O and Ne abundances we derived are lower limits. We show this in Table 6, where we list a selection of CLOUDY runs illustrating the effects of departing from the chosen values of central star surface temperature, nebular density, and nebular radius (the last two parameters have no significant influence on the abundances). The objects PN 1 and PN 3 have a k5007/h ratio of 22. In this case the lower limit to the O abundance is Now we consider O abundances in PNs 2, 4, 5, 6, 8, and 12. A weak k5007 is not inconsistent with metallicities higher than solar (see, e.g., our Fig. 11, or Fig. 3 in Dopita et al. 1992). Therefore we cannot set any upper limit. On the other hand, we know that none of these PNs has a very high T e, because we could not detect [O iii] k4363 in individual spectra. This rules out very low O abundances, but we cannot exclude values around 8.2. So we set that number as a lower limit for the six PNs with weaker k5007. These six PNs will not provide stronger constraints until we can detect, in their individual spectra, the diagnostic lines required for accurate abundance determinations. 7. INTERPRETATION OF THE O AND Ne ABUNDANCES FROM PNs 7.1. Comparison with the Absorption-Line Data Figure 12 shows the abundance limits derived from the PNs together with the absorption-line information presented previously in Figure 3. The absorption-line abundance gradient is derived in total metallicity, which is dominated by the elements. More specifically, the contribution of iron-peak elements to the total metallicity is about 10% 15%, while -elements, including oxygen, Fig. 10. Average of all LRIS-B spectra of the 14 PNs in NGC Visible features are [Ne iii] kk3868, 3967, and H k4101. contribute more than 70%. In our modeling, ½Z/HŠ is a welldefined quantity and it means real total metallicity, i.e., all elements heavier than helium. Please refer to TMB03 for more details. Therefore our nebular O/H should be compared to the ½Z/HŠ in Figure 3. In addition, we need to specify what the solar abundance of oxygen is. From Lodders (2003) we adopt a solar O abundance 8.7 (logarithmic, in the scale where H ¼ 12). Then, for example, our O abundance 8.6 becomes ½Z/HŠ¼ 0:1. In Figure 12 we find that at least PNs 1, 3, 7, 9, 10, 11, 13, and 14 have higher metallicities than expected from the integrated absorption-line spectra. This is direct evidence of a metal-rich population, both within and beyond 1 effective radius from the center of NGC Then we have the six PNs with very low lower limits. If their real abundances were all close to the lower limits, then the distribution would be markedly bimodal. We find this implausible, and we rather expect most of their abundances to lie much closer to the upper PN group in Figure 12 (which are, please note, also lower limits), perhaps producing an average abundance not very different from what the absorption-line data indicate for log r ¼ 1:5. This would require the rather steep Fig. 9. Average of all spectra of the 14 PNs in NGC Visible features are H k4340, [O iii] k4363, possibly a very weak He ii k4686, H k4861, and [O iii] kk4959, Fig. 11. Our imitation of Dopita et al. s (1992) Fig. 3 (see text). Our grid was calculated using CLOUDY. The contours give the k5007/h ratio as a function of stellar effective temperature (we assume blackbody energy distributions) and oxygen abundance ( logarithmic, in the scale where H ¼ 12).
11 No. 2, 2005 O AND Ne ABUNDANCES IN NGC TABLE 6 Illustrative CLOUDY Runs log L (1) H DEN (2) logt (3) log R in (4) C (5) N (6) O (7) Ne (8) k5007 (9) k3868 (10) L(H ) (11) Note. The columns give the following quantities: (1) log L of central star in ergs s 1 ; (2) log nebular H density in cm 3 ; (3) log of the central star (blackbody) surface temperature; (4) log of inner nebular radius in cm; (5) (8) C, N, O, and Ne nebular abundances by number in the usual logarithmic scale with H ¼ 12; and (11) the log of the H nebular luminosity, in ergs s 1. metallicity gradient near the core of NGC 4697 to become much less pronounced beyond 1 effective radius. However, before declaring the PNs to be representative of the stellar population, we need to discuss whether the rather high average PN metallicities can be attributed to a selection effect On Selection Effects and Metallicity Distributions Concerning PNs there is an obvious selection effect: we have restricted our sample to objects populating the high-luminosity end of the PN k5007 luminosity function. Are their O abundances higher than those of fainter PNs? This has been discussed, e.g., by Richer (1993), Stasinska et al. (1998), Jacoby & Ciardullo (1999), and Magrini et al. (2004). In theory we expect high O abundance to produce a stronger k5007 emission line. On the other hand, more metallicity could imply more asymptotic giant branch (AGB) mass loss (e.g., Greggio & Renzini 1990) and a lower central star luminosity, which would then cancel the O abundance effect mentioned earlier. Since our theoretical knowledge of the influence of metallicity on AGB and post-agb evolution is far from ideal (mostly because we lack a good theory of AGB mass-loss processes) it looks safer to rely on the available empirical information: a direct comparison of the average PN abundances in progressively weaker bins along the luminosity function. This can be done only for nearby galaxies, such as the Magellanic Clouds or M31. Fig. 12. Combined information about metallicity from absorption-line data (diamonds and plus signs, as in Fig. 3) and from the PNs (triangles indicate lower limits to the abundances) plotted as a function of projected distance to the center of NGC One effective radius is at log r ¼ 1:98. The main argument favoring an almost solar metallicity population in the outskirts of NGC 4697 is the fact that we found so many PNs (80% of those beyond 1 effective radius) with very strong k5007/h. As mentioned before, this happens in only one other place throughout our Local Group: the bulge of M31 (Richer et al. 1999). Combining the information given in their Tables 5 and 9 (oxygen abundances and line intensities, respectively, in the bulge of M31) with the apparent k5007 magnitudes from the discovery paper (Ciardullo et al. 1989), we find for the 16 brightest M31 bulge PNs that nine of them, or 56%, have k5007/ H >18, and we find that the average oxygen abundance of these 16 PNs is at least 8.70 (there are four lower limits). We can test how important it is to be restricted to the most luminous PNs; taking the total sample of 28 PNs we get an average O abundance of at least 8.64, with 14 lower limits. There does not seem to be a very significant difference. But what happens if we consider even fainter PNs? We turn to Jacoby & Ciardullo s (1999) analysis of the M31 PNs. First, their Figure 6 shows that across 1 order of magnitude in oxygen abundance, from 8.1 to 9.1, the upper envelope is flat; i.e., a metal-poor PN can be as bright as a metal-rich PN. This is an essential point: if there is a population with LMC or SMC metallicity in NGC 4697, it will produce bright PNs, and we will find them (very probably we did, in fact, but we cannot be sure because a low k5007/h admits many possible abundance interpretations). On the other hand, Jacoby & Ciardullo (1999) remark that their fainter M31 PNs have lower average metallicity. However, they do not conclude that the brighter PNs must overestimate the metallicity; in their x they comment that the tendency for fainter PNs to be drawn from a lower-metallicity population may be an artifact of a selection effect or an analysis bias, because there is no physical rationale why metal-rich PNs should not be faint as well as bright. This interpretation is supported by the fact that the average brightest PN abundance (from the data in Richer et al. 1999) agrees with another set of data: absorption-line indices yield supersolar metallicities for the integrated stellar population of the M31 bulge (Trager et al. 2000a, 2000b; Thomas et al. 2005). If we expected the brightest PNs to overestimate the M31 bulge metallicity, then we would expect the M31 integrated light to indicate a lower average metallicity. Since that does not happen, Jacoby & Ciardullo (1999) feel that they need to explain why their sample has so few metal-rich objects, coming from a metal-rich population. The brighter Richer et al. sample does not have that problem. Coming back to NGC 4697, we still have to discuss another possibility, involving now a very low metallicity. Consider the study by Richer (1993) of the LMC and SMC PNs. In his
12 778 MÉNDEZ ET AL. Figure 2 we find that the more metal-rich objects are brighter not by much initially, but the difference becomes important when we reach oxygen abundances below 8.0. Then, if there were many very metal-poor PNs in the outskirts of NGC 4697, they would be fainter and not detectable in our flux-limited sample. But then we would be talking about a peak in ½Z/HŠ below 1 and therefore about an extremely bimodal metallicity distribution. A Gaussian metallicity distribution (or even a moderately bimodal one, as is sometimes observed in globular cluster systems; e.g., Zepf & Ashman 1993; Gebhardt & Kissler-Patig 1999) extending that far down in metallicity would require a lot of LMC- and SMC-like PNs, which we would detect, as argued above, so that the frequency of very strong k5007/h values would not be as high as we observe. Since the observational evidence is not overwhelming, we do not rule out that our bright PNs could have ½Z/HŠ higher by about 0.2 than the stellar population they represent. This would bring the average metallicity, as derived from the PNs, in even better agreement with the long-slit results inside 1 effective radius. We emphasize, however, that right now there is no compelling theoretical reason nor any evidence in M31 (the only testing ground we have) indicating that such a systematic difference between PNs and stars must necessarily exist. But even assuming such a difference, our basic conclusion remains valid: a similar metallicity both inside and outside of 1 effective radius requires the abundance gradient to become less steep outside. Alternatively, the conceivable existence of a very metal-poor population with ½Z/HŠ below 1, which we cannot exclude, would require an extremely bimodal metallicity distribution. Let us remark, in closing this discussion, that the metalrich population represented by our PNs is quite real, while the very metal-poor population must remain hypothetical until confirmed by future observations. The sad fact is that based only on our PN lower limits, we cannot estimate how large the dispersion in abundances is. Abundance determinations for fainter PNs in NGC 4697 are probably beyond the reach of currently available instrumentation and may require a 30 m telescope Other Galaxies The PNs in NGC 5128 seem to have significantly lower metallicities, well below solar (Walsh et al. 1999). This is consistent with the metallicity distribution in the halo of NGC 5128 derived by Harris & Harris (2002), which indeed does not have a prominent tail of stars with supersolar metallicities. On the other hand the information about PN metallicities in NGC 5128 is still very limited and uncertain; it seems prudent to postpone any further discussion until more and better PN abundances are measured in NGC Consider now PNs in the bulge of the Milky Way. Ratag et al. (1992, 1997) derive an oxygen abundance distribution for PNs in our Galactic bulge which, allowing for the lower oxygen solar abundance we favor today, seems consistent with the metallicity distribution of field stars (Zoccali et al. 2003), which peaks near solar metallicity. Unfortunately it is difficult to build a flux-limited PN sample in the Milky Way bulge because of the strong reddening and the depth of the bulge. We note that in the Milky Way bulge there are few examples of very high ratios k5007/h (see Ratag 1991), but we will refrain from interpreting this fact. NGC 4697 does not belong among the most luminous and redder ellipticals. It now becomes interesting to investigate whether other elliptical galaxies, particularly the redder ones, show a high frequency of very strong k5007 PNs. In fact, it would be prudent also to verify what happens on the other side of NGC This kind of work, requiring only the detection of H, is not as demanding in terms of big telescope time as an accurate abundance determination. 8. SUMMARY AND PERSPECTIVES This paper is a first attempt to use PNs for the determination of individual stellar abundances in elliptical galaxies. For the first time we have taken deep spectra of a relatively large sample of 14 PNs at a variety of angular distances from the center of a typical elliptical galaxy, NGC 4697, located at about 11 Mpc from us. The most important result is the high frequency of PN spectra with very strong k5007/h ratios 20. We argue that such ratios require O abundances near solar, or maybe even above solar. The Ne abundances are similarly high. The high O and Ne abundances are direct evidence of the existence of a metal-rich stellar population, confirming in individual stars the high metallicities derived in many cores of elliptical galaxies from absorption-line indices measured on integrated-light, long-slit spectra (e.g., Trager et al. 2000a, 2000b; Thomas et al. 2005). This result also validates the derivation of metallicities in early-type galaxies from the direct comparison with Galactic globular clusters ( Maraston et al. 2003). Perhaps more surprising is the existence of a metal-rich population extending as far as more than 2 effective radii from the center of NGC This forces us to conclude that the abundance gradient, which is rather steep within 1 effective radius, must become much less pronounced outside. The only alternative to this interpretation would be the presence of a very metal-poor PN population with ½Z/HŠ below 1, which we cannot rule out but which would require an extremely bimodal metallicity distribution with almost no intermediate metallicities. It would now be interesting to verify what the situation is on the other side of NGC 4697, as well as in other elliptical galaxies. High metallicities in elliptical galaxies imply not very high electron temperatures and therefore very weak [O iii] k4363 intensities, making abundance determinations in the normal way very costly in terms of 10 m class telescope time. However, we have found that the ratio k5007/h can provide important constraints on the abundances and is worth exploring systematically in the many elliptical galaxies where PNs have already been discovered. We thank the anonymous referee for several useful comments. This work has been supported in part by the National Science Foundation, under grant APPENDIX FINDING CHARTS In Figures 13 and 14 we provide finding charts for the 14 PNs studied in this work, taken from the discovery on-band combined image in Méndez et al. (2001). Each chart is approximately ; 25 00, with only one exception: the last one, showing PN 13 and PN 14, which is ; In all cases the orientation is the same as in Méndez et al. (2001). The north direction is obtained by rotating 24 counterclockwise from the vertical direction.


13 Fig. 13. Finding charts for PNs 1 6 studied in this work.


14 Fig. 14. Finding charts for PNs 7 14 studied in this work.
Mapping the oxygen abundance in an elliptical galaxy (NGC 5128)
") Mapping the oxygen abundance in an elliptical galaxy (NGC 5128) Jeremy R. Walsh, ESO Collaborators: George H. Jacoby, GMT Observatory, Carnegie; Reynier Peletier, Kapteyn Lab., Groningen; Nicholas A. Walton,
Mapping the oxygen abundance in an elliptical galaxy (NGC 5128) Jeremy R. Walsh, ESO Collaborators: George H. Jacoby, GMT Observatory, Carnegie; Reynier Peletier, Kapteyn Lab., Groningen; Nicholas A. Walton,
Luminosity Functions of Planetary Nebulae & Globular Clusters. By Azmain Nisak ASTR 8400
 Luminosity Functions of Planetary Nebulae & Globular Clusters By Azmain Nisak ASTR 8400 Calculating Distance! m = apparent magnitude! M = absolute magnitude! r = distance in pc GLOBULAR CLUSTERS AS DISTANCE
Planetary Nebulae beyond the Milky Way historical overview
 Planetary Nebulae beyond the Milky Way historical overview M. J. Barlow Dept. of Physics & Astronomy University College London Outline (a) Surveys for planetary nebulae in other galaxies, PN luminosity
Measuring the Redshift of M104 The Sombrero Galaxy
 Measuring the Redshift of M104 The Sombrero Galaxy Robert R. MacGregor 1 Rice University Written for Astronomy Laboratory 230 Department of Physics and Astronomy, Rice University May 3, 2004 2 Abstract
The Effective Spectral Resolution of the WFC and HRC Grism
 The Effective Spectral Resolution of the WFC and HRC Grism A. Pasquali, N. Pirzkal, J.R. Walsh, R.N. Hook, W. Freudling, R. Albrecht, R.A.E. Fosbury March 7, 2001 ABSTRACT We present SLIM simulations of
Lab 4 Radial Velocity Determination of Membership in Open Clusters
 Lab 4 Radial Velocity Determination of Membership in Open Clusters Sean Lockwood 1, Dipesh Bhattarai 2, Neil Lender 3 December 2, 2007 Abstract We used the Doppler velocity of 29 stars in the open clusters
Chapter 7: From theory to observations
 Chapter 7: From theory to observations Given the stellar mass and chemical composition of a ZAMS, the stellar modeling can, in principle, predict the evolution of the stellar bolometric luminosity, effective
The cosmic distance scale
 The cosmic distance scale Distance information is often crucial to understand the physics of astrophysical objects. This requires knowing the basic properties of such an object, like its size, its environment,
STUDIES OF SELECTED VOIDS. SURFACE PHOTOMETRY OF FAINT GALAXIES IN THE DIRECTION OF IN HERCULES VOID
 STUDIES OF SELECTED VOIDS. SURFACE PHOTOMETRY OF FAINT GALAXIES IN THE DIRECTION OF 1600+18 IN HERCULES VOID G.Petrov [1], A.Y.Kniazev [2], and J.W. Fried [2] 1 Institute of Astronomy, Bulgarian Academy
The Planetary Nebula Spectrograph
 Chapter 2 The Planetary Nebula Spectrograph The Planetary Nebula Spectrograph (PN.S) and the principles ofcounter-dispersed imaging are described in this chapter. A full description of PN.S, its motivation,
Report on the new EFOSC2 VPH grisms
 Report on the new EFOSC2 VPH grisms Ivo Saviane Lorenzo Monaco v 1.0 March 01, 2008 1 Introduction In January 2008 the ULTRASPEC project delivered two volume-phased holographic grisms (VPHG) to be used
STRUCTURE OF GALAXIES
 STRUCTURE OF GALAXIES 2., classification, surface photometry Piet van der Kruit Kapteyn Astronomical Institute University of Groningen the Netherlands February 2010, classification, surface photometry
The HII Regions of Sextans A
 Publications of the Astronomical Society of the Pacific 6: 765-769, 1994 July The HII Regions of Sextans A Paul Hodge 1 Astronomy Department, University of Washington, Seattle, Washington 98195 Electronic
Quantifying the Assembly History of Elliptical Galaxies
 Quantifying the Assembly History of Elliptical Galaxies Michael Pierce (University of Wyoming) A Science Use Case for GMT and TMT Origin of Elliptical Galaxies! Elliptical Galaxies Form Through Mergers!
CHEMICAL ABUNDANCE ANALYSIS OF RC CANDIDATE STAR HD (46 LMi) : PRELIMINARY RESULTS
 : PRELIMINARY RESULTS") Dig Sites of Stellar Archeology: Giant Stars in the Milky Way Ege Uni. J. of Faculty of Sci., Special Issue, 2014, 145-150 CHEMICAL ABUNDANCE ANALYSIS OF RC CANDIDATE STAR HD 94264 (46 LMi) : PRELIMINARY
Dig Sites of Stellar Archeology: Giant Stars in the Milky Way Ege Uni. J. of Faculty of Sci., Special Issue, 2014, 145-150 CHEMICAL ABUNDANCE ANALYSIS OF RC CANDIDATE STAR HD 94264 (46 LMi) : PRELIMINARY
From theory to observations
 Stellar Objects: From theory to observations 1 From theory to observations Given the stellar mass and chemical composition of a ZAMS, the stellar modeling can, in principle, give the prediction of the
Lab 4: Stellar Spectroscopy
 Name:... Astronomy 101: Observational Astronomy Fall 2006 Lab 4: Stellar Spectroscopy 1 Observations 1.1 Objectives and Observation Schedule During this lab each group will target a few bright stars of
Chapter 10: Unresolved Stellar Populations
 Chapter 10: Unresolved Stellar Populations We now consider the case when individual stars are not resolved. So we need to use photometric and spectroscopic observations of integrated magnitudes, colors
Normal Galaxies (Ch. 24) + Galaxies and Dark Matter (Ch. 25) Symbolically: E0.E7.. S0..Sa..Sb..Sc..Sd..Irr
 + Galaxies and Dark Matter (Ch. 25) Symbolically: E0.E7.. S0..Sa..Sb..Sc..Sd..Irr") Normal Galaxies (Ch. 24) + Galaxies and Dark Matter (Ch. 25) Here we will cover topics in Ch. 24 up to 24.4, but then skip 24.4, 24.5 and proceed to 25.1, 25.2, 25.3. Then, if there is time remaining,
Normal Galaxies (Ch. 24) + Galaxies and Dark Matter (Ch. 25) Here we will cover topics in Ch. 24 up to 24.4, but then skip 24.4, 24.5 and proceed to 25.1, 25.2, 25.3. Then, if there is time remaining,
ASTRONOMY II Spring 1995 FINAL EXAM. Monday May 8th 2:00pm
 ASTRONOMY II - 79202 Spring 1995 FINAL EXAM Monday May 8th 2:00pm Name: You have three hours to complete this exam. I suggest you read through the entire exam before you spend too much time on any one
Galaxies. The majority of known galaxies fall into one of three major classes: spirals (78 %), ellipticals (18 %) and irregulars (4 %).
, ellipticals (18 %) and irregulars (4 %).") Galaxies Collection of stars, gas and dust bound together by their common gravitational pull. Galaxies range from 10,000 to 200,000 light-years in size. 1781 Charles Messier 1923 Edwin Hubble The distribution
Galaxies Collection of stars, gas and dust bound together by their common gravitational pull. Galaxies range from 10,000 to 200,000 light-years in size. 1781 Charles Messier 1923 Edwin Hubble The distribution
Analyzing Spiral Galaxies Observed in Near-Infrared
 Analyzing Spiral Galaxies Observed in Near-Infrared Preben Grosbøl European Southern Observatory Karl-Schwarzschild-Str. 2, D-85748 Garching, Germany Abstract A sample of 54 spiral galaxies was observed
Spatially resolved spectroscopy of Coma cluster early-type galaxies. II. The minor axis dataset
 A&A 395, 753 759 (2002) DOI: 10.1051/0004-6361:20021352 c ESO 2002 Astronomy & Astrophysics Spatially resolved spectroscopy of Coma cluster early-type galaxies II. The minor axis dataset G. Wegner 1,,E.M.Corsini
Open Cluster Photometry: Part II
 Project 4 Open Cluster Photometry: Part II Observational Astronomy ASTR 310 Fall 2005 1 Introduction The objective of this and the previous project is to learn how to produce color-magnitude diagrams of
Where are oxygen synthesized in stars?
 The oxygen abundance from X-rays : methods and prospects K. Matsushita Where are oxygen synthesized in stars? Hot intracluster medium (ICM) Warm-hot intergalactic medium? Hot interstellar medium in early-type
Stellar population models with variable abundance ratios
 Stellar population models with variable abundance ratios Daniel Thomas University of Oxford Claudia Maraston (Oxford) Ralf Bender (MPE) Andreas Korn (Uppsala) Roger Davies (Oxford) Outline o How to measure
From theory to observations
 Stellar Objects: From theory to observations 1 From theory to observations Update date: December 13, 2010 Given the stellar mass and chemical composition of a ZAMS, the stellar modeling can, in principle,
SEQUENCING THE STARS
 SEQUENCING THE STARS ROBERT J. VANDERBEI Using images acquired with modern CCD cameras, amateur astronomers can make Hertzsprung-Russell diagrams from their own images of clusters. In this way, we can
BULGES NGC 4710 NGC 4594 ESO 498-G5 NGC 4565 NGC 7457 ESO 1129
 BULGES NGC 4594 ESO 498-G5 NGC 4710 ESO 1129 NGC 7457 NGC 4565 FORMATION AND EVOLUTION OF BULGES Classical bulge Presents in early type galaxies: lenticular, Sa Very similar to elliptical : Mg2 - ; Dn
Age Dating A SSP. Quick quiz: please write down a 3 sentence explanation of why these plots look like they do.
 Color is only a weak function of age after ~3Gyrs (for a given metallicity) (See MBW pg 473) But there is a strong change in M/L V and weak change in M/L K Age Dating A SSP Quick quiz: please write down
RESEARCH ARTICLE Correlation Between Nitrogen and Oxygen Content in Planetary Nebulae Morphology Abstract
 RESEARCH ARTICLE Correlation Between Nitrogen and Oxygen Content in Planetary Nebulae Morphology Ian Godwin 1,2 and Don McCarthy 3 Student 1 : Herndon High School, Herndon, Virginia, 20170 Intern 2, Mentor/Professor
Analysis of the rich optical iron-line spectrum of the x-ray variable I Zw 1 AGN 1H
 Analysis of the rich optical iron-line spectrum of the x-ray variable I Zw 1 AGN 1H0707 495 H Winkler, B Paul Department of Physics, University of Johannesburg, PO Box 524, 2006 Auckland Park, Johannesburg,
The Milky Way Galaxy. Some thoughts. How big is it? What does it look like? How did it end up this way? What is it made up of?
 Some thoughts The Milky Way Galaxy How big is it? What does it look like? How did it end up this way? What is it made up of? Does it change 2 3 4 5 This is not a constant zoom The Milky Way Almost everything
Extraction of Point Source Spectra from STIS Long Slit Data
 1997 HST Calibration Workshop Space Telescope Science Institute, 1997 S. Casertano, et al., eds. Extraction of Point Source Spectra from STIS Long Slit Data J. R. Walsh Spect Telescope European Coordinating
Characterization of the exoplanet host stars. Exoplanets Properties of the host stars. Characterization of the exoplanet host stars
 Characterization of the exoplanet host stars Exoplanets Properties of the host stars Properties of the host stars of exoplanets are derived from a combination of astrometric, photometric, and spectroscopic
The Distances and Ages of Star Clusters
 Name: Partner(s): Lab #7 The Distances and Ages of Star Clusters 0.1 Due July 14th Very few stars are born isolated. Instead, most stars form in small groups, known as clusters. The stars in a cluster
THE OUTSIDE-IN FORMATION OF ELLIPTICAL GALAXIES
 The Astrophysical Journal, 638:739 744, 2006 February 20 # 2006. The American Astronomical Society. All rights reserved. Printed in U.S.A. A THE OUTSIDE-IN FORMATION OF ELLIPTICAL GALAXIES Antonio Pipino
Techniques for measuring astronomical distances generally come in two variates, absolute and relative.
 Chapter 6 Distances 6.1 Preliminaries Techniques for measuring astronomical distances generally come in two variates, absolute and relative. Absolute distance measurements involve objects possibly unique
The Composition of the Old, Metal-Rich Open Cluster, NGC 6791
 The Composition of the Old, Metal-Rich Open Cluster, NGC 6791 Liz Jensen --- Smith College, REU at IFA, University of Hawaii 2006 Mentor: Ann M. Boesgaard --- Institute for Astronomy, University of Hawaii
The in-orbit wavelength calibration of the WFC G800L grism
 The in-orbit wavelength calibration of the WFC G800L grism A. Pasquali, N. Pirzkal, J.R. Walsh March 5, 2003 ABSTRACT We present the G800L grism spectra of the Wolf-Rayet stars WR45 and WR96 acquired with
Physics of Galaxies 2016 Exercises with solutions batch I
 Physics of Galaxies 2016 Exercises with solutions batch I 1. Distance and brightness at low redshift You discover an interesting galaxy in the local Universe and measure its redshift to be z 0.053 and
GOODS/VIMOS Spectroscopy: Data Release Version 2.0.1
 ESO Phase 3 Data Release Description Data Collection GOODS_VIMOS_SPEC Release Number 1 Data Provider C. Cesarsky Date 10.03.2010 Migrated to Phase 3 infrastructure 08.12.2014 GOODS/VIMOS Spectroscopy:
Water Ice on the Satellite of Kuiper Belt Object 2003 EL61
 Water Ice on the Satellite of Kuiper Belt Object 2003 EL61 K.M Barkume, M.E. Brown, and E.L. Schaller Division of Geological and Planetary Sciences, California Institute of Technology, Pasadena, CA 91125
RADIAL VELOCITIES OF NEWLY DISCOVERED GLOBULAR CLUSTERS IN NGC 5128
 The Astronomical Journal, 129:2654 2662, 2005 June # 2005. The American Astronomical Society. All rights reserved. Printed in U.S.A. RADIAL VELOCITIES OF NEWLY DISCOVERED GLOBULAR CLUSTERS IN NGC 5128
Upcoming class schedule
 Upcoming class schedule Thursday March 15 2pm AGN evolution (Amy Barger) th Monday March 19 Project Presentation (Brad) nd Thursday March 22 postponed to make up after spring break.. Spring break March
Transiting Exoplanet in the Near Infra-red for the XO-3 System
 Transiting Exoplanet in the Near Infra-red for the XO-3 System Nathaniel Rodriguez August 26, 2009 Abstract Our research this summer focused on determining if sufficient precision could be gained from
Using Globular Clusters to. Study Elliptical Galaxies. The View Isn t Bad... Omega Centauri. Terry Bridges Australian Gemini Office M13
 Using Globular Clusters to Omega Centauri Study Elliptical Galaxies Terry Bridges Australian Gemini Office 10,000 1,000,000 stars up to 1000 stars/pc3 typical sizes ~10 parsec Mike Beasley (IAC, Tenerife)
Parallax: Measuring the distance to Stars
 Measuring the Stars Parallax: Measuring the distance to Stars Use Earth s orbit as baseline Parallactic angle = 1/2 angular shift Distance from the Sun required for a star to have a parallactic angle of
Hubble s Law and the Cosmic Distance Scale
 Lab 7 Hubble s Law and the Cosmic Distance Scale 7.1 Overview Exercise seven is our first extragalactic exercise, highlighting the immense scale of the Universe. It addresses the challenge of determining
SKINAKAS OBSERVATORY Astronomy Projects for University Students COLOUR IN ASTRONOMY
 P R O J E C T 3 COLOUR IN ASTRONOMY Objective: Explain what colour means in an astronomical context and its relationship with the temperature of a star. Learn how to create colour-colour diagrams and how
Reduction procedure of long-slit optical spectra. Astrophysical observatory of Asiago
 Reduction procedure of long-slit optical spectra Astrophysical observatory of Asiago Spectrograph: slit + dispersion grating + detector (CCD) It produces two-dimension data: Spatial direction (x) along
9. Evolution with redshift - z > 1.5. Selection in the rest-frame UV
 11-5-10see http://www.strw.leidenuniv.nl/ franx/college/galaxies10 10-c09-1 11-5-10see http://www.strw.leidenuniv.nl/ franx/college/galaxies10 10-c09-2 9. Evolution with redshift - z > 1.5 Selection in
Introduction to SDSS -instruments, survey strategy, etc
 Introduction to SDSS -instruments, survey strategy, etc (materials from http://www.sdss.org/) Shan Huang 17 February 2010 Survey type Status Imaging and Spectroscopy Basic Facts SDSS-II completed, SDSS-III
Galaxy Metallicity: What Oxygen Tells Us About The Lifecycles of Galaxies Designed by Prof Jess Werk, modified by Marie Wingyee Lau
 Introduction Galaxy Metallicity: What Oxygen Tells Us About The Lifecycles of Galaxies Designed by Prof Jess Werk, modified by Marie Wingyee Lau Before stars and galaxies came into existence, the very
Hubble sequence galaxy classification scheme, originally based on appearance, but correlates with other properties as well.
 Normal Galaxies (Ch. 24) Here we will cover topics in Ch. 24 up to 24.4, but then skip 24.4, 24.5. The sections we are skipping are all about processes that occur in the centers of galaxies, so I d like
arxiv:astro-ph/ v1 20 Jan 1997
 Globular Clusters in the Sombrero Galaxy (NGC 4594) 1,2 arxiv:astro-ph/9701144v1 20 Jan 1997 Duncan A. Forbes Lick Observatory, University of California, Santa Cruz, CA 95064 and School of Physics and
Two Main Techniques. I: Star-forming Galaxies
 p.1/24 The high redshift universe has been opened up to direct observation in the last few years, but most emphasis has been placed on finding the progenitors of today s massive ellipticals. p.2/24 Two
Optical/NIR Spectroscopy A3130. John Wilson Univ of Virginia
 Optical/NIR Spectroscopy A3130 John Wilson Univ of Virginia Topics: Photometry is low resolution spectroscopy Uses of spectroscopy in astronomy Data cubes and dimensionality challenge Spectrograph design
Chapter 10 The Interstellar Medium
 Chapter 10 The Interstellar Medium Guidepost You have begun your study of the sun and other stars, but now it is time to study the thin gas and dust that drifts through space between the stars. This chapter
Some HI is in reasonably well defined clouds. Motions inside the cloud, and motion of the cloud will broaden and shift the observed lines!
 Some HI is in reasonably well defined clouds. Motions inside the cloud, and motion of the cloud will broaden and shift the observed lines Idealized 21cm spectra Example observed 21cm spectra HI densities
A New Analysis in the Field of the Open Cluster Collinder 223
 Chin. J. Astron. Astrophys. Vol. 4 (2004), No. 1, 67 74 ( http: /www.chjaa.org or http: /chjaa.bao.ac.cn ) Chinese Journal of Astronomy and Astrophysics A New Analysis in the Field of the Open Cluster
Cross-Talk in the ACS WFC Detectors. I: Description of the Effect
 Cross-Talk in the ACS WFC Detectors. I: Description of the Effect Mauro Giavalisco August 10, 2004 ABSTRACT Images acquired with the Wide Field Channel (WFC) of the Advanced Camera for Surveys (ACS) are
Stellar Explosions (ch. 21)
") Stellar Explosions (ch. 21) First, a review of low-mass stellar evolution by means of an illustration I showed in class. You should be able to talk your way through this diagram and it should take at least
Stellar Explosions (ch. 21) First, a review of low-mass stellar evolution by means of an illustration I showed in class. You should be able to talk your way through this diagram and it should take at least
optical / IR: photon counting flux density or magnitude corresponds to number of electrons per second (mean rate)
") optical / IR: photon counting flux density or magnitude corresponds to number of electrons per second (mean rate) N electrons/sec = ɛ F λ λa hc/λ 0 efficiency factor flux density x bandpass x collecting
optical / IR: photon counting flux density or magnitude corresponds to number of electrons per second (mean rate) N electrons/sec = ɛ F λ λa hc/λ 0 efficiency factor flux density x bandpass x collecting
Project for Observational Astronomy 2018/2019: Colour-magnitude diagram of an open cluster
 Project for Observational Astronomy 018/019: Colour-magnitude diagram of an open cluster Søren S. Larsen November 9, 018 1 1 Colour-magnitude diagram for an open cluster 1.1 Background The colour-magnitude
Astronomy 102: Stars and Galaxies Examination 3 April 11, 2003
 Name: Seat Number: Astronomy 102: Stars and Galaxies Examination 3 April 11, 2003 Do not open the test until instructed to begin. Instructions: Write your answers in the space provided. If you need additional
The GALEX Observations of Planetary Nebulae. Ananta C. Pradhan 1, M. Parthasarathy 2, Jayant Murthy 3 and D. K. Ojha 4
 The GALEX Observations of Planetary Nebulae. Ananta C. Pradhan 1, M. Parthasarathy 2, Jayant Murthy 3 and D. K. Ojha 4 1 National Institute of Technology, Odisha 769008, India 2 Inter-University Centre
OPTICAL PHOTOMETRY. Observational Astronomy (2011) 1
 1") OPTICAL PHOTOMETRY Observational Astronomy (2011) 1 The optical photons coming from an astronomical object (star, galaxy, quasar, etc) can be registered in the pixels of a frame (or image). Using a ground-based
OPTICAL PHOTOMETRY Observational Astronomy (2011) 1 The optical photons coming from an astronomical object (star, galaxy, quasar, etc) can be registered in the pixels of a frame (or image). Using a ground-based
Do the Large Magellanic Cloud and the Milky Way Globular Clusters Share a Common Origin?
 Do the Large Magellanic Cloud and the Milky Way Globular Clusters Share a Common Origin? B.E. Tucker 1,2 Department of Physics University of Notre Dame btucker2@nd.edu Advised by: K.Olsen and B.Blum Astronomers,
AstroBITS: Open Cluster Project
 AstroBITS: Open Cluster Project I. Introduction The observational data that astronomers have gathered over many years indicate that all stars form in clusters. In a cloud of hydrogen gas, laced with helium
APPLICATION NOTE. Filter Set Prescription Alan Holmes
 APPLICATION NOTE Filter Set Prescription Alan Holmes August 1st, 22 SBIG has a color filter set prescription specifically designed to achieve correctly balanced color images for galaxies and nebulae. Our
You, too, can make useful and beautiful astronomical images at Mees: Lesson 3
 You, too, can make useful and beautiful astronomical images at Mees: Lesson 3 Calibration and data reduction Useful references, besides Lessons 1 and 2: The AST 142 Projects manual: http://www.pas.rochester.edu/~dmw/ast142/projects/project.pdf
Chapter 5: Telescopes
 Chapter 5: Telescopes You don t have to know different types of reflecting and refracting telescopes. Why build bigger and bigger telescopes? There are a few reasons. The first is: Light-gathering power:
Photometric Studies of GEO Debris
 Photometric Studies of GEO Debris Patrick Seitzer Department of Astronomy, University of Michigan 500 Church St. 818 Dennison Bldg, Ann Arbor, MI 48109 pseitzer@umich.edu Heather M. Cowardin ESCG/Jacobs
Astronomy. Astrophysics. The chemical composition of planetary nebulae and HII regions in NGC 3109, M. Peña 1,, G. Stasińska 2, and M. G.
 A&A 476, 745 758 (2007) DOI: 10.1051/0004-6361:20078655 c ESO 2007 Astronomy & Astrophysics The chemical composition of planetary nebulae and HII regions in NGC 3109, M. Peña 1,, G. Stasińska 2, and M.
Hubble Science Briefing: 25 Years of Seeing Stars with the Hubble Space Telescope. March 5, 2015 Dr. Rachel Osten Dr. Alex Fullerton Dr.
 Hubble Science Briefing: 25 Years of Seeing Stars with the Hubble Space Telescope March 5, 2015 Dr. Rachel Osten Dr. Alex Fullerton Dr. Jay Anderson Hubble s Insight into the Lives of Stars Comes From:
Scattered Light from the Earth Limb Measured with the STIS CCD
 Instrument Science Report STIS 98 21 Scattered Light from the Earth Limb Measured with the STIS CCD Dick Shaw, Merle Reinhart, and Jennifer Wilson 17 June 1998 ABSTRACT We describe a recent program to
Spitzer Infrared Spectrograph (IRS) Observations of Large Magellanic Cloud Planetary Nebula SMP 83
 Observations of Large Magellanic Cloud Planetary Nebula SMP 83") Spitzer Infrared Spectrograph (IRS) Observations of Large Magellanic Cloud Planetary Nebula SMP 83 J. Bernard Salas, J. R. Houck, P. W. Morris, G. C. Sloan, S. R. Pottasch, & D. J. Barry ApJS, 154, 271
Spitzer Infrared Spectrograph (IRS) Observations of Large Magellanic Cloud Planetary Nebula SMP 83 J. Bernard Salas, J. R. Houck, P. W. Morris, G. C. Sloan, S. R. Pottasch, & D. J. Barry ApJS, 154, 271
ASTR-1020: Astronomy II Course Lecture Notes Section III
 ASTR-1020: Astronomy II Course Lecture Notes Section III Dr. Donald G. Luttermoser East Tennessee State University Edition 4.0 Abstract These class notes are designed for use of the instructor and students
SKINAKAS OBSERVATORY. Astronomy Projects for University Students PROJECT SUPERNOVA REMNANTS
 PROJECT 10 SUPERNOVA REMNANTS Objective: The purpose of this exercise is also twofold. The first one is to gain further experience with the analysis of narrow band images (as in the case of planetary nebulae)
C. Watson, E. Churchwell, R. Indebetouw, M. Meade, B. Babler, B. Whitney
 Reliability and Completeness for the GLIMPSE Survey C. Watson, E. Churchwell, R. Indebetouw, M. Meade, B. Babler, B. Whitney Abstract This document examines the GLIMPSE observing strategy and criteria
Open Cluster Research Project
 Open Cluster Research Project I. Introduction The observational data indicate that all stars form in clusters. In a cloud of hydrogen gas, laced with helium and a trace of other elements, something triggers
FLAT FIELDS FROM THE MOONLIT EARTH
 Instrument Science Report WFPC2 2008-01 FLAT FIELDS FROM THE MOONLIT EARTH R. C. Bohlin, J. Mack, and J. Biretta 2008 February 4 ABSTRACT The Earth illuminated by light from the full Moon was observed
The VLT dealing with the Atmosphere, a Night Operation point of view
 The VLT dealing with the Atmosphere, a Night Operation point of view Julio Navarrete European Organization for Astronomical Research in the Southern Hemisphere Alonso de Cordova 3107, Vitacura, Santiago-Chile
Tidal Remnants and Intergalactic H II Regions
 Recycling intergalactic and interstellar matter IAU Symposium Series, Vol. 217, 2004 Pierre-Alain Duc, Jonathan Braine and Elias Brinks, eds. Tidal Remnants and Intergalactic H II Regions Tom Oosterloo,
Dust properties of galaxies at redshift z 5-6
 Dust properties of galaxies at redshift z 5-6 Ivana Barisic 1, Supervisor: Dr. Peter L. Capak 2, and Co-supervisor: Dr. Andreas Faisst 2 1 Physics Department, University of Zagreb, Zagreb, Croatia 2 Infrared
Chapter 8: Simple Stellar Populations
 Chapter 8: Simple Stellar Populations Simple Stellar Population consists of stars born at the same time and having the same initial element composition. Stars of different masses follow different evolutionary
Exam # 3 Tue 12/06/2011 Astronomy 100/190Y Exploring the Universe Fall 11 Instructor: Daniela Calzetti
 Exam # 3 Tue 12/06/2011 Astronomy 100/190Y Exploring the Universe Fall 11 Instructor: Daniela Calzetti INSTRUCTIONS: Please, use the `bubble sheet and a pencil # 2 to answer the exam questions, by marking
The outskirt of the Virgo cd galaxy M87 as revealed by Planetary Nebulae
 Max-Planck-Institut für extraterrestrische Physik EWASS 2015, Sp16 Outer regions of galaxies and structure formation Formation of ICL and extended halos around BCGs closely related to the morphological
Supplementary Information for SNLS-03D3bb a super- Chandrasekhar mass Type Ia supernova
 1 Supplementary Information for SNLS-03D3bb a super- Chandrasekhar mass Type Ia supernova SN Location SNLS-03D3bb is located at RA: 14:16:18.920 Dec: +52:14:53.66 (J2000) in the D3 (extended Groth Strip)
arxiv:astro-ph/ v1 14 Jul 2004
 Chemical Composition of Planetary Nebulae: The Galaxy and the Magellanic Clouds* * Planetary Nebulae beyond the Milky Way, ESO Astrophysics Symposia, ed. J. R. Walsh, L. Stanghellini, Springer-Verlag,
The Potential of Ground Based Telescopes. Jerry Nelson UC Santa Cruz 5 April 2002
 The Potential of Ground Based Telescopes Jerry Nelson UC Santa Cruz 5 April 2002 Contents Present and Future Telescopes Looking through the atmosphere Adaptive optics Extragalactic astronomy Planet searches
Color-Magnitude Diagram Lab Manual
 Color-Magnitude Diagram Lab Manual Due Oct. 21, 2011 1 Pre-Lab 1.1 Photometry and the Magnitude Scale The brightness of stars is represented by its value on the magnitude scale. The ancient Greek astronomer
Transiting Hot Jupiters near the Galactic Center
 National Aeronautics and Space Administration Transiting Hot Jupiters near the Galactic Center Kailash C. Sahu Taken from: Hubble 2006 Science Year in Review The full contents of this book include more
Chapter 15 The Milky Way Galaxy
 Chapter 15 The Milky Way Galaxy Guidepost This chapter plays three parts in our cosmic drama. First, it introduces the concept of a galaxy. Second, it discusses our home, the Milky Way Galaxy, a natural
Photoionization Modelling of H II Region for Oxygen Ions
 Journal of Materials Science and Chemical Engineering, 2015, 3, 7-16 Published Online April 2015 in SciRes. http://www.scirp.org/journal/msce http://dx.doi.org/10.4236/msce.2015.34002 Photoionization Modelling
Small-Scale Physical Properties of Nebulae in Nearby Disk Galaxies
 Abstract Small-Scale Physical Properties of Nebulae in Nearby Disk Galaxies My research project consists of analyzing small-scale physical properties of star-forming regions (HII regions) in several nearby
The Nearest Giant Ellipticals: Rosetta Stones or Fool s Gold?
 The Nearest Giant Ellipticals: Rosetta Stones or Fool s Gold? A hypothesis or theory is clear, decisive, and positive, but it is believed by no one but the man who created it. Experimental findings, on
1 Lecture, 2 September 1999
 1 Lecture, 2 September 1999 1.1 Observational astronomy Virtually all of our knowledge of astronomical objects was gained by observation of their light. We know how to make many kinds of detailed measurements
Astrophysics of Gaseous Nebulae and Active Galactic Nuclei
 SECOND EDITION Astrophysics of Gaseous Nebulae and Active Galactic Nuclei Donald E. Osterbrock Lick Observatory, University of California, Santa Cruz Gary J. Ferland Department of Physics and Astronomy,