The Pennsylvania State University. The Graduate School. The Graduate Program in Acoustics DISCRETE-FREQUENCY AND BROADBAND NOISE RADIATION FROM
|
|
|
- Douglas Wade
- 5 years ago
- Views:
Transcription
1 The Pennsylvania State University The Graduate School The Graduate Program in Acoustics DISCRETE-FREQUENCY AND BROADBAND NOISE RADIATION FROM DIESEL ENGINE COOLING FANS A Thesis in Acoustics by Geon-Seok Kim 2007 Geon-Seok Kim Submitted in Partial Fulfillment of the Requirements for the Degree of Doctor of Philosophy December 2007
2 The thesis of Geon-Seok Kim was reviewed and approved* by the following: ii Gerald C. Lauchle Professor Emeritus of Acoustics Thesis Co-Advisor Co-Chair of Committee Timothy A. Brungart Associate Professor of Acoustics and Senior Research Associate at Applied Research Laboratory Thesis Co-Advisor Co-Chair of Committee Dean E. Capone Assistant Professor of Acoustics and Research Associate at Applied Research Laboratory Gary H. Koopmann Distinguished Professor of Mechanical Engineering Anthony A. Atchely Professor of Acoustics Head of the Graduate Program in Acoustics *Signatures are on file in the Graduate School
3 ABSTRACT iii This effort focuses on measuring and predicting the discrete-frequency and broadband noise radiated by diesel engine cooling fans. Unsteady forces developed by the interaction of the fan blade with inlet flow are the dominant source for both discretefrequency and broadband noise of the subject propeller fan. In many cases, a primary source of discrepancy between fan noise prediction and measurement is due to incomplete description of the fan inflow. Particularly, in such engine cooling systems where space is very limited, it would be very difficult, if not, impossible to measure the fan inflow velocity field using the conventional, stationary hot-wire method. Instead, the fan inflow was measured with two-component x-type hot-film probes attached very close to the leading edge of a rotating blade. One of the advantages of the blade-mountedprobe measurement technique is that it measures velocities relative to the rotating probe, which enables the acquired data to be applied directly in many aerodynamic theories that have been developed for the airfoil fixed-coordinate system. However, the velocity time data measured by this technique contains the spatially non-uniform mean velocity field along with the temporal fluctuations. A phase-locked averaging technique was successfully employed to decompose the velocity data into time-invariant flow distortions and fluctuations due to turbulence. The angles of attack of the fan blades, obtained from inlet flow measurements, indicate that the blades are stalled. The fan's radiated noise was measured without contamination from the engine noise by driving the fan with an electric motor. The motor operated at a constant speed while a pair of speed controllable pulleys controlled the fan speed. Narrowband and 1/3-
4 iv octave band sound power of the cooling fan was measured by using the comparison method with a reference sound source in a reverberant room. The spatially non-uniform mean velocity field was used in axial-flow fan noise theory to predict the discrete-frequency noise at the blade passing frequency (BPF) and harmonics. The unsteady lift was predicted by considering transverse and longitudinal velocity fluctuations. The influences due to an upstream finger guard were also investigated. The radiated sound power spectra that were measured for the fan are shown to be in excellent agreement with those predicted. The agreement between prediction and measurement is only fair at the fundamental BPF tone. Further experimental investigations revealed that the interaction noise between the fan blades and a shroud surrounding the fan might be the dominant source for the radiation at the first harmonic. The space-time correlation functions of the inflow velocity fluctuations were measured and utilized in stochastic lifting surface theory to calculate the unsteady blade lift and resulting broadband fan noise. The integral length scale of the inlet flow was found to be much smaller than the blade-to-blade separate distance of the fan. Therefore, contributions from blade-to-blade correlations of the various elements on different blades were found to be negligible and hence ignored; only the correlations between the strip elements on a given blade were considered. The cross-correlations measured between elements separated by more than the integral length scale were also found to be negligibly small. The predicted broadband sound power spectra agree well with those measured for frequencies greater than 400 Hz. There are deviations between the predictions and measurements at lower frequencies. These are likely due to fan blade stall, and possibly, anomalies in the noise measurement environment.
5 v In order to reduce the sound radiation at the blade rate tones, the baseline fan was replaced with a skewed fan. The backward skew angle of 30 was found to effectively reduce the 2 nd and higher harmonics of the blade rate tone. The interaction of the shroud opening and the blade tips dominates the sound level at the fundamental tone. This tone was successfully reduced by incorporating a serrated shroud opening. Overall, a 2.8 db sound power level reduction was achieved by applying the skewed fan and the serrated shroud opening simultaneously. Almost all blade rate tone levels were reduced without adversely affecting the flow performance of the system.
6 TABLE OF CONTENTS vi LIST OF FIGURES...ix LIST OF TABLES...xvii NOMENCLATURE...xviii ACKNOWLEDGEMENTS...xxii Chapter One Introduction Introduction Research Objectives Thesis Organization Review of Axial Flow Fan Noise Physics...4 Chapter Two Preliminary Test Introduction Engine Cooling System Fan Aerodynamic Performance Flow Rate Measurement Performance Curve Noise Characteristics...21 Chapter Three Theoretical Development Introduction Fan Discrete-Frequency Noise Radiation Thin Airfoil Theory Flat Plate Response Cambered Airfoil Response...41
7 vii 3.4 Correlation Analysis of Unsteady Force Fluctuations...46 Chapter Four Characterization of the Incoming Flow Field Introduction Experimental Apparatus Phased-Locked Mean Flow Field Turbulent Flow Statistics Turbulent Intensity Integral Length Scale...69 Chapter Five Discrete-Frequency Noise Prediction Introduction Time-Invariant Incoming Flow Field Fourier Analysis of Mean Flow Field Unsteady Forces Due to Time-Invariant Flow Distortions Discrete-Frequency Sound Power Prediction...92 Chapter Six Turbulence-Induced Broadband Noise Prediction Introduction Cross-Correlation of Incoming Turbulence Power Spectral Density of Incoming Turbulence Turbulence Ingestion Unsteady Forces Broadband Sound Power Prediction Chapter Seven Discrete-Frequency Noise Reduction Introduction Skewed Blade Fan...117
8 viii Blade Profile Prototype Fans Evaluation Banded Fan Shroud Inlet Opening Chapter Eight Conclusions and Recommendations for Future Work Summary and Conclusions Recommendations for Future Works Bibliography Appendix A: Discrete-Frequency Sound Power Measurement Appendix B: Cross-Correlation Functions Appendix C: Cross-Spectral Density Functions Appendix D: Unsteady Blade Lift Cross-Spectra...166
9 LIST OF FIGURES ix Figure 1-1: A sketch of the typical Cummins diesel engine generator....2 Figure 2-1: A sketch of the engine cooling fan system Figure 2-2: A drawing of the cooling fan Figure 2-3: Flow rate measurement set-up Figure 2-4: Velocity fields at the outlet of the radiator; fan speed of 1600 RPM with finger guard (top) and without finger guard (bottom) Figure 2-5: Velocity fields at the outlet of the radiator; fan speed of 1800 RPM with finger guard (top) and without finger guard (bottom) Figure 2-6: Head-flow curves at different fan speeds Figure 2-7: Non-dimensional head-flow curve...20 Figure 2-8: Photograph of the diesel engine modified to accept a variable sheave speed electric drive. The fan may thus be operated alone during acoustic tests, independent of any masking noise sources such as the engine and its exhaust Figure 2-9: Engine assembly and finger guard Figure 2-10: A-weighted One third Octave Band Sound Power Spectra due to the engine cooling fan operating at 1600 RPM, with and without the finger guard in place...24 Figure 2-11: A-weighted One third Octave Band Sound Power Spectra due to the engine cooling fan operating at 1800 RPM, with and without the finger guard in place...24 Figure 2-12: Narrow-band sound power spectra due to the engine cooling fan operating at 1600 RPM, with and without the finger guard in place Figure 2-13: Narrow-band sound power spectra due to the engine cooling fan operating at 1800 RPM, with and without the finger guard in place...25 Figure 3-1: Coordinate system used for rotor force and radiation calculations...31 Figure 3-2: Variation of the sound power level radiated by a 6-bladed fan for specific harmonics of the blade passing frequency as a function of the loading harmonic order....38
10 Figure 3-3: Schematic of a simple flat plate exposed to a sinusoidal gust in the free stream of velocityu x Figure 3-4: Example calculation of the Sears function Figure 3-5: Schematic of a simple cambered airfoil exposed to both transverse and longitudinal sinusoidal gusts in a free stream of velocity U Figure 3-6: Computed function Fα ( k ) Figure 3-7: Computed function Ff ( k ) Figure 4-1: Schematic of instrumentation system Figure 4-2: Slip ring mounted on the end of the rotating fan permits the electrical signals from the probes to be transferred to the stationary frame of reference. This arrangement enables direct measurement of the relative incoming velocity fields Figure 4-3: X-fiber-film probe set-up and local coordinate system Figure 4-4: Circumferential mean of the tangential velocity with and without the finger guard in place; 1600 RPM Figure 4-5: Circumferential mean of the tangential velocity with and without the finger guard in place; 1800 RPM Figure 4-6: Circumferential mean of the axial velocity with and without the finger guard in place; 1600 RPM Figure 4-7: Circumferential mean of the axial velocity with and without the finger guard in place; 1800 RPM Figure 4-8: Phase-locked averages of the incoming velocities without the finger guard; 1600 RPM Figure 4-9: Phase-locked averages of the incoming velocities with finger guard; 1600 RPM...63 Figure 4-10: Phase-locked averages of the incoming velocities without finger guard; 1800 RPM Figure 4-11: Phase-locked averages of the incoming velocities with finger guard; 1800 RPM...65 Figure 4-12: Turbulence intensity measured at 1600 RPM...68
11 Figure 4-13: Turbulence intensity measured at 1800 RPM...68 xi Figure 4-14: Auto-correlation functions measured with the finger guard in place; 1600 RPM...72 Figure 4-15: Auto-correlation functions measured without the finger guard in place; 1600 RPM Figure 4-16: Auto-correlation functions measured with the finger guard in place; 1800 RPM...73 Figure 4-17: Auto-correlation functions measured without the finger guard in place; 1800 RPM Figure 4-18: Tangential integral length scales measured with and without the finger guard at 1600 RPM Figure 4-19: Tangential integral length scales measured with and without the finger guard at 1800 RPM Figure 5-1: Incoming velocity field U and V without finger guard at 1600 RPM Figure 5-2: Incoming velocity field U and V with finger guard at 1600 RPM Figure 5-3: Incoming velocity field U and V without finger guard at 1800 RPM Figure 5-4: Incoming velocity field U and V with finger guard at 1800 RPM Figure 5-5: Circumferential mean of longitudinal velocity at fan speeds of 1600 RPM and 1800 RPM with and without finger guard in place Figure 5-6: Circumferential mean of transverse velocity at fan speeds of 1600 RPM and 1800 RPM with and without finger guard in place Figure 5-7: Blade section angle of attack as a function of radial location at 1600 RPM...82 Figure 5-8: Blade section angle of attack as a function of radial location at 1800 RPM...82 Figure 5-9: Longitudinal incoming flow spectra with and without finger guard at 1600 RPM...85 Figure 5-10: Transverse incoming flow spectra with and without finger guard at 1600 RPM...85
12 Figure 5-11: Longitudinal incoming flow spectra with and without finger guard at 1800 RPM...86 Figure 5-12: Transverse incoming flow spectra with and without finger guard at 1800 RPM...86 Figure 5-13: Lift spectra without finger guard at 1600 RPM Figure 5-14: Lift spectra with finger guard at 1600 RPM Figure 5-15: Lift spectra without finger guard at 1800 RPM Figure 5-16: Lift spectra with finger guard at 1800 RPM Figure 5-17: Lift spectra with and without finger guard at 1600 RPM Figure 5-18: Lift spectra with and without finger guard at 1800 RPM Figure 5-19: Comparison of sound power prediction with measurement without finger guard at 1600 RPM Figure 5-20: Comparison of sound power prediction with measurement with finger guard at 1600 RPM Figure 5-21: Comparison of sound power prediction with measurement without finger guard at 1800 RPM Figure 5-22: Comparison of sound power prediction with measurement with finger guard at 1800 RPM Figure 5-23: Sound power level from each strip element without finger guard at 1600 RPM...95 Figure 5-24: Sound power level from each strip element with finger guard at 1600 RPM...95 Figure 5-25: Sound power level from each strip element without finger guard at 1800 RPM...96 Figure 5-26: Sound power level from each strip element with finger guard at 1800 RPM...96 Figure 6-1: Cross-correlation measurement probe set-up Figure 6-2: Cross-correlations measured at 1800 RPM between the transverse velocity fluctuations along the blade span with finger guard in place (reference 1 to 4) xii
13 Figure 6-3: Cross-correlations measured at 1800 RPM between the transverse velocity fluctuations along the blade span with finger guard in place (reference 5 to 8) Figure 6-4: Cross-spectral density measured at 1800 RPM between the transverse velocity fluctuations along the blade span with finger guard in place (reference 1 to 4) Figure 6-5: Cross-spectral density measured at 1800 RPM between the transverse velocity fluctuations along the blade span with finger guard in place (reference 5 to 8) Figure 6-6: Unsteady blade lift cross-spectra computed for each combination of strip elements with the finger guard in place and the fan operating at 1800 RPM (ref. 1 to 4) Figure 6-7: Unsteady blade lift cross-spectra computed for each combination of strip elements with the finger guard in place and the fan operating at 1800 RPM (ref. 5 to 8) Figure 6-8: Net unsteady lift spectra on each strip element Figure 6-9: Net unsteady lift spectra on the blade Figure 6-10: Net unsteady lift spectra calculated by considering only autocorrelations Figure 6-11: Net unsteady lift spectra calculated by considering auto- and crosscorrelations Figure 6-12: Sound power measurement and prediction of the cooling fan operating without the finger guard at 1600 RPM Figure 6-13: Sound power measurement and prediction of the cooling fan operating without the finger guard at 1800 RPM Figure 6-14: Sound power measurement and prediction of the cooling fan operating with the finger guard at 1600 RPM Figure 6-15: Sound power measurement and prediction of the cooling fan operating with the finger guard at 1800 RPM Figure 7-1: A sketch of a backward skewed blade fan Figure 7-2: Sound power prediction for skewed blade fans Figure 7-3: Re-distributed inlet flow field xiii
14 Figure 7-4: Lift spectra developed on the straight and the backward skewed blade Figure 7-5: Photographs of prototype fans Figure 7-6: Comparison of flow rates from the skewed blade fans Figure 7-7: Sound power spectra of the skewed fans at 1600 RPM Figure 7-8: Sound power spectra of the skewed fans at 1800 RPM Figure 7-9: Sound power level reductions by the skewed fans at 1600 RPM Figure 7-10: Sound power level reductions by the skewed fans at 1800 RPM Figure 7-11: Comparison of measured sound power levels with prediction Figure 7-12: Comparison of sound power from the banded fan with the original at 1600 RPM Figure 7-13: Comparison of sound power from the banded fan with the original at 1800 RPM Figure 7-14: Original circular opening and the serrated opening Figure 7-15: Comparison of flow rates from the serrated opening Figure 7-16: Sound power spectra of the serrated opening at 1600 RPM Figure 7-17: Sound power spectra of the serrated opening at 1800 RPM Figure 7-18: Sound power level reductions by the serrated opening at 1600 RPM Figure 7-19: Sound power level reductions by the serrated opening at 1800 RPM Figure B-1: Cross-correlations measured at 1600 RPM between the transverse velocity fluctuations along the blade span without finger guard in place (reference 1 to 4) Figure B-2: Cross-correlations measured at 1600 RPM between the transverse velocity fluctuations along the blade span without finger guard in place (reference 5 to 8) xiv
15 Figure B-3: Cross-correlations measured at 1600 RPM between the transverse velocity fluctuations along the blade span with finger guard in place (reference 1 to 4) Figure B-4: Cross-correlations measured at 1600 RPM between the transverse velocity fluctuations along the blade span with finger guard in place (reference 5 to 8) Figure B-5: Cross-correlations measured at 1800 RPM between the transverse velocity fluctuations along the blade span with finger guard in place (reference 1 to 4) Figure B-6: Cross-correlations measured at 1800 RPM between the transverse velocity fluctuations along the blade span with finger guard in place (reference 5 to 8) Figure C-1: Cross-spectral density measured at 1600 RPM between the transverse velocity fluctuations along the blade span without finger guard in place (reference 1 to 4) Figure C-2: Cross-spectral density measured at 1600 RPM between the transverse velocity fluctuations along the blade span without finger guard in place (reference 5 to 8) Figure C-3: Cross-spectral density measured at 1600 RPM between the transverse velocity fluctuations along the blade span with finger guard in place (reference 1 to 4) Figure C-4: Cross-spectral density measured at 1600 RPM between the transverse velocity fluctuations along the blade span with finger guard in place (reference 5 to 8) Figure C-5: Cross-spectral density measured at 1800 RPM between the transverse velocity fluctuations along the blade span without finger guard in place (reference 1 to 4) Figure C-6 Cross-spectral density measured at 1800 RPM between the transverse velocity fluctuations along the blade span without finger guard in place (reference 5 to 8) Figure D-1: Unsteady blade lift cross-spectra computed for each combination of strip elements without the finger guard in place and the fan at 1600 RPM (reference 1 to 4) xv
16 Figure D-2: Unsteady blade lift cross-spectra computed for each combination of strip elements without the finger guard in place and the fan at 1600 RPM (reference 5 to 8) Figure D-3: Unsteady blade lift cross-spectra computed for each combination of strip elements with the finger guard in place and the fan at 1600 RPM (reference 1 to 4) Figure D-4: Unsteady blade lift cross-spectra computed for each combination of strip elements with the finger guard in place and the fan at 1600 RPM (reference 5 to 8) Figure D-5: Unsteady blade lift cross-spectra computed for each combination of strip elements with the finger guard in place and the fan at 1800 RPM (reference 1 to 4) Figure D-6: Unsteady blade lift cross-spectra computed for each combination of strip elements with the finger guard in place and the fan at 1800 RPM (reference 5 to 8) xvi
17 LIST OF TABLES xvii Table 2-1: Volume flow rates through the radiator Table 7-1: Volume flow rates of skewed fans Table 7-2: Volume flow rates of the banded fan Table 7-3: Volume flow rates of the serrated opening Table 7-4: Overall sound power level and reduction Table A-1: Overview of International Standards for determination of sound power levels of noise sources using enveloping surface methods over a reflecting plane and giving different grades of accuracy
18 NOMENCLATURE xviii a 0 Speed of sound A Exit area of the fan fan a, b n n Fourier series coefficients of sound pressure aλd, bλ D Fourier series coefficients of drag a, b λt λ T B c n Fourier series coefficients of thrust Number of fan blades Complex Fourier series coefficient of sound pressure c L Lift coefficient C D λ Blade chord Complex Fourier series coefficient of drag F α Horlock s function ik ( ) F τ Impulse response function of the airfoil vv ( ) G ω Cross-spectral power density of the transverse turbulent fluctuations vv ( ) H αα ω Gust response function 2 H n Hankel function of the second kind of order n J n Bessel function of the first kind of order n k l l α i () t Reduced frequency ( k = πc l) Gust wave length Instantaneous total lift on the airfoil/blade
19 xix L L W Unsteady lift Sound power level m Order of blade passing frequency sound harmonic ( n= mb) M Mach number M r Component of Mach number in direction of observer M n p ij Q Q R r r 1 a Rotational Mach number ( M = ΩR/ a ) Sound harmonic number Stokian gas tensor Mass source strength Volumetric flow rate Effective radius of action of point source Source to observer distance Distance from observer to rotation center 0 R γδ kr Velocity correlation tensor Se St t T λ Sears function Strouhal number Time Complex Fourier series coefficient of thrust T ij UV, Lighthill s stress tensor Longitudinal and transverse velocities relative to rotating blade
20 xx U Free stream velocity V, V t z v p, u p V tip W m Tangential and axial velocities relative to rotating axis Turbulence velocity fluctuation Fan tip speed Sound power in the m th harmonic W(ω) α δ ΔP ε η Sound power spectrum Angle of attack Projected chord length (= C sinα ) Static pressure rise across the fan Ratio of maximum camber over the half-chord length Coordinate following source θ Angle around rotor ( θ = 0 along x 2 -axis) ρ a ρ Density of air Density perturbation τ Retarded time ( τ = t r/ a0 ) φ φ a Reference angle between observer and zero th blade Non-dimensional flow rate coefficient Φ ij Space-time correlation tensor pp ( ω) Φ Acoustic power spectral density χ Stagger angle ψ Angle around source ( ψ = 0 along x1-axis)
21 ψ a Non-dimensional pressure rise coefficient xxi vv ( ω) Ψ Unsteady lift cross-spectrum vv ( ω) Ψ Net unsteady lift ω Ω * Circular radian frequency Angular velocity of rotor Complex conjugate
22 ACKNOWLEDGEMENTS xxii This work has been supported by Cummins Power Generation, Minneapolis, MN. This support is gratefully acknowledged; in particular, sincere thanks are given to Mr. Daniel J. Kato, Dr. Young Sok Kim and Mr. Paul H. Plahn. I would like to express my deep and sincere gratitude to my thesis committee: Professor Gerald C. Lauchle and Professor Timothy A. Brungart, thesis co-advisors, for their expertise, guidance, and patience; and Professor Dean E. Capone and Professor Gary H. Koopmann for their reviews and valuable inputs in this research. It has been a great honor to work closely with each of them. I would like to express my gratitude to Mr. Dan Rhodes and Mr. Jon Eaton at the Applied Research Laboratory of the Pennsylvania State University for their voluntary help to this project. I wish to thank the staffs of the Acoustics program, Karen Brooks and Carolyn Smith not only for taking care of all the clerical work but also for their friendship. I also would like to thank those closest to me in the Acoustics program, whose presence helped make the completion of my graduate work possible. These are Shawn Johnson, Dr. Ho-Taik Lee, Kiwon Jung and Yongsin Hwang. Special thanks go to Dr. Kang-Duck Ih at Hyundai Motor Company for his support to my study. I am forever indebted to my parents and parents-in-law for their understanding and encouragement when it was most required. I know my late father-in-law, Yong Lee, who passed away right before I started my doctoral study, will be very happy for me in heaven. Finally and foremost, I would like to heartily thank my beloved wife, Mi-Sun, and my cherished son, Tae-Hoon, for their patience and encouragement through the period. It would take another thesis to express my deep love for them.
23 Chapter 1 Introduction 1.1 Introduction Successful efforts to reduce traditional engine noise sources such as the exhaust and intake have heightened the need for tools to predict and reduce engine cooling fan noise. A case in point is the Cummins Inc. line of engine/generator sets. Cummins performed a series of acoustical tests which showed that the cooling fans are the dominant noise sources on this product line. A typical engine/generator set is shown in Figure 1-1. It employs an engine/cooling fan arrangement, similar to that used in road vehicles, except that the fan draws air from over the engine and expels it through the radiator (condenser) rather than vice-versa. Under normal conditions, the Figure 1-1 fan is driven by the engine crankshaft and runs at a fixed speed, 1800 RPM. 1.2 Research Objective Under real-world operating conditions, almost every fan, including the one shown in Figure 1-1, encounters spatially non-uniform, time averaged inflow and turbulence. Therefore, the sound radiation resulting from the fan blades interaction with such inflow is of particular interest and is the focus of this thesis. More specifically, the objective of this thesis is to predict and reduce the discrete frequency and broadband noise from a Cummins 40kW diesel engine cooling fan.
24 2 Figure 1-1: A sketch of the typical Cummins diesel engine generator. A primary source of discrepancy between fan noise prediction and measurement is due to the incomplete description of the fan inflow. This deficiency is addressed in the current research with a blade mounted hot-wire technique that is used to measure the cross-correlation functions of the inflow. This provides a complete description of the inflow (i.e., spatially non-uniform time averaged inflow and turbulence) and, to the best of the author s knowledge, is the first to measure directly, from the rotating probes, the inflow velocity cross-correlation functions.
25 1.3 Thesis Organization 3 In Chapter 1, the fundamental physics of axial flow fan noise is reviewed and the works most pertinent to the subject effort are cited. The review is partitioned into sections on discrete frequency and broadband sources of noise. In Chapter 2, the aerodynamic performance and noise radiated by the subject cooling fan is quantified. The aerodynamic performance is determined by direct measurement of the fan airflow rates in conjunction with the factory supplied fan performance curve. The sound power radiated by the fan, measured using the comparison method, is the means by which its noise is quantified. The theory used to predict the engine cooling fan noise with the measured velocity statistics as input is presented in Chapter 3. Discrete-frequency noise radiation due to a rotating source is considered. Unsteady responses of thin airfoils are discussed. For broadband noise prediction, the unsteady force induced by turbulence ingestion is considered. In Chapter 4, the inlet flow field of the subject fan is scrutinized. A complete description of spatially varying mean flow fields of the subject fan is reported. Detailed incoming flow measurement technique using a blade-mounted rotating probe is described. The phase-locked averaging technique is introduced for the analysis of spatially varying time signal. Characteristics of the incoming turbulence are also presented. The measured time-invariant flow distortions are applied to the prediction of discrete frequency noise in Chapter 5. Influences of transverse and longitudinal gusts to the noise radiation are investigated. Chapter 6 exhibits the broadband noise prediction employing cross-correlation functions of incoming turbulence. Contribution of crosscorrelation functions to the unsteady lift is investigated. Discrete-frequency noise
26 4 reduction of the subject cooling system is reported in Chapter 7. A design process for an optimum skew profile is discussed. Aerodynamic and aeroacoustic evaluations of the prototype fans are reported. Interaction noise between the blade tip and the shroud opening is also explored. Chapter 8 summarizes the results and recommends future works. 1.4 Review of Axial Flow Fan Noise Physics The fundamental aerodynamic sound generation mechanisms of fans as used for industrial purposes are reviewed in this section. Much of the knowledge on fan noise was obtained for the high speed fans of aircraft engine, where contributions from monopole and quadrupole sources are significant. It was shown, however, by Hanson and Fink (1979) that for moderately subsonic flow over thin blade sections, the quadrupole radiation is negligible. Monopole sources are generated by the volume displacements due to the finite thickness of the rotating fan blades. These volume displacements cause periodic changes in fluid mass and thus generate pressure fluctuations in the adjacent field. However, in case of the low to medium speed fans, the phase velocity of these pressure fluctuations is well below the speed of sound, which results in low acoustic radiation efficiency (Neise, 1992). The primary mechanism for acoustic radiation from most subsonic industrial fans is unsteady forces on the rotating blades. Such forces are caused by blade interactions with non-uniform, and possibly unsteady incoming flow. The unsteady forces acting on the acoustic medium act as dipole sources of sound.
27 5 Unsteady forces developed on the rotating fan blades can be either time periodic or random depending on the type of inflow that the blades encounter. Any periodic interaction generates a discrete-frequency force spectrum on the blade. If the periodic interactions occur due to the fan rotation, then the discrete-frequency force spectrum will have components at integer multiples of the shaft rotation rate. Spatially non-uniform inlet flow is the most common source of theses periodic interactions. Meanwhile, when the three-dimensional inlet flow of sufficiently high Reynolds number has distortions in both time and space, the flow is considered turbulent. As the fan blades encounter these distortions, the generated unsteady force and radiated sound have broadband spectra. Discrete-frequency noise radiation from a rotating steady force was first examined by Gutin (1936). This theory considers time-varying force-receiver positions that cause sound due to the Doppler effect. Many authors including Morse and Ingard (1968), Ffowcs Williams and Hawkings (1969), Lowson and Ollerhead (1969), Goldstein (1976) and Blake (1986) have derived expressions for the discrete-frequency sound radiation due to the fluctuating forces on rotor blades. Their derivations are based on the general solution of the inhomogeneous wave equation which was first formulated by Lighthill (1952). Using Lighthill s inhomogeneous wave equation, Curle (1955) showed that stationary surfaces exposed to turbulent flow are equivalent to surface dipole distributions. Ffowcs Williams and Hawkings (1969) extended Curle s solution showing general features of noise radiation by arbitrary moving surface dipoles. Fitzgerald and Lauchle (1984) identified the dominant noise sources of small subsonic electronic cooling fans and made modifications for discrete-frequency noise control. The influences of upstream obstructions to the tonal noise generation of a small
28 6 cooling fan were also investigated experimentally by Washburn and Lauchle (1988) and Chiu et al (1989). Mugridge (1975) applied such discrete-frequency noise theory to the engine cooling fan noise problem. He measured the inlet flow field by a hot-wire probe fixed to the rotor and allowed to rotate with the fan blades. The inlet velocity profile at only a single radial position was utilized however (a detailed flow measurement test set-up description was not published). Mugridge (1976) later investigated the influences of the radiator, cowl, and backplate on automotive engine cooling fan noise. Discrete-frequency fan noise can be reduced by either breaking up the periodic interactions of the fan blades with the incoming flow, or by adding a passive or active noise control device. An example is the skewed blade which is designed to mismatch the centers of lift of successive radial blade elements with the distorted incoming flow. It is recognized that the skewed blade fan provides benefits with respect to both the discretefrequency and broadband noise. The skewed blade also reduces flow losses and drag near the blade tip at transonic speed (Beiler and Carolus, 1999). A fan with uneven blade spacing is another popular discrete-frequency fan noise control measure. The unevenly spaced blade fan disperses the harmonic tones of the blade-passing frequency (BPF). Therefore, it radiates less annoying noise than the regular evenly-spaced fan (Boltezar, Mesaric et al., 1998; Brungart and Lauchle, 2001), although the sound power is not usually changed. Passive noise control devices, such as resonators, can be used to reduce discretefrequency tones, especially those generated by ducted fans. BPF tones that have frequencies below the first acoustic mode of the duct can be reduced by carefully tuned
29 7 resonators. Successful applications of a quarter-wavelength tube to the reduction of the BPF noise of centrifugal blowers were reported by Koopmann and Neise (1980; 1982). Active noise control techniques are also effective for the discrete-frequency fan noise reduction (Koopmann, Fox et al., 1988; Lauchle, MacGillivray et al., 1997). However, due to its high cost, its application appears to be limited at the current time. Longhouse (1976) investigated the noise sources of a half-stage automobile cooling fan. He showed that rotational and non-rotational noise sources dominate in high flow coefficient and low flow coefficient regions, respectively. Longhouse (1977) successfully reduced vortex shedding noise by the use of serrations located on the trailing edges of the blades. He also used rotating shrouds attached to the blade tips in order to prevent flow separation at the tips (Longhouse, 1978). Proper control and reduction of any recirculating flow was emphasized for successful noise control. Fukano and Takamatsu (1986) reported an experimental investigation of the effects of clearance between the blade tips and a surrounding shroud on noise and aerodynamic performance of low pressure axial fans. They found that the broadband noise increased with increases in tip clearance. Likewise, the rotational tones increased with increases in fan eccentricity within the shroud. Kameier and Neise (1997) experimentally investigated the influence of tip vortices on the noise generation of axial turbo machines. Due to the complicated nature of tip vortex flow, no generalities regarding the tip noise mechanism was presented. However, most experimental works on tip clearance effects recommend keeping the tip clearance as small as possible for minimum noise generation and for better aerodynamic performance.
30 8 The fundamental theory of unsteady lift created on thin airfoils subjected to a transverse sinusoidal gust is by Sears (1941). This theory has subsequently been extended to include the influence of longitudinal gusts by Horlock (1968), and angle of attack and camber effects by Naumann and Yeh (1973). They derived closed-form solutions for a single airfoil exposed to two-dimensional flow. These theories have been extended to include three-dimensional effects and the influence of adjacent blades and blade rows by numerous authors. However, the transverse velocity perturbations are the dominant sources of unsteady lift generation in many applications, particularly for low Mach number flow problems. Therefore, the Sears function is still the most widely used in practical applications. Sharland (1964) derived expressions for predicting the broadband noise of axialflow fans due to various mechanisms, and compared the predictions with experiment. He observed a significant increase of the broadband noise when the blade encountered largescale turbulence. He also noted that the noise spectrum due to a stalled fan blade has a low-frequency hump centered roughly at a frequency associated with the frequency of vortex shedding from a bluff body in cross flow. Here, the size of the bluff body is analogous to the size of the stalled flow region. Gordon (1968; 1969) measured the sound power spectrum radiated by a flat strip spoiler mounted inside a pipe at various angles of attack. He observed that the noise spectra due to the stalled spoiler agreed with the findings of Sharland. A stochastic unsteady blade force theory for a rotor exposed to inflow turbulence was developed by Sevik (1968; 1970). He included the interdependence of unsteady forces due to multiple blades by utilizing a two-point velocity correlation function. The
31 9 unsteady forces due to isotropic, homogeneous inlet flow turbulence were modeled and compared with the experimental results that were measured from grid generated turbulence. His model successfully simulated the broadband power spectrum of the unsteady axial rotor forces; however, it failed to predict the humps centered at the harmonics of the BPF. This was explained as being due to the model s neglect of blade rotational effects. Since Sevik s pioneering work, many authors extended his theory. Blake (1986) used asymptotic analysis to show that the humps at harmonics of the BPF are caused by incoming flows having large correlation lengths relative to the blade-toblade separation distance. Conversely, a smooth lift spectrum is expected for flows having small correlation lengths. Jiang et al (1994) improved Sevik s model by incorporating rotational effects and succeeded in showing a spectral hump at the fundamental BPF. Martinez (1996) rigorously investigated the so-called right-shifting phenomenon of the humps in the lift spectra. Based on Blake s (1986) approach, Wojno et al (1999) developed an empirical model applicable to grid generated turbulence. Lysak and Brungart (Lysak, 2001; Lysak and Brungart, 2003) utilized CFD to develop a model to predict the broadband unsteady lift spectrum. While most research has focused on isotropic and homogeneous turbulent inflow, Gavin and Lauchle (Gavin, 2002; Gavin and Lauchle, 2003) developed an unsteady lift model for a rotor exposed to anisotropic turbulence, e.g., like that which occurs in turbulent boundary layers. Their model utilized velocity correlation data determined in a wind tunnel experiment. Sound radiation from rotating non-compact sources was formulated by Farassat and Succi (1983). They developed a rather complete solution of the Ffowcs-Williams and Hawkings equation that is called Formulation 1A. Formulation 1A considers noise
32 10 generation from both the loading and thickness mechanisms. An estimate of the local wall pressure fluctuations on the blades is required to exercise Formulation 1A. Casper and Farassat (2002)) presented a simple solution of the Ffowcs-Williams and Hawkings equation by considering only the loading source term (called Formulation 1B). Formulation 1B yields the same results as Formulation 1A with the thickness noise mechanism neglected. The solution was used to predict the broadband noise radiated from a flat plate exposed to homogeneous turbulence. Casper et al (2003) applied Formulation 1A to the broadband noise prediction from an airfoil in which measured unsteady airfoil surface pressure fluctuations were used. Many efforts have been made by industry to utilize CFD in fan noise analysis. Algermissen et al (2001) used a commercial CFD code to predict the discrete-frequency engine cooling fan noise of a passenger vehicle. The unsteady surface pressure statistics on the blade were calculated from the unsteady Reynolds Averaged Navier-Stokes Equations (RANS solutions), and the Ffowcs-Williams and Hawkings equation was used to predict sound pressure at field points. Tournour et al (2003) utilized a boundary element solver to predict sound radiation by an HVAC radial blower. Lu et al (Submitted 2006) utilized a three dimensional compressible unsteady CFD model to investigate the rotor-strut interaction of a computer cooling fan. Carolus et al (2007) effectively utilized CFD, along with empirical equations, to predict the broadband noise of axial-flow fans.
33 11 Chapter 2 Preliminary Test 2.1 Introduction Any kind of fan noise control measure should be supported by aerodynamic performance evaluations because a reduced-noise fan may not always have optimum aerodynamic performance. However, in many cases the unwanted excessive fan noise may be caused by either the interactions with improperly designed surroundings or suboptimum aerodynamic operating conditions. This chapter is concerned with the aerodynamic and aeroacoustic evaluations of the cooling fan system. 2.2 Engine Cooling System A 559 mm (22 inch) diameter propeller fan having six sheet metal blades is used on a 40 kw diesel generator set provided by Cummins Power Generation. A sketch of the investigated engine cooling system is shown in Figure 2-1. In normal operations the propeller fan is driven by the engine crankshaft via a serpentine belt and runs at a fixed speed of 1800 RPM. However, for this study, the original fan belt has been removed and the fan was driven by an electric motor with a speed controllable pulley. The viscous fan clutch that is widely used in automotive cooling fans is not included in this original cooling system.
34 12 The engine assembly, which is located approximately 10 cm (3.9 inch) away from the fan blade leading edge, interferes with more than half of the airflow entering the inlet face of the fan. Such blockage results in potentially large-scale fan inflow distortions and would most likely force most of the airflow to enter from radial directions. For safety reasons, a finger guard is used. It is rectangular in shape with rectangular perforations. The rectangular shroud guides the airflow to the radiator. The radiator is installed approximately 18 cm (7.1 inch) away from the trailing edge of the fan blades. The shroud has a circular inlet hole, which is placed midway between the leading and trailing edges of the fan. The average tip clearance is 12 mm (0.5 inch). Airflow passing the cooling fan system might be considered similar to that through a sharp-edged orifice. There is no venturi inlet at the opening. A highly curved flow field is expected around the circular inlet opening, and inefficient corner flows inside the cavity appear to be inevitable. Figure 2-2 shows the front and side views of the propeller fan used for this study. The blades are made of 1.6 mm (0.1 inch) thick sheet metal with a constant radius blade profile. The blade chord is 147 mm (5 13/15 inch) and the maximum camber is 18 mm (0.7 inch) at mid-chord. The blades are riveted to a spider at a constant blade angle of 30. The hub-to-tip ratio is 0.42.

35 13 Finger guard Shroud Radiator Engine Figure 2-1: A sketch of the engine cooling fan system. Shroud Blade angle Spider Figure 2-2: A drawing of the cooling fan.
36 2.3 Fan Aerodynamic Performance Flow Rate Measurement The efficiency of the radiator and the volume of the airflow through the radiator determines the heat transfer capacity of a cooling system. Therefore, once the radiator design is fixed, the performance of the cooling system can be represented by the flow rate through the radiator. The radiator installed on the cooling system is 670 mm (26.4 inch) wide by 536 mm (21.1 inch) in height. A 70 cm (27.5 inch) length of rectangular duct was attached at the radiator outlet and is used to measure the flow rate through the radiator. Figure 2-3 shows the flow rate measurement set-up. Axial velocities were measured at 30 points inside the duct using a TSI 1210 AR hot-wire probe. The velocity time signals, which were sampled at 0.3 khz at each measuring point were recorded using Dantec Streamline software. Averages were computed using 1024 data points. Table 2-1 shows the measured flow rates for fan speeds of 1600 RPM and 1800 RPM with and without the finger guard in place. The presence of the finger guard decreases the flow rate by 4% for 1800 RPM, but has little influence at 1600 RPM. Figures 2-4 and 2-5 show the velocity contours measured inside the duct. Higher flow velocities are found in the upper part of the radiator than in the lower part because the bottom of the fan is close to the ground. Low flow velocities in the center of the measurement area are due to the presence of the fan hub.

![[m 3 /s (cfm)] 1600 RPM 1800 RPM With finger guard 3.](/docs-images/89/98946943/images/37-1.jpg "59 (7609) 4.03 (8529) Without finger guard 3.")
37 15 Figure 2-3: Flow rate measurement set-up. Table 2-1: Volume flow rates through the radiator. [m 3 /s (cfm)] 1600 RPM 1800 RPM With finger guard 3.59 (7609) 4.03 (8529) Without finger guard 3.54 (7507) 4.20 (8899)
 and without finger guard (bottom).")
38 Figure 2-4: Velocity fields at the outlet of the radiator; fan speed of 1600 RPM with finger guard (top) and without finger guard (bottom). 16
39 Figure 2-5: Velocity fields at the outlet of the radiator; fan speed of 1800 RPM with finger guard (top) and without finger guard (bottom). 17
40 2.3.2 Performance Curve 18 For a complete fan performance description, seven variables are needed as a function of flow rate: static pressure, total pressure, brake horsepower, motor input power, mechanical efficiency, static efficiency, and sound power level. These performance curves can be obtained by laboratory tests, which of course needed to be performed in accordance with proper standards (Bleier, 1998). Among those curves, static pressure versus flow rate (head-flow curve), is widely used to evaluate fan operating conditions alongside the system resistance curve (White, 1986). The performance curves are usually plotted for constant fan speed. The head-flow curves for the subject fan at 2025 RPM and 2430 RPM were provided by the manufacture and are re-plotted in Figure 2-6. However, the head-flow curve at the actual operating speed of 1800 RPM was not available, so needed to be estimated. The head-flow curves measured at different speeds can be collapsed to a single curve by employing similarity parameters. The non-dimensional fan performance curve is defined by the non-dimensional pressure rise coefficient, ψ a, and the flow rate coefficient, φ a, as defined by : ΔP ψ a = 2 (2.1) ρavtip Qa ϕ a = AfanV (2.2) tip, where ΔP is the static pressure rise across the fan, ρ a is the density of air, Vtip is the fan tip speed, Q a is the volumetric flow rate, and Afan is the exit area of the fan. Figure 2-7 shows the non-dimensionalized fan performance curve that is obtained from the provided
41 curves at 2025 RPM and 2430 RPM. 19 Now, the head-flow curve at 1800 RPM is estimated by dimensionalizing the curve in Figure 2-7, i.e., Figure 2-6 shows the estimated head flow curve at the actual operating speed. Low static pressure rise with high flow rate corresponds to the free delivery. Conversely, high static pressure rise with low flow rate corresponds to stalled conditions. The left side of the inflection point on the graph is considered the stall region. For the present cooling fan operating at 1800 RPM, stall conditions occur at a static pressure higher than approximately 2 inch H 2 O. Because the system resistance curve is not available, the measured flow rate of 8529 cfm is used for the fan operating condition which is approximately the free delivery condition. A little care is required for this approach since the measurement conditions of the head-flow curve may not match the actual fan operating environment. Most headflow curves are measured in a long duct ensuring a uniform inlet flow according to appropriate standards. However, in the present study, the given estimation is considered adequate for understanding the fan operating status.
42 RPM 2025 RPM Static Pressure [inch H2O] RPM (Calculated) AIRFLOW [CFM/1000] Figure 2-6: Head-flow curves at different fan speeds. Pressure coefficient RPM 2025 RPM 1800 RPM (Calculated) Trend Flow rate coefficient Figure 2-7: Non-dimensional head-flow curve.
43 2.4 Noise Characteristics 21 Noise sources due to, for example, the engine, intake manifold, and exhaust system inhibit accurate cooling fan noise assessment because of possible masking. Therefore, the engine was not operated during the fan noise measurements. The fan was driven by a three-phase, 1730 RPM, 7 ½ hp electric motor. The motor was connected to the fan via a speed selector controllable pulley mounted on the motor shaft, a speed loaded pulley mounted on the drive shaft, and a special speed controllable serpentine drive belt running between the two pulleys. Figure 2-8 shows the motor drive system attached to the fan that remains attached to its original axel and operates within the manufacturer-supplied finger guard. The drive belt from the crankshaft has been removed for these tests. As seen in Figure 2-9, the finger guard consists of 3.2x2.0 cm 2 (1.3x0.8 inch 2 ) and 3.2x1.0 cm 2 (1.3x0.4 inch 2 ) rectangular openings. These are expected to cause small, but periodic wakes in the vicinity of the fan inlet. A series of initial noise assessments were performed for the possible noise source identification. A misalignment (8 mm (0.3 inch)) between the shroud inlet hole and the fan-rotating axis was found during the initial examination. However, the succeeding noise evaluations showed little influences due to the misalignment. Therefore, the remaining tests were performed as it is in the original configuration. In order to control the possible secondary flows, various types of cylindrical collars were added to the shroud inlet hole. However, the aerodynamic performance of the cooling system had been so changed that the exact comparisons were not feasible. All the initial test results will not be presented in this thesis, however, they strongly suggested that the discrete
44 22 blade frequency noise is generated by the distorted incoming flow filed caused by the complicated engine assembly and the broadband noise is mainly caused by the temporally fluctuating velocities. One-third octave band and the narrowband sound power of the cooling fan noise were measured for the fan according to ISO 3744 with Grade 3 accuracy (ISO Standard, 1999). A reference sound source from Campanella Associates (RSS-101) was used to correct the environmental conditions. Sound pressures at nine positions around the fan were measured and averaged. Detailed measurement steps are attached in Appendix A. Figures 2-10 and 2-11 show the measured A-weighted one-third octave-band sound power spectra of the cooling fan system with and without the finger guard in place. It shows clearly that the finger guard increases mid-frequency sound power levels. The narrow band sound power was measured in order to scrutinize the influences of the finger guard. Figures 2-12 and 2-13 show the measured narrow-band sound power spectra of the Cummins cooling fan system with and without the finger guard in place again. The measured discrete-frequency noise levels at all harmonics of the blade passing frequency (BPF) are increased up to 5 db in level by the presence of the finger guard. The finger guard also increases the broadband noise but to a lesser degree.


45 23 Figure 2-8: Photograph of the diesel engine modified to accept a variable sheave speed electric drive. The fan may thus be operated alone during acoustic tests, independent of any masking noise sources such as the engine and its exhaust. Figure 2-9: Engine assembly and finger guard.
46 Sound Power, 1600RPM 90 Lw [dba re 1pW] Without Finger Guard With Finger Guard Frequency [Hz], 1/3 Octave Figure 2-10: A-weighted One third Octave Band Sound Power Spectra due to the engine cooling fan operating at 1600 RPM, with and without the finger guard in place. 100 Sound Power, 1800RPM 90 Lw [dba re 1pW] Without Finger Guard With Finger Guard Frequency [Hz], 1/3 Octave Figure 2-11: A-weighted One third Octave Band Sound Power Spectra due to the engine cooling fan operating at 1800 RPM, with and without the finger guard in place.
47 Sound Power, 1600RPM Without Finger Guard With Finger Guard Lw [db re 1pW] Frequency [Hz] Figure 2-12: Narrow-band sound power spectra due to the engine cooling fan operating at 1600 RPM, with and without the finger guard in place Sound Power, 1800RPM Without Finger Guard With Finger Guard Lw [db re 1pW] Frequency [Hz] Figure 2-13: Narrow-band sound power spectra due to the engine cooling fan operating at 1800 RPM, with and without the finger guard in place.
48 Chapter 3 26 Theoretical Development 3.1 Introduction This chapter presents the theoretical developments utilized to predict the discrete frequency and broadband noise radiated by the subject Cummins 40 kw diesel engine cooling fan. The source of both types of noise is the unsteady forces acting on the fan blades. The discrete frequency noise radiation from the fan due to periodic blade unsteady force fluctuations is presented initially. Then, the thin airfoil theory that enables the blade unsteady forces to be predicted from the measured inflow velocities is presented. Lastly, the correlation approach for predicting the fan blade unsteady forces and resulting sound radiation due to their interaction with the inflow turbulence is discussed. 3.2 Fan Discrete-Frequency Noise Radiation Lowson s (1969) theory for predicting the sound radiation from a fan has its roots in Lighthill s acoustic analogy (1952). This will be the starting point for the development of the theory used to predict the discrete frequency noise from the subject Cummins fan. If mass injection is included in the continuity equation and body forces are included in the momentum equation, then Lighthill s inhomogeneous wave equation for the fluctuating density ρ is:
49 27 ρ ρ T Q Fi ij a 2 0 = +, 2 t xi t xi xi xj (3.1) 2 where Tij ρvv i j σij ao ρδij ( δij 1 fori j; δij 0 for i ) = + = = = j is the Lighthill stress tensor which describes a quadrupole source that is due to turbulent velocity fluctuations v i and fluctuating stresses σ ij. The vector F i is the force per unit volume acting on the fluid by any surfaces that are present in the fluid; this is a dipole-type of source. The scalar Q is the mass source strength per unit volume for any sources or sinks that are present in the fluid or surfaces; its radiation is monopole-like. Cartesian coordinates are denoted x i (i=1,2,3), and a o is the sound speed. Conventional tensor notation and summation conventions are used. The solution of the wave equation for the unbounded fluid is well known. Writing the right-hand side of Equation 3.1 as g( y ) : 1 1 r ρ = g y, t dy 2 4π a 0 r a0 1 g = dy, 4π a r 2 0 (3.2) where r is the distance from source to observer, and y is the coordinate of the source position. The sound heard at any time t was actually generated at the retarded time τ = t r a 0 and has traveled a distance r at the speed of sound. The square brackets imply evaluation of their contents at this retarded time. The expression for radiation by a fluctuating mass source (only) can be written as: 1 1 Q ρ = dy. 4π a r t 2 0 (3.3)
50 In the same way, the sound generation by fluctuating forces is given by: F i ρ =. 2 dy 4π a 0 r yi (3.4) It is convenient to change the Equation 3.4 differentiation from source to observer variables. Applying the chain rule and the divergence theorem, Equation 3.4 can be converted to 1 Fi ρ = dy 4π a x r, (3.5) 2 0 i which is an expression for the sound radiation by a distribution of fluctuating forces. The quadrupole noise source is not considered in this study because for moderately subsonic flow over thin blade sections, it is known that the quadrupole noise source term negligible (Hanson and Fink, 1979). Now, consider the sources that are in motion. A moving frame of reference on the rotor is convenient to specify the forces. Suppose coordinates measured in this frame are defined by η and the origin of these coordinates is moving with velocity the two coordinate systems are related by, o am o T ij is. Then, η = y Ma t. (3.6) However, since the solutions of the wave equation, Equation 3.3 and 3.5, are obtained in the retarded time, for the coordinate transformation from fixed to moving axes, it is pertinent to use the relation (Lighthill, 1952): η = y+ Mr. (3.7)
51 and, 29 where ( ) M = M x y r r i i i d η = dy, (3.8) ( M ) 1 r is the component of the convection Mach number in the direction of the observer. Then, for mass sources in motion can be obtained from Equation 3.3: 1 Q t ρ = dη, 2 4π a 0 r( 1 Mr ) (3.9) and similarly for the fluctuating forces in motion, Equation 3.5 may be rewritten as: 1 F i ρ = d. 2 η 4π a0 x i r( 1 Mr) (3.10) The derivative xi is operating on both an integral over η and a retarded time operator, both of which are functions of x i. For any function f (): t ( ) = ( ) f t f t r a 0. (3.11) The partial derivative of f with respect to xi, keeping η constant, is determined using the chain rule (Lowson, 1969): f xi yi 1 f [ f ] =. x ( ) x ( ) r( 1 M i i r ) a0 t η η (3.12) The first term in Equation 3.12 is proportional to 1/r where r is the distance of the observer from the source, while the second is proportional to 1/λ. Thus, in the far-field the first term is negligible. Using Equation 3.12, the acoustic far-field approximation for Equation 3.10 can be written as:
52 30 1 xi yi F i ρ = dη 2 4π a 0 a0r( 1 Mr) t r( 1 Mr), (3.13) where t is a differential following the source. Equation 3.13 is the general expression for the sound field from any force source in arbitrary motion. Equation 3.13 is applied to the prediction of fan noise where the sources are harmonic forces. The rotor hub is assumed to be stationary. Consider the radiation from a point force at radius R, rotating at angular velocity Ω as shown in Figure 3-1. With a point source assumption, the integral in Equation 3.13 can be eliminated and using the state equation p = a ρ, Equation 3.13 can rewritten as: 2 o xi yi F i p =. ar 0 ( 1 Mr) t 4π r( 1 Mr) (3.14) Note that Equation 3.14 must be evaluated at retarded time.

 2πω ω xi yi Fi inωt cn = an + ibn = e d π ar 0 0 ( 1 Mr) t 4πr( 1 Mr) ( ) Changing variables back to the retarded timeτ, dt = M dτ gives: 1 r c n 2 ω = π")
53 31 x 3 Drag Thrust r R θ Ω Observer r 1 ψ x 2 x 3 φ x 2 x 1 Figure 3-1: Coordinate system used for rotor force and radiation calculations. Since the fan blade produces periodic forces, the sound pressure radiation due to a rotating simple source is expressed well using the complex Fourier series: = n in t, (3.15) n= p c e ω where ω is the radian frequency and c n is the complex Fourier coefficient, which is: t (3.16) 2πω ω xi yi Fi inωt cn = an + ibn = e d π ar 0 0 ( 1 Mr) t 4πr( 1 Mr) ( ) Changing variables back to the retarded timeτ, dt = M dτ gives: 1 r c n 2 ω = π ar 0 0 t 4πr( 1 Mr ) πω xi yi Fi inωτ ( + r a0 ) e dτ, (3.17)
54 and integrating by parts yields: 32 c n 2 ω = π r a Mr r r πω inω Fr Fi Mi xi yi inωτ ( + r a0 ) Mr e dτ, (3.18) ( ) where F = F x y r is the component of force in the direction of the observer. r i i i Because of the factor r in the denominator, the second term is important only in the acoustic near field. The far-field result for the Fourier coefficients becomes simply: c n 2 ω = 2 4π r a 0 0 πω inω Fr inωτ ( + r a0 ) e dτ. (3.19) Now, it is necessary to specify the forces on the rotating blades. We define fluctuating thrust and drag forces T and D as shown in Figure 3-1 with x 1 along the rotor axis. Since the rotor blade encounters periodic velocity fluctuations, the fluctuating thrust and drag forces are decomposed into the ordinary Fourier series as well (Hilderbrand, 1976): T( θ ) = a0 + a cos λθ + b sin λθ, (3.20) T λt λt λ = 1 D( θ ) = a0 + a cos λθ + b sin λθ, (3.21) D λd λd λ = 1 where θ is the angle defined in Figure 3-1 and λ gives the spatial loading harmonic order. For a fan blade rotating at 1800 RPM, λ=1 corresponds to 30 Hz, λ=2 corresponds to 60 Hz, etc. The ordinary Fourier coefficients are determined by:
55 33 2π 1 a0t = T( θ) dθ, 2π a λt 1 = π 2π 0 2π 0 0 T ( θ ) cos λθdθ, 1 bλt = T( θ ) sin λθdθ. π (3.22) The thrust and drag can be simplified further if the complex Fourier series is employed: T D ( θ ) T e iλθ, = (3.23) λ = λ ( θ ) D e iλθ, = (3.24) λ = λ where the complex Fourier coefficients T λ and D λ are related to the ordinary Fourier coefficient by ( T T) 2 ( ) T = a + ib λ λ λ T = T = a ib λ λ λt λt 2, (3.25) where * represents the complex conjugate. The complex Fourier series coefficients can be obtained using the orthogonality of the trigonometry functions. For integers n and λ, inx i x 0 for n λ 2 π for n = λ. 2π 2π λ in ( λ ) x e e dx= e dx= (3.26) 0 0 Now, multiplying both sides of Equation 3.23 by e inx gives Using the orthogonality relation, ( θ ) ( λ ) θ λ inθ in T e = T e. (3.27) 2π 0 ( ) λ = inθ T θ e d θ = 2 π T n. (3.28)
56 Then, 34 2π 1 iλθ Tλ = T( θ) e dθ, λ = 0, 1, 2,... 2π ± ± 0 (3.29) Equation 3.29 along with Equation 3.23 defines the fundamental equation of the continuous-time Fourier transform. The coefficients for drag can be expressed the same way. From the geometric considerations of Figure 3-1, F = T, Dsin θ, Dcosθ i x y = x, x Rcos θ, x Rsinθ i i i = 1, 2,3, respectively. (3.30) Thus, x1t x2d F r = sinθ r r x2r r ~ r1 cosθ. r 1 (3.31) Using Equations 3.30 and 3.31, Equation 3.19 becomes: c n inω = + 2 4π ar r r 2π xt 1 λ x2dλ in ( λθ ) inαcosθ sin θ e dθ, (3.32) λ= whereα = Mx2 r1 and M =ΩRa0 is the rotational Mach number of the fan which is the measure of the acoustic radiation efficiency from the source. The integral in Equation 3.32 can be expressed in terms of Bessel functions using the identities: 2π 0 2π 0 ( θ cosθ) ( ) in z n e dθ = 2πi J z in ( θ zcosθ) n n e sinθdθ = 2 πi Jn ( z). z n (3.33) The radiation from a single fan blade can then be written as:
57 35 inω n λ xt 1 λ n λ D nmx λ 2 cn = ( i) Jn λ. 2π ar 01λ= r1 n M r1 (3.34) This is the fundamental equation for sound radiation due to rotating blade forces. With modern computational methods, it is possible to calculate Equation 3.34 efficiently. However, since negative λ 's have little physical meaning, it is preferable to express Equation 3.34 in terms of only positive λ 's: c n n λ xt 1 λ n λ D λ ( i) Jn λ inω λ = 0 r1 n M = 2π ar 01 n+ λ + 1 xt 1 λ 1 n + λ + 1 D λ 1 ( i) J + n+ λ + 1 λ = 0 r1 n M nωx1 ( ) ( n λ 1) TJ 2 n + i TJ, λ λ λ λ n+ λ ar i 01 = λ = 0 2π 1 λ ( n λ ) DλJn λ + ( i) DλJ n+ λ Rr 1 (3.35) where λ = λ 1, and the argument of all of the Bessel functions is nmx r. 2 1 Let For B blades, harmonics which are not integral multiples of B will cancel out. n = mb, then c m mbωx TJ i TJ 1 λ ( ) ( mb λ 1) 2 λ mb λ + λ mb+ λ i ar 01. (3.36) λ= 0 2π 1 λ ( mb λ ) D J + ( i) D J = Rr 1 λ mb λ λ mb+ λ The λ = 0 condition corresponds to the case when only steady forces exist on the fan. Then Equation 3.34 becomes: c m ( ) mb 1 i n Ω xt D mbmx 2 = JmB, (3.37) 2π ar r M r 0
58 which is the same result obtained by Gutin (1936). 36 An important metric in the description of an acoustic source is the overall acoustic power that it radiates. If the sound pressure for the th m harmonic at any field point is given, then the power W m is given by integrating the mean-square pressure in that harmonic is given by a space-time integral of the mean-square pressure around the source, i.e., 2 π 2π 2 1 p 1 c m m 2 1 T ρ0a0 2 ρ 0 0 0a0 W = dadt = r sin ψ dψdφ, m (3.38) where φ is the rotational angle measured about the axis of the source andψ is the azimuthal angle measured over the top of the source, Figure 3-1. The factor ½ is the result of the time integration and corresponds to the root mean square value of sinusoidal pressure fluctuations. Because of axisymmetry, the mean-square value of the fluctuating pressure will be independent ofφ; thus, W m π 2 π r1 2 = cm sin ψ dψ. ρ a (3.39) Equation 3.39 has been evaluated for the Cummins 40 kw diesel generator engine cooling fan for the case where both thrust and drag are calculated from thin airfoil theory (discussed in Section 3.3) in conjunction with the experimentally measured inflow. Figure 3-2 shows the sound power radiated by individual loading harmonics ( λ) at specific harmonics ( m) of the BPF of the fan due to a unit amplitude blade lift spectrum. The computations show that for each multiple of the BPF, only a limited range of loading harmonics contribute to the sound radiation. For instance, loading harmonics above the
59 tenth produce very little noise at the first harmonic of the BPF, where m =1. The sound power peaks atλ = 6 which corresponds to the number of fan blades, as expected. For the second harmonic of the BPF, the 12 th loading harmonic contributes most to the sound power; again, as expected because mb = 12. Here, the order of the leading Bessel function in Equation 3.36 is zero and the function is of maximum value. Steady loading ( λ = 0 ) which is the governing mechanism of Gutin noise contributes very little to the current fan noise radiation as expected. Figure 3-2 is useful in determining mesh sizes in CFD computations as well. The Nyquist theorem (Bendat and Piersol, 1980) applies spatially in this case. At least two nodes per wave are required to the Fourier decomposition and the spatial mode corresponds to the number of waves. The highest spatial mode that contributes to the tenth harmonic of the BPF is approximately the 80 th. Therefore, in order to predict the noise radiation without aliasing up to the tenth harmonic of the BPF, at least 160 nodes along each circumferential position are required. The same principle applies to determining sampling rates for experimental test settings. 37
60 m=1 m=2 m=4 m=6 m=10 80 Lw [db re 1pW] Spatial mode λ Figure 3-2: Variation of the sound power level radiated by a 6-bladed fan for specific harmonics of the blade passing frequency as a function of the loading harmonic order. 3.3 Thin Airfoil Theory In axial-flow turbomachines, a rotor blade moves both spatially non-uniform, time averaged inflow and turbulence. The former give rise to cyclic unsteady pressure, lift and drag fluctuations on each blade where the turbulence generates broadband unsteady forces on the blades. The linear aerodynamic unsteady theories consider weakly nonuniform flow around non-lifting thin bodies placed parallel to the upstream mean flow. The mean flow is assumed to be uniform and the unsteady disturbances are small so that in the equations of motion their products can be neglected. In linear unsteady aerodynamics, the analysis of weakly rotational flows is the equivalent to that of an
61 39 oscillating body in a uniform mean flow but with different boundary condition at the body surface. The development of these theories is reviewed by Attassi (1993) and the highlights most pertinent to the subject fan noise research are discussed in the following Flat Plate Response The problem of the unsteady lift created on a flat plate exposed to a sinusoidal gust in the free stream is shown schematically in Figure 3-3. The upstream gust velocity perturbation is taken to be: ( ) ( ) i t x U v x, t V e ν =. (3.40) p p If the wavelength of the gust is l, the frequency is ν at which the waves pass any point of the airfoil, i.e., ν = 2 πu l. (3.41) ĵ î U = U iˆ+ v ˆj p Figure 3-3: Schematic of a simple flat plate exposed to a sinusoidal gust in the free stream of velocity U.
62 Sears (Sears, 1941) derived the following analytical expression for the lift per unit span under weakly non-uniform flow conditions: cl C i t L = ρ UVSek p ( ) e ν, (3.42) α 2 where c / α is the blade local lift-curve slope(batchelor, 1967), C is the blade chord L length, ρ is the fluid density, and Se( k ) is the Sears function: 40 ( ) Se k 2 = 2 2 π k H0 k ih1 k ( ) ( ), (3.43) 2 2 H 0 ( k ) H1 ( k ) where k = νc 2U = πc l is the reduced frequency, with and being Hankel functions of the second kind of orders 0 and 1, respectively. Figure 3-4 shows the real and imaginary parts of the Sears function as a function of the reduced frequency k. It is seen that as k increases, the magnitude of the lift decreases continuously. At low reduced frequency, the phase of the Sears function first lags behind the gust phase and then leads it by a progressively greater amount. The overall lift acts at all times at the quarter-chord point of the airfoil.
63 41 Figure 3-4: Example calculation of the Sears function Cambered Airfoil Response Unsteady forces due to longitudinal as well as transverse velocity perturbations created on cambered airfoils operating at a small angles of attack were considered theoretically by Horlock (1968) and in succession by Naumann and Yeh (1973). Figure 3-5 shows a schematic of the problem addressed.
64 42 ĵ î î U = U + u i + U + v ˆj ( ) ˆ p ( α p) Figure 3-5: Schematic of a simple cambered airfoil exposed to both transverse and longitudinal sinusoidal gusts in a free stream of velocity. U Similar to the flat plate problem, longitudinal and transverse flow perturbations can be written as: u v p p iν ( t x U ) ( x, t) = U pe iν ( t x U (, ) ) x t = V e. p (3.44) For a thin airfoil, consider the mean camber line to be parabolic: 2 ( x ) y = ε + 1, (3.45) where ε is the ratio of maximum camber-over-the half-chord length. By applying the no-slip condition of viscous Newtonian fluid mechanics to the tangential streamline corresponding to the cambered foil, Naumann and Yeh (1973) obtained a closed form solution for the unsteady lift:
65 43 L = L + L + L t cl C iν t where L1 = ρ U VpSe( k ) e α 2 cl C iν t 4 L2 = ρ U U pεff ( k) e ; Ff ( k) = F( k) + J1( k) α 2 k cl C iν t L3 = ρ U U pαfα( k) e ; Fα( k) = Jo( k) + ij1( k) α 2 J1( k) J1( k) Fk ( ) = Tk ( ) Jo( k) ij1( k) Jo( k) + ij1( k) ; k k H ( k) + ih ( k) Tk ( ) =. H ( k) + ih ( k) (2) (2) o 1 (2) (2) o 1 (3.46) The unsteady lift is shown to be the sum of three terms: 1) due to the transverse gust; 2) due to camber and the longitudinal gust; and 3) due to angle of attack and the longitudinal is also known as Horlock s function, (Horlock, 1968). gust. The function Fα ( k ) T( k ) Figure 3-6 and 3-7 show the real and imaginary parts of F ( k ) α and F ( k ), f respectively. Note the magnitude of L 2 and L 3 are closely related with ε and the angle of attack, respectively. For comparison, let us divide the magnitudes of those forces by L : 1 L U F 2 p f = ε L V Se 1 L U 3 p Fα = α L V Se 1 p p. (3.47) For high reduced frequency gusts, which correspond to small wavelength, three functions, Se, F f, and F α, can be shown to be of the same order of magnitude, thus,
66 44 L L L L U ~ ε V p p U ~ α V p p. (3.48) The ratios of maximum camber-over-the half-chord length for most propeller fan blade profiles are of the order 0.1. The value for the subject Cummins fan blade is 0.2. Many propeller fans operate at near free delivery conditions where the blade angles of attack are very small. Furthermore, in many cases the transverse and longitudinal velocity fluctuations are of the same order of magnitude. As a result, the blade unsteady lift may be predicted accurately for many low pressure axial flow fans by considering only the transverse velocity fluctuations.
67 45 Figure 3-6: Computed function Fα ( k ). Figure 3-7: Computed function F f ( k ).
68 3.4 Correlation Analysis of Unsteady Force Fluctuations 46 This section summarizes the classic analysis for unsteady thrust which was originally presented by Sevik (1968; 1970). Time-random unsteady forces on a blade surface are mainly caused by the incoming turbulent velocity fluctuations. However, when the blade encounters flow that is coherent with itself over significant spatial scales neighboring blades may experience a common velocity-induced fluctuation. This affects the unsteady force generation interdependently. Such induction effects can be accounted for by using correlation analysis of the incoming flow field. The analysis is based upon a rotor fixed coordinate system. The rotor blades are discretized into imaginary strips, two of which are named α and β. The unsteady lift on a strip element is obtained by considering the correlations of the incoming turbulence over all the other strip elements. Tensor notations indicating location and direction are used to express the turbulent velocity fluctuations. Similar to Sevik s notation, subscripts are used to denote the direction along one of the coordinate axes, whereas superscripts are used to denote the rotor blade element involved. For example: () β (1) u k t is the turbulent velocity fluctuation in direction k, that is encountered by blade element β at time t. F ik ( t, τ ) (2) is the impulse response function; indicating the lift generated by blade strip element α in direction i at time t due to a unit amplitude turbulent velocity fluctuation which encounters blade strip β in direction k at a time delay τ.
69 () α (3) l i t is the total lift on blade strip element α in direction i due to the incident turbulent velocity fluctuations plus the induced effects caused by other blades. This is determined by the following convolution integral: 0 β () t = F ( τ ) u ( t τ ) dτ, α li ik k (3.49) where α, β=1,2,3,..n and i, k = 1,2,3. Einstein s summation convention is implied by the repeated indices. The correlation tensor of the lift is found in the usual way. The space-time correlation tensor for unsteady lift on any two strips is given by the expected value of their product: α β { l ( t) l ( t + τ )}. Φ ij = E i j (3.50) Assuming that the aerodynamic transfer functions are a result of stationary and ergodic processes, Equation 3.50 can be rewritten via a temporal average: 47 T 1 αγ Φ ij = lim Fik k T T γ βδ δ ( τ ) u ( t τ ) dτ F ( τ ) u ( t τ + τ ) dτ dt jr 2 r 2 2 (3.51) In Equation 3.51 the integration variables are distinct and so we can rearrange the integrands such that: Φ ij 1 = lim T T T F αγ ik We define the velocity correlation tensor as: βδ γ δ ( τ ) F ( τ ) u ( t τ ) u ( t τ + τ ) dτ dτ dt 1 jr γδ 1 Rkr 1 2 k r T T T γ δ ( τ + τ τ ) = lim u ( t τ ) u ( t τ τ )dt 0 k 1 r (3.52), (3.53)
70 By changing the order of integration in Equation 3.52 and after substituting the correlation function of turbulent velocity fluctuation we arrive at: 0 0 βδ γδ ( τ ) F ( τ ) R ( τ τ + τ ) αγ Φij = Fik 1 jr 2 kr 2 1 dτ1dτ 2. (3.54) The two sided power spectrum of unsteady lift is obtained by taking the Fourier transformation of Equation 3.54: 48 Ψ l li j 1 2π αγ βδ γδ iωτ ( ω ) = F ( τ ) F ( τ ) R ( τ τ + τ ) dτ dτ e dτ 0 0 ik 1 jr 2 kr (3.55) The term in braces is still the basic convolution integral established by Equations 3.49 and However, the turbulence correlation function is assumed to be based upon stationary and ergodic processes so it will be independent of τ 1 and τ2. This allows the correlation function to be integrated separately over the delay time τ, Ψ l li j 1 2π αγ βδ iω ( τ1 τ 2 ) γδ iω ( τ τ 2+ τ1) ( ω ) = F ( τ ) F ( τ ) e dτ dτ R ( τ τ + τ ) e 0 0 ik 1 jr kr 2 1 dτ (3.56) The term in braces is recognized as the Fourier transformation of the aerodynamic response functions. However, since τ 1 is positive in the exponential, the transformation yields the complex conjugate of the first frequency response function: ( ω) { H } { H } G ( ω) Ψ = αγ βδ γδ lil j ik jr kr ( ) ( ) αγ αγ iωτ where Hik ω = Fik τ e dτ, 0, (3.57) and
71 49 γδ 1 γδ iωτ ( τ2+ τ1) Gkr ( ω) = Rkr ( τ τ2 + τ1) e dτ π 1 = π ( τ) γδ iωτ R e dτ. kr (3.58) Here H ( ω ) is the frequency domain gust response function and G γδ ( ω) ik kr is the single sided cross-power spectral density of the turbulent velocity fluctuations. Equation 3.57 is the fundamental expression that must be evaluated. This includes implied summations ( due to repeated subscripts k and r ) across all three Cartesian components of the turbulent velocity fluctuations. However, an additional implied summation is required due to repeated indices ( γ and δ ) in the superscripts. This later summation is designed to account for the contribution to the lift spectrum caused by induced velocities striking the strips of interest ( α and β ). These induced velocities are generated when turbulence strikes other portions of the rotor ( γ and δ ), resulting in unsteady bound vortices at those locations and induced circulation striking the strips of interest. For some special cases, such as isotropic and homogeneous turbulence, analytic turbulence models can be applied to Equation However, in most cases, extensive incoming turbulence data are necessary to evaluate Equation As discussed in the previous section, the transverse velocity fluctuation dominates the unsteady lift for many low pressure axial flow fans. Therefore, Sears function (Sears, 1941) is used as the gust response function and α α αα cl α C ωc α Hvv ( ω) = ρu Se δr α, (3.59) α 2 2U
72 where c L α is the blade local lift-curve slope, and δr is the width of each strip 50 element. Indexed C and U are the respective blade chord and incident velocity at strip α. The argument of the Sears function is the reduced frequency. The cross-spectral power density function of the transverse turbulent velocity fluctuations which are normal to the fan blade is given by Then, Equation 3.57 can be rewritten as: 1 i Gvv ( ω) = Rvv ( τ) e ωτ dτ. π (3.60) ( ω) { H } { H } G ( ω ) Ψ = αα ββ vv vv vv vv. (3.61) Equation 3.61 shows the lift cross-spectrum between radially-located strip elements α and β due to the local gust response functions and the cross-spectrum of the local blade normal velocity fluctuations. Because of the random nature of turbulent flow, the Doppler shift due to the source rotation has little affect on the broadband sound pressure spectrum (Lauchle, 2007). For a compact subsonic fan, the power spectral density at field point can be easily calculated by: where Ψ vv ( ω) 2 2 k cos ψ Φ = Ψ, (3.62) pp o ( r, ψ, ω) ( ω) π r1 is the net unsteady force on the fan that can be determined by assuming the hub to be rigid, and summing the complex components of the lift cross-spectra between all combinations of strips α and β. vv r 1
73 The sound power spectrum can be calculated by integrating the auto power spectrum around a spherical surface analogous to Equation W 2 π r pp 1,, sin. 0a d (3.63) 0 0 π ω ψω ψψ ρ 1 ( ) = Φ ( r ) Equation 3.63 can be simplified further. Since the mean-square sound pressure of a dipole averaged over a spherical surface in the far field is one-third of the square of the peak pressure amplitude, the sound power spectrum can be easily calculated without surface integration by (Blake, 1986): W ( ω) 2πr 2 2 ko = Ψ 24πρa 1 Φ pp 1 = 3 ρa o vv ( r, ψ 0, ω) o ( ω). (3.64)
74 52 Chapter 4 Characterization of the Incoming Flow Field 4.1 Introduction As discussed in the previous chapter, the fluctuating force on the fan blade is the dominant noise source for the current cooling fan. Detailed incoming flow fields in at least two dimensions are necessary to utilize the unsteady thin airfoil theories. For incoming flows having well-defined streamlines, two-dimensional flow fields might be scanned on the upstream side of the fan using an appropriate flow measurement probe, such as a hot-wire, Pitot-static tube, or LDV device. Actual velocities entering the fan blade are obtained by transforming the velocities measured in the stationary coordinate system to the rotating frame. In the current cooling system, where space is very limited, it would be very difficult, if not impossible, to measure the fan inflow field using the conventional, stationary hot-wire method. Instead, the fan inflow was measured extensively with two-component x-type hot-film probes attached very close to the leading edge of a rotating blade. Details concerning this measurement method and the results are presented in this chapter. 4.2 Experimental Apparatus The incoming flow field was measured relative to the fan by rotating x-fiber film probes (Dantec 55R51) fixed to one of the blades. A schematic of the instrumentation
75 53 system is shown in Figure 4-1. An 8-circuit slip ring (Michigan Scientific S Series) was mounted on the end of the shaft to transmit the voltage variations from the x-fiber film probes to Dantec Constant Temperature Anemometer (CTA) modules and StreamWare data acquisition software. The fan speed was monitored using the pulse signals from the optical sensor acquired through an Agilent 34410A digital multimeter. An optical sensor (Monarch SPS-5) was placed on the top of the engine, which enabled the recording of time-synchronous velocity data. Ambient fluid temperature was acquired using a temperature probe (Dantec 90P10) attached to the Streamline Frame and was used to correct the CTA output voltage. An A/D board from National instrument (AT-MIO- 16E1) was used to decode the voltage time signals. Figure 4-2 shows a photograph of the slip ring mounted on the spider of the fan. The slip ring was located on the outlet face of the fan as to avoid any upstream aerodynamic influence due to its presence. The maximum resistance variation across the slip ring contact is 0.1Ω. The slip ring was included in the hot-wire circuits whenever the probes were being calibrated using Dantec s integrated calibration system (Dantec Dynamics, 2004; Jørgensen, 2005). A fourth-order polynomial curve fit was used for calibration. The linearization errors of the polynomial curve fit were less than 0.5%. (Bruun, 1995) Figure 4-3 shows the x-probe set-up and coordinate system. It is very important to place the x-wires normal to the radial direction for proper measurements of the tangential and axial velocities as shown in Figure 4-3. The axial and tangential velocities relative to the rotating frame are measured simultaneously. The radial velocity was assumed to be small compared with the other velocity components. Since it would rotate with the fan, the probe holder system was designed to be as light as possible. A hollow
76 54 alloy rod was used to traverse the probe along the blade span. The hot-fiber probes were securely installed in a custom made hollow alloy probe holder. The crossed rod clamp (Siskiyou CR-03), which has two degrees of freedom, was used to align the probe parallel to the rotating plane. The distance between the leading edge of the blade and the probe was 1 cm. A blade was divided into nine equal size strip elements for a single probe measurement. For cross correlation measurements, eight equal size strip elements were used due to size limitations for the probe holder. The dynamic unbalance that was caused by the probe holder being attached to the blade was measured and corrected for by adding precisely tuned correction weights to the corresponding locations on the opposite blade. The velocity data measured by this setup is comparable to that measured by a stationary probe in close proximity to a fixed airfoil as in a wind tunnel experiment. The present method has an advantage in that various wing theories in aeronautics can be applied directly to the rotating fan blade. However, velocity time data contain spatial variations along with temporal fluctuations. It is necessary to decompose the signal into the periodic non-uniform variation and the random turbulence component. The phaselocked averaging technique was used to analyze the data and will be discussed in detail in the next section.

77 55 Optical Sensor Multimeter; Agilent 34410A Slip ring X-fiber probes Temperature probe Display screen Computer; Pentium III 850Mhz StreamWare A/D Board; National Instruments AT-MIO-16E1 SCB 68 Dantec Streamline 90N10 Frame Figure 4-1: Schematic of instrumentation system.


78 56 Figure 4-2: Slip ring mounted on the end of the rotating fan permits the electrical signals from the probes to be transferred to the stationary frame of reference. This arrangement enables direct measurement of the relative incoming velocity fields. Figure 4-3: X-fiber-film probe set-up and local coordinate system.
79 4.3 Phase-Locked Mean Flow Field 57 As discussed in section 3.2, the harmonic unsteady force that is caused by the periodic interactions of the fan blades with non-uniform spatial flow generates the discrete-frequency tones of the cooling fan. The thin airfoil theories utilize the relative velocities entering the blades. Therefore, the velocity data measured in the rotating frame could be directly applied to the theory. However, incoming flow velocities measured by a rotating probe contain not only periodic variations due to the spatial distortion, but also random velocity fluctuations (turbulence). Therefore, it is necessary to separate the periodic components from the turbulence. The incoming velocity fields were measured with and without the finger guard in place at fan speeds of 1600 RPM and 1800 RPM. An x-fiber-film probe (Dantec 55R51) was used to measure the velocities entering each of nine strip elements. Data at 240 points along each circumference were taken at the sampling rates of 6.4 khz for 1600 RPM and 7.2 khz for 1800 RPM which were sufficient to predict the sound radiation up to the 10 th BPF. An optical sensor was used to trigger the data acquisition where three hundred (300) velocity records for each strip location were measured synchronously in time and space. The phase-locked averaging technique is widely used to analyze flows for which the mean flow contains very slow variations with time that are not turbulent in nature (Wilcox, 1993). In the current measurement, the slow variations are due to the spatial inhomogeneity of the fan inflow. The measured signal is decomposed according to:
80 58 (, ) = ( ) + (, ) + (, ) V R t V R v R t v R t t t t t (, ) = ( ) + (, ) + ( ) V R t V R v R t v R, t, z z z z (4.1) where V ( R ) is the circumferential mean velocity, v( R, t) component, and v( R, t) is the periodic unsteady is the turbulent fluctuations. The subscripts t and z represent the tangential and axial components, respectively. Figure 4-3 shows the coordinate system fixed to the fan. If we define the phase-locked average as: n 1 1 V R t V R t nt nd n d (, ) = lim (, + ) d n= 0, (4.2) then the phase-locked average of the signal comprised of the mean value and the periodic unsteady component is: (, ) = ( ) + (, ) Vi R t Vi R vi R t, (4.3) where i = t and z. The circumferential mean velocity is calculated by the time average of the phase-locked average: i ( ) (, ) V R = V R t. i (4.4) Then, the periodic unsteady component is obtained by: v ( R, t) V ( R, t) V ( R) =. i i i (4.5) The phase-locked average contains the spatial distribution of incoming velocities. Becauseθ =Ω t,
81 59 Vi( R, t) = V i R, θ Ω. (4.6) Figures 4-4 to Figure 4-7 show the circumferential means of the measured tangential and axial velocities in the rotating frame. The tangential flow linearly increases from the spider to the tip as expected. It is interesting to find that the maximum axial flow velocity occurs in the middle of the blade span and that the flow decreases toward the spider and tip. The flow velocity near the blade tip is significantly low, especially for 1800 RPM. This is not an ideal axial fan flow. Generally, for good efficiency the airflow of an axial flow fan should be evenly distributed over the inlet face of the fan. More specifically, the axial flow velocity should be the same from the spider to the tip (Bleier, 1998). Improving the aerodynamic fan performance was not a subject for this project; however, it appears that the aerodynamic efficiency of the generator cooling system is worth further study in the future. Figures 4-8 and 4-11 show the contours of the phase-locked averages of the tangential ( V ( R, t ) V ( R, t) t ) and axial ( ) velocity fields in the rotating frame. As z expected from the velocity contours at the radiator outlet (Figures 2-4 and 2-5), the majority of the air is delivered through the upper part of the fan inlet. Higher axial velocities occur in the middle of the fan blade. The axial velocity field appears to be distorted more than the tangential velocity field by the finger guard. The finger guard causes severe distortions in the upper portion of the inlet flow field because most of the grid is in the upper half of the fan inlet face.
82 60 50 Circumfential mean of tangential velocity, 1600RPM V t [m/s] With F/G Without F/G R [m] Figure 4-4: Circumferential mean of the tangential velocity with and without the finger guard in place; 1600 RPM. 50 Circumfential mean of tangential velocity, 1800RPM V t [m/s] With F/G Without F/G R [m] Figure 4-5: Circumferential mean of the tangential velocity with and without the finger guard in place; 1800 RPM.
83 61 7 Circumfential mean of axial velocity, 1600RPM 6 5 V z [m/s] With F/G Without F/G R [m] Figure 4-6: Circumferential mean of the axial velocity with and without the finger guard in place; 1600 RPM. 7 Circumfential mean of axial velocity, 1800RPM 6 5 V z [m/s] With F/G Without F/G R [m] Figure 4-7: Circumferential mean of the axial velocity with and without the finger guard in place; 1800 RPM.
84 Figure 4-8: Phase-locked averages of the incoming velocities without the finger guard; 1600 RPM. (Looking upstream) 62
85 Figure 4-9: Phase-locked averages of the incoming velocities with finger guard; 1600 RPM. (Looking upstream) 63
86 Figure 4-10: Phase-locked averages of the incoming velocities without finger guard; 1800 RPM. (Looking upstream) 64
87 Figure 4-11: Phase-locked averages of the incoming velocities with finger guard; 1800 RPM. (Looking upstream) 65
88 4.4 Turbulent Flow Statistics Turbulence Intensity The turbulence intensity is one of the most widely used statistics for characterizing turbulent flows. Many empirical equations for the prediction of fan noise utilize the turbulence intensity to represent flows (Carolus, Schneider et al., 2007). Homogeneous and isotropic turbulent flow, which has long been a subject of fluid dynamics, is modeled using the turbulence intensity and integral length scale as its controlling parameters (Hinze, 1975). For the rotating probe signals, the fluctuating turbulence defined in Equation 4.1 is considered along with the circumferential mean velocity. The periodic unsteady component is not considered to be a turbulent quantity. The local turbulence intensity in the rotating leading edge plane is defined as: ( ) Tu R = v 2 i V i ( R, t) ( R). (4.7) The turbulence intensities measured at various rotor radii are shown in Figures 4-12 and The turbulence intensity depends significantly on the magnitude of the circumferential mean velocities. The turbulence intensity in the axial direction is very high because the mean flow velocity is low. The concave character of the curves occurs because the axial velocities are higher in the mid-span regions of the blade. The turbulence intensity in the tangential direction decreases linearly as the mean flow
89 decreases along the radius. The finger guard appears to have more influence on the turbulence intensity in the axial direction than it does in the transverse direction. 67
90 Turbulence Intensity, 1600RPM Vt with FG Vt without FG Vz with FG Vz without FG Turbulence Intensity [%] R [m] Figure 4-12: Turbulence intensity measured at 1600 RPM Vt with FG Vt without FG Vz with FG Vz without FG Turbulence Intensity, 1800RPM Turbulence Intensity [%] R [m] Figure 4-13: Turbulence intensity measured at 1800 RPM.
91 4.4.2 Integral Length Scale 69 The tangential integral length scale is determined by applying Taylor s frozen turbulence hypothesis to the measured temporal auto-correlation functions. The accuracy of Taylor s hypothesis depends upon both the properties of the flow and the statistic being measured. It is known to be quite accurate, especially in grid-generated homogeneous turbulent flows with turbulence intensities much lower than 10% (Pope, 2000; Tennekes and Lumley, 1972). The incoming flow of the current cooling fan is neither isotropic nor homogenous. However, turbulence intensities in the axial direction are lower than 10%, so Taylor s hypothesis might be applicable to the current inflow data processing. The expression of space-time correlations is formed from a statistical analysis of the instantaneous velocity fluctuations at two points ( R1 and ) on the rotating frame. If the random process is stationary and ergodic, the cross-correlation function is defined: { } R R R E v R t v R t ( 1 2, τ) = ( 1, ) ( 2, + τ) ij i j T 1 = lim vi( R1, t) vj( R2, t τ ) dt T 2T + ( 4.8) T = vi( R1, t) vj( R2, t+ τ ), where i, j = t and z. The cross-correlation function is normalized using the RMS values of the turbulent velocity fluctuations at the two measurement points: R 2
92 70 C R R ij ( 1 2, ) Rij R R τ =. v R v R ( 1 2, τ ) ( 1) j ( 2) 2 2 i (4.9) The normalized auto-correlation function is merely a special case where the values measured at the two points coincide. For the rotating coordinate system, the normalized auto-correlation function at each radius is given by: C T ( R, τ ) (, ) t (, + τ ) v ( R, t) 2 v R t v R t t = (4.10) Figure 4-14 to 4-17 show the measured normalized auto-correlation functions. For numerical implementations, MATLAB s built-in function xcorr was used to calculate these functions. The auto-correlation functions are observed to be symmetric and centered around zero delay time which is a good indication that the data are stationary. The functions are quite peaked which indicates that the random signals contain many frequencies, i.e., the narrower the peak, the more white is the broadband noise signal. Clearly, the turbulence has increasingly more high-frequencies as the measurement location moves from hub (Strip #1) to tip (Strip #8). This is expected because the velocities increase in that direction which promotes the creation of smaller scale, and higher frequency turbulence. The finger guard is expected to generate small-scale, high-frequency turbulence. The data presented support this notion as it is observed that the peaks in the autocorrelation functions at all radial positions become narrower when the instrumented fan is operated in the presence of the finger guard. t.
93 The tangential integral time scale is defined as: 71 T ( ) (, τ ) Λ R = C R dτ. 0 T (4.11) Assuming that the mean flow is in the tangential direction, the tangential integral length scale is obtained by utilizing Taylor s hypothesis: ( R) V ( R) ( R) Λ = Λ. L t T (4.12) Figures 4-18 and 4-19 show the tangential integral length scales measured along each blade radius. Because the finger guard is expected to produce a finer scale turbulence upstream of the fan, the trends observed in the data of these figures make sense. The largest integral length scale (~ 30 mm) is for the fan operating without a finger guard, while scales some 10 mm smaller are observed when it operates with the finger guard.
94 72 With F/G, 1600RPM Auto-correlation C T Strip #1 Strip #2 Strip #3 Strip #4 Strip #5 Strip #6 Strip #7 Strip # Time (τ) Figure 4-14: Auto-correlation functions measured with the finger guard in place; 1600 RPM. Without F/G, 1600RPM Auto-correlation C T Strip #1 Strip #2 Strip #3 Strip #4 Strip #5 Strip #6 Strip #7 Strip # Time (τ) Figure 4-15: Auto-correlation functions measured without the finger guard in place; 1600 RPM.
95 73 With F/G, 1800RPM Auto-correlation C T Strip #1 Strip #2 Strip #3 Strip #4 Strip #5 Strip #6 Strip #7 Strip # Time (τ) Figure 4-16: Auto-correlation functions measured with the finger guard in place; 1800 RPM. Without F/G, 1800RPM Auto-correlation C T Strip #1 Strip #2 Strip #3 Strip #4 Strip #5 Strip #6 Strip #7 Strip # Time (τ) Figure 4-17: Auto-correlation functions measured without the finger guard in place; 1800 RPM.
96 Integral Length Scale, 1600RPM With F/G Without FG Λ L [mm] R [m] Figure 4-18: Tangential integral length scales measured with and without the finger guard at 1600 RPM Integral Length Scale, 1800RPM With F/G Without FG Λ L [mm] R [m] Figure 4-19: Tangential integral length scales measured with and without the finger guard at 1800 RPM.
97 75 Chapter 5 Discrete Frequency Noise Prediction 5.1 Introduction As discussed in Chapter 3, discrete-frequency tones are generated by the interaction of rotating blades with spatially non-uniform velocity fields. This chapter describes how the measured incoming flow field can be utilized to predict discretefrequency noise. 5.2 Time-Invariant Incoming Flow Field One of the advantages of the blade-mounted-probe measurement technique is that it measures velocities relative to the rotating blade, which enables the acquired data to be applied directly to many aerodynamic theories that have been developed for the airfoil fixed-coordinate system. The unsteady lift theories discussed in Chapter 3 utilize the longitudinal velocity ( U ) and the transverse velocities ( V ), which are parallel and normal to the chord, respectively. As shown in Figure 4-12, these velocities are calculated from the measured tangential velocity (V t) and axial velocity (V z): where χ is the blade angle. U = Vt cos χ + Vzsin χ, (5.1) V = V sin χ V cos χ t z
98 76 The discrete-frequency noise prediction utilizes the phase-locked averages of the incoming velocities measured by a rotating hot-film probe. Only the circumferential variations of the time averaged inflow velocity, along with its mean value, are considered here. The instrumented blade was divided into nine equal-size strip elements, and an x- fiber probe (Dantec 55R51) was used to record velocities from each strip element. Figures 5-1 to 5-4 show the phase-locked averages of the measured incoming velocity fields for these longitudinal and transverse directions. It is observed that the transverse velocity, which is the dominant controlling parameter of the Sears function, is affected more than the longitudinal velocity by the finger guard. Figures 5-5 and 5-6 show the circumferential mean of the longitudinal and transverse velocities. The finger guard appears to increase both mean velocity components. Reynolds numbers based on the blade chord increase from 1.9E5 near the hub to 4.0E5 at the tip. Figures 5-7 and 5-8 show the mean angle of attack along each circumference. The minimum angle of attack occurs in the middle of the blade span where the highest axial velocity exists and the maximum occurs near the blade tip. The angle of attack is somewhat higher than would be expected from the flow rate measurements for a well designed fan. It was expected from the measured flow rates and the fan performance curve that the current fan is operating at near-free-delivery condition. However, based on the measured angle of attack, the fan blade appears to be stalled at the measured operating speeds. The flow blockage by the presence of the engine may cause these high angles of attack and the fan design could stand improvement by considering this.

99 Figure 5-1: Incoming velocity field U and V without finger guard at 1600 RPM. (Looking upstream) 77
100 78 Figure 5-2: Incoming velocity field U and V with finger guard at 1600 RPM. (Looking upstream)
101 79 Figure 5-3: Incoming velocity field U and V without finger guard at 1800 RPM. (Looking upstream)

102 80 Figure 5-4: Incoming velocity field U and V with finger guard at 1800 RPM. (Looking upstream)
103 81 45 Circumferential mean of longitudinal velocity U [m/s] Without F/G 1800RPM With F/G 1800RPM Without F/G 1600RPM With F/G 1600RPM R [m] Figure 5-5: Circumferential mean of longitudinal velocity at fan speeds of 1600 RPM and 1800 RPM with and without finger guard in place Circumferential mean of transverse velocity Without F/G 1800RPM With F/G 1800RPM Without F/G 1600RPM With F/G 1600RPM V [m/s] R [m] Figure 5-6: Circumferential mean of transverse velocity at fan speeds of 1600 RPM and 1800 RPM with and without finger guard in place.
104 82 30 Angle of attack, 1600RPM α [ ] With F/G Without F/G R [m] Figure 5-7: Blade section angle of attack as a function of radial location at 1600 RPM. 30 Angle of attack, 1800RPM α [ ] With F/G Without F/G R [m] Figure 5-8: Blade section angle of attack as a function of radial location at 1800 RPM.
105 5.3 Fourier Analysis of Mean Flow Field 83 The phase-locked averages of the incoming flow in the transverse and longitudinal direction are now decomposed by the discrete Fourier transform. Measured data consist of N values for each U(R,θ) and V(R,θ) on the interval [0, 2π] at equallyspaced points, θk = 2 π k N, k = 0,1, 2,..., N 1. Then, the Fourier transform is defined in a discrete form as: N 1 ( ) = (, θ ) U R U R e λ k = 0 N 1 ( ) = ( θ ) k = 0 2π k i λ N 2π k i λ N V R V R, e, λ where λ = 0,1, 2,..., N 1. k k (5.2) Arrow-bracketed variables indicate phase-locked averages. The Fourier coefficients U λ and Vλ in Equation 5.2 can be calculated effectively by the well-known fft algorithm. The index λ is called the spatial mode number and λ = 0 corresponds to the circumferential mean. Note that λ = 1 is the fundamental mode, and its wavelength is exactly equal to one circumference. The wavelength for λ = 2 is half of the fundamental wavelength. 1 1 In MATLAB, the Fourier transform pair is defined as: N 2π ( k 1) Xλ = x( k) exp i ( λ 1 ) k = 1 N ( k ) ( λ ) N 1 2π 1 with x( k ) = X λ exp i 1. N λ= 1 N Thus, X λ can be calculated by X λ = conj fft ( x( k )) N.
106 84 Figures 5-9 and 5-10 show the influence of the finger guard on the power spectrum of the incoming flow field at 1600 RPM. The steady-field coefficients that correspond to λ = 0 have the highest levels; however, as shown in Chapter 2, they contribute very little to tonal noise generation from the current fan. Both the transverse and longitudinal Fourier coefficients are increased up to 10 db by the presence of the finger guard. Figures 5-11 and 5-12 show the spectra at 1800 RPM. It is observed that the wake behind the finger guard influences the transverse coefficients more than it does the longitudinal coefficients. Often, grids with a very narrow spacing between the bars are used in wind tunnels to obtain a locally-uniform velocity distribution far downstream from the grid (Schlichting, 1979). However, such an effect is not expected from the current finger guard, because of its low solidity, where solidity is defined as the ratio of the portion of the cross-section which is filled by the bars to the total channel crosssection of the finger guard. Also, the distance separating the finger guard and the fan inlet face is so small that the flow appears to enter the fan with the wakes developed by the finger guard.
107 Incoming Flow Spectra U at 1600RPM λ With Finger Guard Without Finger Guard 10 Magnitude [db re 1m/s] Spatial mode λ Figure 5-9: Longitudinal incoming flow spectra with and without finger guard at 1600 RPM Incoming Flow Spectra V at 1600RPM λ With Finger Guard Without Finger Guard 10 Magnitude [db re 1m/s] Spatial mode λ Figure 5-10: Transverse incoming flow spectra with and without finger guard at 1600 RPM.
108 Incoming Flow Spectra U at 1800RPM λ With Finger Guard Without Finger Guard Magnitude [db re 1m/s] Spatial mode λ Figure 5-11: Longitudinal incoming flow spectra with and without finger guard at 1800 RPM Incoming Flow Spectra V at 1800RPM λ With Finger Guard Without Finger Guard Magnitude [db re 1m/s] Spatial mode λ Figure 5-12: Transverse incoming flow spectra with and without finger guard at 1800 RPM.
109 5.4 Unsteady Forces Due to Time-Invariant Flow Distortions 87 The spectra of the unsteady lift (that acts perpendicular to the camber line) are calculated using the power spectrum of the flow field. The wavelength of the gust for each spatial mode λ is 2π R l =. (5.3) λ Then the reduced frequency in Equation 3.43 can be rewritten as: k λ πc πc = = l 2π R λ λc =. 2R (5.4) Since the rotating blade encounters harmonic spatial modes, the reduced frequency is not a function of incoming velocity. It is the multiple of the blade chord length divided by the fan radius. It is highest near the hub and decreases toward the blade tip. For the current fan, reduced frequencies less than 100 radian influence discrete-frequency noise generation. Now, the unsteady lift spectrum is calculated by the thin airfoil theories discussed in Chapter 3. The Fourier coefficients of the incoming flow obtained in Section 5.3 are applied to Equation Figures 5-13 and 5-14 compare the power spectra of lifts calculated by the Sears function (L 1), Horlock s function (L2), and Naumann and Yeh s theory (L 3 ) at 1600 RPM. The Sears function considers only the transverse gust, while Horlock s function and Naumann and Yeh s theory consider longitudinal velocity fluctuations. The slope of the blade s local lift curve was assumed to be 2π, which is the theoretical value for a slender airfoil. The transverse gust appears to contribute most to
110 lift generation. However, the lower harmonics are increased somewhat by the longitudinal velocity fluctuations. Figures 5-15 and 5-16 show the predicted lift spectra at 1800 RPM; similar trends are observed. Figures 5-17 and 5-18 compare lift spectra (L 1 +L +L 2 3) with and without the finger guard. The lift magnitude increases up to 10 db are observed by the presence of the finger guard. The thrust and drag are obtained by the following geometric relationships: 88 Thrust : T = L cosχ λ Drag : D = L sinχ, λ λ λ (5.5) where χ is the blade angle (Figure 4-12).
111 Lift Spectra Without Finger Guard at 1600RPM L 1 L 1 +L 2 L 1 +L 2 +L 3 Magnitude [db re 1N] Spatial mode λ Figure 5-13: Lift spectra without finger guard at 1600 RPM Lift Spectra With Finger Guard at 1600RPM L 1 L 1 +L 2 L 1 +L 2 +L 3 Magnitude [db re 1N] Spatial mode λ Figure 5-14: Lift spectra with finger guard at 1600 RPM.
112 Lift Spectra Without Finger Guard at 1800RPM L 1 L 1 +L 2 L 1 +L 2 +L 3 Magnitude [db re 1N] Spatial mode λ Figure 5-15: Lift spectra without finger guard at 1800 RPM Lift Spectra With Finger Guard at 1800RPM L 1 L 1 +L 2 L 1 +L 2 +L 3 Magnitude [db re 1N] Spatial mode λ Figure 5-16: Lift spectra with finger guard at 1800 RPM.
113 Lift Spectra, 1600RPM With Finger Guard Without Finger Guard Magnitude [db re 1N] Spatial mode λ Figure 5-17: Lift spectra with and without finger guard at 1600 RPM Lift Spectra, 1800RPM With Finger Guard Without Finger Guard Magnitude [db re 1N] Spatial mode λ Figure 5-18: Lift spectra with and without finger guard at 1800 RPM.
114 5.5 Discrete-Frequency Sound Power Prediction 92 The unsteady lift spectra on the blades caused by the interaction with the nonuniform inlet flow field are used to predict the cooling fan s radiated sound power levels. The sound power of the noise radiated by the cooling fan at the harmonics of the BPF is predicted with Equation Figures 5-19 and 5-20 compare the predicted sound power levels with test results at a fan speed of 1600 RPM with and without the finger guard. Figures 5-21 and 5-22 show the results at 1800 RPM. In these Figures, the sound power predictions were performed using the Sears function (L 1 ), Horlock s function (L 2 ), and Naumann and Yeh s theory (L 3 ). Except for the first harmonic measured with the finger guard, the predictions agree very well with the experimental results. The transverse gust appears to dominate the sound power generation at most BPF harmonics. However, the predicted first harmonic tones are increased up to 8 db in level by considering the longitudinal velocity fluctuations for the fan speed of 1600 RPM without the finger guard. Further experimental investigations revealed that the interaction between the fan blades and the shroud surrounding the fan may be the dominant noise source at the first harmonic. Detailed experimental results are presented in Chapter 7. Figures 5-23 to 5-26 show the discrete-frequency noise radiation from each strip element. Blade sections near the tip appear to generate higher BPF tone levels than do other sections of the blade closer to the hub because the free stream velocities are higher near the blade tip. Increases of low harmonics due to the finger guard appear to be influenced more by the blade sections near the tip as well.
115 Without Finger Guard, 1600RPM Measured L 1 L 1 +L 2 L 1 +L 2 +L 3 Lw [db re 1pW] Frequency [Hz] Figure 5-19: Comparison of sound power prediction with measurement without finger guard at 1600 RPM With Finger Guard, 1600RPM Measured L 1 L 1 +L 2 L 1 +L 2 +L 3 Lw [db re 1pW] Frequency [Hz] Figure 5-20: Comparison of sound power prediction with measurement with finger guard at 1600 RPM.
116 Without Finger Guard, 1800RPM Measured L 1 L 1 +L 2 L 1 +L 2 +L 3 Lw [db re 1pW] Frequency [Hz] Figure 5-21: Comparison of sound power prediction with measurement without finger guard at 1800 RPM With Finger Guard, 1800RPM Measured L 1 L 1 +L 2 L 1 +L 2 +L 3 Lw [db re 1pW] Frequency [Hz] Figure 5-22: Comparison of sound power prediction with measurement with finger guard at 1800 RPM.
117 95 Lw [db re 1pW] Without Finger Guard, 1600RPM Test Element #1 Element #2 Element #3 Element #4 Element #5 Element #6 Element #7 Element #8 Element #9 All elements Frequency [Hz] Figure 5-23: Sound power level from each strip element without finger guard at 1600 RPM. Lw [db re 1pW] With Finger Guard, 1600RPM Test Element #1 Element #2 Element #3 Element #4 Element #5 Element #6 Element #7 Element #8 Element #9 All elements Frequency [Hz] Figure 5-24: Sound power level from each strip element with finger guard at 1600 RPM.
118 96 Lw [db re 1pW] Without Finger Guard, 1800RPM Test Element #1 Element #2 Element #3 Element #4 Element #5 Element #6 Element #7 Element #8 Element #9 All elements Frequency [Hz] Figure 5-25: Sound power level from each strip element without finger guard at 1800 RPM. Lw [db re 1pW] With Finger Guard, 1800RPM Test Element #1 Element #2 Element #3 Element #4 Element #5 Element #6 Element #7 Element #8 Element #9 All elements Frequency [Hz] Figure 5-26: Sound power level from each strip element with finger guard at 1800 RPM.
119 Chapter 6 Turbulence-Induced Broadband Noise Prediction 6.1 Introduction This chapter is concerned with the prediction of turbulence-induced broadband aerodynamic forces and acoustic noise from the engine cooling fan using the measured temporal correlations of the incoming turbulence. The essence of the problem lies in the prediction of the unsteady blade force statistics from the statistics of the stochastic incoming flow. 6.2 Cross-Correlation of Incoming Turbulence For flows that are neither homogeneous nor isotropic, such as the inflow to the fan under investigation here, tremendous numbers of records may be necessary for a complete description of the cross-correlation function of the velocity fluctuations. All combinations of two-point measurements are essential when the integral correlation length scale of the inflow turbulence is large. This situation is common for small fans, such as those used for cooling computer CPU s, and other electronic cooling applications. However, the correlation integral length scale of the present flow (Chapter 4) is much smaller than the blade-to-blade separation distance of the fan. The maximum correlation length measured for the incoming flow is 3 cm, and the minimum distance between fan blades, measured at the hub, is 12 cm. Therefore, contributions from blade-to-blade
120 correlations of the elements on different blades can be ignored; only the correlations between the strip elements on a given blade are important, and it is only those that were measured. Two x-fiber probes (Dantec 55R51) were used to capture simultaneous velocity fluctuations from each strip element; Figure 6-1 shows a photograph of the set-up. The blade was divided into eight equal-size strip elements, 2 cm in width. The reference strip element is denoted α, and the second strip element is denoted β. A total of 300 synchronous velocity records were collected. Flow interference that may be caused by the presence of the second probe was found to be negligible. The cross-correlation of stationary signals is neither odd nor even but has the relation (Bendat and Piersol, 2000), R vv βα ( τ ) R ( τ ) =. ( 6.1) MATLAB s built-in routine xcorr was employed to calculate the cross-correlation functions of the incoming turbulence. Non-uniformity of the inlet flow may degrade the aerodynamic performance of an axial fan, and is, of course, the dominant source of the discrete-frequency tones in the current fan. However, broadband noise radiation is known to be less sensitive to the spatially non-uniform inlet flow distribution. Therefore, periodic velocity variations were removed from the signal. Only the temporal velocity fluctuations defined in Equation 4.1 were considered here. vv 98 Figures 6-2 and 6-3 show the normalized cross-correlation functions measured between the transverse velocity fluctuation at reference strip locations α and those measured at all of the other locations β for the speed of 1800 RPM with the finger guard in place. The elements were assigned the number 1 near the hub, and the assigned
121 99 numbers increased until they reached 8 near the tip. It can be clearly seen that the correlations measured between elements separated by more than the integral length scale are negligibly small. This means that the correlations among adjacent elements are the dominant contributions to the lift spectra. A sharp peak of the auto-correlation (whenα = β ) implies the existence of broadband energy in the frequency domain, while a smooth, broader peak suggests low-frequency energy. Larger correlations from adjacent elements are observed when the reference probe is near the blade tip. Crosscorrelations measured at other operating conditions show similar trends, and the results are shown in Appendix B. Figure 6-1: Cross-correlation measurement probe set-up.
122 100 With FG, 1800RPM, Reference α=1 With FG, 1800RPM, Reference α=2 Cross-correlation C vv β=1 β=2 β=3 β=4 β=5 β=6 β=7 β=8 Cross-correlation C vv β=1 β=2 β=3 β=4 β=5 β=6 β=7 β= Time (τ) With FG, 1800RPM, Reference α= Time (τ) With FG, 1800RPM, Reference α=4 Cross-correlation C vv β=1 β=2 β=3 β=4 β=5 β=6 β=7 β=8 Cross-correlation C vv β=1 β=2 β=3 β=4 β=5 β=6 β=7 β= Time (τ) Time (τ) Figure 6-2: Cross-correlations measured at 1800 RPM between the transverse velocity fluctuations along the blade span with finger guard in place, ref. 1 to 4.
123 101 With FG, 1800RPM, Reference α=5 With FG, 1800RPM, Reference α=6 Cross-correlation C vv β=1 β=2 β=3 β=4 β=5 β=6 β=7 β=8 Cross-correlation C vv β=1 β=2 β=3 β=4 β=5 β=6 β=7 β= Time (τ) With FG, 1800RPM, Reference α= Time (τ) With FG, 1800RPM, Reference α=8 Cross-correlation C vv β=1 β=2 β=3 β=4 β=5 β=6 β=7 β=8 Cross-correlation C vv β=1 β=2 β=3 β=4 β=5 β=6 β=7 β= Time (τ) Time (τ) Figure 6-3: Cross-correlations measured at 1800 RPM between the transverse velocity fluctuations along the blade span with finger guard in place, ref. 5 to 8.
124 6.3 Power Spectral Density of Incoming Turbulence 102 The single-sided, cross-power spectral density function of the turbulent fluctuations can be obtained either from the correlation functions, Equation 3.58, or from the cross product of the finite Fourier transform and its conjugate, i.e., 2 Gvv ( f ) = E Xi ( f, T) Yi ( f, T) T nd 2 = lim { X i ( f, T) Yi ( f, T) }, nd nt d n= 1 T α iωt where X i( f, T ) = vi ( t) e dt 0 β ( ) = ( ) T iωt Y f, T v t e dt, i 0 i (6.2) where T is the record length. Through direct calculation it was found that both numerical methods yield the same power spectral density for the measured incoming turbulence. Since there is no periodic velocity variation, standard digital signal processing theories apply. The length of the time signal determines the frequency resolution of the spectrum, Δ 1 fs f = T = N, (6.3) where f s is the sampling rate. Just as the data acquisition set-up was used for the discretefrequency noise prediction, data at 240 points along each circumference were taken at the sampling rates of 6.4 khz for a fan speed of 1600 RPM and 7.2 khz for a speed of 1800 RPM. Each set-up collects velocity data during one revolution. Therefore, the power spectral density function has the frequency resolution of 26.7 Hz for 1600 RPM and 30 Hz for 1800 RPM. Higher frequency resolution, of course, may be obtained by recording longer signals.
125 103 The cross-power spectral density measured between the transverse velocity fluctuations at reference strip locations α and those measured at all of the other locations β for the speed of 1800 RPM and with the finger guard in place are shown in Figures 6-4 and 6-5. As expected, and for all cases, auto-power spectral densities were higher in magnitude than the cross-power spectral densities. The highest cross-spectral levels were observed when both probes were located near the hub. Note that the power spectral densities presented here include only turbulent fluctuations; any convection effects are removed from the data. It is further noted that the cross-power spectral densities have considerable magnitude when the reference probe is located at the outer radii of the element #4. As expected from the measured auto-correlation functions (narrow peak at zero delay time), the level of the auto-power spectra vary little with frequency (broadband noise characteristics). The cross-power spectra, however, have peaks and valleys which is indicative of velocities being correlated at some frequencies, and not so correlated at others. Test results for the other operating conditions are given in Appendix C.
126 104 G vv [db re 1m/s] With F/G at 1800RPM, Reference α=1 β=1 β=2 β=3 β=4 β=5 β=6 β=7 β=8 G vv [db re 1m/s] With F/G at 1800RPM, Reference α=2 β=1 β=2 β=3 β=4 β=5 β=6 β=7 β= Frequency (Hz) Frequency (Hz) G vv [db re 1m/s] With F/G at 1800RPM, Reference α=3 β=1 β=2 β=3 β=4 β=5 β=6 β=7 β=8 G vv [db re 1m/s] With F/G at 1800RPM, Reference α=4 β=1 β=2 β=3 β=4 β=5 β=6 β=7 β= Frequency (Hz) Frequency (Hz) Figure 6-4: Cross-spectral density measured at 1800 RPM between the transverse velocity fluctuations along the blade span with finger guard in place, ref. 1 to 4.
127 105 G vv [db re 1m/s] With F/G at 1800RPM, Reference α=5 β=1 β=2 β=3 β=4 β=5 β=6 β=7 β=8 G vv [db re 1m/s] With F/G at 1800RPM, Reference α=6 β=1 β=2 β=3 β=4 β=5 β=6 β=7 β= Frequency (Hz) Frequency (Hz) G vv [db re 1m/s] With F/G at 1800RPM, Reference α=7 β=1 β=2 β=3 β=4 β=5 β=6 β=7 β=8 G vv [db re 1m/s] With F/G at 1800RPM, Reference α=8 β=1 β=2 β=3 β=4 β=5 β=6 β=7 β= Frequency (Hz) Frequency (Hz) Figure 6-5: Cross-spectral density measured at 1800 RPM between the transverse velocity fluctuations along the blade span with finger guard in place, ref. 5 to 8.
128 Turbulence Ingestion Unsteady Forces The cross-power spectral densities of the incoming turbulent velocity fluctuations are used to calculate the unsteady lift spectra on the blade. Utilizing the Sears function, only the transverse velocity fluctuations were considered. The cross-power spectral densities of the incoming turbulence at each strip element are applied to the gust response function shown in Equation Since the harmonic components due to the spatial nonuniformity have been removed from the signal, the reduced frequency depends on the mean flow entering each strip element: α ωc k =. α ( 6.4) 2U When the current fan runs at the speed of 1800 RPM, the reduced frequency has values ranging from 0 to 32 radians for frequencies in the range of 0 to 3000 Hz. Now the blades local lift-curve slope is the only variable that is not defined yet. Various values from 1.5π to 2π were attempted to find the optimum value for the current fan noise prediction, and 1.7π was chosen for these computations. Figures 6-6 and 6-7 show the lift cross-spectra determined between the transverse velocity fluctuation at reference strip locations α and all of the others (β). The fan speed is 1800 RPM and the finger guard is in place. The net lift spectrum is obtained by summing all the lift cross-spectra measured between the elements. Clearly, the autospectra contribute the most energy to the net lift spectra because of the very small correlation lengths involved. Note, however, that the cross-spectra determined for the
129 107 outer blade sections significantly influence the net spectrum as well. Computation results for the other operating conditions are given in Appendix D. The unsteady lift on the blade was calculated at fan speeds of 1600 and 1800 RPM with and without the finger guard in place. Figure 6-8 shows unsteady lift spectra on each strip element. Because of higher relative velocities and more turbulence interaction, the outer blade sections contribute more to the net lift spectrum, regardless of the presence of the finger guard. On the other hand, the inner blade parts appear less sensitive to the presence of the finger guard. The contributions of the cross-correlations on the net lift spectrum were also examined. Two sets of computations have been performed: one with only the autocorrelations and the other with both auto- and cross-correlations. Figure 6-9 shows the influences of cross-correlation on the net unsteady lift. The cross-correlation functions of the incoming turbulence between the strip elements increases the net lift spectra up to 2 db for frequencies below 1300 Hz. Figures 6-10 and 6-11 compare the net lift spectra on the blade at fan speeds of 1600 RPM and 1800 RPM with and without finger guard. The lift spectrum level on the blade tends to increase when the fan rotating speed is increased and the finger guard is in place.
130 108 Ψ vv [db re 1N] With F/G at 1800RPM, Reference α=1 β=1 β=2 β=3 β=4 β=5 β=6 β=7 β=8 Net Ψ vv [db re 1N] With F/G at 1800RPM, Reference α=2 β=1 β=2 β=3 β=4 β=5 β=6 β=7 β=8 Net Frequency (Hz) Frequency (Hz) Ψ vv [db re 1N] With F/G at 1800RPM, Reference α=3 β=1 β=2 β=3 β=4 β=5 β=6 β=7 β=8 Net Ψ vv [db re 1N] With F/G at 1800RPM, Reference α=4 β=1 β=2 β=3 β=4 β=5 β=6 β=7 β=8 Net Frequency (Hz) Frequency (Hz) Figure 6-6: Unsteady blade lift cross-spectra computed for each combination of strip elements with the finger guard in place and the fan operating at 1800 RPM, ref. 1 to 4.
131 109 Ψ vv [db re 1N] With F/G at 1800RPM, Reference α=5 β=1 β=2 β=3 β=4 β=5 β=6 β=7 β=8 Net Ψ vv [db re 1N] With F/G at 1800RPM, Reference α=6 β=1 β=2 β=3 β=4 β=5 β=6 β=7 β=8 Net Frequency (Hz) Frequency (Hz) Ψ vv [db re 1N] With F/G at 1800RPM, Reference α=7 β=1 β=2 β=3 β=4 β=5 β=6 β=7 β=8 Net Ψ vv [db re 1N] With F/G at 1800RPM, Reference α=8 β=1 β=2 β=3 β=4 β=5 β=6 β=7 β=8 Net Frequency (Hz) Frequency (Hz) Figure 6-7: Unsteady blade lift cross-spectra computed for each combination of strip elements with the finger guard in place and the fan operating at 1800 RPM, ref. 5 to 8.
132 110 Ψ vv [db re 1N] (a) Unsteady lift without F/G at 1600RPM Strip #1 Strip #2 Strip #3 Strip #4 Strip #5 Strip #6 Strip #7 Strip #8 Net Ψ vv [db re 1N] (b) Unsteady lift without F/G at 1800RPM Strip #1 Strip #2 Strip #3 Strip #4 Strip #5 Strip #6 Strip #7 Strip #8 Net Ψ vv [db re 1N] Frequency (Hz) (c) Unsteady lift with F/G at 1600RPM Strip #1 Strip #2 Strip #3 Strip #4 Strip #5 Strip #6 Strip #7 Strip #8 Net Ψ vv [db re 1N] Frequency (Hz) (d) Unsteady lift with F/G at 1800RPM Strip #1 Strip #2 Strip #3 Strip #4 Strip #5 Strip #6 Strip #7 Strip #8 Net Frequency (Hz) Frequency (Hz) Figure 6-8: Net unsteady lift spectra on each strip element. (a): Without finger guard at 1600 RPM (b): Without finger guard at 1800 RPM (c): With finger guard at 1600 RPM (d): With finger guard at 1800 RPM.
133 (a) Unsteady lift without F/G at 1600RPM Net: Auto-spectrum Net: Auto+cross-spectrum (b) Unsteady lift without F/G at 1800RPM Net: Auto-spectrum Net: Auto+cross-spectrum Ψ vv [db re 1N] Ψ vv [db re 1N] Frequency (Hz) (c) Unsteady lift with F/G at 1600RPM Net: Auto-spectrum Net: Auto+cross-spectrum Frequency (Hz) (d) Unsteady lift with F/G at 1800RPM Net: Auto-spectrum Net: Auto+cross-spectrum Ψ vv [db re 1N] Ψ vv [db re 1N] Frequency (Hz) Frequency (Hz) Figure 6-9: Net unsteady lift spectra on the blade. (a): Without finger guard at 1600 RPM (b): Without finger guard at 1800 RPM (c): With finger guard at 1600 RPM (d): With finger guard at 1800 RPM
134 Net unsteady lift by auto-correlation With F/G 1800RPM Without F/G 1800RPM With F/G 1600RPM Without F/G 1600RPM Ψ vv [db re 1N] Frequency (Hz) Figure 6-10: Net unsteady lift spectra calculated by considering only the auto-correlation functions Net unsteady lift by auto+cross-correlation With F/G 1800RPM Without F/G 1800RPM With F/G 1600RPM Without F/G 1600RPM Ψ vv [db re 1N] Frequency (Hz) Figure 6-11: Net unsteady lift spectra calculated by considering both the auto- and crosscorrelation functions.
135 Broadband Sound Power Prediction The net lift cross-spectrum is used to predict the broadband noise radiation from the fan. An airfoil that radiates sound is considered to be acoustically compact if (Blake, 1986) ωc a o < 2π, (6.5) where ω is the radian frequency C is the chord, and a 0 is the sound speed. According to Equation 6.5, the current fan may be considered to be a compact source for frequencies up to 2300 Hz. Then Equation 3.62 may be utilized to predict the sound pressure levels at all far-field points. The radiated sound power level is obtained by numerically integrating the sound pressure over an arbitrary surface (Equation 3.63). Sound power obtained by a simpler relationship (Equation 3.64) proved to yield almost the same results as those computed from direct numerical integrations. Figures 6-12 and 6-15 compare the predicted broadband sound power levels with those measured. Predictions were carried out by considering only the auto-correlation functions in one case, and the full set of cross-correlations in the other. Clearly, the full set of correlations produces a better agreement with the experimental results. The deviations between the predictions and experiments at frequencies below 400 Hz are likely due to either the fan blade stall or anomalies in the noise measurement environment. The sound power measurements were performed in a hard-walled room, but at low frequencies, its dimensions are sufficiently small to warrant this suspicion. For the NACA airfoil no. 6512, the flow stalls for the angles of attack higher than 15. For a single-thickness airfoil, the angle of attack at which the maximum lift coefficient occurs
136 114 is considerably low, ~10, and the stall is expected to occur at lower angle of attack than that of the NACA airfoil (Bleier, 1998). The angles of attack of the subject fan blade, 19-29, are much higher than the optimum operation condition (Chapter 5). Furthermore, if we define the Strouhal number as: f δ St =, (6.6) U where δ (= C sinα ) is the projected chord length, then the center Strouhal number of the low frequency hump is about 0.3, which coincides with previous experimental results (Gordon, 1968; 1969) related to stall noise. Therefore, the low frequency hump in the radiated sound power spectrum of the subject fan may be due to blade flow separation.
137 Sound Power without Finger Guard at 1600RPM 90 Lw [db re 1pW per Hz] Measured Prediction : Auto-correlation only Prediction : Auto+cross-correlation Frequency [Hz] Figure 6-12: Sound power measurement and prediction of the cooling fan operating without the finger guard at 1600 RPM. 100 Sound Power without Finger Guard at 1800RPM 90 Lw [db re 1pW per Hz] Measured Prediction : Auto-correlation only Prediction : Auto+cross-correlation Frequency [Hz] Figure 6-13: Sound power measurement and prediction of the cooling fan operating without the finger guard at 1800 RPM.
138 Sound Power with Finger Guard at 1600RPM 90 Lw [db re 1pW per Hz] Measured Prediction : Auto-correlation only Prediction : Auto+cross-correlation Frequency [Hz] Figure 6-14: Sound power measurement and prediction of the cooling fan operating with the finger guard at 1600 RPM. 100 Sound Power with Finger Guard at 1800RPM 90 Lw [db re 1pW per Hz] Measured Prediction : Auto-correlation only Prediction : Auto+cross-correlation Frequency [Hz] Figure 6-15: Sound power measurement and prediction of the cooling fan operating with the finger guard at 1800 RPM.
139 Chapter 7 Discrete-Frequency Noise Reduction 7.1 Introduction This chapter presents the techniques employed to reduce the discrete frequency noise radiated by the subject cooling fan and their effectiveness. Although a plethora of techniques have been demonstrated for reducing the blade rate tones from axial flow fans, only those that could be employed in a cost effective manner, without major modifications to the engine/generator and without reducing the cooling effectiveness of fan were considered. This led us to replace the baseline radial fan with a skewed fan and to incorporate treatments to the shroud to suppress tip-flow related noise (shown to dominate the tone levels at the first blade rate harmonic). 7.2 Skewed Blade Fan Blade Profile As discussed in Chapter 4, the interaction of the fan blades with the spatially nonuniform, time averaged inflow is the source of the noise radiated by the fan at the BPF and its harmonics. A blade profile designed to reduce the blade rate tone levels would incorporate skew such that each blade segment from the hub to the tip would respond to its inflow gust at a different time (dispersed phase angles) such that the overall
140 (integrated) blade unsteady lift would be reduced compared to that generated by the unskewed blade. The skewed fan blade profile is defined as: 118 θ R Rhub ( R) θ = tip Rtip R hub n, (7.1) where the skew angle θ is defined at the blade tip. The exponent in Equation 7.1 tip usually has values from 1 to 2 where the distribution for n = 1 is called linear and that for n = 2 is called quadratic. The blade can be skewed either in or opposite the direction of rotation; the former known as backward skew and the latter know as forward skew. Figure 7-1 shows a sketch of a backward, quadratically skewed fan blade. For the fan radiated sound power predictions, the inflow velocity statistics were assumed to be the same for all the fans considered. This assumption requires that all the fans have the same aerodynamic performance. The sound power radiated from a number of fans with -30º to +30º quadratically skewed blades was predicted for an 1800 RPM rotation rate with the finger guard in-place. Figure 7-2 shows the results. Note that the 15º, forward skewed fan is expected to increase the tone levels at most of the BPF harmonics. For the subject Cummins fan, priority was given to reducing the levels at the first five BPF tones since it was shown to have particularly high levels at those frequencies. Examination of Figure 7-2 indicates that the 30º backward skewed fan provides the overall lowest levels of the first five BPF tones of the skew angles and distributions shown. Larger skew angles were not considered due to anticipated difficulties in obtaining the same aerodynamic performance as the baseline fan, issues with its manufacture and structural integrity issues that would pose a safety hazard for testing.
141 119 Figure 7-3 shows re-distributed inlet flow fields by the skewed blade profile. Each blade segment of skewed fan from hub to tip encounters the inlet flow gusts at a different time, while the straight fan does at a same time. Therefore, the unsteady lift developed on each blade segment of the skewed fan has dispersed phase angles, which would expect to generate less magnitude of force when summed. The unsteady lifts generated on the baseline and 30º backward skewed fan are compared in Figure 7-4 for spatial modes, λ, up to 80. Unsteady lift reductions of up to 10 db in level are shown for λ s up to 30 which dominate the first five BPF tones as shown in Figure 3-2. Figure 7-2 shows that increases of up to 6 db in level are predicted for the higher harmonic BPF tones with the 30º backward skewed blade and this is consistent with the predicted increase in the magnitude of λ s (shown in Figure 7-4) that contribute to those harmonics.


142 120 θ tip rotation Figure 7-1: A sketch of a backward skewed blade fan. Lw [db re 1pW] With Finger Guard 1800RPM, Quadratic Skewed Fan Measured θ = -30 θ = -15 Straight θ = 15 θ = Frequency [Hz] Figure 7-2: Sound power prediction for skewed blade fans.

143 121 Blade tip (a) Hub Blade tip (b) Hub Figure 7-3: Re-distributed inlet flow field. (a) straight blade; (b) skewed blade (backward 30 ) Lift Spectra Straight blade Skewed blade: Backward 30 Magnitude [db re 1N] Spatial mode λ Figure 7-4: Lift spectra developed on the straight and the backward skewed blade.
144 7.2.2 Prototype Fans Evaluation 122 Two fans with 30º backward skewed blades but different hubs, designed to have the same aerodynamic performance as the baseline Cummins engine cooling fan, were fabricated and evaluated. In the first fan model, the six skewed blades were made of plastic and attached to the original spider (hereafter called SS ) with bolts rather than rivets. In order to provide sufficient strength, the plastic blade was manufactured with a thickness of 5.6 mm compared to the sheet metal blade s 1.6 mm thickness. The thickness increase of the plastic blade would not affect adversely to the BPF tone levels because the blade is still very thin with respect to its chord. The second fan model was also made from plastic with the blades and hub molded as one piece (hereafter called SH ) where the thickness of the blades was 3.4 mm. Upon completion, the strength anticipated from the 3.4 mm thick blades was deemed inadequate. The plastic hub was reinforced with two steel plate of thickness 2 mm. Figure 7-5 shows the prototype fans installed on the generator. The aerodynamic performance of each fan was quantified by measuring the airflow rates exhausted through the radiator at speeds of 1600 and 1800 RPM. The airflow results are shown in Table 7-1 in m 3 /s and in percent relative to the original fan in Figure 7-6. It is clear that the skewed fans deliver 4% to 8% higher flow rates than the original fan at both speeds tested. Figures 7-7 and 7-8 compare the measured sound power levels of the skewed fans to the original at the BPF and its harmonics at speeds of 1600 and 1800 rpm. The skewed fans reduce the 2 nd and higher order BPF harmonics by up to 10 db in level. Figures 7-9
145 123 and 7-10 show the sound power reductions at the harmonics of the BPF by the skewed fans at 1600 and 1800 RPM. The fundamental BPF tone is affected little by the skewed fan and has the highest level among the BPF tones of all the evaluated fans. Further experimental investigations revealed that the source of the fundamental BPF tone is the interaction of the fan blade tip with the shroud opening. This is discussed in Section 7.5. Figure 7-11 compares the predicted sound power levels of the skewed fans with those of the measurements. The lower order BPF harmonics (i.e., 1-5) tend to be under-predicted by 5 to 14 db except the third BPF harmonic while the higher order harmonics tend to be over-predicted by 5 to 10 db. The maximum under-prediction occurs at the fundamental BPF tone. Note that the tone levels at the BPF harmonics were predicted to within 6 db with the original fan. We attribute the reduced prediction accuracy with the skewed fans compared to the original fan to changes in the inflow velocity field. As discussed in Section 7.3.1, the predictions were all made with the inflow measured for the original fan. The inlet velocity statistics for the skewed fans were not measured. The overall flow rates delivered by the skewed fans, however, were increased by up to 8 % compared to the original fan which implies that there were considerable changes in the inlet velocity field. An additional source of ambiguity with regard to the tone levels is that the prototype fans are not perfectly axisymmetric; variations of 7 mm in the diameter were measured. This may account for some of the deviations between the measured and predicted BPF tone levels.
 SH")


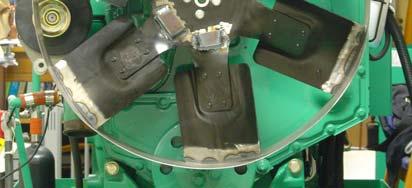


146 124 OR (a) SS (b) SH (c) BN (d) Figure 7-5: Photographs of prototype fans. (a) original fan; (b) skewed fan with spider; (c) skewed fan with hub; (d) banded fan.
147 125 Table 7-1: Volumetric flow rates of skewed fans. [m 3 /s (cfm)] 1600 RPM 1800 RPM Original fan 3.59 (7609) 4.03 (8529) Skewed fan with spider 3.75 (7940) 4.34 (9114) Skewed fan with hub 3.88 (8216) 4.30 (9119) Percentage [%] Air Flow Rate Original fan SS SH Fan Speed [RPM] Figure 7-6: Comparison of flow rates from the skewed blade fans.
148 Sound Power, 1600 RPM Original Skewed fan with spider Skewed fan with hub 95 Lw [db re 1pW] Frequency [Hz] Figure 7-7: Sound power spectra of the skewed fans at 1600 RPM Sound Power, 1800 RPM Original Skewed fan with spider Skewed fan with hub 95 Lw [db re 1pW] Frequency [Hz] Figure 7-8: Sound power spectra of the skewed fans at 1800 RPM.
149 127 2 Sound Power Reduction, 1600RPM 0-2 Δ Lw [db] Skewed fan with spider Skewed fan with hub Harmonics of BPF Figure 7-9: Sound power level reductions by the skewed fans at 1600 RPM. 2 Sound Power Reduction, 1800RPM 0-2 Δ Lw [db] Skewed fan with spider Skewed fan with hub Harmonics of BPF Figure 7-10: Sound power level reductions by the skewed fans at 1800 RPM.
150 Sound Power, 1800RPM Measured: SS Measured: SH Predicted Lw [db re 1pW] Frequency [Hz] Figure 7-11: Comparison of measured sound power levels with prediction. 7.3 Banded Fan Banded fans have been used successfully to control tip clearance noise (Longhouse, 1978) and such a treatment was examined for the current cooling system. A banded fan was fabricated by welding a cylindrical band to the original propeller fan as shown in Figure 7-5. The two steel pieces attached to the spider balanced the fan. The airflow rates were measured at 1600 and 1800 RPM for the banded fan in the same manner as for the original and skewed fans. The results are given in Table 7-2. The banded fan delivers only about 75% of the original fan s flow rate at the same fan speeds. Figures 7-12 and 7-13 compare the sound power levels measured for the banded fan to those of the original fan at speeds of 1600 and 1800 RPM. The banded fan reduces the BPF tones by up to 11 db in level. This improvement in acoustical performance offered
151 129 by the banded fan must be weighted against its degradation in aerodynamic/cooling performance. Sound power radiation from an aerodynamic dipole source depends on the sixth power of the incident velocity. Therefore, sound power level differences due to the change in the mean flow can be roughly estimated by, ( U ) Δ Lw = 60 log 10 1 U 2, ( 7.2) where, U is the mean flow velocity and the subscript indicates the operating condition. Assuming mean flow is proportional to the flow rate, estimated sound power level changes due to the reduced flow rates of the banded fan are 7.2 db and 7.1 db for 1600 RPM and 1800 RPM, respectively. These estimations are somewhat lower than the actual sound power level reductions at the harmonics of the BPFs. Another possible reason for the noise reduction is the reduced flow velocities around the blade tip. The extruded cylindrical band might redirect the incoming flow near the blade tip toward the hub. As discussed in Chapter 5, the blade sections near the tip generates the higher BPF tone levels in comparison to other sections of the blade. Early in the effort, the effect of attaching various collars to the shroud opening on the aerodynamic performance was investigated. Dramatic changes in the aerodynamic performance were observed by employing the collars. It was found that the collar that covered the rear half of the blade increased the aerodynamic performance where the collar that covered the front half of the blade reduced the aerodynamic performance. The collar that covered the entire blade also reduced the aerodynamic performance. Due to the close proximity of the engine to the fan inlet, it appears that the majority of the fan s
152 130 inflow is in the radial direction. Adding the collar to the front of the shroud opening appears to hinder that radial inflow. Thus, the aerodynamic penalty caused by the band may be due, at least in part, to hindering the radial flow into the fan. Table 7-2: Volumetric flow rates of the banded fan. [m 3 /s (cfm)] 1600 RPM 1800 RPM Original fan 3.59 (7609) 4.03 (8529) Banded fan 2.72 (5781) 3.07 (6150)
153 Sound Power, 1600 RPM Original fan Banded fan Lw [db re 1pW] Frequency [Hz] Figure 7-12: Comparison of sound power from the banded fan with the original at 1600 RPM Sound Power, 1800 RPM Original fan Banded fan Lw [db re 1pW] Frequency [Hz] Figure 7-13: Comparison of sound power from the banded fan with the original at 1800 RPM.
154 7.4 Shroud Inlet Opening 132 As discussed in Section 7.4, the aerodynamic performance of the subject cooling system is greatly influenced by the configuration of the shroud inlet. The baseline shroud inlet consists of a circular hole in a steel plate. This baseline inlet was modified as shown in Figure 7-14 with 36 serrations cut along the circumference. The original and SS fans were used to examine the effect of the shroud openings on their aerodynamic and acoustical performance. Table 7-3 shows the airflow rates measured for each fan and shroud combination at fan speeds of 1600 and 1800 RPM and Figure 7-15 compares the airflow rates in percent relative to the original fan and baseline inlet. Note that the serrated opening reduces the airflow rate of the original fan from 3 to 6% but it increases the airflow rate when used with the SS fan by 3 %. Figures 7-16 and 7-17 show the measured sound power levels using the serrated opening with the original and SS fans for speeds of 1600 and 1800 rpm. Figures 7-18 and 7-19 show the sound power reductions at the harmonics of the BPF. The serrated opening reduces the first five harmonics of the BPF tone for both fans. In fact, the fundamental BPF tone is reduced 8 db in level at 1600 RPM and 12 db in level at 1800 RPM when the serrated opening is used with the original fan. The higher harmonics of the BPF are also influenced by the serrated opening but to a lesser degree. Notwithstanding, when the serrated opening is used with the SS fan, almost all the harmonics of the BPF are reduced. Another advantage offered by the SS fan and serrated opening is that there is no singularly dominant BPF harmonic; the first 10 BPF tones are within 8 db of one-another in level. The noise reduction mechanism of the serrated
155 133 opening is not clearly understood at the present time. Detailed flow measurements around the shroud would be helpful to provide insight into the noise reduction mechanism. Table 7-4 lists the overall sound power levels and reductions of the evaluated fans and openings with respect to the original fan and inlet. The maximum overall sound power level reduction provided by the skewed fans, banded fan and serrated opening is limited to 3.3 db (OR fan with serrated opening) due to the dominance of the broadband noise. The SS fan with serrated opening, recommended for providing significant BPF tone level reductions and BPF harmonics that are close to one-another in level, showed 2.1 and 2.8 db sound power reductions for fan speeds of 1600 and 1800 RPM, respectively. The overall noise radiated from a fan is highly dependent on the rotational speed. The fan law can be used to roughly estimate the sound power level change between two different fan speeds (Lauchle, 2007): ( ) L L = 50log N N, ( 7.3) w1 w where N is the fan rotational speed and the subscript indicates the operating condition. According to Equation 7.3, a 2.6 db reduction in the sound power level is expected when the fan speed is reduced from 1800 RPM to 1600 RPM. The actual noise reduction for the original fan with the circular opening is 2.8 db, which is very close to the estimated value.


156 Figure 7-14: Original circular opening and the serrated opening. 134
inter.noise 2000 The 29th International Congress and Exhibition on Noise Control Engineering August 2000, Nice, FRANCE
 1 inter.noise 2000 The 29th International Congress and Exhibition on Noise Control Engineering 27-30 August 2000, Nice, FRANCE I-INCE Classification: 1.0 PREDICTION OF LOW FREQUENCY SOUND GENERATION FROM
DETECTION AND ANALYSIS OF AZIMUTHAL ROTATING MODES IN A CENTRIFUGAL IMPELLER SUMMARY INTRODUCTION BACKGROUND
 DETECTION AND ANALYSIS OF AZIMUTHAL ROTATING MODES IN A CENTRIFUGAL IMPELLER Daniel WOLFRAM, Thomas CAROLUS University of Siegen, Institute of Fluid- and Thermodynamics, D-57068 Siegen, GERMANY SUMMARY
Fan Stage Broadband Noise Benchmarking Programme
 Fan Stage Broadband Noise Benchmarking Programme Specification of Fundamental Test Case 3 (FC3) Version 1 : 26 January 2015 Test Case Coordinator John Coupland ISVR University of Southampton UK E-mail
Mir Md. Maruf Morshed
 Investigation of External Acoustic Loadings on a Launch Vehicle Fairing During Lift-off Supervisors: Professor Colin H. Hansen Associate Professor Anthony C. Zander School of Mechanical Engineering South
Improvements of a parametric model for fan broadband and tonal noise
 Improvements of a parametric model for fan broadband and tonal noise A. Moreau and L. Enghardt DLR - German Aerospace Center, Mueller-Breslau-Str. 8, 10623 Berlin, Germany antoine.moreau@dlr.de 4083 Engine
Aeroacoustic Study of an Axial Ring Fan Using Lattice- Boltzmann Simulations
 Aeroacoustic Study of an Axial Ring Fan Using Lattice- Boltzmann Simulations Dominic Lallier-Daniels, Department of Mechanical Enginering, Université de Sherbrooke, Sherbrooke, Quebec, Canada Mélanie Piellard,
Empirical study of the tonal noise radiated by a sharpedged flat plate at low-to-moderate Reynolds number
 Paper Number 44, Proceedings of ACOUSTICS 2011 Empirical study of the tonal noise radiated by a sharpedged flat plate at low-to-moderate Reynolds number Danielle J. Moreau, Laura A. Brooks and Con J. Doolan
Shape Optimisation of a 200 mm Axial Fan for Aeroacoustic Noise
 UNIVERSITY OF CANTERBURY Shape Optimisation of a 200 mm Axial Fan for Aeroacoustic Noise Author: Ryan MCKAY Supervisor: Dr. John PEARSE A thesis submitted in fulfilment of the requirements for the degree
On the aeroacoustic tonal noise generation mechanism of a sharp-edged. plate
 On the aeroacoustic tonal noise generation mechanism of a sharp-edged plate Danielle J. Moreau, Laura A. Brooks and Con J. Doolan School of Mechanical Engineering, The University of Adelaide, South Australia,
Contents. 1 Introduction to Gas-Turbine Engines Overview of Turbomachinery Nomenclature...9
 Preface page xv 1 Introduction to Gas-Turbine Engines...1 Definition 1 Advantages of Gas-Turbine Engines 1 Applications of Gas-Turbine Engines 3 The Gas Generator 3 Air Intake and Inlet Flow Passage 3
DETECTION AND ANALYSIS OF AZIMUTHAL MODES IN A CENTRIFUGAL IMPELLER
 The 12th International Symposium on Transport Phenomena and Dynamics of Rotating Machinery Honolulu, Hawaii, February 17-22, 28 ISROMAC12-28-259 DETECTION AND ANALYSIS OF AZIMUTHAL MODES IN A CENTRIFUGAL
Study on the Performance of a Sirocco Fan (Flow Around the Runner Blade)
") Rotating Machinery, 10(5): 415 424, 2004 Copyright c Taylor & Francis Inc. ISSN: 1023-621X print / 1542-3034 online DOI: 10.1080/10236210490474629 Study on the Performance of a Sirocco Fan (Flow Around
Rotating Machinery, 10(5): 415 424, 2004 Copyright c Taylor & Francis Inc. ISSN: 1023-621X print / 1542-3034 online DOI: 10.1080/10236210490474629 Study on the Performance of a Sirocco Fan (Flow Around
FEDSM AERODYNAMIC NOISE SIMULATION OF PROPELLER FAN BY LARGE EDDY SIMULATION
 Proceedings of FEDSM27 5th Joint ASME/JSME Fluids Engineering Conference July 3-August 2, 27 San Diego, California USA FEDSM27-37145 AERODYNAMIC NOISE SIMULATION OF PROPELLER FAN BY LARGE EDDY SIMULATION
Prediction of noise from a wing-in-junction flow using computational fluid dynamics
 Proceedings of Acoustics - Fremantle -3 November, Fremantle, Australia Prediction of noise from a wing-in-junction flow using computational fluid dynamics Con J. Doolan, Jesse L. Coombs, Danielle J. Moreau,
An overview of Onera aeroacoustic activities in the framework of propellers and open rotors
 An overview of Onera aeroacoustic activities in the framework of propellers and open rotors Y. Delrieux Onera. Computational Fluid Dynamics and Aeroacoustics A.Chelius, A. Giauque, S. Canard-Caruana, F.
Numerical and Experimental Investigation of the Flow-Induced Noise of a Wall Mounted Airfoil
 Numerical and Experimental Investigation of the Flow-Induced Noise of a Wall Mounted Airfoil Paul Croaker, Danielle Moreau, Manuj Awasthi, Mahmoud Karimi, Con Doolan, Nicole Kessissoglou School of Mechanical
Chapter three. Two-dimensional Cascades. Laith Batarseh
 Chapter three Two-dimensional Cascades Laith Batarseh Turbo cascades The linear cascade of blades comprises a number of identical blades, equally spaced and parallel to one another cascade tunnel low-speed,
Numerical Simulation of Underwater Propeller Noise
 Numerical Simulation of Underwater Propeller Noise Bagheri M.R, a*, Seif M.S, a and Mehdigholi H, a a) Sharif University of Technology, Center of Excellence in Hydrodynamic and Dynamic of Marine Vehicles,
arxiv: v1 [physics.flu-dyn] 25 Dec 2018
![arxiv: v1 [physics.flu-dyn] 25 Dec 2018](/thumbs/92/110713684.jpg "arxiv: v1 [physics.flu-dyn] 25 Dec 2018") Self-Noise modelling and acoustic scaling of an axial fan configured with rotating controlled diffusion blade Behdad Davoudi 1 and Scott C. Morris 2 arxiv:1812.10003v1 [physics.flu-dyn] 25 Dec 2018 Abstract
Self-Noise modelling and acoustic scaling of an axial fan configured with rotating controlled diffusion blade Behdad Davoudi 1 and Scott C. Morris 2 arxiv:1812.10003v1 [physics.flu-dyn] 25 Dec 2018 Abstract
Effects of the Leakage Flow Tangential Velocity in Shrouded Axial Compressor Cascades *
 TSINGHUA SCIENCE AND TECHNOLOGY ISSNll1007-0214ll21/21llpp105-110 Volume 14, Number S2, December 2009 Effects of the Leakage Flow Tangential Velocity in Shrouded Axial Compressor Cascades * KIM Jinwook
W-8 Inlet In-duct Array Evaluation
 https://ntrs.nasa.gov/search.jsp?r=2184548 218-9-16T15:19:18+:Z National Aeronautics and Space Administration W-8 Inlet In-duct Array Evaluation Rick Bozak NASA Glenn Research Center Acoustics Technical
Active control of fan noise and vortex shedding
 Active control of fan noise and vortex shedding Yee-Jun Wong, Bachelor of Engineering Mechanical (Honours) This thesis is presented for the degree of Doctor of Philosophy of Mechanical Engineering of The
Treatment of Tonal Sound in the Development of Fan Sound Ratings
 ENGINEERING PAPER 55-08 Treatment of Tonal Sound in the Development of Fan Sound Ratings Tim Mathson Manager - CVI Engineering Greenheck Fan Corp. AMCA International Engineering Conference Las Vegas, NV,
Aerodynamic Noise Simulation Technology for Developing Low Noise Products
 Aerodynamic Noise Simulation Technology for Developing Noise Products KANEKO, Kimihisa MATSUMOTO, Satoshi YAMAMOTO, Tsutomu ABSTRACT The size reduction trend of electric power equipment causes increased
Detailed Outline, M E 320 Fluid Flow, Spring Semester 2015
 Detailed Outline, M E 320 Fluid Flow, Spring Semester 2015 I. Introduction (Chapters 1 and 2) A. What is Fluid Mechanics? 1. What is a fluid? 2. What is mechanics? B. Classification of Fluid Flows 1. Viscous
Industries & Applications
 Industries & Applications Aerospace High Lift Devices Landing Gear ECS Jet and turbo noise Marine Propeller noise Cavitation Hull/propeller/rudder interaction Automotive Wing mirror Sunroof noise HVAC
Flow analysis in centrifugal compressor vaneless diffusers
 348 Journal of Scientific & Industrial Research J SCI IND RES VOL 67 MAY 2008 Vol. 67, May 2008, pp. 348-354 Flow analysis in centrifugal compressor vaneless diffusers Ozturk Tatar, Adnan Ozturk and Ali
Acoustic analysis of flat plate trailing edge noise
 Proceedings of 20th International Congress on Acoustics, ICA 2010 23 27 August 2010, Sydney, Australia PACS: 43.28.Ra ABSTRACT Acoustic analysis of flat plate trailing edge noise D.J. Moreau, M.R. Tetlow,
DIRECT NUMERICAL SIMULATIONS OF HIGH SPEED FLOW OVER CAVITY. Abstract
 3 rd AFOSR International Conference on DNS/LES (TAICDL), August 5-9 th, 2001, Arlington, Texas. DIRECT NUMERICAL SIMULATIONS OF HIGH SPEED FLOW OVER CAVITY A. HAMED, D. BASU, A. MOHAMED AND K. DAS Department
Active Control of Separated Cascade Flow
 Chapter 5 Active Control of Separated Cascade Flow In this chapter, the possibility of active control using a synthetic jet applied to an unconventional axial stator-rotor arrangement is investigated.
COMPUTATIONAL SIMULATION OF THE FLOW PAST AN AIRFOIL FOR AN UNMANNED AERIAL VEHICLE
 COMPUTATIONAL SIMULATION OF THE FLOW PAST AN AIRFOIL FOR AN UNMANNED AERIAL VEHICLE L. Velázquez-Araque 1 and J. Nožička 2 1 Division of Thermal fluids, Department of Mechanical Engineering, National University
Performance characteristics of turbo blower in a refuse collecting system according to operation conditions
 Journal of Mechanical Science and Technology 22 (2008) 1896~1901 Journal of Mechanical Science and Technology www.springerlink.com/content/1738-494x DOI 10.1007/s12206-008-0729-6 Performance characteristics
Vibration Generations Mechanisms: Flow Induced
 Vibration Generations Mechanisms: Flow Induced Introduction That sound and vibration generation and flow are correlated is apparent from a range of phenomena that we can observe around us. A noteworthy
DYNAMIC STRESS MEASUREMENT OF CENTRIFUGAL COMPRESSOR IMPELLER AND STUDY FOR STRENGTH CRITERIA BASED ON CORRELATION BY UNSTEADY CFD
 DYNAMIC STRESS MEASUREMENT OF CENTRIFUGAL COMPRESSOR IMPELLER AND STUDY FOR STRENGTH CRITERIA BASED ON CORRELATION BY UNSTEADY CFD by Atsushi Higashio Senior Engineer Hiroyuki Yamashita Research Engineer
Acoustics Laboratory
 Acoustics Laboratory 1 at the Center for Noise and Vibration Control in ME, KAIST Supervisor: Prof. Jeong-Guon Ih (e-mail: J.G.Ih@kaist.ac.kr) Lab members: (as of March 2015) Ph.D. Students: 6 (1 part-time
Contents. I Introduction 1. Preface. xiii
 Contents Preface xiii I Introduction 1 1 Continuous matter 3 1.1 Molecules................................ 4 1.2 The continuum approximation.................... 6 1.3 Newtonian mechanics.........................
Applied Fluid Mechanics
 Applied Fluid Mechanics 1. The Nature of Fluid and the Study of Fluid Mechanics 2. Viscosity of Fluid 3. Pressure Measurement 4. Forces Due to Static Fluid 5. Buoyancy and Stability 6. Flow of Fluid and
Applied Fluid Mechanics
 Applied Fluid Mechanics 1. The Nature of Fluid and the Study of Fluid Mechanics 2. Viscosity of Fluid 3. Pressure Measurement 4. Forces Due to Static Fluid 5. Buoyancy and Stability 6. Flow of Fluid and
Aeroacoustic Evaluation of an Axial Fan using CFD Methods Frederik Folke, Martin Hildenbrand (ITB Ingenieure GmbH)
") Aeroacoustic Evaluation of an Axial Fan using CFD Methods Frederik Folke, Martin Hildenbrand (ITB Ingenieure GmbH) ITB_SGC_AeroacousticEvaluationOfAnAxialFanUsingCFDMethods_160803.pptx ITB GmbH, Folke,
Aeroacoustic Evaluation of an Axial Fan using CFD Methods Frederik Folke, Martin Hildenbrand (ITB Ingenieure GmbH) ITB_SGC_AeroacousticEvaluationOfAnAxialFanUsingCFDMethods_160803.pptx ITB GmbH, Folke,
ASSESSMENT OF DESIGN METHODOLOGY AND THREE DIMENSIONAL NUMERICAL (CFD) ANALYSIS OF CENTRIFUGAL BLOWER
 ANALYSIS OF CENTRIFUGAL BLOWER") ASSESSMENT OF DESIGN METHODOLOGY AND THREE DIMENSIONAL NUMERICAL (CFD) ANALYSIS OF CENTRIFUGAL BLOWER D. R. Chaudhari 1, H. N. Patel 2 1,2 Mechanical Department, Government Engineering College Dahod, (India)
ASSESSMENT OF DESIGN METHODOLOGY AND THREE DIMENSIONAL NUMERICAL (CFD) ANALYSIS OF CENTRIFUGAL BLOWER D. R. Chaudhari 1, H. N. Patel 2 1,2 Mechanical Department, Government Engineering College Dahod, (India)
Fan Noise Control by Enclosure Modification
 Fan Noise Control by Enclosure Modification Moohyung Lee a, J. Stuart Bolton b, Taewook Yoo c, Hiroto Ido d, Kenichi Seki e a,b,c Ray W. Herrick Laboratories, Purdue University 14 South Intramural Drive,
TURBULENCE CONTROL SCREEN IMPACT ON TURBOFAN NOISE SPECTRA IN FAR SOUND FIELD
 The 21 st International Congress on Sound and Vibration 13-17 July, 2014, Beijing/China TURBULENCE CONTROL SCREEN IMPACT ON TURBOFAN NOISE SPECTRA IN FAR SOUND FIELD Yaroslav Pochkin, Yuri Khaletskiy CIAM,
Calculation of propeller s load noise using LES and BEM numerical acoustics coupling methods
 Boundary Elements and Other Mesh Reduction Methods XXXIII 85 Calculation of propeller s load noise using LES and BEM numerical acoustics coupling methods Q. Yang 1, Y. Wang 1 & M. Zhang 2 1 College of
Numerical Investigation on the Performance of Double Layered H-Rotor Darrieus Turbine
 Numerical Investigation on the Performance of Double Layered H-Rotor Darrieus Turbine Submitted by S.M. Rakibul Hassan Student ID: 0413102055 Supervisor Dr. Mohammad Ali Professor Department of Mechanical
NOISE REDUCTION OF CENTRIFUGAL COMPRESSORS USING ARRAY OF QUARTER WAVELENGTH RESONATORS. A Thesis NAN YE
 NOISE REDUCTION OF CENTRIFUGAL COMPRESSORS USING ARRAY OF QUARTER WAVELENGTH RESONATORS A Thesis by NAN YE Submitted to the Office of Graduate and Professional Studies of Texas A&M University in partial
FLOW CHARACTERISTICS IN A VOLUTE-TYPE CENTRIFUGAL PUMP USING LARGE EDDY SIMULATION
 FLOW CHARACTERISTICS IN A VOLUTE-TYPE CENTRIFUGAL PUMP USING LARGE EDDY SIMULATION Beomjun Kye Keuntae Park Department of Mechanical & Aerospace Engineering Department of Mechanical & Aerospace Engineering
Aeroacoustic simulation of automotive ventilation outlets
 Aeroacoustic simulation of automotive ventilation outlets J.-L. Adam a, D. Ricot a, F. Dubief a and C. Guy b a Renault SAS, 1 avenue du golf, 78288 Guyancourt, France b Ligeron, Les Algorithmes Bâtiment
ABSTRACT NOMENCLATURE 1.0 INTRODUCTION THE AERONAUTICAL JOURNAL FEBRUARY
 THE AERONAUTICAL JOURNAL FEBRUARY 2005 75 Experimental investigation of the effect of nozzle shape and test section perforation on the stationary and non-stationary characteristics of flow field in the
Aerodynamic noise produced in flow around an automobile bonnet
 Aerodynamic noise produced in flow around an automobile bonnet Hiroshi Yokoyama 1, Takahiro Nakajima 2, Taishi Shinohara 3, Masashi Miyazawa 4 and Akiyoshi Iida 5 1,2,3,5 Department of Mechanical Engineering,
[Maddu, 5(12): December2018] ISSN DOI /zenodo Impact Factor
![[Maddu, 5(12): December2018] ISSN DOI /zenodo Impact Factor](/thumbs/92/109637914.jpg "[Maddu, 5(12): December2018] ISSN DOI /zenodo Impact Factor") GLOBAL JOURNAL OF ENGINEERING SCIENCE AND RESEARCHES ANALYSIS OF RADIATOR FAN OF WDM-2 LOCO ENGINE FOR EFFICIENCY IMPROVEMENT Yesu Ratnam. Maddu *1, K.Divakara Murthy 2 & Shaik Saidulu 3 *1,3 Assistant
GLOBAL JOURNAL OF ENGINEERING SCIENCE AND RESEARCHES ANALYSIS OF RADIATOR FAN OF WDM-2 LOCO ENGINE FOR EFFICIENCY IMPROVEMENT Yesu Ratnam. Maddu *1, K.Divakara Murthy 2 & Shaik Saidulu 3 *1,3 Assistant
Aeroacoustic and Aerodynamics of Swirling Flows*
 Aeroacoustic and Aerodynamics of Swirling Flows* Hafiz M. Atassi University of Notre Dame * supported by ONR grant and OAIAC OVERVIEW OF PRESENTATION Disturbances in Swirling Flows Normal Mode Analysis
LANDING GEARS AERODYNAMIC INTERACTION NOISE
 European Congress on Computational Methods in Applied Sciences and Engineering ECCOMAS 2004 P. Neittaanmäki, T. Rossi, S. Korotov, E. Oñate, J. Périaux, and D. Knörzer (eds.) Jyväskylä, 24 28 July 2004
Contents. Preface... xvii
 Contents Preface... xvii CHAPTER 1 Idealized Flow Machines...1 1.1 Conservation Equations... 1 1.1.1 Conservation of mass... 2 1.1.2 Conservation of momentum... 3 1.1.3 Conservation of energy... 3 1.2
INFLUENCE OF ACOUSTIC EXCITATION ON AIRFOIL PERFORMANCE AT LOW REYNOLDS NUMBERS
 ICAS 2002 CONGRESS INFLUENCE OF ACOUSTIC EXCITATION ON AIRFOIL PERFORMANCE AT LOW REYNOLDS NUMBERS S. Yarusevych*, J.G. Kawall** and P. Sullivan* *Department of Mechanical and Industrial Engineering, University
This article appeared in a journal published by Elsevier. The attached copy is furnished to the author for internal non-commercial research and
 This article appeared in a journal published by Elsevier. The attached copy is furnished to the author for internal non-commercial research and education use, including for instruction at the authors institution
2004 ASME Rayleigh Lecture
 24 ASME Rayleigh Lecture Fluid-Structure Interaction and Acoustics Hafiz M. Atassi University of Notre Dame Rarely does one find a mass of analysis without illustrations from experience. Rayleigh Analysis
REVIEW OF NOISE PREDICTION METHODS FOR AXIAL FLOW FANS. Thomas Carolus, Marc Schneider
 Prepared as Paper IN000/391 for INTER.NOISE 000, Nice, France, Aug. 000 REVIEW OF NOISE PREDICTION METHODS FOR AXIAL FLOW FANS Thomas Carolus, Marc Schneider ABSTRACT This paper will review some methods
Manhar Dhanak Florida Atlantic University Graduate Student: Zaqie Reza
 REPRESENTING PRESENCE OF SUBSURFACE CURRENT TURBINES IN OCEAN MODELS Manhar Dhanak Florida Atlantic University Graduate Student: Zaqie Reza 1 Momentum Equations 2 Effect of inclusion of Coriolis force
Visualization of flow pattern over or around immersed objects in open channel flow.
 EXPERIMENT SEVEN: FLOW VISUALIZATION AND ANALYSIS I OBJECTIVE OF THE EXPERIMENT: Visualization of flow pattern over or around immersed objects in open channel flow. II THEORY AND EQUATION: Open channel:
AERODYNAMIC NOISE SIMULATION OF PROPELLER FAN BY LARGE EDDY SIMULATION
 日本機械学会環境工学部門 NEE(Numerical Environmental Engineering) 研究会 P.1 AERODYNAMIC NOISE SIMULATION OF PROPELLER FAN BY LARGE EDDY SIMULATION Shingo Hamada ADVANCED TECHNOLOGY R&D CENTER MITSUBISHI ELECTRIC Corp.
Hybrid CFD/FEM calculations for the aeroacoustic noise radiated from a radial fan
 Hybrid CFD/FEM calculations for the aeroacoustic noise radiated from a radial fan Hakan Dogan Department of Mathematics, Physics and Chemistry, Beuth University of Applied Sciences, Berlin, Chris Eisenmenger
Experimental Studies for Visualization of Flow with Boundary Layers in an Axial Compressor Fan Inlet using Pressure Probes
 Indian Journal of Science and Technology, Vol 9(45), DOI: 10.17485/ijst/2016/v9i45/104694, December 2016 ISSN (Print) : 0974-6846 ISSN (Online) : 0974-5645 Experimental Studies for Visualization of Flow
Stefano Rolfo, Charles Moulinec and David R. Emerson. Scientific Computing Department, STFC Daresbury Laboratory, Warrington
 Implementation of a highly scalable aeroacoustic module based on the Ffowcs-Williams and Hawkings analogy within the open-source CFD software Code_Saturne Stefano Rolfo, Charles Moulinec and David R. Emerson
AEROACOUSTIC INVESTIGATION OF THE EFFECT OF A DETACHED FLAT PLATE ON THE NOISE FROM A SQUARE CYLINDER
 Abstract AEROACOUSTIC INVESTIGATION OF THE EFFECT OF A DETACHED FLAT PLATE ON THE NOISE FROM A SQUARE CYLINDER Aniket D. Jagtap 1, Ric Porteous 1, Akhilesh Mimani 1 and Con Doolan 2 1 School of Mechanical
CHAPTER 4 OPTIMIZATION OF COEFFICIENT OF LIFT, DRAG AND POWER - AN ITERATIVE APPROACH
 82 CHAPTER 4 OPTIMIZATION OF COEFFICIENT OF LIFT, DRAG AND POWER - AN ITERATIVE APPROACH The coefficient of lift, drag and power for wind turbine rotor is optimized using an iterative approach. The coefficient
Design of Test Section for Coriolis Rig and Numerical Simulation of Cooling Flow Through Test Section
 University Turbine Systems Research (UTSR) Industrial Fellowship Program 2012 Design of Test Section for Coriolis Rig and Numerical Simulation of Cooling Flow Through Test Section Prepared For: Solar Turbines,
Contents. 2 Basic Components Aerofoils Force Generation Performance Parameters xvii
 Contents 1 Working Principles... 1 1.1 Definition of a Turbomachine... 1 1.2 Examples of Axial Turbomachines... 2 1.2.1 Axial Hydraulic Turbine... 2 1.2.2 Axial Pump... 4 1.3 Mean Line Analysis... 5 1.4
Numerical and Experimental Study on Mechanism of Low Frequency Noise from Heat Recovery Steam Generator
 Numerical and Experimental Study on Mechanism of Low Frequency Noise from Heat Recovery Steam Generator Hongyun TANG 1, Weikang JIANG 2, Zhenmao ZHONG 3, Yingjiu ZHAO 4 1 Institute of Vibration, Shock
Operation and sound power characteristics of cooling fans in surrounding structures
 20 Operation and sound power characteristics of cooling fans in surrounding structures Johannes Hyrynen, VTT Industrial Systems P.O.Box 1307 33101Tampere Finland This paper gives a view of means to design
Turboengine noise prediction: present and future. S. Moreau Département de Génie Mécanique Université de Sherbrooke, QC, Canada
 Turboengine noise prediction: present and future S. Moreau Département de Génie Mécanique Université de Sherbrooke, QC, Canada Background Ventilation systems (cockpit, cargo) Fan alone or rotor-stator
On the noise reduction mechanism of a flat plate serrated trailing edge at low-to-moderate Reynolds number
 On the noise reduction mechanism of a flat plate serrated trailing edge at low-to-moderate Reynolds number Danielle J. Moreau, Laura A. Brooks and Con J. Doolan The University of Adelaide, South Australia,
Evaluation of Aeroacoustic Noise Source Structure. around Panhead of a Pantograph in High-Speed Railway
 Evaluation of Aeroacoustic Noise Source Structure around Panhead of a Pantograph in High-Speed Railway 1 M. Ikeda, 1 T. Mitsumoji 1 Railway Technical Research Institute, Tokyo, Japan Abstract: As the maimum
COMPUTER AIDED DESIGN OF RADIAL TIPPED CENTRIFUGAL BLOWERS AND FANS
 4 th International Conference on Mechanical Engineering, December 26-28, 21, Dhaka, Bangladesh/pp. IV 55-6 COMPUTER AIDED DESIGN OF RADIAL TIPPED CENTRIFUGAL BLOWERS AND FANS Nitin N. Vibhakar* and S.
Applied Fluid Mechanics
 Applied Fluid Mechanics 1. The Nature of Fluid and the Study of Fluid Mechanics 2. Viscosity of Fluid 3. Pressure Measurement 4. Forces Due to Static Fluid 5. Buoyancy and Stability 6. Flow of Fluid and
Aero-Acoustic assessment of installed propellers
 Aero-Acoustic assessment of installed propellers Marius Gabriel COJOCARU*,1, Mihai Leonida NICULESCU 1, Mihai Victor PRICOP 1 *Corresponding author *,1 INCAS National Institute for Aerospace Research Elie
CFD Analysis of Micro-Ramps for Hypersonic Flows Mogrekar Ashish 1, a, Sivakumar, R. 2, b
 Applied Mechanics and Materials Submitted: 2014-04-25 ISSN: 1662-7482, Vols. 592-594, pp 1962-1966 Revised: 2014-05-07 doi:10.4028/www.scientific.net/amm.592-594.1962 Accepted: 2014-05-16 2014 Trans Tech
VIBRATION RESPONSE OF AN ELECTRIC GENERATOR
 Research Report BVAL35-001083 Customer: TEKES/SMART VIBRATION RESPONSE OF AN ELECTRIC GENERATOR Paul Klinge, Antti Hynninen Espoo, Finland 27 December, 2001 1 (12) Title A B Work report Public research
Application of a Helmholtz resonator excited by grazing flow for manipulation of a turbulent boundary layer
 Application of a Helmholtz resonator excited by grazing flow for manipulation of a turbulent boundary layer Farzin Ghanadi School of Mechanical Engineering The University of Adelaide South Australia, 5005
NUMERICAL SIMULATION OF THE UNSTEADY AERODYNAMICS IN AN AXIAL COUNTER-ROTATING FAN STAGE
 NUMERICAL SIMULATION OF THE UNSTEADY AERODYNAMICS IN AN AXIAL COUNTER-ROTATING FAN STAGE Younsi M.* and Hutchinson B. *Author for correspondence ANSYS, Inc. 15 place Georges Pompidou 78180 Montigny le
Toshinori Watanabe Department of Aeronautics and Astronautics The University of Tokyo Tokyo, Japan
 Review: Active Control of Shock-associated Unsteady Flow Phenomena in Aeroengines - Suppression Techniques for Transonic Cascade Flutter and Supersonic Jet Noise - Toshinori Watanabe Department of Aeronautics
Investigation of the Effect of Inflow Distortion on the Noise Emitted from an Axial Flow Fan Experiencing Cross Flow
 Investigation of the Effect of Inflow Distortion on the Noise Emitted from an Axial Flow Fan Experiencing Cross Flow J. Tirakala, H.-J. Kaltenbach Lehrstuhl für Aerodynamik und Strömungsmechanik Overview
Keywords - Gas Turbine, Exhaust Diffuser, Annular Diffuser, CFD, Numerical Simulations.
 Numerical Investigations of PGT10 Gas Turbine Exhaust Diffuser Using Hexahedral Dominant Grid Vaddin Chetan, D V Satish, Dr. Prakash S Kulkarni Department of Mechanical Engineering, VVCE, Mysore, Department
CALIFORNIA POLYTECHNIC STATE UNIVERSITY Mechanical Engineering Department ME 347, Fluid Mechanics II, Winter 2018
 CALIFORNIA POLYTECHNIC STATE UNIVERSITY Mechanical Engineering Department ME 347, Fluid Mechanics II, Winter 2018 Date Day Subject Read HW Sept. 21 F Introduction 1, 2 24 M Finite control volume analysis
Propeller Loads of Large Commercial Vessels at Crash Stop
 Second International Symposium on Marine Propulsors smp 11, Hamburg, Germany, June 2011 Propeller Loads of Large Commercial Vessels at Crash Stop J.W. Hur, H. Lee, B.J. Chang 1 1 Hyundai Heavy Industries,
Fan Blade Trailing-Edge Noise Prediction Using RANS Simulations
 Acoustics 8 Paris Fan Blade Trailing-Edge Noise Prediction Using RANS Simulations Y. Rozenberg a, M. Roger b and S. Moreau c a ONERA, BP 72-29 avenue de la Division Leclerc, 92322 Chatillon Cedex, France
inter.noise 2000 The 29th International Congress and Exhibition on Noise Control Engineering August 2000, Nice, FRANCE
 Copyright SFA - InterNoise 2000 1 inter.noise 2000 The 29th International Congress and Exhibition on Noise Control Engineering 27-30 August 2000, Nice, FRANCE I-INCE Classification: 7.0 VIBRATIONS OF FLAT
Side-View Mirror Vibrations Induced Aerodynamically by Separating Vortices
 Open Journal of Fluid Dynamics, 2016, 6, 42-56 Published Online March 2016 in SciRes. http://www.scirp.org/journal/ojfd http://dx.doi.org/10.4236/ojfd.2016.61004 Side-View Mirror Vibrations Induced Aerodynamically
1 Wind Turbine Acoustics. Wind turbines generate sound by both mechanical and aerodynamic
 Wind Turbine Acoustics 1 1 Wind Turbine Acoustics Wind turbines generate sound by both mechanical and aerodynamic sources. Sound remains an important criterion used in the siting of wind farms. Sound emission
FLOW PATTERN STUDY OF A CENTRIFUGAL PUMP USING CFD METHODS CONCENTRATING ON VOLUTE TONGUE ROLE
 FLOW PATTERN STUDY OF A CENTRIFUGAL PUMP USING CFD METHODS CONCENTRATING ON VOLUTE TONGUE ROLE N. Pourmahmoud and S. Majid Taleby Faculty of Engineering, Urmia University, Urmia, Iran E-Mail: majid.taleby@gmail.com
inter.noise 2000 The 29th International Congress and Exhibition on Noise Control Engineering August 2000, Nice, FRANCE
 Copyright SFA - InterNoise 2000 1 inter.noise 2000 The 29th International Congress and Exhibition on Noise Control Engineering 27-30 August 2000, Nice, FRANCE I-INCE Classification: 1.1 DESIGN OF TERMINATING
Lecture-4. Flow Past Immersed Bodies
 Lecture-4 Flow Past Immersed Bodies Learning objectives After completing this lecture, you should be able to: Identify and discuss the features of external flow Explain the fundamental characteristics
Research on Dynamic Stall and Aerodynamic Characteristics of Wind Turbine 3D Rotational Blade
 Research on Dynamic Stall and Aerodynamic Characteristics of Wind Turbine 3D Rotational Blade HU Guo-yu, SUN Wen-lei, Dong Ping The School of Mechanical Engineering Xinjiang University Urumqi, Xinjiang,
Computational Fluid Dynamics Study Of Fluid Flow And Aerodynamic Forces On An Airfoil S.Kandwal 1, Dr. S. Singh 2
 Computational Fluid Dynamics Study Of Fluid Flow And Aerodynamic Forces On An Airfoil S.Kandwal 1, Dr. S. Singh 2 1 M. Tech Scholar, 2 Associate Professor Department of Mechanical Engineering, Bipin Tripathi
Experimental Verification of CFD Modeling of Turbulent Flow over Circular Cavities using FLUENT
 Experimental Verification of CFD Modeling of Turbulent Flow over Circular Cavities using FLUENT T Hering, J Dybenko, E Savory Mech. & Material Engineering Dept., University of Western Ontario, London,
STABILITY CONSIDERATIONS A SIMPLIFIED APPROACH
 Proceedings of the First Middle East Turbomachinery Symposium February 13-16, 2011, Doha, Qatar STABILITY CONSIDERATIONS A SIMPLIFIED APPROACH Urs Baumann Head of Calculation and Development MAN Diesel
Large-eddy simulations for wind turbine blade: rotational augmentation and dynamic stall
 Large-eddy simulations for wind turbine blade: rotational augmentation and dynamic stall Y. Kim, I.P. Castro, and Z.T. Xie Introduction Wind turbines operate in the atmospheric boundary layer and their
Studies on the Transition of the Flow Oscillations over an Axisymmetric Open Cavity Model
 Advances in Aerospace Science and Applications. ISSN 2277-3223 Volume 3, Number 2 (2013), pp. 83-90 Research India Publications http://www.ripublication.com/aasa.htm Studies on the Transition of the Flow
Study on Acoustically Transparent Test Section of Aeroacoustic Wind Tunnel
 Journal of Applied Mathematics and Physics, 2018, 6, 1-10 http://www.scirp.org/journal/jamp ISSN Online: 2327-4379 ISSN Print: 2327-4352 Study on Acoustically Transparent Test Section of Aeroacoustic Wind
ME332 FLUID MECHANICS LABORATORY (PART I)
") ME332 FLUID MECHANICS LABORATORY (PART I) Mihir Sen Department of Aerospace and Mechanical Engineering University of Notre Dame Notre Dame, IN 46556 Version: January 14, 2002 Contents Unit 1: Hydrostatics
ME332 FLUID MECHANICS LABORATORY (PART I) Mihir Sen Department of Aerospace and Mechanical Engineering University of Notre Dame Notre Dame, IN 46556 Version: January 14, 2002 Contents Unit 1: Hydrostatics