RELATING CAPILLARY PRESSURE TO INTERFACIAL AREAS
|
|
|
- Julian Sanders
- 5 years ago
- Views:
Transcription
1 Proceedings of the Project Review, Geo-Mathematical Imaging Group (Purdue University, West Lafayette IN), Vol. 1 (2008) pp RELATING CAPILLARY PRESSURE TO INTERFACIAL AREAS LAURA J. PYRAK-NOLTE, DAVID D. NOLTE, DAIQUAN CHEN, AND NICHOLAS J. GIORDANO Abstract. Experiments were performed on transparent two-dimensional micro-fluidic porous systems to investigate the relationships among capillary pressure and the interfacial areas per volume among two fluid phases and one solid phase. Capillary pressures were calculated from the observed interfacial curvature of the wetting non-wetting interface, and these correlated closely to externally measured values of applied pressure. For each applied capillary pressure, the system established mechanical equilibrium characterized by stationary interfaces, uniform curvatures across the model, and random surface normals. To study the relationships among capillary pressure and the interfacial areas, we compare the curvature-based capillary pressure to the differential change in interfacial areas per volume as a function of wetting-phase saturation. The differential pressure contributions calculated from the experimental measurements are found to be nearly independent of the measured capillary pressure. These results suggest that other contributions to the capillary pressure must be significant when imbibition and drainage processes result in saturation gradients. 1. Introduction. The distribution of two immiscible fluid phases in a porous medium is predicated on the Young-Laplace equation which relates capillary pressure, p c, to the geometry of the fluid-fluid interface through the interfacial tension between the two immiscible fluid phases (1.1) p c = γ wn ( 1 R R 2 ) = γ wn K where γ wn is the interfacial tension (also referred to as surface tension) between the wetting, w, and non-wetting, n, phases and K is the mean curvature of the interfaces based on the principal radii of curvature of the surface, R 1 and R 2. Whether a fluid is a wetting phase or a non-wetting phase is determined by the cohesive and adhesive forces among the fluid phases and the solid. The equilibrium contact angle is defined as the angle between the solid surface and the tangent to the liquid surface at the line of contact with the solid (Barnes & Gentle, 2005). A wetting-phase fluid exhibits a contact angle that is less than 90 o and tends to spread out and to wet the solid. When two immiscible fluids are present, one fluid wets the surface, tending to displace the other fluid from the surface. In equilibrium, the forces among the fluids and the solid are balanced and produce a curved interface between the two fluid phases. A curved interface between two fluids indicates that a pressure difference exists across the interface, and this pressure difference is balanced by the surface tension forces. This pressure difference is referred to as the capillary pressure. At equilibrium, p ceq is defined by (1.2) p ceq = p n p w as the pressure difference between the wetting-phase pressure, p w, and the non-wetting-phase pressure, p n. Equation (1.1) is a pore-scale description that is often used in theoretical analyses and pore network modeling to distribute two immiscible fluid phases within the network (Wilkinson, 1986; Ioannidis et al., 1991; Dullien, 1992; Reeves & Celia, 1996; Held & Celia, 2001). Equation (1.2), on the other hand, is a macroscopic relationship used in laboratory experiments on soil and rock cores to relate measurements of the non-wetting and wetting phase fluid pressures to concurrent measurements of saturation, S. For multiphase flow, a macroscopic capillary pressure saturation Department of Physics, Purdue University, West Lafayette, Indiana 47907, Department of Earth and Atmospheric Sciences, Purdue University, West Lafayette, Indiana (ljpn@physics.purdue.edu). Department of Physics, Purdue University, West Lafayette, Indiana (nolte@physics.purdue.edu). Department of Earth and Atmospheric Sciences, Purdue University, West Lafayette, Indiana 47907, currently at Petroleum Abstracts, The University of Tulsa, Tulsa, OK Department of Physics, Purdue University, West Lafayette, Indiana (giordano@purdue.edu). 221
2 222 L. J. PYRAK-NOLTE, D. D. NOLTE, D CHEN, AND N. J. GIORDANO relationship provides one of the constitutive relationships (Bear & Verruijt, 1987) used to couple flow equations (e.g., modified Darcy s Law) for each fluid phase in a porous medium. This constitutive relationship is (1.3) p n p w = p ceq = f(s) While this constitutive relationship is appealing, such descriptions of multiphase flow are not based on fundamental fluid dynamics, and are known to fail in many cases (Bear, 1972; Dullien, 1992; van Genabeek & Rothman, 1996; Muccino et al., 1998). In general, knowledge of the saturation of each phase is not sufficient to describe the state of the system. Numerous experimental investigations have shown that p ceq is not a single-valued function of saturation, but has a hysteretic relationship with the imbibition history of the system (Collins, 1961; Morrow, 1965; Topp, 1969; Colonna et al., 1972; Bear, 1979; Lenhard, 1992; Dullien, 1992). Hence, capillary pressure cannot be determined simply from saturation or vice-versa. In the past few decades, several investigators (Rapoport & Leas, 1951; Gvirtzman, 1991; Bradford, S. A. and F. J. Leij, 1997; Gray & Hassanizadeh, 1989, 1989, 1998; Hassanizedah & Gray, 1990; Powers et al., 1991; Reeves & Celia, 1996; Deinert et al., 2005) have recognized that an accurate description of multiphase flow in a porous medium must account for the thermodynamics and the geometry of the interfaces between the fluids (and between the fluids and the solid phase). In that work, the physics of the interfaces enters as an interfacial area per volume, which, when combined with capillary pressure and saturation, is hypothesized (Hassanizadeh & Gray, 1990 & 1993; Muccino et al., 1998) to lead to a unique description of the thermodynamic energy state. Cheng (2002), Cheng et al. (2004) and Chen et al. (2007) showed experimentally that the capillary-dominated interfacial area per volume does lift the ambiguity in the hysteretic relationship between capillary pressure and saturation. While saturation provides a description of the relative amounts of the fluids, interfacial area per volume between the wetting and non-wetting phase provides a partial description of the spatial distribution of the fluids. Thermodynamically-based theoretical studies have proposed relationships among capillary pressure, p c, saturation and interfacial areas of the interfaces between phases when multiple fluids are present in a porous medium (Morrow, 1970; Kalaydjian, 1987; Hassanizadeh & Gray, 1990 & 1993; Deinert et al., 2005). In their 1993 paper, Hassanizadeh & Gray proposed that capillary pressure, p c, in thermodynamic equilibrium under uniform phase distribution, is related to interfacial areas per volume by (1.4) p c = s w ρ w Aw s w sn ρ n An s w αβ γ αβ φ ( a αβ s w ) T,φ,Γ αβ,a αβ where γ αβ is the interfacial tension between phases α and β, a αβ is the interfacial area per volume between phases α and β, A α is the Helmholtz free energy of phase α per unit mass of phase α, ρ α is the mass of phase α per unit volume of α phase, φ, is the porosity, and s w is the saturation of the wetting phase. The phases are represented by w for the wetting phase, n for the non-wetting phase and s for the solid phase. The porosity is represented by φ. The first and second terms in equation (1.4) explicitly include the dependence of the free energy on saturation, which would apply to the case of saturation gradients across the system. There is no term for free energy associated with the solid phase because it does not depend on saturation. Because of the fundamental presence of saturation gradients during the physical process of imbibition and drainage in a porous medium, these free energy terms may be anticipated to make important contributions. Expanding the last term of equation (1.4) gives the differential pressure contributions: (1.5) αβ γ αβ φ ( a αβ s w ) = 1 [γ φ T,φ,Γ αβ,a αβ wn awn s s s w ans aws + γns + γws w w ]
3 CAPILLARY PRESSURE AND INTERFACIAL AREAS 223 Equation (1.5) is derived from the change in free energy of the interfaces caused by a change in wetting phase saturation and indicates that capillary pressure is a function not only of saturation but also depends on the interfacial area per volume between the fluid phases and between each fluid phase and the solid. Equation (1.5) requires each partial derivative to be taken at a constant temperature, T, medium porosity, interfacial mass density, Γ αβ, and Helmholtz free energy of interface αβ per unit mass of interface αβ, A αβ. Only at equilibrium will equation (1.4) be equal to p n p w (equation (1.2)). The first term in equation (1.5) is the same as that proposed by Kalaydjian (1987) to be equal to p c. In their study, Deinert et al. (2005) proposed a subset of the terms in equation (1.5) to be equal to p c by defining the system to be confined to the wetting fluid and thus eliminated the term associated with the interfacial area between the non-wetting phase and the solid. These considerations raise important questions about the role played by the terms in equation (1.5), about the relative magnitude of the individual contributions of the individual terms in equation (1.4), and how or whether these are related to p c. To date, the applicability of the relationships among capillary pressure, saturation and interfacial area per volume (such as that given by equation 1.5) has not been tested via laboratory data that directly images interfaces between phases. In this paper, we use the results from imbibition and drainage experiments performed on two-dimensional micro-models to investigate the ability to calculate capillary pressure from measurements of interfacial area per volume and saturation. These experiments measure interfacial area, saturation and interfacial curvature with sufficient accuracy to explore the applicability of equations (1.4) and (1.5). 2. Experimental Details. Measuring pore-scale and sub-pore-scale features requires measurement techniques that can probe interfacial area and pore geometry from the length scale of the pore to the length scale of a representative volume of the porous medium. Experimental methods that have been used to acquire measurements of interfacial area per volume on natural and synthetic samples include synchrotron-based x-ray micro-tomography (Culligan et al., 2004 & 2006), photoluminescent volumetric imaging (Montemagno & Gray, 1995) and interfacial tracers (Saripalli et al., 1997; Annable et al., 1998; Kim et al, 1999a&b; Anwar et al., 2000; Rao et al., 2000; Shaefer et al., 2000; Costanza-Robinson et al., 2002; Chen & Kibbey, 2006) In this study, we use transparent two-dimensional micro-models to quantify fluid and interfacial distributions to investigate the robustness of capillary pressure calculations from interfacial information. The admitted disadvantage of using micro-models is that they are inherently two-dimensional systems. However, these are the only systems that enable direct visualization and quantification of interfaces with such high resolution. A general review of two-dimensional micro-models is given in Giordano and Cheng (2001). The details of our experimental approach can be found in Cheng (2002), Cheng et al. (2004), Chen (2006) and Chen et al. (2007). A general review of other techniques for producing micro-models is given by Giordano and Cheng (2001). A detailed description of the procedures for performing optical lithography is given in the manufacturer s manual (Shipley, 1982) and by Thompson, Willson and Bowden (1994). Below, we present a brief description of the experimental method to aid in the understanding of the results. The micro-models used in this investigation were constructed using optical lithography. A pore-structure pattern is transferred under vis-uv illumination from a transparent mask to a photosensitive polymer layer called a photoresist. The thickness of the photoresist layer determines the depth of the flow channels. When a region of the photoresist is exposed to a sufficiently large integrated intensity of blue light, a photochemical reaction within the photoresist makes the region soluble in a developer solution. The unexposed photoresist is not soluble, so after development the photoresist layer contains a negative image of the original light pattern. For the micro-models in this study, we used Shipley photoresist types 1805 and 1827 with their standard developer (Shipley, 1982). The micro-models were fabricated with pore networks covering a 600 µm x 600 µm area. The pore structure for the micro-models was generated using a standard random continuum percolation construction (Nolte & Pyrak-Nolte, 1991). Table 2.1 lists the name, the porosity and the depth (aperture) of the flow channels of the two micro-models shown in Figure 1. Model S70 has a 2
 S70 - Aperture 2 microns (b) S1dc - Aperture 1")

4 224 L. J. PYRAK-NOLTE, D. D. NOLTE, D CHEN, AND N. J. GIORDANO Sample Name Aperture Porosity Number of Images Analyzed S µm 62.3% 196 S1dc 1.0 µm 70.3% 411 Table 2.1 The name, size, porosity and number of images analyzed of the micro-models used in this study. (a) S70 - Aperture 2 microns (b) S1dc - Aperture 1 micron Fig. 1. Digital images of micro-models (a) S70 and (b) S1dc. In the images, nitrogen is white, and photoresist (solid) is dark gray. micron aperture, while model S1dc has a 1 micron aperture. The entrance pressure between these two micro-models differs by a corresponding factor of two. The two different apertures of 1 micron for model S1dc and 2 microns for model S70 test for aperture-dependent systematics in the data. A pressure system was used for introducing two fluid phases into the micro-models. The system enables the simultaneous measurements of pressure and optical characterization of the geometries of the three phases (two fluid, one solid) within the sample. The apparatus contains a pressure sensor (Omega PX5500C1-050GV) to monitor the inlet pressure, and a video camera that is interfaced to an optical microscope to image the two-phase displacement experiments. The outlet is exposed to atmospheric pressure. To perform a measurement on a micro-model, the micro-model is initially saturated with decane, a wetting fluid, which is inserted from the outlet side. A second fluid, nitrogen gas, is then introduced from the inlet. The initially decane-saturated micro-models are invaded with nitrogen by the incremental application of pressure. After each pressure increment, the system is allowed to reach mechanical equilibrium (typically 3 to 5 minutes) in which the interfaces are fully stationary, and the inlet pressure is recorded. Then the saturation and distribution of each phase are digitally imaged by a CCD camera through the microscope. The camera is a Qimaging Retiga EX with an array of 1360 x 1036 pixels that have a pixel-size 6.45 microns by 6.45 microns with 12-bit digitization and FireWire (IEEE-1394) transfer. The microscope is an Olympus microscope with a 16x objective and is illuminated with a white light source through a red filter. The resulting digital images have a pixel resolution of 0.6 microns. All measurements are conducted at room temperature (temperature stability better than 0.5 degree Celsius during a measurement), with the apparatus located within
5 CAPILLARY PRESSURE AND INTERFACIAL AREAS 225 Sample Name Xpos, Ypos Min Val Max Val S70 700, S1dc 700, Table 3.1 The sample name and IDL parameters used in the SEARCH2D command to analyze the mask for samples S70 and S1dc. a clean-bench environment. Sample S70 was sent through several imbibition and drainage scanning cycles under a total of 196 pressures. Sample S1dc was similarly subjected to scanning cycles under 411 different pressures. An image was captured and analyzed for each pressure. An archive of the images used in this study have been placed on a website for downloading (see Pyrak-Nolte, 2007). 3. Analysis. To determine capillary pressure from either equation (1.1) or equation (1.5) requires the identification of each phase (decane, nitrogen, solid) and all the interfaces between the phases. Image analysis programs are coded in the IDL language to extract phase saturation, interfacial area per volume (IAV), and curvature of the interfaces from each image. In the analysis, each grayscale image is separated into three separate images, i.e., one binary image representing each phase. The individual phase images are used to determine the saturation of the micro-model for each phase. The fraction of the micro-model composed of photoresist (i.e., the solid portion of the micro-model where no flow occurs) is constant for all drainage-imbibition cycles. Nitrogen and decane saturations of the pore space are calculated as a fraction of total pore space. A mask was used to separate grayscale images into three separate phase images. The mask was a grayscale image of the micro-model filled only with nitrogen. A two-dimensional search algorithm (command SEARCH2D in IDL) was used to find the connected pore space in the model and to determine the regions of photoresist. The SEARCH2D command starts at a specified location (Xpos, Ypos) within the array and finds all data that fall within a specified intensity range (Min Val data Max Val) and are connected. Table 3.1 list the values of Xpos, Ypos, Min val, and Max Val used in the analysis of the masks for samples S70 and S1dc. For both S1dc and S70, the DIAGONAL keyword is used to have the algorithm search all surrounding data points that shared common corners. This analysis results in the generation of a new mask that is a binary image with regions representing pore space set equal to one and those regions representing photoresist set equal to zero. An autocorrelation method was used to align and register the new mask with each image from the drainage and imbibition experiments to ensure that the same region of the micro-model is analyzed for all images After alignment, the grayscale images for each saturation, originally 1520 pixels by 1180 pixels, were cropped to 1000 pixels by 1000 pixels. The SEARCH2D algorithm was then performed on each cropped grayscale image (for each pressure value) to determine the connected nitrogen phase. The connected nitrogen phase was set to a value of 255 and a new image was created. By multiplying the new image by the new mask and searching for all values equal to 255, the phase image for nitrogen is determined. The IDL DILATE command was used on the nitrogen image to algorithmically determine the boundary between nitrogen and the other phases because of optical refraction effects at the interfaces between nitrogen and the other two phases.. A 3 x 3 structure array (with all elements equal to 1) was defined and applied to the nitrogen image through the DILATE command. Without this step, the nitrogen phase did not match the original image because of an apparent rim around the nitrogen phase caused by the diffraction of light from the nitrogen interfaces, or possibly caused by the hidden curvature. The rim around the nitrogen phase can be seen in Figure 2f which is an enlargement of a portion (300 pixels by 300 pixels) of image 94 shown in Figure 2a for sample S70. Using the IDL WHERE command, the location of the photoresist in the mask is determined and those location in the new image are set equal to zero. The phase image for photoresist is defined as the pixels in the new image equal to zero. Regions not equal to 0 or 255 are then defined to
 Digital image of sample S70 partially filled with nitrogen (image 95).")
, (c) and (d). In (e), white represents nitrogen, gray represents decane and the photoresist is shown in black.")

 shown in Figure 2e.")
 between nitrogen and decane (wn); (ii) between decane and photoresist (ws); and (iii) between nitrogen and")

6 226 L. J. PYRAK-NOLTE, D. D. NOLTE, D CHEN, AND N. J. GIORDANO (a) Image (b) Photoresist (c) Decane (d) Nitrogen (e) Composite (f) Portion of Raw Image Fig. 2. (a) Digital image of sample S70 partially filled with nitrogen (image 95). Binary images of (b) photoresist (white regions), (c) decane (white regions) and (d) nitrogen (white regions). A false-colored composite of images (b), (c) and (d). In (e), white represents nitrogen, gray represents decane and the photoresist is shown in black. be decane and the phase image for decane is produced. 2a is a gray scale image from S70 (image 94) partially filled with nitrogen. After applying the imaging processing techniques just describe, the three binary images for Figure 2a are produced and are shown in Figures 2bcd for photoresist, decane and nitrogen, respectively. A false-color composite image is shown in Figure 2e based on combined binary images. A weighting was given to each image to form the false-color composite image (nitrogen*30, decane*5, photoresist*1) shown in Figure 2e. Once the saturation of each phase is established, the interfacial length of each interface is determined. Three interfacial lengths are calculated: (i) between nitrogen and decane (wn); (ii) between decane and photoresist (ws); and (iii) between nitrogen and photoresist (ns). Sobel and thinning operators are applied to each individual phase image at a given nitrogen pressure, and the length of each interface is totaled. At this stage in the analysis, the interfacial length from an individual phase image contains the phase in contact with each of the other phases. For example, for a nitrogen phase image, both the interface between nitrogen and decane and nitrogen and photoresist are included. The interface between two phases is then obtained through the following relationships: (3.1) L wn = (L n + L w L s )/2 L ns = (L n + L s L w )/2 L ws = (L w + L s L n )/2
7 CAPILLARY PRESSURE AND INTERFACIAL AREAS 227 where is L n is the total length of the nitrogen interface, and L w and L s are the total lengths of the decane and photoresist interfaces, respectively. L wn is the length of the interface between nitrogen and decane. L ns is the length of the interface between nitrogen and photoresist. L ws is the length of the interface between decane and photoresist. In this study, we calculate interfacial length per area (ILA) because the hidden curvature associated with the aperture cannot be obtained from the two-dimensional image (although we estimate its contributions in equation (3.3) below). Though we calculate ILA, we will refer to it as either interfacial area per volume (IAV) or by the term a αβ, where α and β give the phases (w for wetting phase, n for non-wetting phase or s for solid) between which the interface occurs. The interfacial area per volume is found by dividing L wn by the total area of the micro-model (600 microns by 600 microns) giving units of inverse length. Chen (2006) and Chen et al. (2007) determined the error in IAV and saturation by applying the analysis technique to circles of known radii and squares with known perimeters and areas. For circles with radii greater than or equal to 4 pixels (2.4 microns), the numerically determined values of IAV were less than 10% of that calculated from 2πr. This is caused by the pixelation of the circle, i.e., a circle made up of small squares. For the same set of circles, the calculated area of the circle vs. number of pixels were within 2.5% for circles with radii greater than or equal to 4 pixels. For circles with radii between 1 pixel and 4 pixels the error in area and IAV range from -20% to 3%, respectively. For the squares, the relative error between the estimated and the known perimeter of the squares is the largest (-30% to -10%) when the edge length is less than 4 pixels but decreases quickly ( 5% at 6 pixels) as the perimeter increases. Other methods exist for determining interfacial areas (e.g. Dalla et al., Mclure et al, 2006; Prodanovic et al., 2006) that might reduce the error, but at this time we chose the simplest analysis method. An archive of the images used in this study have been placed on a website for downloading so other researchers can investigate these issues (see Pyrak-Nolte, 2007). The error caused by the hidden curvature along the z-axis cannot be measured directly, but can be estimated based on the known contact angle of decane on photoresist in nitrogen. The total area of an interface with two principle radii R 1 R 2 is given by (3.2) A = 4R 1 R 2 ( π 2 θ c where θ c is the contact angle. The relative error in this area, caused by a systematic in the hidden contact curvature that cannot be measured directly, is ) 2 (3.3) A A = 4πR 1R 2 θ c π 2 = 4 R 1 R 2 π θ c which is independent of the radii. For decane on photoresist in air, the contact angle is θ c = 0.08 rad. Assuming an error no larger than the contact angle itself (100% change in contact angle), this leads to a maximum error in the calculated interfacial area of about 13%. This is a worst-case value, and practical values of the error are likely to be smaller. Therefore, the hidden curvature in the two-dimensional micro-models is not a large source of error and is no larger than the pixel errors. We adapted a level set method (Sethian, 1985) to calculate capillary pressure using the curvature of the interface between the wetting and non-wetting phases from the images. The curvature of an interface is obtained from the image using (3.4) K = Φ2 yφ xx 2Φ x Φ y Φ xy + Φ 2 xφ yy ( Φ 2 x + Φ 2 y) 3/2 where K is the curvature of the interface, Φ i is the derivative of the image with respect to i where i is either x or y, Φ ii is the second derivative of the image with respect to ii, where ii can be xx, yy
8 228 L. J. PYRAK-NOLTE, D. D. NOLTE, D CHEN, AND N. J. GIORDANO or xy. The derivatives of the two-dimensional images are taken using a kernel method. The kernels (as used in IDL) are defined as (3.5) Φ x = [ 0.5,0,0.5] Φ y = transpose[φ x ] Φ xx = [1.0, 2.0,1.0] Φ yy = transpose[φ xx ] Φ xy = Because of discontinuities in the image densities, the level-set analysis is performed on the phase images convolved with a 19-pixel Gaussian blur of the image. This provides a gray scale or gradient at each interface to allow derivatives to be taken, after which these images are convolved with the kernel. Once the curvature is computed, a mask of the interface relevant to each phase is applied. We use the curvature of only the capillary-dominated interfaces to assess the capillary pressure. The MOMENT command in IDL is used to compute the average curvature for an image. The MOMENT command calculates the mean value based on the values of curvature along each interface, i.e. only the values for pixels representing the wetting-nonwetting interfaces in an image. The most-probable curvature is calculated from the histogram of curvatures for a single image with the value of curvature from the peak of the distribution representing the mode of the curvature. Computation of the normals to the interfaces was also performed. The calculation of the normals begins by using the equation: (3.6) n x = Φ x Φ 2 x + Φ 2 y n y = Φ y Φ 2 x + Φ 2 y and then applying the convolution (3.7) n xx = Image n x n x n yy = Image n y n y n xy = Image n x n y where n xx,n yy and n xy are the normals to the interfaces, and image refers to the two-dimensional image of the interface between two phases. Equation (1.5) requires the calculation of the differential of the interfacial area with respect to saturation at constant energy. In laboratory experiments, it is difficult to ensure that the condition of constant energy is met. In the micro-model experiments, each image is in mechanical equilibrium at a constant pressure, but different images with the same measured capillary pressure, but different saturations, do not have equal free energy because of the hysteresis in the p c s w relationship. Therefore, the three partial derivatives in equation (1.5) must be evaluated from a single image of the micro-model at a given p c. To accomplish this, we used a micro-ensemble approach (Figure 3), in which values of s w and a wn are calculated from a single image based on subsets of the image. A window 980 pixels wide by 300 pixels in length is moved in 1 pixel increments from the inlet to the outlet of the sample (a distance of 680 pixels out of 980 pixels). We choose a representative

9
 as a function of measured capillary pressure for micro-model samples (a) S70 and (b) S1dc.")
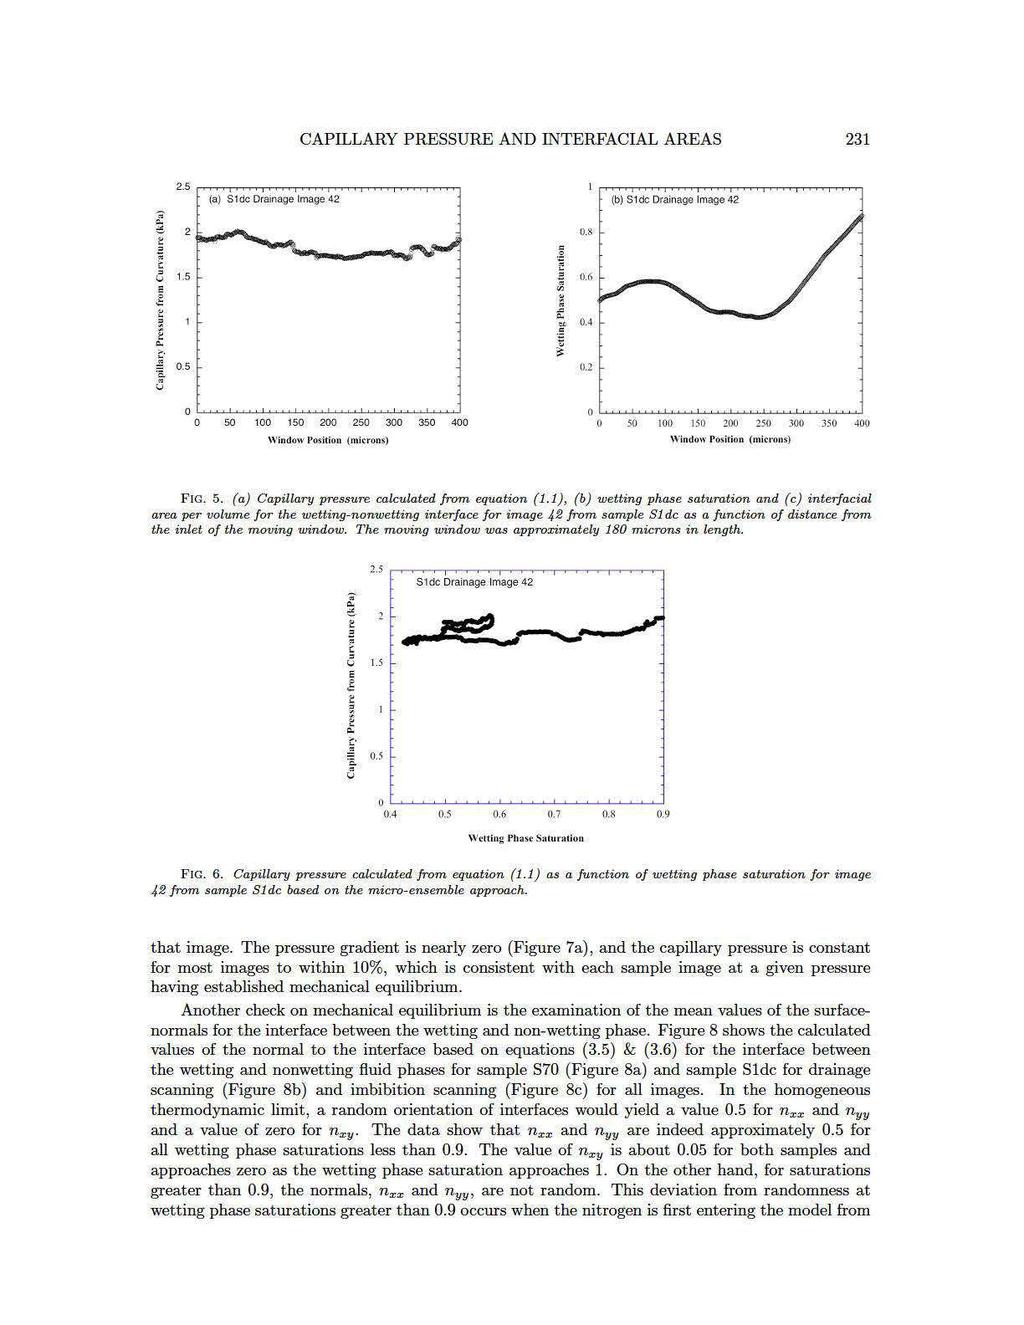
10 230 L. J. PYRAK-NOLTE, D. D. NOLTE, D CHEN, AND N. J. GIORDANO Fig. 4. Capillary pressure calculated from equation (1.1) as a function of measured capillary pressure for micro-model samples (a) S70 and (b) S1dc. given as guide for comparing the change in pressure determined from the interfacial curvature to that recorded by the pressure transducer. Other investigators (Phillip, 1977; Tuller et al., 1999) have shown theoretically that the curvature of interfaces between two immiscible fluids is affected by adsorbed wetting films between the non-wetting phase and the solid. In our analysis, we treated the phenomenonas purely capillary because the presence of films is below the image resolution. For any given image, the capillary-dominated interfaces do not exhibit a delta function distribution of curvatures. Instead, the histogram of the curvature distribution for a single image has a finite width (Cheng et al, 2004). Thus, in Figure 4, two values are presented. These are the pressures based on average curvature of all of the wetting-non-wetting interfaces, and the mode (or most probable) curvature of these interfaces in an image. Using either value, a reasonable agreement between the calculated pressure and the measured pressure is observed for samples S70 and S1dc. The values from the average and the mode agree well with each other in sample S70 (2 micron aperture), but they separate a little for sample S1dc with the smaller aperture (1 micron aperture). The average tends to be a little more stable than the mode, and so the average is used in the remaining figures. The average curvature as a function of distance from the inlet was calculated to determine if the fluids in the image were in mechanical equilibrium by measuring whether the curvature-based capillary pressure is constant throughout the sample for each image. The variation of capillary pressure (Figure 5a), wetting phase saturation, s w, (Figure 5b) and interfacial area per volume (a wn Figure 5c) are shown as functions of distance from the inlet for image 42 (shown in Figure 3) of sample S1dc. The capillary pressure (Figure 5a) is nearly constant with distance from the inlet, which further supports the conclusion that the system is indeed in mechanical equilibrium. However, s w and a wn do vary along the length of the sample. There is clearly a saturation gradient along the inlet-outlet direction. Such a gradient is a fundamental property of all imbibition-drainage processes in which the porous medium is attached to source-sink reservoirs. Figure 6 shows the capillary pressure based on curvature plotted in an alternate way as a function of wetting phase saturation for image 42 (shown in Figure 3) of sample S1dc. Within experimental error, the capillary pressure is not a function of s w even though s w and a wn both vary along the length of the sample. Figure 7a shows the histogram of the pressure gradient and Figure 7b gives the histogram of the coefficient of variance (CV) in the pressure for all 205 images that compose the data set for drainage scanning of sample S1dc. The CV is calculated by taking the standard deviation of the capillary pressures and dividing by the mean capillary pressure value for
11
 Histogram of the pressure gradient and (b) histogram of the coefficient of variance (cv) in the pressure for 205 images from sample S1dc during drainage scanning. the inlet.")
12 232 L. J. PYRAK-NOLTE, D. D. NOLTE, D CHEN, AND N. J. GIORDANO Fig. 7. (a) Histogram of the pressure gradient and (b) histogram of the coefficient of variance (cv) in the pressure for 205 images from sample S1dc during drainage scanning. the inlet. Above 90%, the phase distribution is anisotropic and sensitive to initial conditions as the invading nitrogen fingers compete before one dominates. These data suggest that the individual terms in equation (1.5) can be safely evaluated for wetting-phase saturations below 90% Capillary Pressure from Interfacial Area per Volume. To calculate the contribution to capillary pressure from the interfaces between phases based on equation (1.5), the changes in a wn, a ns, and a ws with wetting phase saturation were calculated for each constant-pressure image (the number of images for each sample is given in Table 2.1). Examples of the relationship between a αβ and s w are shown in Figure 9. For each of the three interfaces, the dependence on s w is highly linear. The slopes of the curves were taken and used in equation (1.5). In Figure 10, the capillary pressure calculated using equation (1.5) is shown along with each individual term in equation (1.5) for samples S70 and S1dc as functions of average capillary pressure calculated from the curvature of the interface. In Figure 10, only the increments in pressure above the entry pressure are used in the comparison. We use the average capillary pressure calculated from curvature because, as shown in Figure 3, it provides a reasonable match to the externally measured capillary pressure, while being a more faithful representation of the internal pressures in the micro-models. If only the first term (wn) of equation (1.5) were used, as suggested by Kalaydjian (1987), the calculated contribution to capillary pressure from interfacial area per volume (circles in Figure 10) would actually decrease with increasing pressure. Examining the other terms in equation (1.5), though the a ws is large in magnitude, a ws / s w (triangles) is small because the value of the interfacial tension between the decane and the solid is an order of magnitude smaller than that for the other interfaces (Table 3.2). The a ns / s w term (squares) increases with increasing pressure and dominates in magnitude. The total of all three terms (diamonds in the Figure 10) in equation (1.5) are also shown. The data arising from high wetting-phase saturations above 90% are shown separately (open symbols in Figure 10), because these data may not be applicable for the reasons described earlier. When only the s w < 0.9 data (solid symbols in Figure 10) are considered, the component of capillary pressure calculated from the last term of equation (1.4) is found to be constant even though the pressure calculated from curvature is increasing. Therefore, the component of capillary pressure based on changes in interfacial area per volume with saturation given by the last term in equation (1.4) does not match the pressure determined from the average curvature of the wetting-nonwetting interfaces. This suggests that contributions to capillary pressure from the free energy associated with the saturation gradient of each phase (first and second terms in equation (1.4)) are not negligible.
13
14 234 L. J. PYRAK-NOLTE, D. D. NOLTE, D CHEN, AND N. J. GIORDANO Fig. 10. The capillary pressure based on equation (1.5) as a function of capillary pressure determined from curvature for samples (a) S70 and (b) S1dc from drainage scans. Shown in the graphs are the contributions from each term in equation (1.5) indicated by the interface (WN: wetting -nonwetting interface, WS: wetting -solid interface, NS: nonwetting-solid interface). The total represents the sum of all of the terms divided by the porosity as given by equation (1.5). The open symbols present the value of the term for wetting-phase saturations greater than ninety percent Saturation Gradients. From the data showing the uniform curvature distributions and phase isotropy for each image, combined with the interface stability (they are not moving), we conclude that the micromodels at each pressure are in mechanical equilibrium, However, from Figures 5 (a) & (b), it is clear that the phase distribution is not homogenous either in terms of amount (s w ) or distribution (a wn ) at a given pressure. These saturation gradients likely cause the contributions from the first two terms of equation (1.4) to dominate the calculation of capillary pressure, thereby producing the difference between the curvature-based pressure of equation (1.1) and the terms associated with the interfaces in equation (1.5). From our data set, we cannot obtain all parameters used to determine contributions to capillary pressure from the change in Helmholtz free energy of a phase with saturation as given by equation (1.4). But we can plot the difference between equation (1.1) and equation (1.5) to obtain a residual contribution to the capillary pressure that is a consequence of the saturation gradient. This difference is shown in Fig. 11 as a function of the curvature-based capillary pressure. We identify this difference as the saturation gradient contribution, and tentatively assign it to the explicit free-energy terms in equation (1.4). The free energy contribution takes on negative values at low pressure, and decreases in magnitude toward zero under higher pressures. At pressures approaching breakthrough, the freeenergy contribution vanishes. It is interesting to note that the phase distribution across the sample is most nearly homogeneous just prior to breakthrough. This observation lends plausibility to the interpretation of the free-energy contribution arising from the saturation gradient. 5. Conclusions. We have performed an experimental study using transparent two-dimensional micromodels that enable the visualization of interfacial areas during imbibition and drainage. These data provide a direct means to compare experimentally-measured capillary pressure, determined either by local curvature or by external pressure measurements, to thermodynamic expressions involving the differential change of interfacial areas, also measured experimentally, relative to changing saturation. The mechanical equilibrium of the system is verified using several different measures, including the establishment of stationary phase fronts prior to data acquisition, the existence of near-zero pressure gradients across the sample for a given applied external pressure, the agreement between the pressure calculated from curvature and the pressure measured externally, and the van-

15
16 236 L. J. PYRAK-NOLTE, D. D. NOLTE, D CHEN, AND N. J. GIORDANO duction, water wells, the study of cores in the laboratory, and micromodel experiments. In all these examples, the invading phase enters the micro-model from an inlet port attached to a reservoir and drains into an outlet reservoir. The inlet reservoir is a part of the equilibrium system, and the porous medium cannot be isolated from it as a closed system. This situation is fundamentally different than equilibrium bulk phase distributions in closed systems, in which pores of appropriate apertures are occupied homogeneously. Therefore, imbibition and drainage represent a class of open physical processes which are inhomogeneous because of the communication of the porous medium with the reservoirs that impose inlet-outlet asymmetry on the system. In conclusion, two-dimensional micromodels provide valuable experimental insight into the relationships among capillary pressure and the phase interfaces within a porous medium. In these systems, mechanical equilibrium is established easily and verified experimentally. The presence of a saturation gradient at each applied pressure is likely a fundamental aspect of imbibition and drainage for systems in close communication with a reservoir. Future experimental studies need to move into three dimensions to establish whether these results are a consequence of the lowered dimensionality, or are fundamental to systems of any dimensionality. Acknowledgments. The authors wish to acknowledge Rossman Giese for the calculation of interfacial tension values used in this paper. This material is based upon work supported by the National Science Foundation under Grant No REFERENCES [1] Annable, M.D., Jawitz, J.W., Rao, P.S.C., Dai, D.P., Kim, H., Wood, A.L., Field evaluation of interfacial and partitioning tracers for characterization of effective NAPL-water contact areas. Ground Water, 36(3): p , [2] Anwar, A.H.M.F., Bettahar, M., Matsubayashi, U., A method for determining ar-water interfacial area in variably saturated porous media. Journal of Contaminant Hydrology, 43: , [3] Barnes, G. T. and I. R. Gentle, Interfacial Science, Oxford University Press, Oxford, [4] Bear, J., Dynamics of Fluids in Porous Media, Mineola, New York: Dover, [5] Bear, J., Hydraulics of Groundwater, New York, McGraw-Hill, [6] Bear, J. and A. Verruijt, Modeling Groundwater Flow and Pollution, Dordrecht, The Netherlands, D. Reidel Pub. Co., [7] Bradford, S.A., and F. J. Leij, Estimating interfacial areas for multi-fluid soil systems. Journal of Contaminant Hydrology, 27:83-105, [8] Chen, D., Experimental investigation of interfacial geometry associated with multiphase flow within a porous medium, Ph.D. Thesis, Department of Earth and Atmospheric Sciences, Purdue University, West Lafayette, Indiana, [9] Chen, D., Pyrak-Nolte, L. J., Griffin, J. and N. J. Giordano, Measurement of interfacial area per volume for drainage and imbibition, accepted for publication in Water Resources Research, [10] Chen, L. and T. C. G. Kibbey, Measurement of air-water interfacial area for multiple hysteretic drainage curves in an unsaturated fine sand, Langmuir, 22, , [11] Cheng, J., Fluid flow in ultra-small structures, Ph.D. Thesis, Department of Physics, Purdue University, West Lafayette, Indiana, [12] Cheng J.-T., Pyrak-Nolte, L. J., Nolte, D. D. and N. J. Giordano, Linking pressure and saturation through interfacial areas in porous media, Geophys. Res. Let., 31, L08502, doi: /2003gl019282, [13] Collins, R. E., Flow of Fluids through Porous Materials, New York, Reinhold Pub. Corp., [14] Colonna, J., Brissaud, F. and Millet, J.L., Evolution of capillary and relative permeability hysteresis. Soc. Pet. Eng. J., 12: 28-38, [15] Costanza-Robinson, M.S., and M. L. Brusseau, Air-water interfacial areas in unsaturated soils: Evaluation of interfacial domains. Water Resources Research, (10): p doi: /2001WR000738, [16] Culligan, K.A., D. Wildenschild, B.S.B. Christensen, W.G. Gray, and M.L. Rivers, Pore-scale characteristics of multiphase flow in porous media: A synchrotron-based CMT comparison of air-water and oil-water experiments, Advances in Water Resources. 29(2), , [17] Culligan, K.A., D. Wildenschild, B.S.B. Christensen, W.G. Gray, A.F.B. Tompson, Interfacial area measurements for unsaturated flow through a porous medium. Water Resources Research. 40(12), Art. No. W12413, Dec 22, [18] Dalla, E., Hilpert, M. and C. T. Miller, Computation of the interfacial area for two-fluid porous medium systems, Journal of Contaminant Hydrology 56, 25 48, 2002.
17 CAPILLARY PRESSURE AND INTERFACIAL AREAS 237 [19] Deinert, M.R., Parlange, J.-Y. and K. B. Cady, Simplified thermodynamic model for equilibrium capillary pressure in a fractal porous medium, Physical Review E, , [20] Dullien, F. A. L., Porous Media: Fluid Transport and Pore Structure, 2 nd Edition, Academic Press, [21] Giordano, N. and J.T. Cheng, Microfluid mechanics: progress and opportunities. Journal of Physics- Condensed Matter, 13(15): p. R271-R295, [22] Gray, W.G. and S.M. Hassanizadeh, Averaging theorems and averaged equations for transport of interface properties in multiphase systems. International Journal of Multiphase Flow, 15(1): p , [23] Gray, W.G. and S.M. Hassanizadeh, Unsaturated flow theory including interfacial phenomena. Water Resources Research, 27(8): p , [24] Gray, W.G. and S.M. Hassanizadeh, Macroscale continuum mechanics for multiphase porous-media flow including phases, interfaces, common lines and common points. Advances in Water Resources, 21(4): p , [25] Gray, W. G, Tompson, A. F.B. and W. E. Soll, Closure conditions for two-fluid flow in porous media, Transport in Porous Media, 47:29-65, [26] Gray, W. G. and C. T. Miller, Thermodynamically constrained averaging theory approach for moeling flow and transport phenomena in porous media systems: 3. Single-fluid-phase flow, Advances in Water Resources, 29: , [27] Gvirtzman, H. and Roberts, P.V., Pore-scale spatial analysis of two immiscible fluids in porous media. Water Resources Research, 27: , [28] Hassanizadeh, S.M. and W.G. Gray, Mechanics and thermodynamics of multiphase flow in porous-media including interphase boundaries, Advances in Water Resources, 13(4): , [29] Hassanizadeh, S.M. and W.G. Gray, Thermodynamic basis of capillary pressure in porous media, Water Resources Research, 29(10), , [30] Hassanizadeh, S.M., Celia, M. A. and H. K. Dahle, Dynamic effect in the capillary pressure saturation relationship and its impacts on unsaturated flow, Vadose Zone Journal 1:38 57, [31] Held, R. J. and M. A. Celia, Modeling support of functional relationships between capillary pressure, saturation, interfacial area and common lines, Advances in Water Resources, 24, p , [32] Ioannidis, M. A., Chatzis, I. and A. C. Payatakes, A mercury porosimeter for investigating capillary phenomena and microdisplacement mechanisms in capillary networks, Journal of Colloid and Interface Science, vol. 143(1):22-36, [33] Kalaydjian, F. A., A macroscopic description of multiphase flow involving space-time evolution of fluid/fluid interfaces, Transport in Porous Media, , [34] Kim, H., Rao, P.S.C., Annable, M.D., Consistency of the interfacial tracer technique: experimental evaluation. Journal of Contaminant Hydrology, 40:79-94, 1999a. [35] Kim, H., Rao, P.S.C., Annable, M.D., 1999b, Gaseous tracer technique for estimating air-water interfacial areas and interface mobility, Soil Sci. Soc. Am. J. 63: , 199b. [36] Lenhard, R. J., Measurement and modeling of three-phase saturation-pressure hysteresis, Journal of Contaminant Hydrology, 9, , [37] McClure J.E., Adalsteinsson, D., Pan C, Gray, W.G. and C.T. Miller, Approximation of interfacial properties in multiphase porous medium systems, Advances in Water Resources 30, , [38] Montemagno, C.D. and W.G. Gray, Photoluminescent volumetric imaging - a technique for the exploration of multiphase flow and transport in porous-media. Geophysical Research Letters, 22(4): , [39] Morrow, N. R., Physics and thermodynamics of capillary action in porous media, in Flow through Porous Media, American Chemical Society, Washington, D. C., , [40] Muccino, J.C., W.G. Gray, and L.A. Ferrand, Toward an improved understanding of multiphase flow in porous media. Reviews of Geophysics, 36(3): , [41] Nolte, D.D. and L.J. Pyrak-Nolte, Stratified Continuum Percolation - Scaling Geometry of Hierarchical Cascades. Physical Review A, 44(10): , [42] Philip, J. R., Unitary approach to capillary condensation and adsorption, J. Chem. Phys., 66(11), , 1977 [43] Powers, S.E., Loureiro, C. O., Abriola, L. M. and W.. J. Weber, Jr., Theoretical study of the significance of nonequilibrium dissolution of nonaqueous phase liquids in subsurface systems. Water Resources Research, 27(4): p , [44] Prodanovic, M., W.B. Lindquist, and R.S. Seright, Porous structure and fluid partitioning in polyethylene cores from 3D X-ray microtomographic imaging, Journal of Colloid and Interface Science 298, , [45] Pyrak-Nolte, L. J., Giordano, N. J. and D. D. Nolte, Experimental investigation of relative permeabiliy upscaling from the Micro-scale to the macro-scale, Final Report, DOE Award: DE-AC26-99BC15207, OSTI ID: , DOI /833410, [46] Pyrak-Nolte, L. J., 2007, URL of website with original data: DataImages/ [47] Rao, P.S.C., Annable, M.D., Kim, H., NAPL source zone characterization and remediation technology performance assessment: recent developments and applications of tracer techniques. Journal of Contaminant Hydrology, 45: p , [48] Rapoport, L.A., and W. J. Leas, Relative permeability to liquid in liquid-gas systems. Petroleum Transaction.
18 238 L. J. PYRAK-NOLTE, D. D. NOLTE, D CHEN, AND N. J. GIORDANO 192: p , [49] Reeves, P. C. and M. A. Celia, A functional relationship between capillary pressure, saturation, and interfacial area as revealed by a pore-scale network model, Water Resources Research, vol. 32, no. 8, pages , [50] Saripalli, K.P., Kim, H., Rao, P.S.C., Annable, M.D., Measurement of specific fluid-fluid interfacial areas of immiscible fluids in porous media. Environmental Science and Technology, 31(3): p , [51] Schaefer, C.E., DiCarolo, D.A., Blunt, M.J., Determination of water-oil interfacial area during 3-phase gravity drainage in porous media. Journal of Colloid and Interface Science, 221: p , [52] Shipley Microelectronic Product Guide, Shipley Co., Newton, MA, [53] Sethian, J. A., Curvature and the evolution of fronts, Communications of Mathematical Physics, 101, 4, , [54] Thompson, L.F., C.G. Willson, and M.J. Bowden, Introduction to Microlithography, 2nd edition, American Chemical Society, Washington, DC, [55] Topp, G.C., Soil-water hysteresis measured in a sandy loam and compared with the hysteretic domain model. Soil Sci. Soc. Am. Proc., 33: , [56] Tuller, M., Or, D. and L. M. Dudley, Adsorption and capillary condensation in porous media: Liquid retention and interfacial configurations in angular porous media, Water Resources Research, vol 35, no. 7, pages , July [57] van Genabeek, O., and D. H. Rothman, Macroscopic manifestations of microscopic flows through porous media: Phenomenology from simulation. Annual Review of Earth and Planetary Sciences, 24: p , [58] Wilkinson, D., Percolation effects in immiscible displacement, Physical Review A., vol. 34, no. 2, p , 1986.
Pore-scale modeling extension of constitutive relationships in the range of residual saturations
 WATER RESOURCES RESEARCH, VOL. 37, NO. 1, PAGES 165 170, JANUARY 2001 Pore-scale modeling extension of constitutive relationships in the range of residual saturations Rudolf J. Held and Michael A. Celia
Measurement and prediction of the relationship between capillary pressure, saturation, and interfacial area in a NAPL water glass bead system
 WATER RESOURCES RESEARCH, VOL. 46,, doi:10.1029/2009wr007786, 2010 Measurement and prediction of the relationship between capillary pressure, saturation, and interfacial area in a NAPL water glass bead
Simulating Fluid-Fluid Interfacial Area
 Simulating Fluid-Fluid Interfacial Area revealed by a pore-network model V. Joekar-Niasar S. M. Hassanizadeh Utrecht University, The Netherlands July 22, 2009 Outline 1 What s a Porous medium 2 Intro to
Capillary pressure as a unique function of electric permittivity and water saturation
 Click Here for Full Article GEOPHYSICAL RESEARCH LETTERS, VOL. 34, L13306, doi:10.1029/2007gl029674, 2007 Capillary pressure as a unique function of electric permittivity and water saturation Willem-Jan
Paper E A pore network model for calculation of interfacial velocities
 Paper E A pore network model for calculation of interfacial velocities Submitted to Advances in Water Resources, fall 21. A PORE NETWORK MODEL FOR CALCULATION OF INTERFACIAL VELOCITIES H.F. Nordhaug a,
Ability of Darcy s Law for Extension in Two- Phase Flow for Sedimentary Medium in Capillary Non-equilibrium Situations
 Research Article imedpub Journals http://www.imedpub.com Resources, Recycling and Waste Management Ability of Darcy s Law for Extension in Two- Phase Flow for Sedimentary Medium in Capillary Non-equilibrium
PUBLICATIONS. Water Resources Research
 PUBLICATIONS Water Resources Research RESEARCH ARTICLE Key Points: NW-W interfacial area at aboveresidual S n is successfully measured using a two-phase-flow IPTT method NW-W interfacial area increases
Hysteresis and Interfacial Energies in Smooth-walled. Microfluidic Channels
 WWR orig. June 12, 2009 Hysteresis and Interfacial Energies in Smooth-walled Microfluidic Channels Yihong Liu 1, D. D. Nolte 1 and L. J. Pyrak-Nolte 1,2 1. Dept. of Physics, Purdue University 2. Dept.
CORRELATION OF THE MULTIPHASE FLOW COEFFICIENTS OF POROUS MEDIA WITH WETTABILITY: A PORE NETWORK APPROACH
 CMWRXVI CORRELATION OF THE MULTIPHASE FLOW COEFFICIENTS OF POROUS MEDIA WITH WETTABILITY: A PORE NETWORK APPROACH CHRISTOS D. TSAKIROGLOU Institute of Chemical Engineering and High Temperature Chemical
MEASUREMENT OF CAPILLARY PRESSURE BY DIRECT VISUALIZATION OF A CENTRIFUGE EXPERIMENT
 MEASUREMENT OF CAPILLARY PRESSURE BY DIRECT VISUALIZATION OF A CENTRIFUGE EXPERIMENT Osamah A. Al-Omair and Richard L. Christiansen Petroleum Engineering Department, Colorado School of Mines ABSTRACT A
Simplified thermodynamic model for equilibrium capillary pressure in a fractal porous medium
 Simplified thermodynamic model for equilibrium capillary pressure in a fractal porous medium M. R. Deinert Theoretical and Applied Mechanics, Cornell University, Ithaca, New York 14850, USA J.-Y. Parlange
Network Model Investigation of Interfacial Area, Capillary Pressure and Saturation Relationships in Granular Porous Media
 WATER RESOURCES RESEARCH, VOL.???, XXXX, DOI:10.1029/, Network Model Investigation of Interfacial Area, Capillary Pressure and Saturation Relationships in Granular Porous Media V. Joekar-Niasar, 1 M. Prodanović
Numerical Treatment of Two-Phase Flow in Porous Media Including Specific Interfacial Area
 Procedia Computer cience Volume 51, 2015, Pages 1249 1258 ICC 2015 International Conference On Computational cience Numerical Treatment of To-Phase Flo in Porous Media Including pecific Interfacial Area
Scaling of fluid flow versus fracture stiffness
 GEOPHYSICAL RESEARCH LETTERS, VOL. 40, 2076 2080, doi:10.1002/grl.50479, 2013 Scaling of fluid flow versus fracture stiffness Christopher L. Petrovitch, 1 David D. Nolte, 1 and Laura J. Pyrak-Nolte 1,2,3
Relative Permeability Measurement and Numerical Modeling of Two-Phase Flow Through Variable Aperture Fracture in Granite Under Confining Pressure
 GRC Transactions, Vol. 36, 2012 Relative Permeability Measurement and Numerical Modeling of Two-Phase Flow Through Variable Aperture Fracture in Granite Under Confining Pressure Noriaki Watanabe, Keisuke
WATER RESOURCES RESEARCH, VOL. 48, W10519, doi: /2012wr011862, 2012
 WATER RESOURCES RESEARCH, VOL. 48, W10519, doi:10.1029/2012wr011862, 2012 A pore network model study of the fluid-fluid interfacial areas measured by dynamic-interface tracer depletion and miscible displacement
Pore-Scale Analysis of Dynamics of Two-Phase Flow. in Porous Media
 Pore-Scale Analysis of Dynamics of Two-Phase Flow Multi-Process Pore-scale Modelling in Porous Media Vahid J. Niasar Collaborators: S. Majid Hassanizadeh (Utrecht University) Nikos Karadimitriou (University
Hysteresis and interfacial energies in smooth walled microfluidic channels
 WATER RESOURCES RESEARCH, VOL. 47,, doi:10.1029/2010wr009541, 2011 Hysteresis and interfacial energies in smooth walled microfluidic channels Yihong Liu, 1 D. D. Nolte, 1 and L. J. Pyrak Nolte 1,2 Received
PHYSICS OF FLUID SPREADING ON ROUGH SURFACES
 INTERNATIONAL JOURNAL OF NUMERICAL ANALYSIS AND MODELING Volume 5, Supp, Pages 85 92 c 2008 Institute for Scientific Computing and Information PHYSICS OF FLUID SPREADING ON ROUGH SURFACES K. M. HAY AND
Proposed approximation for contact angles in Shan-and-Chen-type multicomponent multiphase lattice Boltzmann models
 PHYSICAL REVIEW E 7, 0701 007 Proposed approximation for contact angles in Shan-and-Chen-type multicomponent multiphase lattice Boltzmann models Haibo Huang, 1 Daniel T. Thorne, Jr., Marcel G. Schaap,
PORE-SCALE PHASE FIELD MODEL OF TWO-PHASE FLOW IN POROUS MEDIUM
 Excerpt from the Proceedings of the COMSOL Conference 2010 Paris PORE-SCALE PHASE FIELD MODEL OF TWO-PHASE FLOW IN POROUS MEDIUM Igor Bogdanov 1*, Sylvain Jardel 1, Anis Turki 1, Arjan Kamp 1 1 Open &
PUBLICATIONS. Water Resources Research. An adaptive lattice Boltzmann scheme for modeling two-fluid-phase flow in porous medium systems
 PUBLICATIONS Water Resources Research RESEARCH ARTICLE Key Points: The lattice Boltzmann method (LBM) is a useful tool in the study of multiphase flow The approach of two-phase flow to equilibrium is a
X-RAY MICRO-TOMOGRAPHY OF PORE-SCALE FLOW AND TRANSPORT. University of California Davis. Dorthe Wildenschild & Annette Mortensen
 X-RAY MICRO-TOMOGRAPHY OF PORE-SCALE FLOW AND TRANSPORT Jan W. Hopmans University of California Davis Volker Clausnitzer Dorthe Wildenschild & Annette Mortensen ISSUES: Measurements and modeling of water
dynamics of f luids in porous media
 dynamics of f luids in porous media Jacob Bear Department of Civil Engineering Technion Israel Institute of Technology, Haifa DOVER PUBLICATIONS, INC. New York Contents Preface xvii CHAPTER 1 Introduction
Complexity of Two-Phase Flow in Porous Media
 1 Complexity of Two-Phase Flow in Porous Media Rennes September 16, 2009 Eyvind Aker Morten Grøva Henning Arendt Knudsen Thomas Ramstad Bo-Sture Skagerstam Glenn Tørå Alex Hansen 2 Declining oil production,
Unsaturated Flow (brief lecture)
") Physical Hydrogeology Unsaturated Flow (brief lecture) Why study the unsaturated zone? Evapotranspiration Infiltration Toxic Waste Leak Irrigation UNSATURATAED ZONE Aquifer Important to: Agriculture (most
Physical Hydrogeology Unsaturated Flow (brief lecture) Why study the unsaturated zone? Evapotranspiration Infiltration Toxic Waste Leak Irrigation UNSATURATAED ZONE Aquifer Important to: Agriculture (most
The Physical Origin of Interfacial Coupling in Two-Phase Flow through Porous Media
 Transport in Porous Media 44: 109 122, 2001. c 2001 Kluwer Academic Publishers. Printed in the Netherls. 109 The Physical Origin of Interfacial Coupling in Two-Phase Flow through Porous Media RAMON G.
AN EXPERIMENTAL INVESTIGATION OF BOILING HEAT CONVECTION WITH RADIAL FLOW IN A FRACTURE
 PROCEEDINGS, Twenty-Fourth Workshop on Geothermal Reservoir Engineering Stanford University, Stanford, California, January 25-27, 1999 SGP-TR-162 AN EXPERIMENTAL INVESTIGATION OF BOILING HEAT CONVECTION
Fluid flow through nanometer-scale channels
 PHYSICAL REVIEW E, VOLUME 65, 031206 Fluid flow through nanometer-scale channels J.-T. Cheng and N. Giordano Department of Physics, Purdue University, West Lafayette, Indiana 47907-1396 Received 20 July
DNAPL migration through interbedded clay-sand sequences
 Groundwater Quality: Natural and Enhanced Restoration of Groundwater Pollution (Proceedings ofthe Groundwater Quality 2001 Conference held al Sheffield. UK. June 2001). IAHS Publ. no. 275. 2002. 455 DNAPL
1 Modeling Immiscible Fluid Flow in Porous Media
 Excerpts from the Habilitation Thesis of Peter Bastian. For references as well as the full text, see http://cox.iwr.uni-heidelberg.de/people/peter/pdf/bastian_habilitationthesis.pdf. Used with permission.
COMPARING DIFFERENT METHODS FOR CAPILLARY PRESSURE MEASUREMENTS
 COMPARING DIFFERENT METHODS FOR CAPILLARY PRESSURE MEASUREMENTS M. Sarwaruddin ), OleTorsæter ), and Arne Skauge 2) ) Norwegian University of Science &Technology 2) Norsk Hydro Abstract Capillary pressure
Analysis of Multiphase Flow under the Ground Water
 Analysis of Multiphase Flow under the Ground Water Pramod Kumar Pant Department of Mathematics, Bhagwant University, Ajmer, Rajasthan, India Abstract The single-phase fluid flow through a porous medium
I. Borsi. EMS SCHOOL ON INDUSTRIAL MATHEMATICS Bedlewo, October 11 18, 2010
 : an : an (Joint work with A. Fasano) Dipartimento di Matematica U. Dini, Università di Firenze (Italy) borsi@math.unifi.it http://web.math.unifi.it/users/borsi porous EMS SCHOOL ON INDUSTRIAL MATHEMATICS
Unsteady State Relative Permeability and Capillary Pressure Estimation of Porous Media
 CMWRXVI Unsteady tate Relative Permeability and Capillary Pressure Estimation of Porous Media M. H. Ghazanfari 1,2, M. Khodabakhsh 1,2, R. Kharrat 2, D. Rashtchian 1,. Vossoughi 3 1 Chemical and Petroleum
UNDERSTANDING IMBIBITION DATA IN COMPLEX CARBONATE ROCK TYPES
 SCA2014-059 1/6 UNDERSTANDING IMBIBITION DATA IN COMPLEX CARBONATE ROCK TYPES Moustafa Dernaika 1, Zubair Kalam 2, Svein Skjaeveland 3 1 Ingrain Inc.-Abu Dhabi, 2 ADCO, 3 University of Stavanger This paper
Correlation Between Resistivity Index, Capillary Pressure and Relative Permeability
 Proceedings World Geothermal Congress 2010 Bali, Indonesia, 25-29 April 2010 Correlation Between Resistivity Index, Capillary Pressure and Kewen Li Stanford Geothermal Program, Stanford University, Stanford,
Microfluidics 2 Surface tension, contact angle, capillary flow
 MT-0.6081 Microfluidics and BioMEMS Microfluidics 2 Surface tension, contact angle, capillary flow 28.1.2017 Ville Jokinen Surface tension & Surface energy Work required to create new surface = surface
WETTABILITY CHANGE TO GAS-WETNESS IN POROUS MEDIA
 WETTABILITY CHANGE TO GAS-WETNESS IN POROUS MEDIA Kewen Li and Abbas Firoozabadi Reservoir Engineering Research Institute (RERI) Abstract In the petroleum literature, gas is assumed to be the non-wetting
Toward Improved Prediction of Reservoir Flow Performance
 Toward Improved Prediction of Reservoir Flow Performance simulating oil and water flows at the pore scale John J. Buckles, Randy D. Hazlett, Shiyi Chen, Kenneth G. Eggert, Daryl W. Grunau, and Wendy E.
The Impact of Pore-Scale Flow Regimes on Upscaling of Immiscible Two-Phase Flow in Geothermal Reservoirs
 PROCEEDINGS 43rd Workshop on Geothermal Reservoir Engineering Stanford University Stanford California February 12-14 2018 SGP-TR-213 The Impact of Pore-Scale Flow Regimes on Upscaling of Immiscible Two-Phase
Pore-scale modeling of multiphase flow and transport in water-wet porous media
 Pore-scale modeling of multiphase flow and transport in water-wet porous media E. ~alla', M. ~ il~ert~, C. ill er^ & D. pitea' I Dept. Environmental Sciences, University of Milan-Bicocca, ltaly 2 Dept.
MOVEMENT OF CONNATE WATER DURING WATER INJECTION IN FRACTURED CHALK
 MOVEMENT OF CONNATE WATER DURING WATER INJECTION IN FRACTURED CHALK By E. A. Spinler and D. R. Maloney Phillips Petroleum Co. Abstract The movement of connate water can be important in enabling or blocking
Experimental investigation of dynamic effects in capillary pressure: Grain size dependency and upscaling
 WATER RESOURCES RESEARCH, VOL. 46,, doi:10.1029/2009wr008881, 2010 Experimental investigation of dynamic effects in capillary pressure: Grain size dependency and upscaling Geremy Camps Roach, 1 Denis M.
An Experimental Investigation of EOR Mechanisms for Nanoparticles Fluid in Glass Micromodel
 1 / 12 An Experimental Investigation of EOR Mechanisms for Nanoparticles Fluid in Glass Micromodel Shidong Li and Ole Torsæter, Norwegian University of Science and Technology (NTNU) This paper was prepared
Modeling of 1D Anomalous Diffusion In Fractured Nanoporous Media
 LowPerm2015 Colorado School of Mines Low Permeability Media and Nanoporous Materials from Characterisation to Modelling: Can We Do It Better? IFPEN / Rueil-Malmaison - 9-11 June 2015 CSM Modeling of 1D
Simultaneous measurement of hysteresis in capillary pressure and electric permittivity for multiphase flow through porous media
 GEOPHYSICS, VOL. 72, NO. 3 MAY-JUNE 07 ; P. A41 A4, 4 FIGS., 1 TABLE..1190/1.2714684 Simultaneous measurement of hysteresis in capillary pressure and electric permittivity for multiphase flow through porous
16 Rainfall on a Slope
 Rainfall on a Slope 16-1 16 Rainfall on a Slope 16.1 Problem Statement In this example, the stability of a generic slope is analyzed for two successive rainfall events of increasing intensity and decreasing
Chapter Seven. For ideal gases, the ideal gas law provides a precise relationship between density and pressure:
 Chapter Seven Horizontal, steady-state flow of an ideal gas This case is presented for compressible gases, and their properties, especially density, vary appreciably with pressure. The conditions of the
Estimating Permeability from Acoustic Velocity and Formation Resistivity Factor
 5th Conference & Exposition on Petroleum Geophysics, Hyderabad-2004, India PP 582-587 and Formation Resistivity Factor Majid Nabi-Bidhendi Institute of Geophysics, University of Tehran, P.O. Box 14155-6466,
CYDAR User Manual Two-phase flow module with chemical EOR
 CYDAR User Manual Two-phase flow module with chemical EOR 1 CYDAR - Two-phase flow module with chemical EOR CYDAR USER MANUAL TWO-PHASE FLOW MODULE WITH CHEMICAL EOR... 1 CYDAR - TWO-PHASE FLOW MODULE
Fracture relative permeability revisited
 Fracture relative permeability revisited NOROLLAH KASIRI and GHASEM BASHIRI, Iran University of Science and Technology Relative permeability is one of the most uncertain terms in multiphase flow through
Evaporation rates from square capillaries limited by corner flow
 1 2 3 Evaporation rates from square capillaries limited by corner flow viscous losses Frouke Hoogland, May 2012 4 5 A master thesis for the master program Environmental Hydrogeology at the Department of
A PSEUDO FUNCTION APPROACH IN RESERVOIR SIMULATION
 INTERNATIONAL JOURNAL OF NUMERICAL ANALYSIS AND MODELING Volume 2, Supp, Pages 58 67 c 2005 Institute for Scientific Computing and Information A PSEUDO FUNCTION APPROACH IN RESERVOIR SIMULATION ZHANGXIN
Homogenization and numerical Upscaling. Unsaturated flow and two-phase flow
 Homogenization and numerical Upscaling Unsaturated flow and two-phase flow Insa Neuweiler Institute of Hydromechanics, University of Stuttgart Outline Block 1: Introduction and Repetition Homogenization
Effects of capillarity and heterogeneity on flow of organic liquid in soil
 Effects of capillarity and heterogeneity on flow of organic liquid in soil Promotor: prof. dr. ir. S.E.A.T.M. van der Zee persoonlijk hoogleraar bij de leerstoelgroep Bodemscheikunde en Chemische Bodemkwaliteit
Pore-Level Bénard Marangoni Convection in Microgravity
 Pore-Level Bénard Marangoni Convection in Microgravity Peyman Mohammadmoradi, and Apostolos Kantzas * Chemical and Petroleum Engineering Department, University of Calgary *Corresponding author: 2500 University
Pore scale consideration in unstable gravity driven finger flow
 Pore scale consideration in unstable gravity driven finger flow Steenhuis, T. S., C. E. Baver, B. Hasanpour, C. R. Stoof, D. A. DiCarlo, and J. S. Selker (2013), Pore scale consideration in unstable gravity
MASS TRANSPORT Macroscopic Balances for Multicomponent Systems
 TRANSPORT PHENOMENA MASS TRANSPORT Macroscopic Balances for Multicomponent Systems Macroscopic Balances for Multicomponent Systems 1. The Macroscopic Mass Balance 2. The Macroscopic Momentum and Angular
INFERRING RELATIVE PERMEABILITY FROM RESISTIVITY WELL LOGGING
 PROCEEDINGS, Thirtieth Workshop on Geothermal Reservoir Engineering Stanford University, Stanford, California, January 3-February 2, 25 SGP-TR-76 INFERRING RELATIVE PERMEABILITY FROM RESISTIVITY WELL LOGGING
Experimental measurement of parameters governing flow rates and partial saturation in paper-based microfluidic devices
 Experimental measurement of parameters governing flow rates and partial saturation in paper-based microfluidic devices Dharitri Rath 1, Sathishkumar N 1, Bhushan J. Toley 1* 1 Department of Chemical Engineering
Critical capillary number: Desaturation studied with fast X-ray computed microtomography
 GEOPHYSICAL RESEARCH LETTERS, VOL. 41, 55 60, doi:10.1002/2013gl058075, 2014 Critical capillary number: Desaturation studied with fast X-ray computed microtomography Ryan T. Armstrong, 1 Apostolos Georgiadis,
Table of Contents Chapter 1 Introduction to Geotechnical Engineering 1.1 Geotechnical Engineering 1.2 The Unique Nature of Soil and Rock Materials
 Table of Contents Chapter 1 Introduction to Geotechnical Engineering 1.1 Geotechnical Engineering 1.2 The Unique Nature of Soil and Rock Materials 1.3 Scope of This Book 1.4 Historical Development of Geotechnical
ABSTRACT INTRODUCTION
 Transport of contaminants from non-aqueous phase liquid pool dissolution in subsurface formations C.V. Chrysikopoulos Department of Civil Engineering, University of California, ABSTRACT The transient contaminant
Understanding Fractures and Pore Compressibility of Shales using NMR Abstract Introduction Bulk
 SCA6-7 /6 Understanding Fractures and Pore Compressibility of Shales using NMR M. Dick, D. Green, E.M. Braun, and D. Veselinovic Green Imaging Technologies, Fredericton, NB, Canada Consultant, Houston,
B024 RESERVOIR STREAMLINE SIMULATION ACCOUNTING
 1 B024 RESERVOIR STREAMLINE SIMULATION ACCOUNTING FOR EFFECTS OF CAPILLARITY AND WETTABILITY R.A. BERENBLYUM, A.A. SHAPIRO, E.H. STENBY IVC-SEP, Department of Chemical Engineering, Technical University
SEISMIC WAVE PROPAGATION IN FRACTURED CARBONATE ROCK
 Proceedings of the Project Review, Geo-Mathematical Imaging Group (Purdue University, West Lafayette IN), Vol. 1 (2010) pp. 211-220. SEISMIC WAVE PROPAGATION IN FRACTURED CARBONATE ROCK WEIWEI LI AND LAURA
SIMULATING IN-SITU CONDITIONS FOR DIGITAL CORE ANALYSIS
 SCA2015-032 1/11 SIMULATING IN-SITU CONDITIONS FOR DIGITAL CORE ANALYSIS S. Linden 1,2, T. Cvjetkovic 2, E. Glatt 2, J.-O. Schwarz 2 and A. Wiegmann 2 1 Fraunhofer ITWM, Fraunhofer-Platz 1, 67665 Kaiserslautern,
CENG 501 Examination Problem: Estimation of Viscosity with a Falling - Cylinder Viscometer
 CENG 501 Examination Problem: Estimation of Viscosity with a Falling - Cylinder Viscometer You are assigned to design a fallingcylinder viscometer to measure the viscosity of Newtonian liquids. A schematic
Supporting Information
 Supporting Information Retention and Release of Graphene Oxide in Structured Heterogeneous Porous Media under Saturated and Unsaturated Conditions Shunan Dong 1, Xiaoqing Shi 1, Bin Gao 3, Jianfeng Wu
Preferential Flow and Extensions to Richards Equation
 Preferential Flow and Extensions to Richards Equation David A. DiCarlo Dept. of Petroleum and Geosystems Engineering University of Texas at Austin Preferential flow Uniform infiltration Preferential flow
DRAINAGE AND IMBIBITION CAPILLARY PRESSURE CURVES OF CARBONATE RESERVOIR ROCKS BY DIGITAL ROCK PHYSICS
 SCA2012-56 1/6 DRAINAGE AND IMBIBITION CAPILLARY PRESSURE CURVES OF CARBONATE RESERVOIR ROCKS BY DIGITAL ROCK PHYSICS Y. Mu 1, Q. Fang 1, C. Baldwin 1, J. Töelke 1, A. Grader 1, M. Dernaika 2, and Z. Kalam
THEORETICAL AND EXPERIMENTAL STUDY OF THE POSITIVE IMBIBITION CAPILLARY PRESSURE CURVES OBTAINED FROM CENTRIFUGE DATA.
 THEORETICAL AND EXPERIMENTAL STUDY OF THE POSITIVE IMBIBITION CAPILLARY PRESSURE CURVES OBTAINED FROM CENTRIFUGE DATA. Abstract Trond BolHs and Ole Torsaeter, The Norwegian Institute of Technology This
Simultaneous Measurement of Capillary Pressure and Dielectric Constant in Porous Media
 PIERS ONLINE, VOL. 3, NO. 4, 2007 549 Simultaneous Measurement of Capillary Pressure and Dielectric Constant in Porous Media W. J. Plug, L. M. Moreno, J. Bruining, and E. C. Slob Delft University of Technology,
NEW SATURATION FUNCTION FOR TIGHT CARBONATES USING ROCK ELECTRICAL PROPERTIES AT RESERVOIR CONDITIONS
 SCA2016-055 1/6 NEW SATURATION FUNCTION FOR TIGHT CARBONATES USING ROCK ELECTRICAL PROPERTIES AT RESERVOIR CONDITIONS Oriyomi Raheem and Hadi Belhaj The Petroleum Institute, Abu Dhabi, UAE This paper was
Multi-rate mass transfer modeling of two-phase flow in highly heterogeneous fractured and porous media
 Multi-rate mass transfer modeling of two-phase flow in highly heterogeneous fractured and porous media Jan Tecklenburg a,, Insa Neuweiler a, Jesus Carrera b, Marco Dentz b a Institute of Fluid Mechanics
Interfacial Properties at Elevated Pressures in Processes of Enhanced Oil and Gas Recovery
 Interfacial Properties at Elevated Pressures in Processes of Enhanced Oil and Gas Recovery P. T. Jaeger* 1, O. G. Niño Amézquita 2, S. Enders 2, R. Eggers 1 * 1 TU Hamburg - Harburg, Department of Thermal
MODELING GEOMATERIALS ACROSS SCALES JOSÉ E. ANDRADE DEPARTMENT OF CIVIL AND ENVIRONMENTAL ENGINEERING EPS SEMINAR SERIES MARCH 2008
 MODELING GEOMATERIALS ACROSS SCALES JOSÉ E. ANDRADE DEPARTMENT OF CIVIL AND ENVIRONMENTAL ENGINEERING EPS SEMINAR SERIES MARCH 2008 COLLABORATORS: DR XUXIN TU AND MR KIRK ELLISON THE ROADMAP MOTIVATION
VISUALIZING FLUID FLOW WITH MRI IN OIL-WET FRACTURED CARBONATE ROCK
 SCA2007-12 1/12 VISUALIZING FLUID FLOW WITH MRI IN OIL-WET FRACTURED CARBONATE ROCK Fernø, M.A. 1, Ersland, G. 1, Haugen, Å. 1, Graue, A. 1, Stevens, J. 2 and Howard, J.J. 2 1) University of Bergen, Norway,
Capillarity. ESS5855 Lecture Fall 2010
 Capillarity ESS5855 Lecture Fall 2010 Capillarity: the tendency of a liquid in a narrow tube or pore to rise or fall as a result of surface tension (The concise Oxford Dictionary) Surface tension: the
Interfacial Flows of Contact Line Dynamics and Liquid Displacement in a Circular Microchannel
 Proceedings of the 3 rd World Congress on Mechanical, Chemical, and Material Engineering (MCM'17) Rome, Italy June 8 10, 2017 Paper No. HTFF 159 ISSN: 2369-8136 DOI: 10.11159/htff17.159 Interfacial Flows
1. Water in Soils: Infiltration and Redistribution
 Contents 1 Water in Soils: Infiltration and Redistribution 1 1a Material Properties of Soil..................... 2 1b Soil Water Flow........................... 4 i Incorporating K - θ and ψ - θ Relations
TANG Xiaoyan [a],* INTRODUCTION
![TANG Xiaoyan [a],* INTRODUCTION](/thumbs/91/107546857.jpg "TANG Xiaoyan [a],* INTRODUCTION") Advances in Petroleum Exploration and Development Vol. 8, No. 2, 2014, pp. 6-12 DOI:10.3968/5958 ISSN 1925-542X [Print] ISSN 1925-5438 [Online] www.cscanada.net www.cscanada.org A Simulation Experimental
Advances in Petroleum Exploration and Development Vol. 8, No. 2, 2014, pp. 6-12 DOI:10.3968/5958 ISSN 1925-542X [Print] ISSN 1925-5438 [Online] www.cscanada.net www.cscanada.org A Simulation Experimental
Integration of seismic and fluid-flow data: a two-way road linked by rock physics
 Integration of seismic and fluid-flow data: a two-way road linked by rock physics Abstract Yunyue (Elita) Li, Yi Shen, and Peter K. Kang Geologic model building of the subsurface is a complicated and lengthy
Pore Scale Analysis of Oil Shale/Sands Pyrolysis
 Pore Scale Analysis of Oil Shale/Sands Pyrolysis C.L. Lin, J.D. Miller, and C.H. Hsieh Department of Metallurgical Engineering College of Mines and Earth Sciences University of Utah Outlines Introduction
The role of capillary pressure curves in reservoir simulation studies.
 The role of capillary pressure curves in reservoir simulation studies. M. salarieh, A. Doroudi, G.A. Sobhi and G.R. Bashiri Research Inistitute of petroleum Industry. Key words: Capillary pressure curve,
Hydrocarbon Fluid Wave and it's resonance G.K. Batta*, D.S. Manral, G.V.J. Rao, and S.K. Basha, Oil India limited, India
 Hydrocarbon Fluid Wave and it's resonance G.K. Batta*, D.S. Manral, G.V.J. Rao, and S.K. Basha, Oil India limited, India gnangp@gmail.com Keywords Hydrocarbon fluid wave, seismic acoustic impedance, law
Site Characterization & Hydrogeophysics
 Site Characterization & Hydrogeophysics (Source: Matthew Becker, California State University) Site Characterization Definition: quantitative description of the hydraulic, geologic, and chemical properties
KOZENY-CARMAN EQUATION REVISITED. Jack Dvorkin Abstract
 KOZENY-CARMAN EQUATION REVISITED Jack Dvorkin -- 009 Abstract The Kozeny-Carman equation is often presented as permeability versus porosity, grain size, and tortuosity. When it is used to estimate permeability
2D Electrical Resistivity Tomography survey optimisation of solute transport in porous media
 ArcheoSciences Revue d'archéométrie 33 (suppl.) 2009 Mémoire du sol, espace des hommes 2D Electrical Resistivity Tomography survey optimisation of solute transport in porous media Gregory Lekmine, Marc
Relative permeability characteristics necessary for simulating DNAPL infiltration, redistribution, and immobilization in saturated porous media
 WATER RESOURCES RESEARCH, VOL. 39, NO. 8, 1213, doi:10.1029/2002wr001490, 2003 Relative permeability characteristics necessary for simulating DNAPL infiltration, redistribution, and immobilization in saturated
PETROLEUM RESERVOIRS FLUID FLOW IN. ill OR 236 URBANA X Q ~ < o S z» 5 8. DIVISION OF THE ILLINOIS STATE GEOLOGICAL SURVEY JOHN C.
 s 14.GS: OR 236 c. 1 ILLINOIS GEOLOGICAL SURVEY LIBRARY STATE OF ILLINOIS WILLIAM G. STRATTON, Governor DEPARTMENT OF REGISTRATION AND EDUCATION VERA M. BINKS, Director FLUID FLOW IN PETROLEUM RESERVOIRS
This paper was prepared for presentation at the International Symposium of the Society of Core Analysts held in Toronto, Canada, August 2005
 SCA2005-18 1/12 INFLUENCE OF WETTABILITY ON RESISTIVITY OF SEDIMENTARY ROCKS Mikhail Gladkikh 1, The University of Texas at Austin, Institute of Computational and Engineering Sciences Steven L. Bryant,
NUMERICAL INVESTIGATION OF THE DEPENDENCE OF RESIDUAL OIL SATURATION ON GEOMETRY, WETTABILITY, INITIAL OIL SATURATION AND POROSITY
 SCA2014-042 1/6 NUMERICAL INVESTIGATION OF THE DEPENDENCE OF RESIDUAL OIL SATURATION ON GEOMETRY, WETTABILITY, INITIAL OIL SATURATION AND POROSITY Xiaobo Nie, Y. Mu, R. Sungkorn, V. Gundepalli and J. Toelke
Numerical and Laboratory Study of Gas Flow through Unconventional Reservoir Rocks
 Numerical and Laboratory Study of Gas Flow through Unconventional Reservoir Rocks RPSEA Piceance Basin Tight Gas Research Review Xiaolong Yin, Assistant Professor Petroleum Engineering, Colorado School
Entropic Crystal-Crystal Transitions of Brownian Squares K. Zhao, R. Bruinsma, and T.G. Mason
 Entropic Crystal-Crystal Transitions of Brownian Squares K. Zhao, R. Bruinsma, and T.G. Mason This supplementary material contains the following sections: image processing methods, measurements of Brownian
pressure-saturations relationships for two-phase flow in 3D porous media: implications micro-heterogeneities
 Loughborough University Institutional Repository Dynamic effects in capillary pressure-saturations relationships for two-phase flow in 3D porous media: implications of micro-heterogeneities This item was
CHARACTERIZING and predicting multiphase flow phenomena
 Published online May 26, 2006 Characterizing Pore-Scale Configuration of Organic Immiscible Liquid in Multiphase Systems With Synchrotron X-Ray Microtomography G. Schnaar and M. L. Brusseau* ABSTRACT The
Orientation Map Based Palmprint Recognition
 Orientation Map Based Palmprint Recognition (BM) 45 Orientation Map Based Palmprint Recognition B. H. Shekar, N. Harivinod bhshekar@gmail.com, harivinodn@gmail.com India, Mangalore University, Department
THE EFFECT OF WATER SATURATION ON GAS SLIP FACTOR BY PORE SCALE NETWORK MODELING
 SCA00-53 1/6 THE EFFECT OF WATER SATURATION ON GAS SLIP FACTOR BY PORE SCALE NETWORK MODELING Liu Qingjie, Liu Baohua, Li Xianbing, Yan Shouguo Research Institute of Petroleum Exploration and Development,