Session 8: Statistical Analysis of Measurements
|
|
|
- Leon Curtis
- 5 years ago
- Views:
Transcription
1 Session 8: Statistical Analysis of Measurements Jennifer Hay Factory Application Engineer Nano-Scale Sciences Division Agilent Technologies To view previous sessions: Page 1
2 Drawing conclusions We perform 10 indentations on each of two materials. Material A: H = 4.91±0.3 Material B: H = 5.17±0.1 Is this difference in hardness significant or not? Page
3 Designing experiments We have changed our film-deposition process and wish to know if that change has caused the hardness to change by more than %. Indentation tests on our films typically have a standard deviation of 5%. How many indentations must we do on each film (old and new) in order to determine whether the hardness of the new film differs by more than % from that of the old film? Page 3
 Gosset devised the t-test as a cheap way to monitor the quality of stout.")
4 History of the Student s t-test (From Wikipedia) The t-statistic was introduced in 1908 by William Sealy Gosset, a chemist working for the Guinness brewery in Dublin, Ireland ("Student" was his pen name) Gosset devised the t-test as a cheap way to monitor the quality of stout. He published the test in Biometrika in 1908, but was forced to use a pen name by his employer, who regarded the fact that they were using statistics as a trade secret. In fact, Gosset's identity was known to fellow statisticians. Page 4
5 Student-t test - Overview Student-t test is a statistical test used to determine, to a reasonable degree of confidence, whether two observation sets obtain from different populations. Null hypothesis: The two observations sets obtain from the same population. If the difference between the two averages is sufficiently large, relative to measurement scatter, we reject the null hypothesis and conclude that the two measurement sets obtain from different underlying populations. Exemplary conclusion: With 95% confidence, we conclude that material A is significantly harder than material B. Page 5
6 Assumptions Populations are normally distributed. (An observation set is a limited, random sampling of a population.) Observation sets are independent (not paired). (An example of paired sets would be test scores of a group of students before studying and test scores for that same group of students after studying.) Second population may have a mean that is either higher or lower than first population. (Two-tailed t-test, not onetailed t-test. One-tailed t-test is used when you start by assuming that the controlled variable MUST cause the second population to have a mean which is greater or less than the first; i.e. studying MUST cause higher grades.) Page 6
7 Assumptions Populations are normally distributed. (An observation set is a limited representative of population.) Observation sets are independent (not paired). (An example of paired sets would be test scores of a group of students before studying and test scores for that same group of students after studying.) Second population may have a mean that is either higher or lower than first population (Two-tailed t-test). Page 7
8 Step-by-step procedure for using Student s t-test to determine if a measured difference is signficant 1. Decide on a confidence level. Page 8
9 What confidence level? The student s t-test involves calculating the statistical probability (p) that the two measurement sets could have come from the same population. Observation set 1 Observation set p =7.6% Page 9
10 What confidence level? Observation set 1 Observation set p =7.6% Page 10
11 What confidence level? Observation set 1 Observation set p =7.6% Page 11
12 What confidence level? Observation set 1 Observation set p =7.6% Page 1
13 What confidence level? Observation set 1 Observation set p =7.6% The experimenter must define what threshold probability is to be accepted as significant (confidence level). This is a personal judgment in the light of tradition. Aside: The selection of confidence level is one example by which Michael Polanyi contradicts the notion that objectivity is synonymous with impersonal in science (Personal Knowledge). Page 13
14 Is this significant? Observation set 1 Observation set p =4.% In the biological/medical communities, the tradition is to consider any probability less than 5% as significant, so if the observations are made in those fields, then yes. But this tradition (of p < 0.05) derives largely from the relative difficulty of making experimental observations in biology. Page 14
15 Probability depends on number of observations Observation set 1 Observation set p =4.% Say (for a moment) that the two observation sets derive from two populations that really are different. Then the probability returned by the t-test will decrease as the number of observations increases. If observations are cheap (as they are with indentation), there is no reason to settle for p < 0.05 for significance. Page 15
16 Threshold on probability of common population Confidence level Probability threshold 5% 95% 1% 99% 0.1% 99.9% Confidence level Page 16
17 Threshold on probability of common population Confidence level Probability threshold 5% 95% 1% 99% 0.1% 99.9% Confidence level Page 17
18 Student s t-test, step-by-step 1. Decide on a confidence level (JLH recommends 99% for indentation testing, but 95% is also common).. Calculate average and standard deviation for each observation set (X 1, s 1 ; X, s ). 3. Calculate degrees of freedom, df, where N 1 and N are the number of observations in sets 1 and, respectively: df = N 1 +N - Page 18
19 Student s t-test, step-by-step 4. Look up Z crit in a t-distribution table by looking for the value of df in the first column and then finding the corresponding value under the column for a two-tailed comparison at 99% (or other desired) confidence. Page 19
20 t-distribution table ( Page 0
21 Student s t-test, step-by-step 4. Look up Z crit in a t-distribution table by looking for the value of df in the first column and then finding the corresponding value under the column for a two-tailed comparison at 99% (or other desired) confidence. Page 1
22 Student s t-test, step-by-step 4. Look up Z crit in a t-distribution table by looking for the value of df in the first column and then finding the corresponding value under the column for a two-tailed comparison at 99% (or other desired) confidence. 5. Calculate the value of the test statistic, Z, as: Z X 1 X s 1 s N1 N Page
23 Student s t-test, step-by-step 4. Look up Z crit in a t-distribution table by looking for the value of df in the first column and then finding the corresponding value under the column for a two-tailed comparison at 99% (or other desired) confidence. 5. Calculate the value of the test statistic, Z, as: Z X 1 X s 1 s N1 N 6. Compare Z and Z crit. If Z is greater, reject the null hypothesis and conclude that the observation sets are significantly different (drawn from different populations). Page 3
24 Example (H A = 4.91±0.3; H B = 5.17±0.1; N = 10) We perform 10 indentations on each of two materials. Material A: H = 4.91±0.3 Material B: H = 5.17±0.1 Is this difference in hardness significant or not? Page 4
25 Example (H A = 4.91±0.3; H B = 5.17±0.1; N = 10) 1. Decide on a confidence level: 99%.. Calculate average and standard deviation for each observation set (X 1 =4.91, s 1 =0.3; X =5.17, s =0.1). 3. Calculate degrees of freedom: df = = Look up Z crit Page 5

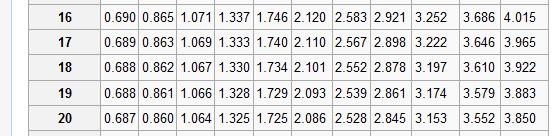
26 t-distribution table ( Page 6
27 Example (H A = 4.91±0.3; H B = 5.17±0.1; N = 10) 1. Decide on a confidence level: 99%.. Calculate average and standard deviation for each observation set (X 1 =4.91, s 1 =0.3; X =5.17, s =0.1). 3. Calculate degrees of freedom: df = = Look up Z crit :.878 (Z crit =.101 at 95% confidence). Page 7
28 Example (H A = 4.91±0.3; H B = 5.17±0.1; N = 10) 1. Decide on a confidence level: 99%.. Calculate average and standard deviation for each observation set (X 1 =4.91, s 1 =0.3; X =5.17, s =0.1). 3. Calculate degrees of freedom: df = = Look up Z crit :.878 (Z crit =.101 at 95% confidence). 5. Calculate the value of the test statistic: Z Z (0.3) 10 (0.1) Page 8
29 Example (H A = 4.91±0.3; H B = 5.17±0.1; N = 10) 1. Decide on a confidence level: 99%.. Calculate average and standard deviation for each observation set (X 1 =4.91, s 1 =0.3; X =5.17, s =0.1). 3. Calculate degrees of freedom: df = = Look up Z crit :.878 (Z crit =.101 at 95% confidence). 5. Calculate the value of the test statistic: Z = Compare Z and Z crit. Page 9
30 Example (H A = 4.91±0.3; H B = 5.17±0.1; N = 10) 1. Decide on a confidence level: 99%.. Calculate average and standard deviation for each observation set (X 1 =4.91, s 1 =0.3; X =5.17, s =0.1). 3. Calculate degrees of freedom: df = = Look up Z crit :.878 (Z crit =.101 at 95% confidence). 5. Calculate the value of the test statistic: Z = Compare Z and Z crit. Conclusion: At the level of 99% confidence, the two observation sets are not sigificantly different. (But at 95% they are.) Page 30
31 What s N got to do with it? Z (0.3) 10 (0.1) Page 31
32 What s N got to do with it? Z (0.3) 10 (0.1) Page 3
33 What s N got to do with it? Z (0.3) 10 (0.1) Page 33
34 What s N got to do with it? Z (0.3) 10 (0.1) > Whereas we could NOT conclude this difference to be significant at 99% confidence with only 10 indents, we CAN conclude it to be signficant at 99% confidence with 0 indents!! Page 34
35 A word of warning The student s t-test can discern significant difference between two observation sets. IT DOES NOT discern the cause of that difference for you. If the experiment is well designed, then the difference (if there is one) can be credited to the influence of a single independent parameter (e.g. tempering time). The well designed experiment minimizes the influence of all other physical variables (sample temperature, frame stiffness, indenter shape). Page 35
36 Using the student s t-test to estimate the number of observations needed to conclude significant difference at a particular confidence level Page 36
37 Solving Student s t-test for N Page 37 Z N N X X crit s s Set N = N 1 = N Z N X X crit s s 1 1 Isolate variables which depend on N X X Z N crit 1 1 s s
38 Simplifications Page 38 X X Z N crit 1 1 s s F X X q F X q Z N crit F F q Z N crit 1 1 Z crit =.58 for N = (99%); Z crit = 3.36 for N = 5 (99%)

39 N/Z crit as a function of N Calculate a column of N/Z crit and plot as a function of N. Page 39
40 N/Z crit as a function of N Page 40

41 Solving Student s t-test for N Page 41 F F q Z N crit 1 1 F F q b mn 1 1 b F F q m N 1 1 1
42 Functionality N 1 m q 1 F b 1F Page 4
43 Example We have changed our film-deposition process and wish to know if that change has caused the hardness to change by more than %. Indentation tests on our films typically have a standard deviation of 5%. How many indentations must we do on each film (old and new) in order to determine whether the hardness of the new film differs by more than % from that of the old film? N 1 q m 1 F b 1F 1 (0.05) N 0. 3 N Page 43
44 Example: Detect a % change with 5% std. dev. Page 44
45 Summary The Student s t-test provides a means for discerning whether the difference between two observation sets is significant. The experimentalist must select the threshold probability (of a common population) below which the null hypothesis will be rejected. This is done with consideration for tradition and the cost of individual observations. With some simplification, the Student s t-test can be used to predict the number of observations needed to discern a particular difference. Page 45
46 Session 9: Theory of indentation creep Wednesday, June 1, 013, 11:00 (New York) Abstract In addition to hardness and Young s modulus, instrumented indentation can be used to characterize creep in metals. This is because hardness is a manifestation of the yield stress of the metal. Under conditions of creep, the yield stress depends on temperature and strain rate. As a manifestation of yield stress, hardness is not a constant, but instead depends on temperature and strain rate just as yield stress does. By quantifying these dependencies, instrumented indentation can be used to determine the stress exponent and activation energy for creep. To register: Page 46
47 Suggested reading for next session Lucas, B. N., and W. C. Oliver. "Indentation Power-Law Creep of High-Purity Indium." Metallurgical and Materials Transactions A-Physical Metallurgy and Materials Science 30.3 (1999): Agilent application note: In Situ Young s Modulus and Strain-Rate Sensitivity of Lead-Free SAC 105 Solder ( Page 47
48 Upcoming workshops June : Theory & Practice of Instrumented Indentation Testing Course, Sunday, 1:00-5:00p.m., The Westin Lombard Yorktown Center, Lombard, Illinois. A short course offered in conjunction with the SEM 013 Annual Conference & Exposition on Experimental and Applied Mechanics ( June 5-6: Nano Measure 013 A symposium for sensing and understanding nano-scale phenomena, University of Warsaw, Poland. Page 48
49 Page 49 Thank you!
Chapter 23. Inferences About Means. Monday, May 6, 13. Copyright 2009 Pearson Education, Inc.
 Chapter 23 Inferences About Means Sampling Distributions of Means Now that we know how to create confidence intervals and test hypotheses about proportions, we do the same for means. Just as we did before,
Session 15: Measuring Substrate-Independent Young s Modulus of Thin Films
 Session 15: Measuring Substrate-Independent Young s Modulus of Thin Films Jennifer Hay Factory Application Engineer Nano-Scale Sciences Division Agilent Technologies jenny.hay@agilent.com To view previous
Lecture on Null Hypothesis Testing & Temporal Correlation
 Lecture on Null Hypothesis Testing & Temporal Correlation CS 590.21 Analysis and Modeling of Brain Networks Department of Computer Science University of Crete Acknowledgement Resources used in the slides
Slides for Data Mining by I. H. Witten and E. Frank
 Slides for Data Mining by I. H. Witten and E. Frank Predicting performance Assume the estimated error rate is 5%. How close is this to the true error rate? Depends on the amount of test data Prediction
Statistical Foundations:
 Statistical Foundations: t distributions, t-tests tests Psychology 790 Lecture #12 10/03/2006 Today sclass The t-distribution t ib ti in its full glory. Why we use it for nearly everything. Confidence
T.I.H.E. IT 233 Statistics and Probability: Sem. 1: 2013 ESTIMATION AND HYPOTHESIS TESTING OF TWO POPULATIONS
 ESTIMATION AND HYPOTHESIS TESTING OF TWO POPULATIONS In our work on hypothesis testing, we used the value of a sample statistic to challenge an accepted value of a population parameter. We focused only
CBA4 is live in practice mode this week exam mode from Saturday!
 Announcements CBA4 is live in practice mode this week exam mode from Saturday! Material covered: Confidence intervals (both cases) 1 sample hypothesis tests (both cases) Hypothesis tests for 2 means as
Section 9.4. Notation. Requirements. Definition. Inferences About Two Means (Matched Pairs) Examples
 Examples") Objective Section 9.4 Inferences About Two Means (Matched Pairs) Compare of two matched-paired means using two samples from each population. Hypothesis Tests and Confidence Intervals of two dependent means
Objective Section 9.4 Inferences About Two Means (Matched Pairs) Compare of two matched-paired means using two samples from each population. Hypothesis Tests and Confidence Intervals of two dependent means
Session 11: Complex Modulus of Viscoelastic Polymers
 Session 11: Complex Modulus of Viscoelastic Polymers Jennifer Hay Factory Application Engineer Nano-Scale Sciences Division Agilent Technologies jenny.hay@agilent.com To view previous sessions: https://agilenteseminar.webex.com/agilenteseminar/onstage/g.php?p=117&t=m
Chapter 23. Inference About Means
 Chapter 23 Inference About Means 1 /57 Homework p554 2, 4, 9, 10, 13, 15, 17, 33, 34 2 /57 Objective Students test null and alternate hypotheses about a population mean. 3 /57 Here We Go Again Now that
Sampling Distributions: Central Limit Theorem
 Review for Exam 2 Sampling Distributions: Central Limit Theorem Conceptually, we can break up the theorem into three parts: 1. The mean (µ M ) of a population of sample means (M) is equal to the mean (µ)
P-values and statistical tests 3. t-test
 P-values and statistical tests 3. t-test Marek Gierliński Division of Computational Biology Hand-outs available at http://is.gd/statlec Statistical test Null hypothesis H 0 : no effect Significance level
Single Sample Means. SOCY601 Alan Neustadtl
 Single Sample Means SOCY601 Alan Neustadtl The Central Limit Theorem If we have a population measured by a variable with a mean µ and a standard deviation σ, and if all possible random samples of size
" M A #M B. Standard deviation of the population (Greek lowercase letter sigma) σ 2
 σ 2") Notation and Equations for Final Exam Symbol Definition X The variable we measure in a scientific study n The size of the sample N The size of the population M The mean of the sample µ The mean of the
Notation and Equations for Final Exam Symbol Definition X The variable we measure in a scientific study n The size of the sample N The size of the population M The mean of the sample µ The mean of the
1 Descriptive statistics. 2 Scores and probability distributions. 3 Hypothesis testing and one-sample t-test. 4 More on t-tests
 Overall Overview INFOWO Statistics lecture S3: Hypothesis testing Peter de Waal Department of Information and Computing Sciences Faculty of Science, Universiteit Utrecht 1 Descriptive statistics 2 Scores
Hypothesis Testing. Mean (SDM)
") Confidence Intervals and Hypothesis Testing Readings: Howell, Ch. 4, 7 The Sampling Distribution of the Mean (SDM) Derivation - See Thorne & Giesen (T&G), pp. 169-171 or online Chapter Overview for Ch.
Confidence Intervals and Hypothesis Testing Readings: Howell, Ch. 4, 7 The Sampling Distribution of the Mean (SDM) Derivation - See Thorne & Giesen (T&G), pp. 169-171 or online Chapter Overview for Ch.
You may not use your books/notes on this exam. You may use calculator.
 MATH 450 Fall 2018 Review problems 12/03/18 Time Limit: 60 Minutes Name (Print: This exam contains 6 pages (including this cover page and 5 problems. Check to see if any pages are missing. Enter all requested
Introduction to Business Statistics QM 220 Chapter 12
 Department of Quantitative Methods & Information Systems Introduction to Business Statistics QM 220 Chapter 12 Dr. Mohammad Zainal 12.1 The F distribution We already covered this topic in Ch. 10 QM-220,
z and t tests for the mean of a normal distribution Confidence intervals for the mean Binomial tests
 z and t tests for the mean of a normal distribution Confidence intervals for the mean Binomial tests Chapters 3.5.1 3.5.2, 3.3.2 Prof. Tesler Math 283 Fall 2018 Prof. Tesler z and t tests for mean Math
Exam 2 (KEY) July 20, 2009
 July 20, 2009") STAT 2300 Business Statistics/Summer 2009, Section 002 Exam 2 (KEY) July 20, 2009 Name: USU A#: Score: /225 Directions: This exam consists of six (6) questions, assessing material learned within Modules
STAT 2300 Business Statistics/Summer 2009, Section 002 Exam 2 (KEY) July 20, 2009 Name: USU A#: Score: /225 Directions: This exam consists of six (6) questions, assessing material learned within Modules
(Re)introduction to statistics: dusting off the cobwebs
introduction to statistics: dusting off the cobwebs") (Re)introduction to statistics: dusting off the cobwebs Vicki Barwick LGC Aoife Morrin Insight Centre for Data Analysis DCU Data Quality, analysis and integrity workshop Dublin Castle 14-15 May 018 Overview
(Re)introduction to statistics: dusting off the cobwebs Vicki Barwick LGC Aoife Morrin Insight Centre for Data Analysis DCU Data Quality, analysis and integrity workshop Dublin Castle 14-15 May 018 Overview
POLI 443 Applied Political Research
 POLI 443 Applied Political Research Session 4 Tests of Hypotheses The Normal Curve Lecturer: Prof. A. Essuman-Johnson, Dept. of Political Science Contact Information: aessuman-johnson@ug.edu.gh College
Hypothesis Testing in Action
 Hypothesis Testing in Action Jonathan Bagley School of Mathematics, University of Manchester Jonathan Bagley, September 23, 2005 The t-tests - p. 1/23 Overview Today we ll examine three data sets and use
Statistics Part IV Confidence Limits and Hypothesis Testing. Joe Nahas University of Notre Dame
 Statistics Part IV Confidence Limits and Hypothesis Testing Joe Nahas University of Notre Dame Statistic Outline (cont.) 3. Graphical Display of Data A. Histogram B. Box Plot C. Normal Probability Plot
Hypothesis Testing hypothesis testing approach formulation of the test statistic
 Hypothesis Testing For the next few lectures, we re going to look at various test statistics that are formulated to allow us to test hypotheses in a variety of contexts: In all cases, the hypothesis testing
z-test, t-test Kenneth A. Ribet Math 10A November 28, 2017
 Math 10A November 28, 2017 Welcome back, Bears! This is the last week of classes. RRR Week December 4 8: This class will meet in this room on December 5, 7 for structured reviews by T. Zhu and crew. Final
Advanced Experimental Design
 Advanced Experimental Design Topic Four Hypothesis testing (z and t tests) & Power Agenda Hypothesis testing Sampling distributions/central limit theorem z test (σ known) One sample z & Confidence intervals
Ch. 7. One sample hypothesis tests for µ and σ
 Ch. 7. One sample hypothesis tests for µ and σ Prof. Tesler Math 18 Winter 2019 Prof. Tesler Ch. 7: One sample hypoth. tests for µ, σ Math 18 / Winter 2019 1 / 23 Introduction Data Consider the SAT math
HYPOTHESIS TESTING. Hypothesis Testing
 MBA 605 Business Analytics Don Conant, PhD. HYPOTHESIS TESTING Hypothesis testing involves making inferences about the nature of the population on the basis of observations of a sample drawn from the population.
7.2 One-Sample Correlation ( = a) Introduction. Correlation analysis measures the strength and direction of association between
 Introduction. Correlation analysis measures the strength and direction of association between") 7.2 One-Sample Correlation ( = a) Introduction Correlation analysis measures the strength and direction of association between variables. In this chapter we will test whether the population correlation
7.2 One-Sample Correlation ( = a) Introduction Correlation analysis measures the strength and direction of association between variables. In this chapter we will test whether the population correlation
Statistics for IT Managers
 Statistics for IT Managers 95-796, Fall 2012 Module 2: Hypothesis Testing and Statistical Inference (5 lectures) Reading: Statistics for Business and Economics, Ch. 5-7 Confidence intervals Given the sample
Hypotheses and Errors
 Hypotheses and Errors Jonathan Bagley School of Mathematics, University of Manchester Jonathan Bagley, September 23, 2005 Hypotheses & Errors - p. 1/22 Overview Today we ll develop the standard framework
Inference About Two Means: Independent Samples
 Inference About Two Means: Independent Samples MATH 130, Elements of Statistics I J. Robert Buchanan Department of Mathematics Fall 2017 Motivation Suppose we wish to study the mean absorption in muscle
Design of Engineering Experiments Part 2 Basic Statistical Concepts Simple comparative experiments
 Design of Engineering Experiments Part 2 Basic Statistical Concepts Simple comparative experiments The hypothesis testing framework The two-sample t-test Checking assumptions, validity Comparing more that
Announcements. Unit 3: Foundations for inference Lecture 3: Decision errors, significance levels, sample size, and power.
 Announcements Announcements Unit 3: Foundations for inference Lecture 3:, significance levels, sample size, and power Statistics 101 Mine Çetinkaya-Rundel October 1, 2013 Project proposal due 5pm on Friday,
Hypothesis Testing in Action: t-tests
 Hypothesis Testing in Action: t-tests Mark Muldoon School of Mathematics, University of Manchester Mark Muldoon, January 30, 2007 t-testing - p. 1/31 Overview large Computing t for two : reprise Today
Chapter 8: Confidence Intervals
 Chapter 8: Confidence Intervals Introduction Suppose you are trying to determine the mean rent of a two-bedroom apartment in your town. You might look in the classified section of the newspaper, write
Inferential Statistics
 Inferential Statistics Part 1 Sampling Distributions, Point Estimates & Confidence Intervals Inferential statistics are used to draw inferences (make conclusions/judgements) about a population from a sample.
Lecture 30. DATA 8 Summer Regression Inference
 DATA 8 Summer 2018 Lecture 30 Regression Inference Slides created by John DeNero (denero@berkeley.edu) and Ani Adhikari (adhikari@berkeley.edu) Contributions by Fahad Kamran (fhdkmrn@berkeley.edu) and
Dover- Sherborn High School Mathematics Curriculum Probability and Statistics
 Mathematics Curriculum A. DESCRIPTION This is a full year courses designed to introduce students to the basic elements of statistics and probability. Emphasis is placed on understanding terminology and
Last two weeks: Sample, population and sampling distributions finished with estimation & confidence intervals
 Past weeks: Measures of central tendency (mean, mode, median) Measures of dispersion (standard deviation, variance, range, etc). Working with the normal curve Last two weeks: Sample, population and sampling
An Analysis of College Algebra Exam Scores December 14, James D Jones Math Section 01
 An Analysis of College Algebra Exam s December, 000 James D Jones Math - Section 0 An Analysis of College Algebra Exam s Introduction Students often complain about a test being too difficult. Are there
Application of Chi-Square and T-Test in Architectural Research Methods
 Open Science Journal of Mathematics and Application 2016; 4(5): 28-32 http://www.openscienceonline.com/journal/osjma ISSN: 2381-4934 (Print); ISSN: 2381-4942 (Online) Application of Chi-Square and T-Test
Hypothesis testing I. - In particular, we are talking about statistical hypotheses. [get everyone s finger length!] n =
![Hypothesis testing I. - In particular, we are talking about statistical hypotheses. [get everyone s finger length!] n =](/thumbs/86/94764601.jpg "Hypothesis testing I. - In particular, we are talking about statistical hypotheses. [get everyone s finger length!] n =") Hypothesis testing I I. What is hypothesis testing? [Note we re temporarily bouncing around in the book a lot! Things will settle down again in a week or so] - Exactly what it says. We develop a hypothesis,
Hypothesis testing I I. What is hypothesis testing? [Note we re temporarily bouncing around in the book a lot! Things will settle down again in a week or so] - Exactly what it says. We develop a hypothesis,
CIVL /8904 T R A F F I C F L O W T H E O R Y L E C T U R E - 8
 CIVL - 7904/8904 T R A F F I C F L O W T H E O R Y L E C T U R E - 8 Chi-square Test How to determine the interval from a continuous distribution I = Range 1 + 3.322(logN) I-> Range of the class interval
One-Way Analysis of Variance (ANOVA) Paul K. Strode, Ph.D.
 Paul K. Strode, Ph.D.") One-Way Analysis of Variance (ANOVA) Paul K. Strode, Ph.D. Purpose While the T-test is useful to compare the means of two samples, many biology experiments involve the parallel measurement of three or
One-Way Analysis of Variance (ANOVA) Paul K. Strode, Ph.D. Purpose While the T-test is useful to compare the means of two samples, many biology experiments involve the parallel measurement of three or
Area1 Scaled Score (NAPLEX) .535 ** **.000 N. Sig. (2-tailed)
 .535 ** **.000 N. Sig. (2-tailed)") Institutional Assessment Report Texas Southern University College of Pharmacy and Health Sciences "An Analysis of 2013 NAPLEX, P4-Comp. Exams and P3 courses The following analysis illustrates relationships
Institutional Assessment Report Texas Southern University College of Pharmacy and Health Sciences "An Analysis of 2013 NAPLEX, P4-Comp. Exams and P3 courses The following analysis illustrates relationships
The t-statistic. Student s t Test
 The t-statistic 1 Student s t Test When the population standard deviation is not known, you cannot use a z score hypothesis test Use Student s t test instead Student s t, or t test is, conceptually, very
Statistical Methods in Natural Resources Management ESRM 304
 Statistical Methods in Natural Resources Management ESRM 304 Statistical Methods in Natural Resources Management I. Estimating a Population Mean II. Comparing two Population Means III. Reading Assignment
Hypothesis testing: Steps
 Review for Exam 2 Hypothesis testing: Steps Exam 2 Review 1. Determine appropriate test and hypotheses 2. Use distribution table to find critical statistic value(s) representing rejection region 3. Compute
HYPOTHESIS TESTING II TESTS ON MEANS. Sorana D. Bolboacă
 HYPOTHESIS TESTING II TESTS ON MEANS Sorana D. Bolboacă OBJECTIVES Significance value vs p value Parametric vs non parametric tests Tests on means: 1 Dec 14 2 SIGNIFICANCE LEVEL VS. p VALUE Materials and
T-TEST FOR HYPOTHESIS ABOUT
 T-TEST FOR HYPOTHESIS ABOUT Previously we tested the hypothesis that a sample comes from a population with a specified using the normal distribution and a z-test. But the z-test required the population
16.400/453J Human Factors Engineering. Design of Experiments II
 J Human Factors Engineering Design of Experiments II Review Experiment Design and Descriptive Statistics Research question, independent and dependent variables, histograms, box plots, etc. Inferential
Last week: Sample, population and sampling distributions finished with estimation & confidence intervals
 Past weeks: Measures of central tendency (mean, mode, median) Measures of dispersion (standard deviation, variance, range, etc). Working with the normal curve Last week: Sample, population and sampling
Sampling distribution of t. 2. Sampling distribution of t. 3. Example: Gas mileage investigation. II. Inferential Statistics (8) t =
 t =") 2. The distribution of t values that would be obtained if a value of t were calculated for each sample mean for all possible random of a given size from a population _ t ratio: (X - µ hyp ) t s x The result
2. The distribution of t values that would be obtained if a value of t were calculated for each sample mean for all possible random of a given size from a population _ t ratio: (X - µ hyp ) t s x The result
79 Wyner Math Academy I Spring 2016
 79 Wyner Math Academy I Spring 2016 CHAPTER NINE: HYPOTHESIS TESTING Review May 11 Test May 17 Research requires an understanding of underlying mathematical distributions as well as of the research methods
Chapter 10. Correlation and Regression. McGraw-Hill, Bluman, 7th ed., Chapter 10 1
 Chapter 10 Correlation and Regression McGraw-Hill, Bluman, 7th ed., Chapter 10 1 Chapter 10 Overview Introduction 10-1 Scatter Plots and Correlation 10- Regression 10-3 Coefficient of Determination and
Basic Statistics. 1. Gross error analyst makes a gross mistake (misread balance or entered wrong value into calculation).
.") Basic Statistics There are three types of error: 1. Gross error analyst makes a gross mistake (misread balance or entered wrong value into calculation). 2. Systematic error - always too high or too low
Basic Statistics There are three types of error: 1. Gross error analyst makes a gross mistake (misread balance or entered wrong value into calculation). 2. Systematic error - always too high or too low
2008 Winton. Statistical Testing of RNGs
 1 Statistical Testing of RNGs Criteria for Randomness For a sequence of numbers to be considered a sequence of randomly acquired numbers, it must have two basic statistical properties: Uniformly distributed
EXAM 3 Math 1342 Elementary Statistics 6-7
 EXAM 3 Math 1342 Elementary Statistics 6-7 Name Date ********************************************************************************************************************************************** MULTIPLE
LAB 2. HYPOTHESIS TESTING IN THE BIOLOGICAL SCIENCES- Part 2
 LAB 2. HYPOTHESIS TESTING IN THE BIOLOGICAL SCIENCES- Part 2 Data Analysis: The mean egg masses (g) of the two different types of eggs may be exactly the same, in which case you may be tempted to accept
Testing a Claim about the Difference in 2 Population Means Independent Samples. (there is no difference in Population Means µ 1 µ 2 = 0) against
 against") Section 9 2A Lecture Testing a Claim about the Difference i Population Means Independent Samples Test H 0 : µ 1 = µ 2 (there is no difference in Population Means µ 1 µ 2 = 0) against H 1 : µ 1 > µ 2 or
Section 9 2A Lecture Testing a Claim about the Difference i Population Means Independent Samples Test H 0 : µ 1 = µ 2 (there is no difference in Population Means µ 1 µ 2 = 0) against H 1 : µ 1 > µ 2 or
Factorial Analysis of Variance
 Factorial Analysis of Variance Conceptual Example A repeated-measures t-test is more likely to lead to rejection of the null hypothesis if a) *Subjects show considerable variability in their change scores.
Statistics Workshop Ramsey A. Foty, Ph.D. Department of Surgery UMDNJ-RWJMS
 Statistics Workshop 2012 Ramsey A. Foty, Ph.D. Department of Surgery UMDNJ-RWJMS An unsophisticated forecaster uses statistics as a drunkard uses lamp-postsfor support rather than for illumination Andrew
Confidence Intervals for Comparing Means
 Comparison 2 Solutions COR1-GB.1305 Statistics and Data Analysis Confidence Intervals for Comparing Means 1. Recall the class survey. Seventeen female and thirty male students filled out the survey, reporting
Unit 6 - Introduction to linear regression
 Unit 6 - Introduction to linear regression Suggested reading: OpenIntro Statistics, Chapter 7 Suggested exercises: Part 1 - Relationship between two numerical variables: 7.7, 7.9, 7.11, 7.13, 7.15, 7.25,
Inferences for Correlation
 Inferences for Correlation Quantitative Methods II Plan for Today Recall: correlation coefficient Bivariate normal distributions Hypotheses testing for population correlation Confidence intervals for population
COGS 14B: INTRODUCTION TO STATISTICAL ANALYSIS
 COGS 14B: INTRODUCTION TO STATISTICAL ANALYSIS TA: Sai Chowdary Gullapally scgullap@eng.ucsd.edu Office Hours: Thursday (Mandeville) 3:30PM - 4:30PM (or by appointment) Slides: I am using the amazing slides
Part III: Unstructured Data
 Inf1-DA 2010 2011 III: 51 / 89 Part III Unstructured Data Data Retrieval: III.1 Unstructured data and data retrieval Statistical Analysis of Data: III.2 Data scales and summary statistics III.3 Hypothesis
February 5, 2018 START HERE. measurement scale. Means. number of means. independent measures t-test Ch dependent measures t-test Ch 16.
 χ Test for Frequencies February 5, 018 Contents Chi squared (χ ) test for frequencies Example 1: left vs right handers in our class The χ distribution One or two tailed? Example : Birthdays by month Using
Statistics For Economics & Business
 Statistics For Economics & Business Analysis of Variance In this chapter, you learn: Learning Objectives The basic concepts of experimental design How to use one-way analysis of variance to test for differences
Statistics Primer. ORC Staff: Jayme Palka Peter Boedeker Marcus Fagan Trey Dejong
 Statistics Primer ORC Staff: Jayme Palka Peter Boedeker Marcus Fagan Trey Dejong 1 Quick Overview of Statistics 2 Descriptive vs. Inferential Statistics Descriptive Statistics: summarize and describe data
6. CONFIDENCE INTERVALS. Training is everything cauliflower is nothing but cabbage with a college education.
 CIVL 3103 Approximation and Uncertainty J.W. Hurley, R.W. Meier 6. CONFIDENCE INTERVALS Training is everything cauliflower is nothing but cabbage with a college education. Mark Twain At the beginning of
Quantitative Methods for Economics, Finance and Management (A86050 F86050)
") Quantitative Methods for Economics, Finance and Management (A86050 F86050) Matteo Manera matteo.manera@unimib.it Marzio Galeotti marzio.galeotti@unimi.it 1 This material is taken and adapted from Guy Judge
Quantitative Methods for Economics, Finance and Management (A86050 F86050) Matteo Manera matteo.manera@unimib.it Marzio Galeotti marzio.galeotti@unimi.it 1 This material is taken and adapted from Guy Judge
Confidence Interval Estimation
 Department of Psychology and Human Development Vanderbilt University 1 Introduction 2 3 4 5 Relationship to the 2-Tailed Hypothesis Test Relationship to the 1-Tailed Hypothesis Test 6 7 Introduction In
AMS 315/576 Lecture Notes
 AMS 315/576 Lecture Notes Chapter 6. Inference about µ 1 µ 2 1. Large Populations (n 1 30, n 2 30) Two Independent Samples EXAMPLE 6.1 A survey of credit card holders revealed that Americans carried an
This is a multiple choice and short answer practice exam. It does not count towards your grade. You may use the tables in your book.
 NAME (Please Print): HONOR PLEDGE (Please Sign): statistics 101 Practice Final Key This is a multiple choice and short answer practice exam. It does not count towards your grade. You may use the tables
Chapter 5: HYPOTHESIS TESTING
 MATH411: Applied Statistics Dr. YU, Chi Wai Chapter 5: HYPOTHESIS TESTING 1 WHAT IS HYPOTHESIS TESTING? As its name indicates, it is about a test of hypothesis. To be more precise, we would first translate
The Student s t Distribution
 The Student s t Distribution What do we do if (a) we don t know σ and (b) n is small? If the population of interest is normally distributed, we can use the Student s t-distribution in place of the standard
Hypothesis testing and the Gamma function
 Math 10A November 29, 2016 Announcements Please send me email to sign up for the next two (last two?) breakfasts: This Thursday (December 1) at 9AM. Next Monday (December 5), also at 9AM. Pop-in lunch
Hypothesis testing: Steps
 Review for Exam 2 Hypothesis testing: Steps Repeated-Measures ANOVA 1. Determine appropriate test and hypotheses 2. Use distribution table to find critical statistic value(s) representing rejection region
CHAPTER 9, 10. Similar to a courtroom trial. In trying a person for a crime, the jury needs to decide between one of two possibilities:
 CHAPTER 9, 10 Hypothesis Testing Similar to a courtroom trial. In trying a person for a crime, the jury needs to decide between one of two possibilities: The person is guilty. The person is innocent. To
χ 2 Test for Frequencies January 15, 2019 Contents
 χ 2 Test for Frequencies January 15, 2019 Contents Chi squared (χ 2 ) test for frequencies Example 1: left vs right handers in our class The χ 2 distribution One or two tailed? Example 2: Birthdays by
POLI 443 Applied Political Research
 POLI 443 Applied Political Research Session 6: Tests of Hypotheses Contingency Analysis Lecturer: Prof. A. Essuman-Johnson, Dept. of Political Science Contact Information: aessuman-johnson@ug.edu.gh College
11 CHI-SQUARED Introduction. Objectives. How random are your numbers? After studying this chapter you should
 11 CHI-SQUARED Chapter 11 Chi-squared Objectives After studying this chapter you should be able to use the χ 2 distribution to test if a set of observations fits an appropriate model; know how to calculate
Psych 230. Psychological Measurement and Statistics
 Psych 230 Psychological Measurement and Statistics Pedro Wolf December 9, 2009 This Time. Non-Parametric statistics Chi-Square test One-way Two-way Statistical Testing 1. Decide which test to use 2. State
Basic Statistics. 1. Gross error analyst makes a gross mistake (misread balance or entered wrong value into calculation).
.") Basic Statistics There are three types of error: 1. Gross error analyst makes a gross mistake (misread balance or entered wrong value into calculation). 2. Systematic error - always too high or too low
Basic Statistics There are three types of error: 1. Gross error analyst makes a gross mistake (misread balance or entered wrong value into calculation). 2. Systematic error - always too high or too low
Marketing Research Session 10 Hypothesis Testing with Simple Random samples (Chapter 12)
") Marketing Research Session 10 Hypothesis Testing with Simple Random samples (Chapter 12) Remember: Z.05 = 1.645, Z.01 = 2.33 We will only cover one-sided hypothesis testing (cases 12.3, 12.4.2, 12.5.2,
Marketing Research Session 10 Hypothesis Testing with Simple Random samples (Chapter 12) Remember: Z.05 = 1.645, Z.01 = 2.33 We will only cover one-sided hypothesis testing (cases 12.3, 12.4.2, 12.5.2,
23. MORE HYPOTHESIS TESTING
 23. MORE HYPOTHESIS TESTING The Logic Behind Hypothesis Testing For simplicity, consider testing H 0 : µ = µ 0 against the two-sided alternative H A : µ µ 0. Even if H 0 is true (so that the expectation
T test for two Independent Samples. Raja, BSc.N, DCHN, RN Nursing Instructor Acknowledgement: Ms. Saima Hirani June 07, 2016
 T test for two Independent Samples Raja, BSc.N, DCHN, RN Nursing Instructor Acknowledgement: Ms. Saima Hirani June 07, 2016 Q1. The mean serum creatinine level is measured in 36 patients after they received
Ordinary Least Squares Regression Explained: Vartanian
 Ordinary Least Squares Regression Explained: Vartanian When to Use Ordinary Least Squares Regression Analysis A. Variable types. When you have an interval/ratio scale dependent variable.. When your independent
Chapter 23: Inferences About Means
 Chapter 3: Inferences About Means Sample of Means: number of observations in one sample the population mean (theoretical mean) sample mean (observed mean) is the theoretical standard deviation of the population
PSY 305. Module 3. Page Title. Introduction to Hypothesis Testing Z-tests. Five steps in hypothesis testing
 Page Title PSY 305 Module 3 Introduction to Hypothesis Testing Z-tests Five steps in hypothesis testing State the research and null hypothesis Determine characteristics of comparison distribution Five
Keysight Technologies Measuring Stress-Strain Curves for Shale Rock by Dynamic Instrumented Indentation. Application Note
 Keysight Technologies Measuring Stress-Strain Curves for Shale Rock by Dynamic Instrumented Indentation Application Note Abstract Three samples of shale rock, two from the Eagle Ford play, and one from
Population Variance. Concepts from previous lectures. HUMBEHV 3HB3 one-sample t-tests. Week 8
 Concepts from previous lectures HUMBEHV 3HB3 one-sample t-tests Week 8 Prof. Patrick Bennett sampling distributions - sampling error - standard error of the mean - degrees-of-freedom Null and alternative/research
AMS7: WEEK 7. CLASS 1. More on Hypothesis Testing Monday May 11th, 2015
 AMS7: WEEK 7. CLASS 1 More on Hypothesis Testing Monday May 11th, 2015 Testing a Claim about a Standard Deviation or a Variance We want to test claims about or 2 Example: Newborn babies from mothers taking
Two sided, two sample t-tests. a) IQ = 100 b) Average height for men = c) Average number of white blood cells per cubic millimeter is 7,000.
 IQ = 100 b) Average height for men = c) Average number of white blood cells per cubic millimeter is 7,000.") Two sided, two sample t-tests. I. Brief review: 1) We are interested in how a sample compares to some pre-conceived notion. For example: a) IQ = 100 b) Average height for men = 5 10. c) Average number
Two sided, two sample t-tests. I. Brief review: 1) We are interested in how a sample compares to some pre-conceived notion. For example: a) IQ = 100 b) Average height for men = 5 10. c) Average number
Inferences About Two Proportions
 Inferences About Two Proportions Quantitative Methods II Plan for Today Sampling two populations Confidence intervals for differences of two proportions Testing the difference of proportions Examples 1
Statistics for EES 3. From standard error to t-test
 Statistics for EES 3. From standard error to t-test Dirk Metzler http://evol.bio.lmu.de/_statgen May 23, 2011 Contents 1 The Normal Distribution 2 Taking standard errors into account 3 The t-test for paired
10/4/2013. Hypothesis Testing & z-test. Hypothesis Testing. Hypothesis Testing
 & z-test Lecture Set 11 We have a coin and are trying to determine if it is biased or unbiased What should we assume? Why? Flip coin n = 100 times E(Heads) = 50 Why? Assume we count 53 Heads... What could