Hypothesis Testing. Mean (SDM)
|
|
|
- Laureen Gaines
- 6 years ago
- Views:
Transcription
1 Confidence Intervals and Hypothesis Testing Readings: Howell, Ch. 4, 7 The Sampling Distribution of the Mean (SDM) Derivation - See Thorne & Giesen (T&G), pp or online Chapter Overview for Ch. 9 See also Howell, Chapter 4.2, 7.1
2 Getting to Know You Name, address, and phone number? With distributions, it s Central tendency The mean of the sampling distribution of M Variability The variance of the sampling distribution of M The standard deviation of the sampling distribution of M Shape Properties of the Sampling Properties of the Sampling Distribution of the Mean (SDM):
3 The Sampling Distribution of the Mean: How is it constructed? The sampling distribution of the mean (SDM) is constructed by drawing samples of some fixed size (say N = 10), calculating the mean of the samples, repeating the process for a large number of samples, and plotting the resulting means in a frequency polygon. The resulting distribution is the sampling distribution of the mean. Property 1 The population mean of the SDM equals the mean of the Parent Population. In symbols:
4 Property 2 The larger the size of the sample (N ) taken when constructing the SDM, the more closely the SDM will approximate a normal curve. If the parent population is normal, the SDM will be exactly normal. Property 3 The larger the size of the sample (N), the smaller the standard deviation of the SDM. The standard deviation of the sampling distribution of the mean is called the standard error of the mean. In symbols:
5 AKA The Central Limit Theorem Howell says, This is one of the most important theorems in statistics. (7.1) His version, p. 180: Also see this section for his illustration of the shape property. Rice Virtual Statistics i LbSi Lab Simulation i Forming Any z Score z = (score - mean of scores)/st dev of scores z (X) = z (M) = Finding M for a z - Formula 9-3 (T&G); Howell, 7.3 in context of Conf. Intervals.
6 Estimation and Degrees of Freedom Estimation for μ Estimation of sigma-squared or sigma N-1 in that case was the degrees of freedom General definition for degrees of freedom the number of values that are free to vary after certain restrictions have been placed on the data. Given that 5 scores must sum to zero, let s try it. See Howell, p. 187 for a more specific rationale. Estimating the Standard Error of the Mean Standard Error of the Mean formula: Estimated Standard Error of the Mean formula: Formula for z score: Formula when we estimate the standard error of the mean:
7 Summary Parameter Name Symbol Equivalence Sample Estimate Name Symbol Equivalence Population Mean of the SDM Sample Mean of the SDM Population Variance of the SDM Sample Variance of the SDM Population Standard Deviation of the SDM* Sample standard error of the mean The t distribution- A little history Ireland, the Guinness brewing company, and William Sealy Gosset t distribution developed to be used with small samples and unknown population variances Student st t -- rather than Gosset s s t-- so that the company wouldn t have to admit to a bad batch. More
8 t and z -- What s the difference? Sketch Role of the df Formula See Howell, Figure 7.5, p The Confidence Interval Finding deviant mean scores Sketch: Note The horizontal axis is the X axis\ The deviant scores are now means Formula (where M = X-bar) 95% CI = +/- t(.05/2) s(m) + M 99% CI = +/- t(.01/2) s(m) + M See also, Howell, 7.3, Confidence Interval on µ
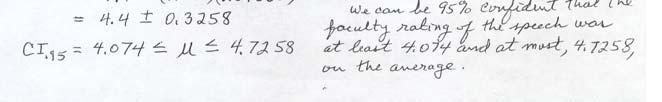
9 Example: Checking Progress Solution Interpretations We can be 95% confident that the average digit span of the adult population p is at least 6.32 and at most 7.90 digits. We can be 99% confident that the average digit span of the adult population is at least 6.05 and at most 8.17 digits. Sketches
10 What the Confidence Interval Really Means Confidence -- not probability The sample has already been drawn For a 95% confidence interval, if the experiment were repeated 100 times, 95 of the intervals would contain (capture) the true population mean μ. μ The rub is, for any given one, we don t know forsureifitcapturesμ it μ or not, hence the confidence language. Confidence vs. Probablilty We place our conficence in the method rather than the interval. You can say your confidence is.95 that Mu is found in the interval. You re at risk if you say that the probability is.95 that Mu lies in the interval. Many will pounce if you do. See Howell,,p. 193.


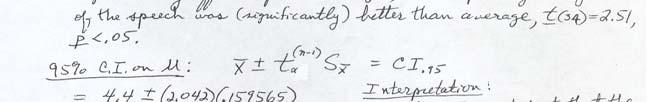
11 Hypothesis Testing: One-Sample t Test Example Handout Ratings of Speech ample_ttest.pdf
12 Hypothesis Testing: One-Sample t Test How deviant or unlikely is a particular sample mean? Analogous to finding the deviant probability of a score with the z curve Start from knowledge or assumption of the parent population. We know from much previous intelligence research that the population p mean adult digit span is 7.0 (μ = 7). Another Example Research Context Does amphetamine (a stimulant) affect recent memory? 25 volunteers take a small dose then take the digit span test M = 7.53 and s = 0.97 What is the probability of a mean this deviant? Outline: M --> >t --> Area (or probability)
13 Set up 7-step procedure Solution We assumed our sample came from the adult population with average digit span of 7. Our sample mean was 7.53, and this was 2.73 standard error units away from the mean. S(M) = s/sqrt 0.97 = Tcal = ( )/0.194 = 2.73 Tcritcal = t (25,.025) = (look-up) t(calculated) = 2.73, and the probability of a score this or more deviant was less than.05. A sample mean this deviant is very unlikely to have come from a population where μ = 7. Conclusion A one-sample t test was performed to determine if amphetamine affects adult digit span. The digit span for the amphetamine sample (M = 7.53) was significantly different from the normal adult digit span of 7, t(24) = 2.73,,p p <.05 (p <.02).) Amphetamine significantly enhances recent memory.
14 The Seven-Step Procedure An easy, organized way to test hypotheses and come to a conclusion. See T&G, pp mhhe.com/thorne4 Chapter 9 Review Gunsmoke: Errors in Hypothesis Testing Reality Cheating Decision Not Cheating H 0 : BB Honest H A : BB Cheating Error I: Shot Innocent Man Consequences? Correct Correct Error II: Continue to Play Consequences?
15 Errors in Hypothesis Testing Reality Decision Reject Fail to Reject (Claim an Effect) (No Claim) H 0 :True H 0 : False Type I Error Alpha Error (false claim) Consequences? Correct Correct Type II Error Beta Error (failure of detection) Consequences? Errors in Hypothesis Testing Signal Detection Theory Version Reality H 0 : True (No Sign.) H 0 : False (Yes Signal present) Is Signal Present? Decision Yes (Reject) (Claim an Sig. Present) Type I, Alpha Error Alpha Error (false positive false alarm Consequences? Correct Hit No Signal Fail to Reject (No Claim) Correct (Correct Rejection) Type II, β Error (False negative Miss ) (failure of detection) Consequences?
16 Consequences of Errors False Positive (false claim, Type I error) Gunsmoke: If you shoot an innocent man, you ll hang Death penalty trials avoid conviction c o of innocents. Evidence must by very very good. Hunters in the woods must not shoot everything that moves in the bushes. It could be a person or dog. Threshold for pulling the trigger must be raised until the signal is clearly present. In these situations, really want to avoid false claims. False negatives (failures of detection) not that bad Gunsmoke: Continue to play & loose $. Some criminals get lesser sentence or go free The hunter misses their game once in a while. False positives less harmful than False negatives Blood bank screening for AIDS (HIV) virus Test very sensitive; tends to detect HIV sometimes when it is not there (false positives; Type I errors) )but t always detect twhen it is there. Thus we eliminate failures of detection ( Misses ) ). Shoot and ask questions later. Cost of false positives some clean blood samples are wasted; a small price to pay for knowing gyou have no infected blood in YOUR transfusion!
17 The Almighty d prime Abiasfree bias-free measure of test sensitivity (under construction) A bias for claiming an effect ( shoot anything that moves ) will result in more false positives A bias for holding back on claiming a effect ( be sure before you shoot ) will result in more false negatives (Misses). d is the hit rate H the false alarm rate F when H and F are z-transformed: d = z(h) z(f), where H = P("yes" YES) and F = P("yes" NO) Colin Wilson has provided his Excel formula: d' = NORMINV(hitrate,0,1) - NORMINV(false-alarm-rate,0,1) where Excel's NORMINV "Returns the inverse of the normal cumulative distribution for the specified mean and standard deviation", 0 being the specified mean and 1 being the specified SD. See this link: i i l /f ili i/f ili i / i i /d i h Power-Definitions Beta = Probability of a Type II error Probability of failure of detection Power = 1 - Beta Power = 1 - Probability of a failure of detection Power = Probability of detection of an effect
18 Why Power How hard would you work if the chance of getting paid =.20,.50,.80? In behavioral science research we want a good chance of ffinding an effect, if it is present (e.g., a cure for the common cold or a form of cancer, confirming YOUR thesis/dissertation hypothesis). Statistical power tells us our chance of finding an effect the Probability of detection of an effect Factors Affecting Power Alpha level Increasing the alpha level the level of power. Sample Size Increasing the sample size the level of power. Size of the effect (mu0 - mu1) The larger the effect, the the level of power.
19 Power Diagrams Text illustrations - Howell, 4.7 Note best shown in two curves: one curve for H 0 shows α and 1- α; when H0 is true Another curve for H 1 true shows β and 1- β See Howell s Figure 4.3 Spreadsheet illustration Power.xls What Should We Be Looking For? What statistical significance tells us What effect size tells us Practical significance Statistical ti ti significance ifi = statistical ti ti reliability How sure we are of the presence of some effect Practical significance ifi = effect size = importance! More Later.
20 Using SPSS One sample t test Confidence Interval Example from Ratings of Speech (enter 4.40 x 33 times, 0.51, This simulates data for example.) Enter data; Use this syntax (or point-click) T-TEST /TESTVAL = 4 /VARIABLES = Ratings. * Comment: Set Testval = 0 to get CI on the mean. T-TEST /TESTVAL = 0 /VARIABLES = Ratings. One-Sample Statistics Ratings N Mean Std. Deviation Std. Error Mean One-Sample Test Ratings Test Value = 4 95% Confidence Interval of the Difference Mean t df Sig. (2-tailed) Difference Lower Upper * Comment: Set Testval = 0togetCIonthemean. on the T-TEST /TESTVAL = 0 /VARIABLES = Ratings. One-Sample Test Ratings Test Value = 0 95% Confidence Interval of the Difference Mean t df Sig. (2-tailed) (2tild) Difference Lower Upper
21 Lab Assignment 1 Review questions and formulae Formulae for #2. Help on setup for #5. SPSS startup
CIVL /8904 T R A F F I C F L O W T H E O R Y L E C T U R E - 8
 CIVL - 7904/8904 T R A F F I C F L O W T H E O R Y L E C T U R E - 8 Chi-square Test How to determine the interval from a continuous distribution I = Range 1 + 3.322(logN) I-> Range of the class interval
PSY 216. Assignment 9 Answers. Under what circumstances is a t statistic used instead of a z-score for a hypothesis test
 PSY 216 Assignment 9 Answers 1. Problem 1 from the text Under what circumstances is a t statistic used instead of a z-score for a hypothesis test The t statistic should be used when the population standard
1 Descriptive statistics. 2 Scores and probability distributions. 3 Hypothesis testing and one-sample t-test. 4 More on t-tests
 Overall Overview INFOWO Statistics lecture S3: Hypothesis testing Peter de Waal Department of Information and Computing Sciences Faculty of Science, Universiteit Utrecht 1 Descriptive statistics 2 Scores
HYPOTHESIS TESTING. Hypothesis Testing
 MBA 605 Business Analytics Don Conant, PhD. HYPOTHESIS TESTING Hypothesis testing involves making inferences about the nature of the population on the basis of observations of a sample drawn from the population.
Hypothesis testing I. - In particular, we are talking about statistical hypotheses. [get everyone s finger length!] n =
![Hypothesis testing I. - In particular, we are talking about statistical hypotheses. [get everyone s finger length!] n =](/thumbs/86/94764601.jpg "Hypothesis testing I. - In particular, we are talking about statistical hypotheses. [get everyone s finger length!] n =") Hypothesis testing I I. What is hypothesis testing? [Note we re temporarily bouncing around in the book a lot! Things will settle down again in a week or so] - Exactly what it says. We develop a hypothesis,
Hypothesis testing I I. What is hypothesis testing? [Note we re temporarily bouncing around in the book a lot! Things will settle down again in a week or so] - Exactly what it says. We develop a hypothesis,
Last two weeks: Sample, population and sampling distributions finished with estimation & confidence intervals
 Past weeks: Measures of central tendency (mean, mode, median) Measures of dispersion (standard deviation, variance, range, etc). Working with the normal curve Last two weeks: Sample, population and sampling
Note that we are looking at the true mean, μ, not y. The problem for us is that we need to find the endpoints of our interval (a, b).
.") Confidence Intervals 1) What are confidence intervals? Simply, an interval for which we have a certain confidence. For example, we are 90% certain that an interval contains the true value of something
Confidence Intervals 1) What are confidence intervals? Simply, an interval for which we have a certain confidence. For example, we are 90% certain that an interval contains the true value of something
Two-Sample Inferential Statistics
 The t Test for Two Independent Samples 1 Two-Sample Inferential Statistics In an experiment there are two or more conditions One condition is often called the control condition in which the treatment is
16.400/453J Human Factors Engineering. Design of Experiments II
 J Human Factors Engineering Design of Experiments II Review Experiment Design and Descriptive Statistics Research question, independent and dependent variables, histograms, box plots, etc. Inferential
Econ 325: Introduction to Empirical Economics
 Econ 325: Introduction to Empirical Economics Chapter 9 Hypothesis Testing: Single Population Ch. 9-1 9.1 What is a Hypothesis? A hypothesis is a claim (assumption) about a population parameter: population
Ch. 7: Estimates and Sample Sizes
 Ch. 7: Estimates and Sample Sizes Section Title Notes Pages Introduction to the Chapter 2 2 Estimating p in the Binomial Distribution 2 5 3 Estimating a Population Mean: Sigma Known 6 9 4 Estimating a
z and t tests for the mean of a normal distribution Confidence intervals for the mean Binomial tests
 z and t tests for the mean of a normal distribution Confidence intervals for the mean Binomial tests Chapters 3.5.1 3.5.2, 3.3.2 Prof. Tesler Math 283 Fall 2018 Prof. Tesler z and t tests for mean Math
Last week: Sample, population and sampling distributions finished with estimation & confidence intervals
 Past weeks: Measures of central tendency (mean, mode, median) Measures of dispersion (standard deviation, variance, range, etc). Working with the normal curve Last week: Sample, population and sampling
Chapter 8: Confidence Intervals
 Chapter 8: Confidence Intervals Introduction Suppose you are trying to determine the mean rent of a two-bedroom apartment in your town. You might look in the classified section of the newspaper, write
T-Test QUESTION T-TEST GROUPS = sex(1 2) /MISSING = ANALYSIS /VARIABLES = quiz1 quiz2 quiz3 quiz4 quiz5 final total /CRITERIA = CI(.95).
 /MISSING = ANALYSIS /VARIABLES = quiz1 quiz2 quiz3 quiz4 quiz5 final total /CRITERIA = CI(.95).") QUESTION 11.1 GROUPS = sex(1 2) /MISSING = ANALYSIS /VARIABLES = quiz2 quiz3 quiz4 quiz5 final total /CRITERIA = CI(.95). Group Statistics quiz2 quiz3 quiz4 quiz5 final total sex N Mean Std. Deviation
QUESTION 11.1 GROUPS = sex(1 2) /MISSING = ANALYSIS /VARIABLES = quiz2 quiz3 quiz4 quiz5 final total /CRITERIA = CI(.95). Group Statistics quiz2 quiz3 quiz4 quiz5 final total sex N Mean Std. Deviation
Sampling Distributions
 Sampling Distributions Sampling Distribution of the Mean & Hypothesis Testing Remember sampling? Sampling Part 1 of definition Selecting a subset of the population to create a sample Generally random sampling
Ch. 7. One sample hypothesis tests for µ and σ
 Ch. 7. One sample hypothesis tests for µ and σ Prof. Tesler Math 18 Winter 2019 Prof. Tesler Ch. 7: One sample hypoth. tests for µ, σ Math 18 / Winter 2019 1 / 23 Introduction Data Consider the SAT math
20 Hypothesis Testing, Part I
 20 Hypothesis Testing, Part I Bob has told Alice that the average hourly rate for a lawyer in Virginia is $200 with a standard deviation of $50, but Alice wants to test this claim. If Bob is right, she
Section 9.4. Notation. Requirements. Definition. Inferences About Two Means (Matched Pairs) Examples
 Examples") Objective Section 9.4 Inferences About Two Means (Matched Pairs) Compare of two matched-paired means using two samples from each population. Hypothesis Tests and Confidence Intervals of two dependent means
Objective Section 9.4 Inferences About Two Means (Matched Pairs) Compare of two matched-paired means using two samples from each population. Hypothesis Tests and Confidence Intervals of two dependent means
CENTRAL LIMIT THEOREM (CLT)
") CENTRAL LIMIT THEOREM (CLT) A sampling distribution is the probability distribution of the sample statistic that is formed when samples of size n are repeatedly taken from a population. If the sample statistic
CENTRAL LIMIT THEOREM (CLT) A sampling distribution is the probability distribution of the sample statistic that is formed when samples of size n are repeatedly taken from a population. If the sample statistic
T.I.H.E. IT 233 Statistics and Probability: Sem. 1: 2013 ESTIMATION AND HYPOTHESIS TESTING OF TWO POPULATIONS
 ESTIMATION AND HYPOTHESIS TESTING OF TWO POPULATIONS In our work on hypothesis testing, we used the value of a sample statistic to challenge an accepted value of a population parameter. We focused only
Confidence intervals
 Confidence intervals We now want to take what we ve learned about sampling distributions and standard errors and construct confidence intervals. What are confidence intervals? Simply an interval for which
Lecture on Null Hypothesis Testing & Temporal Correlation
 Lecture on Null Hypothesis Testing & Temporal Correlation CS 590.21 Analysis and Modeling of Brain Networks Department of Computer Science University of Crete Acknowledgement Resources used in the slides
Chapter 23. Inferences About Means. Monday, May 6, 13. Copyright 2009 Pearson Education, Inc.
 Chapter 23 Inferences About Means Sampling Distributions of Means Now that we know how to create confidence intervals and test hypotheses about proportions, we do the same for means. Just as we did before,
Chapter 23. Inference About Means
 Chapter 23 Inference About Means 1 /57 Homework p554 2, 4, 9, 10, 13, 15, 17, 33, 34 2 /57 Objective Students test null and alternate hypotheses about a population mean. 3 /57 Here We Go Again Now that
Business Statistics: Lecture 8: Introduction to Estimation & Hypothesis Testing
 Business Statistics: Lecture 8: Introduction to Estimation & Hypothesis Testing Agenda Introduction to Estimation Point estimation Interval estimation Introduction to Hypothesis Testing Concepts en terminology
The t-statistic. Student s t Test
 The t-statistic 1 Student s t Test When the population standard deviation is not known, you cannot use a z score hypothesis test Use Student s t test instead Student s t, or t test is, conceptually, very
Hypotheses and Errors
 Hypotheses and Errors Jonathan Bagley School of Mathematics, University of Manchester Jonathan Bagley, September 23, 2005 Hypotheses & Errors - p. 1/22 Overview Today we ll develop the standard framework
Probability Methods in Civil Engineering Prof. Dr. Rajib Maity Department of Civil Engineering Indian Institution of Technology, Kharagpur
 Probability Methods in Civil Engineering Prof. Dr. Rajib Maity Department of Civil Engineering Indian Institution of Technology, Kharagpur Lecture No. # 36 Sampling Distribution and Parameter Estimation
Preliminary Statistics Lecture 5: Hypothesis Testing (Outline)
") 1 School of Oriental and African Studies September 2015 Department of Economics Preliminary Statistics Lecture 5: Hypothesis Testing (Outline) Gujarati D. Basic Econometrics, Appendix A.8 Barrow M. Statistics
1 School of Oriental and African Studies September 2015 Department of Economics Preliminary Statistics Lecture 5: Hypothesis Testing (Outline) Gujarati D. Basic Econometrics, Appendix A.8 Barrow M. Statistics
AMS7: WEEK 7. CLASS 1. More on Hypothesis Testing Monday May 11th, 2015
 AMS7: WEEK 7. CLASS 1 More on Hypothesis Testing Monday May 11th, 2015 Testing a Claim about a Standard Deviation or a Variance We want to test claims about or 2 Example: Newborn babies from mothers taking
Data analysis and Geostatistics - lecture VI
 Data analysis and Geostatistics - lecture VI Statistical testing with population distributions Statistical testing - the steps 1. Define a hypothesis to test in statistics only a hypothesis rejection is
Chapter 6. Estimates and Sample Sizes
 Chapter 6 Estimates and Sample Sizes Lesson 6-1/6-, Part 1 Estimating a Population Proportion This chapter begins the beginning of inferential statistics. There are two major applications of inferential
PSY 305. Module 3. Page Title. Introduction to Hypothesis Testing Z-tests. Five steps in hypothesis testing
 Page Title PSY 305 Module 3 Introduction to Hypothesis Testing Z-tests Five steps in hypothesis testing State the research and null hypothesis Determine characteristics of comparison distribution Five
Exam 2 (KEY) July 20, 2009
 July 20, 2009") STAT 2300 Business Statistics/Summer 2009, Section 002 Exam 2 (KEY) July 20, 2009 Name: USU A#: Score: /225 Directions: This exam consists of six (6) questions, assessing material learned within Modules
STAT 2300 Business Statistics/Summer 2009, Section 002 Exam 2 (KEY) July 20, 2009 Name: USU A#: Score: /225 Directions: This exam consists of six (6) questions, assessing material learned within Modules
Process Watch: Having Confidence in Your Confidence Level
 Process Watch: Having Confidence in Your Confidence Level By Douglas G. Sutherland and David W. Price Author s Note: The Process Watch series explores key concepts about process control defect inspection
Single Sample Means. SOCY601 Alan Neustadtl
 Single Sample Means SOCY601 Alan Neustadtl The Central Limit Theorem If we have a population measured by a variable with a mean µ and a standard deviation σ, and if all possible random samples of size
Descriptive Statistics-I. Dr Mahmoud Alhussami
 Descriptive Statistics-I Dr Mahmoud Alhussami Biostatistics What is the biostatistics? A branch of applied math. that deals with collecting, organizing and interpreting data using well-defined procedures.
Applied Statistics for the Behavioral Sciences
 Applied Statistics for the Behavioral Sciences Chapter 8 One-sample designs Hypothesis testing/effect size Chapter Outline Hypothesis testing null & alternative hypotheses alpha ( ), significance level,
PhysicsAndMathsTutor.com
 1. A researcher claims that, at a river bend, the water gradually gets deeper as the distance from the inner bank increases. He measures the distance from the inner bank, b cm, and the depth of a river,
Confidence Intervals. - simply, an interval for which we have a certain confidence.
 Confidence Intervals I. What are confidence intervals? - simply, an interval for which we have a certain confidence. - for example, we are 90% certain that an interval contains the true value of something
Two Sample Problems. Two sample problems
 Two Sample Problems Two sample problems The goal of inference is to compare the responses in two groups. Each group is a sample from a different population. The responses in each group are independent
The simple linear regression model discussed in Chapter 13 was written as
 1519T_c14 03/27/2006 07:28 AM Page 614 Chapter Jose Luis Pelaez Inc/Blend Images/Getty Images, Inc./Getty Images, Inc. 14 Multiple Regression 14.1 Multiple Regression Analysis 14.2 Assumptions of the Multiple
An inferential procedure to use sample data to understand a population Procedures
 Hypothesis Test An inferential procedure to use sample data to understand a population Procedures Hypotheses, the alpha value, the critical region (z-scores), statistics, conclusion Two types of errors
Statistics for IT Managers
 Statistics for IT Managers 95-796, Fall 2012 Module 2: Hypothesis Testing and Statistical Inference (5 lectures) Reading: Statistics for Business and Economics, Ch. 5-7 Confidence intervals Given the sample
Review of Statistics 101
 Review of Statistics 101 We review some important themes from the course 1. Introduction Statistics- Set of methods for collecting/analyzing data (the art and science of learning from data). Provides methods
Slides for Data Mining by I. H. Witten and E. Frank
 Slides for Data Mining by I. H. Witten and E. Frank Predicting performance Assume the estimated error rate is 5%. How close is this to the true error rate? Depends on the amount of test data Prediction
Statistical Foundations:
 Statistical Foundations: t distributions, t-tests tests Psychology 790 Lecture #12 10/03/2006 Today sclass The t-distribution t ib ti in its full glory. Why we use it for nearly everything. Confidence
Probability and Discrete Distributions
 AMS 7L LAB #3 Fall, 2007 Objectives: Probability and Discrete Distributions 1. To explore relative frequency and the Law of Large Numbers 2. To practice the basic rules of probability 3. To work with the
Samples and Populations Confidence Intervals Hypotheses One-sided vs. two-sided Statistical Significance Error Types. Statistiek I.
 Statistiek I Sampling John Nerbonne CLCG, Rijksuniversiteit Groningen http://www.let.rug.nl/nerbonne/teach/statistiek-i/ John Nerbonne 1/41 Overview 1 Samples and Populations 2 Confidence Intervals 3 Hypotheses
5.2 Tests of Significance
 5.2 Tests of Significance Example 5.7. Diet colas use artificial sweeteners to avoid sugar. Colas with artificial sweeteners gradually lose their sweetness over time. Manufacturers therefore test new colas
WISE Regression/Correlation Interactive Lab. Introduction to the WISE Correlation/Regression Applet
 WISE Regression/Correlation Interactive Lab Introduction to the WISE Correlation/Regression Applet This tutorial focuses on the logic of regression analysis with special attention given to variance components.
Stat 529 (Winter 2011) Experimental Design for the Two-Sample Problem. Motivation: Designing a new silver coins experiment
 Experimental Design for the Two-Sample Problem. Motivation: Designing a new silver coins experiment") Stat 529 (Winter 2011) Experimental Design for the Two-Sample Problem Reading: 2.4 2.6. Motivation: Designing a new silver coins experiment Sample size calculations Margin of error for the pooled two sample
Stat 529 (Winter 2011) Experimental Design for the Two-Sample Problem Reading: 2.4 2.6. Motivation: Designing a new silver coins experiment Sample size calculations Margin of error for the pooled two sample
The Difference in Proportions Test
 Overview The Difference in Proportions Test Dr Tom Ilvento Department of Food and Resource Economics A Difference of Proportions test is based on large sample only Same strategy as for the mean We calculate
Answer keys for Assignment 10: Measurement of study variables (The correct answer is underlined in bold text)
") Answer keys for Assignment 10: Measurement of study variables (The correct answer is underlined in bold text) 1. A quick and easy indicator of dispersion is a. Arithmetic mean b. Variance c. Standard deviation
Answer keys for Assignment 10: Measurement of study variables (The correct answer is underlined in bold text) 1. A quick and easy indicator of dispersion is a. Arithmetic mean b. Variance c. Standard deviation
Analysis of 2x2 Cross-Over Designs using T-Tests
 Chapter 234 Analysis of 2x2 Cross-Over Designs using T-Tests Introduction This procedure analyzes data from a two-treatment, two-period (2x2) cross-over design. The response is assumed to be a continuous
Dealing with the assumption of independence between samples - introducing the paired design.
 Dealing with the assumption of independence between samples - introducing the paired design. a) Suppose you deliberately collect one sample and measure something. Then you collect another sample in such
ECO220Y Review and Introduction to Hypothesis Testing Readings: Chapter 12
 ECO220Y Review and Introduction to Hypothesis Testing Readings: Chapter 12 Winter 2012 Lecture 13 (Winter 2011) Estimation Lecture 13 1 / 33 Review of Main Concepts Sampling Distribution of Sample Mean
The t-test: A z-score for a sample mean tells us where in the distribution the particular mean lies
 The t-test: So Far: Sampling distribution benefit is that even if the original population is not normal, a sampling distribution based on this population will be normal (for sample size > 30). Benefit
One-Way ANOVA. Some examples of when ANOVA would be appropriate include:
 One-Way ANOVA 1. Purpose Analysis of variance (ANOVA) is used when one wishes to determine whether two or more groups (e.g., classes A, B, and C) differ on some outcome of interest (e.g., an achievement
Section 9.1 (Part 2) (pp ) Type I and Type II Errors
 (pp ) Type I and Type II Errors") Section 9.1 (Part 2) (pp. 547-551) Type I and Type II Errors Because we are basing our conclusion in a significance test on sample data, there is always a chance that our conclusions will be in error.
Section 9.1 (Part 2) (pp. 547-551) Type I and Type II Errors Because we are basing our conclusion in a significance test on sample data, there is always a chance that our conclusions will be in error.
Black White Total Observed Expected χ 2 = (f observed f expected ) 2 f expected (83 126) 2 ( )2 126
 2 f expected (83 126) 2 ( )2 126") Psychology 60 Fall 2013 Practice Final Actual Exam: This Wednesday. Good luck! Name: To view the solutions, check the link at the end of the document. This practice final should supplement your studying;
Psychology 60 Fall 2013 Practice Final Actual Exam: This Wednesday. Good luck! Name: To view the solutions, check the link at the end of the document. This practice final should supplement your studying;
Factorial Independent Samples ANOVA
 Factorial Independent Samples ANOVA Liljenquist, Zhong and Galinsky (2010) found that people were more charitable when they were in a clean smelling room than in a neutral smelling room. Based on that
One sided tests. An example of a two sided alternative is what we ve been using for our two sample tests:
 One sided tests So far all of our tests have been two sided. While this may be a bit easier to understand, this is often not the best way to do a hypothesis test. One simple thing that we can do to get
AP Statistics Ch 12 Inference for Proportions
 Ch 12.1 Inference for a Population Proportion Conditions for Inference The statistic that estimates the parameter p (population proportion) is the sample proportion p ˆ. p ˆ = Count of successes in the
Frequency table: Var2 (Spreadsheet1) Count Cumulative Percent Cumulative From To. Percent <x<=
 Count Cumulative Percent Cumulative From To. Percent <x<=") A frequency distribution is a kind of probability distribution. It gives the frequency or relative frequency at which given values have been observed among the data collected. For example, for age, Frequency
A frequency distribution is a kind of probability distribution. It gives the frequency or relative frequency at which given values have been observed among the data collected. For example, for age, Frequency
Independent Samples ANOVA
 Independent Samples ANOVA In this example students were randomly assigned to one of three mnemonics (techniques for improving memory) rehearsal (the control group; simply repeat the words), visual imagery
Chapter 2 Descriptive Statistics
 Chapter 2 Descriptive Statistics The Mean "When she told me I was average, she was just being mean". The mean is probably the most often used parameter or statistic used to describe the central tendency
79 Wyner Math Academy I Spring 2016
 79 Wyner Math Academy I Spring 2016 CHAPTER NINE: HYPOTHESIS TESTING Review May 11 Test May 17 Research requires an understanding of underlying mathematical distributions as well as of the research methods
Business Statistics. Lecture 5: Confidence Intervals
 Business Statistics Lecture 5: Confidence Intervals Goals for this Lecture Confidence intervals The t distribution 2 Welcome to Interval Estimation! Moments Mean 815.0340 Std Dev 0.8923 Std Error Mean
Hypothesis Testing. ECE 3530 Spring Antonio Paiva
 Hypothesis Testing ECE 3530 Spring 2010 Antonio Paiva What is hypothesis testing? A statistical hypothesis is an assertion or conjecture concerning one or more populations. To prove that a hypothesis is
Chapter Six: Two Independent Samples Methods 1/51
 Chapter Six: Two Independent Samples Methods 1/51 6.3 Methods Related To Differences Between Proportions 2/51 Test For A Difference Between Proportions:Introduction Suppose a sampling distribution were
*Karle Laska s Sections: There is no class tomorrow and Friday! Have a good weekend! Scores will be posted in Compass early Friday morning
 STATISTICS 100 EXAM 3 Spring 2016 PRINT NAME (Last name) (First name) *NETID CIRCLE SECTION: Laska MWF L1 Laska Tues/Thurs L2 Robin Tu Write answers in appropriate blanks. When no blanks are provided CIRCLE
CHAPTER 7. Hypothesis Testing
 CHAPTER 7 Hypothesis Testing A hypothesis is a statement about one or more populations, and usually deal with population parameters, such as means or standard deviations. A research hypothesis is a conjecture
Contrasts (in general)
") 10/1/015 6-09/749 Experimental Design for Behavioral and Social Sciences Contrasts (in general) Context: An ANOVA rejects the overall null hypothesis that all k means of some factor are not equal, i.e.,
10/1/015 6-09/749 Experimental Design for Behavioral and Social Sciences Contrasts (in general) Context: An ANOVA rejects the overall null hypothesis that all k means of some factor are not equal, i.e.,
Binary Logistic Regression
 The coefficients of the multiple regression model are estimated using sample data with k independent variables Estimated (or predicted) value of Y Estimated intercept Estimated slope coefficients Ŷ = b
Tutorial 2: Power and Sample Size for the Paired Sample t-test
 Tutorial 2: Power and Sample Size for the Paired Sample t-test Preface Power is the probability that a study will reject the null hypothesis. The estimated probability is a function of sample size, variability,
Chapter 7: Hypothesis Testing - Solutions
 Chapter 7: Hypothesis Testing - Solutions 7.1 Introduction to Hypothesis Testing The problem with applying the techniques learned in Chapter 5 is that typically, the population mean (µ) and standard deviation
Mathematical Notation Math Introduction to Applied Statistics
 Mathematical Notation Math 113 - Introduction to Applied Statistics Name : Use Word or WordPerfect to recreate the following documents. Each article is worth 10 points and should be emailed to the instructor
Hypothesis Testing in Action: t-tests
 Hypothesis Testing in Action: t-tests Mark Muldoon School of Mathematics, University of Manchester Mark Muldoon, January 30, 2007 t-testing - p. 1/31 Overview large Computing t for two : reprise Today
23. MORE HYPOTHESIS TESTING
 23. MORE HYPOTHESIS TESTING The Logic Behind Hypothesis Testing For simplicity, consider testing H 0 : µ = µ 0 against the two-sided alternative H A : µ µ 0. Even if H 0 is true (so that the expectation
Using SPSS for One Way Analysis of Variance
 Using SPSS for One Way Analysis of Variance This tutorial will show you how to use SPSS version 12 to perform a one-way, between- subjects analysis of variance and related post-hoc tests. This tutorial
Sampling Distributions: Central Limit Theorem
 Review for Exam 2 Sampling Distributions: Central Limit Theorem Conceptually, we can break up the theorem into three parts: 1. The mean (µ M ) of a population of sample means (M) is equal to the mean (µ)
Two-sample t-tests. - Independent samples - Pooled standard devation - The equal variance assumption
 Two-sample t-tests. - Independent samples - Pooled standard devation - The equal variance assumption Last time, we used the mean of one sample to test against the hypothesis that the true mean was a particular
OHSU OGI Class ECE-580-DOE :Statistical Process Control and Design of Experiments Steve Brainerd Basic Statistics Sample size?
 ECE-580-DOE :Statistical Process Control and Design of Experiments Steve Basic Statistics Sample size? Sample size determination: text section 2-4-2 Page 41 section 3-7 Page 107 Website::http://www.stat.uiowa.edu/~rlenth/Power/
10.4 Hypothesis Testing: Two Independent Samples Proportion
 10.4 Hypothesis Testing: Two Independent Samples Proportion Example 3: Smoking cigarettes has been known to cause cancer and other ailments. One politician believes that a higher tax should be imposed
A proportion is the fraction of individuals having a particular attribute. Can range from 0 to 1!
 Proportions A proportion is the fraction of individuals having a particular attribute. It is also the probability that an individual randomly sampled from the population will have that attribute Can range
We need to define some concepts that are used in experiments.
 Chapter 0 Analysis of Variance (a.k.a. Designing and Analysing Experiments) Section 0. Introduction In Chapter we mentioned some different ways in which we could get data: Surveys, Observational Studies,
ST505/S697R: Fall Homework 2 Solution.
 ST505/S69R: Fall 2012. Homework 2 Solution. 1. 1a; problem 1.22 Below is the summary information (edited) from the regression (using R output); code at end of solution as is code and output for SAS. a)
AP Statistics Cumulative AP Exam Study Guide
 AP Statistics Cumulative AP Eam Study Guide Chapters & 3 - Graphs Statistics the science of collecting, analyzing, and drawing conclusions from data. Descriptive methods of organizing and summarizing statistics
The Student s t Distribution
 The Student s t Distribution What do we do if (a) we don t know σ and (b) n is small? If the population of interest is normally distributed, we can use the Student s t-distribution in place of the standard
Multiple Comparisons
 Multiple Comparisons Error Rates, A Priori Tests, and Post-Hoc Tests Multiple Comparisons: A Rationale Multiple comparison tests function to tease apart differences between the groups within our IV when
HYPOTHESIS TESTING II TESTS ON MEANS. Sorana D. Bolboacă
 HYPOTHESIS TESTING II TESTS ON MEANS Sorana D. Bolboacă OBJECTIVES Significance value vs p value Parametric vs non parametric tests Tests on means: 1 Dec 14 2 SIGNIFICANCE LEVEL VS. p VALUE Materials and
Testing Research and Statistical Hypotheses
 Testing Research and Statistical Hypotheses Introduction In the last lab we analyzed metric artifact attributes such as thickness or width/thickness ratio. Those were continuous variables, which as you
Chapter 20 Comparing Groups
 Chapter 20 Comparing Groups Comparing Proportions Example Researchers want to test the effect of a new anti-anxiety medication. In clinical testing, 64 of 200 people taking the medicine reported symptoms
Hypothesis testing. Data to decisions
 Hypothesis testing Data to decisions The idea Null hypothesis: H 0 : the DGP/population has property P Under the null, a sample statistic has a known distribution If, under that that distribution, the
Inference with Simple Regression
 1 Introduction Inference with Simple Regression Alan B. Gelder 06E:071, The University of Iowa 1 Moving to infinite means: In this course we have seen one-mean problems, twomean problems, and problems
Purposes of Data Analysis. Variables and Samples. Parameters and Statistics. Part 1: Probability Distributions
 Part 1: Probability Distributions Purposes of Data Analysis True Distributions or Relationships in the Earths System Probability Distribution Normal Distribution Student-t Distribution Chi Square Distribution
Lab 5 for Math 17: Sampling Distributions and Applications
 Lab 5 for Math 17: Sampling Distributions and Applications Recall: The distribution formed by considering the value of a statistic for every possible sample of a given size n from the population is called