Norbert Péter Szabó Ph.D., dr. habil. associate professor Department of Geophysics, University of Miskolc
|
|
|
- Clarence Daniel
- 5 years ago
- Views:
Transcription

1 MSc in Earth Sciences Engineering Norbert Péter Szabó Ph.D., dr. habil. associate professor Department of Geophysics, University of Miskolc
2

3 Petrophysics overview Demonstration of the measuring environment Basic petrophysical relationships Principles of measurement techniques Well log analysis, evaluation of petrophysical parameters Deterministic and statistical interpretation approaches Special well-logging measurements Well-logging inversion Calculations using WellCad and MATLAB software Introduction
4 Serra O., 1984: Fundamentals of well-log interpretation, Elsevier. Asquith G., Krygowski D., 2004: Basic well log analysis, Second edition, American Association of Petroleum Geologists. Ellis D. V., Singer J. M., 2007: Well logging for earth scientists, Second edition, Springer. Rider M. H., 2002: The geological interpretation of well logs, Second Edition, Rider-French Consulting Ltd. Schlumberger, 1989: Log interpretation principles/applications. Schlumberger, 1989: Cased hole log interpretation principles/applications Introduction


5 Well site, Drilling rig, Vehicle, Cable, Sonde, Borehole, Drilling mud, Well log, Log header, Observed quantity, Measuring range, Formation boundary, Petrophysical property Introduction


 Depth (max.")
 Results of early")
6 Carottage électrique Pechelbronn oilfield, France (1927) Specific resistivity (A is current electrode, M and N are potential electrodes) Depth (max. 488 m, sampling distance of 1 m) Results of early scientific research: Introduction
 Caliper sonde with one specific resistivity rubber pad")
7 Sonde used for measuring caliper with multielectrode measuring pads on the arms Sonde used for measuring rock density includes a gamma-ray source and a gamma-ray detector Sonde used for measuring acoustic traveltime includes transmitters and receivers for detecting sonic waves Ellis and Singer (2007) Caliper sonde with one specific resistivity rubber pad Introduction
8 Geological mapping by well-to-well correlation Exploration of reserves, identification of productive zones Determination of depth and bed thickness Determination of lithology and mineral composition Determination of porosity and pore geometry Determination of water saturation and fluid type Determination of permeability Estimation of mineral resource and hydrocarbon reserves Finding correlation between petrophysical properties, trend analysis Determination of elastic parameters and in-situ stresses Aid in calculating synthetic seismograms etc. Introduction
9
 Mud filtrate - the drilling mud invades into the porous and permeable layers, shales and loose")
10 Schlumberger Caliper - the outer diameter of the drill bit (normally 7-12 inches) Drilling mud - to carry out drill cuttings, to keep the drill bit cool and lubricated, to prevent formation fluids from entering into the wellbore (mud column has higher pressure than pore pressure of the formation) Mud filtrate - the drilling mud invades into the porous and permeable layers, shales and loose formations are washed out Mud cake - the solid particles of the drilling mud (clay) accumulate on the borehole wall Measuring environment
11 Schlumberger Flushed zone - the annular space closest to the borehole, the original pore content is flushed by the mud filtrate, residual water and hydrocarbon occupy the pore space Uninvaded zone - the original pore content is not contaminated by mud filtrate Invasion depth - radial distance to which mud filtrate has invaded (invasion diameter is normalized with the hole diameter, in case of the same amount of mud and smaller porosity the invasion depth is greater, even 10 times greater than the hole diameter) Measuring environment


12 Rock matrix - the solid skeleton of the rock, which is built up from grains (minerals) and cement. In case of simple lithology, it is composed by one mineral, in complex lithology by the mixture of minerals Shale - minerals having grain sizes smaller than mm. Clay is composed by only clay minerals. Shale contains % clay with significant amount of silt and other minerals Shale has a strong effect on the measured physical quantities and reservoir parameters, they are usually treated separately from the matrix. Shale types are disperse, laminar (thin layers), structural Serra (1984) Petrophysics overview
 to the total rock volume, which does not contain the disperse shale volume (V sh ) in")
13 Total porosity is the ratio of pore volume (void space between the grains, capillary channels and bound water, cavities, fractures, isolated pores) to the total volume of the rock t V V p t 100(%) Effective porosity is the ratio of interconnected pore space (where fluid can freely flow through the rock) to the total rock volume, which does not contain the disperse shale volume (V sh ) in sediments Φ 1 V 100 e t (%) sh Petrophysics overview
 pore space ge")
14 Primary porosity is the ratio of the intergranular (and intercrystalline) pore space generated during diagenesis to the total rock volume (e.g. clastic rocks) Secondary porosity is the ratio of the pore space generated after diagenesis due to chemical or mechanical impacts (fractures, caves) to the total rock volume (e.g. metamorphic and volcanic rocks, carbonates) Φ (Φt Φ 1) 2 100(%) where t, 1, 2 are total, primary and secondary porosity, respectively Mixed porosity is the combination of primary and secondary porosity (e.g. in complex reservoirs) Petrophysics overview
15 Water saturation is the fraction of pore volume occupied by formation water Vp,w Sw 100(%) V p Irreducible water saturation is the pore space filled with water adsorbed to the clay particles and restrained in the capillaries and brackets (S w,irr ). Its value is linearly proportional to the specific surface (the smaller the grain size, the larger the specific surface) Hydrocarbon saturation is the pore space filled with oil and/or gas S hc (1 S w ) 100(%) Petrophysics overview

16 S w,irr Schlumberger The wetting phase (i.e. water) is squeezed out by the non-wetting fluid (e.g. petroleum) Capillary pressure curves show the relationship between the amount of displaced water and the applied pressure By gradually increasing the pressure, the water saturation decreases down to a limiting value (S w,irr ) Irreducible water saturation depends on the permeability of the given rock in hydrocarbon reservoirs Petrophysics overview
17 Irreducible hydrocarbon saturation is the fraction of pore volume filled with non-producible oil and/or gas (increases with viscosity) S hc, irr 1 S 100 (%) x0 Movable hydrocarbon saturation is the pore space filled with producible oil and/or gas S S hc hc,irr 1S w 1S x0 S hc,m S S hc,irr S S 100(%) The volume of hydrocarbon relative to the total volume of rock V hc /V t hc ΦS hc x0 w Petrophysics overview


18 Φ(S w,mov +S w,irr +S g,mov + S g,irr +S o,mov +S o,irr ) V t =1 Φ +V sh +V ma =1 V sh = V cl +V si V ma =ΣV ma,i +V cem Petrophysics overview
19 Electric conductivity (σ) measures the ability of a rock to conduct an electric current. Hydrocarbons, rock matrix, freshwater are insulators, while brine conducts electricity Electrical resistivity (ρ) is an intrinsic property of rocks that quantifies how strongly a rock opposes the flow of electric current ρ RA L (ohmm) and 1000 ρ (ms/m) where R(ohm) is electric resistance, A(m 2 ) is cross-sectional area, L is measured length (m), σ is electric conductivity (mmho/m) Specific resistivity of a rock depends on porosity, resistivity and amount of pore-fluids (i.e. saturation), salinity of pore-fluid, rock type, texture (grain size and shape, sorting of grains, pore geometry) σ Petrophysics overview
20 Rock/fluid State R a (ohmm) Quartz Marble Clay/Shale 2 10 Sand Brine Oil Limestone Compact 10 3 Sulfides <1.0 Graphite Oil Distilled water C, 2 kppm 3.40 Brine 15 0 C, 10 kppm C, 100 kppm C, 200 kppm 0.06 Petrophysics overview
")

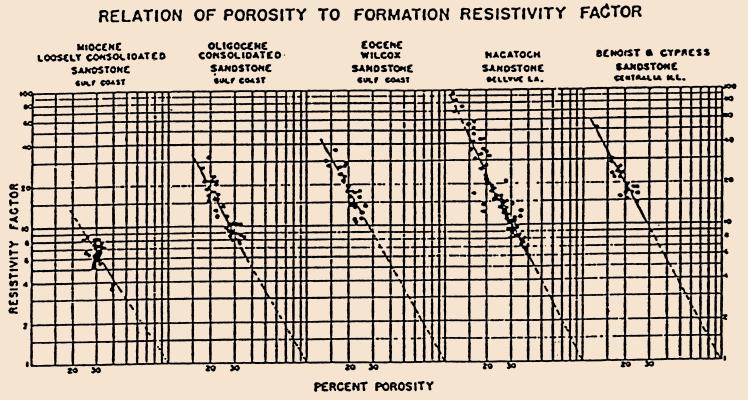
21 Archie (1950) Basic petrophysical relations
22 Water saturation of a clean (V sh =0) hydrocarbon reservoir can be determined by the application of the relationship between the resistivity of rock (R 0 ) fully saturated with water (S w =1) and the resistivity of formation water (R w ) R 0 FR w and F a Φ m S w n R R 0 t n FR R t w where F is (resistivity) formation factor, R t is true resistivity, a is tortuosity coefficient, m is cementation exponent, n is saturation exponent (a 1, m n 2) The formula cannot be applied for rock matrices containing electrically conductive mineral(s) and shaly layers In case of high R 0 and R w (e.g. freshwater reservoirs) the formula underestimates the formation factor Basic petrophysical relations
23 Darcy s law - the volume of fluid flowing through the rock per unit time (in case of one phase) Q k A μl ΔP 3 (m /s) where A (m 2 ) is cross section of flow, L (m) is flow length, μ (Ns/m 2 =Pa s) is viscosity of fluid, ΔP (N/m 2 ) is the pressure gradient responsible for the flow, k (m 2 ) is permeability Kozeny equation - the amount of fluid flowing out from the capillary per unit time (in case of small flow rate) Q 4 r π 8 ΔP μl 3 (m /s) where r(m) is radius of capillary, L(m) is length of capillary Basic petrophysical relations
24 Permeability (K) depends on the grain size and pore geometry. Kozeny equation derives (where a, b, c are site-specific constants) Timur s formula is a frequently used empirical relationship K Φ S Φ K c S 4.4 w,irr b w,irr (md 10 We speak about absolute permeability if one fluid phase is present in the pore space, effective permeability is the permeability of a given fluid phase in the presence of other phases, relative permeability is the ratio of effective and absolute permeability a -15 m 2 ) Basic petrophysical relations

25 Schlumberger With the increase of water saturation the relative permeability regarding to the oil decreases, the relative permeability for the water increases In case of the residual oil saturation the relative permeability for oil is 0, then only water can be produced from the reservoir Basic petrophysical relations
 ppm PE Photoelectric absorption index barn/e CAL Caliper inch CN Compensated neutron % CD Compensated density Porosity g/cm 3 AT Acoustic traveltime µs/ft RMLL")
26 Well Log Name Sensitive to Unit SP Spontaneous potential mv GR Natural gamma-ray intensity API K Spectral gamma-ray intensity (potassium) % U Spectral gamma-ray intensity (uranium) Lithology ppm TH Spectral gamma-ray intensity (thorium) ppm PE Photoelectric absorption index barn/e CAL Caliper inch CN Compensated neutron % CD Compensated density Porosity g/cm 3 AT Acoustic traveltime µs/ft RMLL Microlaterolog ohmm RS Shallow resistivity Saturation ohmm RD Deep resistivity ohmm Principles of measurement techniques

27 Torres-Verdín (2002) Principles of measurement techniques
28
29 + R mf >R w Ellis and Singer (2007) Spontaneous potential (SP) is the potential difference (mv) measured between a surface electrode and an electrode mounted on the sonde Diffusion potential (E d ) - ions diffuse into the more dilute solution (mud filtrate when R mf >R w ); for NaCl solution the chloride ions have higher mobility than sodium cations Membrane potential (E sh 5E d ) - shale is an ion selective membrane, which lets through only positive ions Electrochemical potential is the difference between E d and E sh Streaming potential (E mc, E sb ) is caused by the flow of mud filtrate through the mud cake (or shale) as a result of pressure difference, which is usually negligible Spontaneous potential logging
30 + R mf >R w Ellis and Singer (2007) SSP is the maximal deflection of the SP curve in a thick, clean, porous and permeable bed The theoretical value of SSP is calculated SSP k R k lg R mf (mv) C) where T f is the formation temperature w T ( f 0 Spontaneous potential logging
31 + R mf >R w Measured SP value is affected by R mf /R w ratio Layer thickness Resistivity of the layer (R t ) Resistivity of the adjacent layer Borehole caliper Invasion parameters (R x0, d i ) Clay/Shale volume Hydrocarbon content Ellis and Singer (2007) Spontaneous potential logging
32 Well-to-well correlation (made by the shape of SP curves) Detection of permeable layers Determination of the boundaries of permeable layers (at the inflexion points of the SP curves) and layer thicknesses Determination of resistivity of formation water (R w ) Estimation of shale volume in permeable layers (V sh ) Qualitative indication of the presence of hydrocarbons Logging tool only works with conductive borehole fluid It cannot be used in cased holes Spontaneous potential logging
 Shale base line Sand line Clean shale Ellis and Singer (2007) Spontaneous potential")
33 Shale bed (with two sandy intervals) Layer boundaries Sand bed (with thin shale layer at the bottom) Shale base line Sand line Clean shale Ellis and Singer (2007) Spontaneous potential logging
 where R mf,z is the measured resistivity of mud filtrate at temperature T z ( 0 F) (e.g.")
34 Mark the SPSSP maximum for a clean, water saturated, thick, porous and permeable interval Arps formula - correction of R mf for formation temperature R mf R mf,z T T z f (ohmm) where R mf,z is the measured resistivity of mud filtrate at temperature T z ( 0 F) (e.g. at the surface z=0), T f is formation temperature Calculation of equivalent and true value of R w for the given interval SSP k lg R R mf,e w,e R w,e R mf,e 10 SSP k, R mf,e 0.85R mf Reeves Technologies Spontaneous potential logging
 mz mz td f T T 0 0 where T bh is temperature at the well bottom, z td is depth of well bottom, then T f is estimated to arbitrary depths Conversion")
35 Formation temperature is required for the determination of R mf and R w In linear approximation the model is T f f where z f is formation depth, m is geothermal gradient, T 0 is surface average temperature First slope m is calculated T (z bh ) mz mz td f T T 0 0 where T bh is temperature at the well bottom, z td is depth of well bottom, then T f is estimated to arbitrary depths Conversion from Fahrenheit to Celsius degree is T( 0 F)=1.8T( 0 C)+32 Spontaneous potential logging

36 Schlumberger Spontaneous potential logging
 Spontaneous potential")
37 Pseudo Static Potential (PSP) is the maximal SP deflection in a shale contaminated permeable formation Estimation of shale volume V sh (1 α) 100(%) where α=(psp/ssp) is the SP reduction factor which can be derived from observed SP values with set of curves given in chart books Asquith and Gibson (1982) Spontaneous potential logging
38 When R mf /R w 1, no SP deflection develops (there can be some streaming potential because of the different pressures of mud filtrate and formation water) No characteristic shape of SP curves can be identified in modern hydrocarbon wells drilled with synthetic-based muds Normal SP - if R mf > R w, the permeable layer is detected by a negative value of SP (in hydrocarbon reservoirs) Reversed SP - if R mf < R w, the permeable layer is detected by a positive value of SP (in shallow aquifers) Shale base line shift - on longer intervals, it occurs because of the decrease of R w (increasing salt content) or the change in the mineral composition of shales (and the increasing temperature) SP currents avoid highly resistive formations and one obtains distorted SP curves SP suppression is caused by the presence of hydrocarbons (qualitative phenomenon, it is not suitable for the quantitative determination of hydrocarbon saturation) For the motion of ions causing SP phenomenon a minimal permeability (0.1 md) and porosity (1 2 %) are necessary, but there are no direct proportionality between SP anomaly and these petrophysical quantities Spontaneous potential logging
39
40 Physical background: radioactive decay of atoms in rocks Types of radiation are, and -radiation (emission of photons) Gamma activity of rocks depends on the type and quantity of radiating elements and rock density Energy of photon (ev) is the amount of energy gained (or lost) by the charge of a single electron moved across an electric potential difference of 1 V Gamma-ray sources in rocks are 40 K, 238 U, 232 Th Occurrence of potassium - evaporites, feldspars, clay minerals (micas), granite, rhyolite, metamorphic rocks Occurrence of uranium - uranium-oxides, uranium solutions, dark limestone, organic materials (bituminous shale, coaly marl) Occurrence of thorium - heavy minerals (monazite, zircon), clay (in bound water) Natural -ray intensity logging
 Gamma detector is a")
, carbonates GR maximum - clay, potassium-feldspar, mica, sand(stone) containing glauconite or uranium rich water Natural -ray")
41 Halliburton GR reads the natural gamma radiation of rocks in units of cps or API (American Petroleum Institute) based on an artificially radioactive concrete block at the University of Houston, that is defined to have a radioactivity of 200 (considered to be twice the radioactivity of a typical shale) Gamma detector is a scintillation counter Integral measurement - the total gamma radiation of rock is measured Spectral measurement - gamma radiation is measured in different energy windows GR minimum - sand(stone), carbonates GR maximum - clay, potassium-feldspar, mica, sand(stone) containing glauconite or uranium rich water Natural -ray intensity logging
42 GR reading in open holes is influenced by - Measuring instrument: statistical variation (rate of radioactive decay varies in time), pulling speed of the sonde, dead time, length of the detector, time constant, location of the sonde (central or eccentric), diameter of the sonde - Layer thickness - Diameter of the borehole - Density and composition of the drilling mud (e.g. bentonite mud is radioactive) GR reading in cased holes is influenced by - Diameter of the casing - Type, density and thickness of the cement sheath Natural -ray intensity logging

43 Rider (2000) Natural -ray intensity logging
44 Lithological classification (i.e. separation of shale and sand layers) Well-to-well correlation (by the shape of GR curves) Determination of layer boundaries (at the inflexion points of GR curves) and layer thicknesses Estimation of shale volume (when there is not radioactive nonclay minerals) Determination of the types of clay minerals Shale volume correction of probe response equations (for quantitative interpretation) Applicable in both open and cased holes, conductive and nonconductive (oil-based) muds and air-drillings Natural -ray intensity logging

45 Ellis and Singer (2007) Shale Sand Shale Sand Cavity Mud cake Layer boundary Shale Natural -ray intensity logging
 Dennis and Lawrence (1984) V sh 2 0.083 0.33 2 2i 3.")
46 Natural gamma-ray index i γ GR GR max GR GR min min In linear approximation Vsh i γ In nonlinear approximation (Larionov formula) Dennis and Lawrence (1984) V sh i 3.7i γ γ 1 1 tertiary older Natural -ray intensity logging
47 Ellis and Singer (2007) K-window U-window Th-window Gamma rays of all radiating elements can be detected in a given energy range I I I a a a 1 K b K b K b U c 2 3 U c U c where I 1, I 2, I 3 are the intensities measured from the K-, U-, Th-window, r represents the statistical error, a, b, c are calibration constants of the windows (determined by radiating rocks with known composition) LSQ estimation of K-, U-, Th concentrations 3 i1 r 2 i 3 1 Th r Th r Th r I i a ik biu cith i min Natural -ray intensity logging
48 Detection, identification and quantification of radioactive minerals (K [%], U [ppm], Th [ppm]) Identification of clay minerals based on K Th crossplot Determination of shale volume in sandstones containing uranium minerals, K-feldspar, mica, glauconite Evaluation of potash deposits Division of carbonate sequences based on uranium log (organic material content) Well-to-well correlation Detection of fractured zones (fractures filled with shale, organic material, uranium salt-rich thermal-water aquifers) Determination of the composition of the crystalline basement Detection of discordance-surfaces based on Th/K log Natural -ray intensity logging

49 Schlumberger Natural -ray intensity logging
 Nuclear magnetic resonance logging (effective porosity, permeability determination), expensive method Porosity logging tools")
50 Neutron porosity (neutron-neutron) log Density (gamma-gamma) log Acoustic (sonic) traveltime log Porosity estimation based on the individual use of porosity sensitive logs Simultaneous use of porosity sensitive logs for a more accurate estimation of porosity and lithology (i.e. crossplot techniques) Nuclear magnetic resonance logging (effective porosity, permeability determination), expensive method Porosity logging tools
51
52 Neutron porosity measurement employs a neutron source that emits high-energy neutrons directed towards the formation The reponse of the formation is measured in the form of either neutron or gamma radiation Neutrons according to energy are fast (>10 MeV), epithermic (0.4 ev 10 MeV), thermic (0.025 ev) The neutrons interacts with the nucleus of elements of the rock Elastic collision - the energy of the incident neutron is equal to the sum of the kinetic energy of the scattered neutron and the nucleus pushed away Fast neutrons are slowed down the most intensively by hydrogen atoms (water-filled pore space and clay), thermic neutrons are generated and captured Neutron-porosity logging

53 Centralizer Fast neutron source Near (epithermic) detector Gamma detector Far (thermic) detector Thermic diffusion Thermic neutron capture Neutron slow-down Borehole wall Drilling mud Neutron source is either a neutron generator which can be turned off or mixed chemical source assuring a permanent stream of fast neutron emission He Be C Hydrogen concentration of the formation is observed (high cps values, low rate of scattering, less hydrogen, small porosity) Measured signal and the depth of investigation is inversely proportional to the porosity, respectively Neutron intensity depends on the type of detector, energy of the incident particle, transmitter-receiver distance (length of the sonde), lithology (rock matrix composition) Compensated neutron log measures the rate of decrease of thermal neutron density by near and far receivers, which is related to porosity n γ Neutron-porosity logging
54 Hydrogen-index (HI) measures the quantity of hydrogen atoms in the given rock relative to the amount of hydrogen atoms in pure water (HI w =1) If the evaluated formation is limestone (HI ma =0), then the measured apparent (limestone) porosity is equal to the true porosity HI ΦHI f (1Φ)HI where HI is the measured hydrogen index, Hi f is the hydrogen index of the pore-filling fluid Measured data must be corrected in case of a lithology different from limestone ma Φ N HI Neutron-porosity logging
55 Rock/Fluid Hydrogen Index Pure water 1.0 Brine Gas (Low Temperature and Pressure) Gas (High Temperature and Pressure) Heavy Oil > 0.9 Light Oil Coal 0.66 Quartz, Calcite, Dolomite 0 Clay (In-Situ) Shale (In-Situ) Sandstone, Limestone Metamorphic Rocks (In-Situ) Neutron-porosity logging
56 Borehole effect - the ratio of counts measured by the near and fast detectors gives data corrected for the nominal borehole diameter Hole diameter and stand-off - their increase causes a decrease of the measured counts (hydrogen-rich mud) Salinity of mud - chlorine catches thermal neutrons Density of mud - its increase decreases the hydrogen content of the mud Mud cake thickness - its increase decreases the measured counts Calibration is made in limestone, for a different lithology further (rock matrix) correction is required Neutron-porosity logging
 Hydrogen 18 Silicon 257 Chlorine 329 Calcium 368 Neutron sondes are calibrated in limestone with known porosity In case of clean sandstone the number of thermic neutrons is higher in the same")
57 Schlumberger Rock Matrix Correction Element Number of Collisions (from 2MeV to ev) Hydrogen 18 Silicon 257 Chlorine 329 Calcium 368 Neutron sondes are calibrated in limestone with known porosity In case of clean sandstone the number of thermic neutrons is higher in the same distance from the sonde, lower porosity is measured than the true value (thus Φ N,lm =0 and Φ N,sd = 0.04) In case of clean dolomite more collisions are required to reach the thermic energy level, the number of observed thermic neutrons is smaller, one obtains higher porosity than the true one (Φ N,do =0.02) Apparent neutron porosity of nonporous gypsum (CaSO 4 +2H 2 0) or clays is high because of high crystalline water content Neutron-porosity logging
58 Hydrogens are present on the surface (bound water) and in the crystal lattice (crystalline water) of clay minerals. The neutron tool detects these hydrogens as part of the pore space, therefore the apparent neutron porosity of clayey rocks are greater than its true value Neutron porosity corrected for shale Φ (corr) N Φ N V sh HI sh where Hi sh is the hydrogen index of the shale (e.g. HI kaolinite =0.37, HI montmorillonite =0.17, HI muscovite =0.13) Neutron-porosity logging
59 Neutron absorbent elements influence the number of thermic neutrons (e.g. Cl, B, Li). The most important is the NaCl content in salty muds and formation water. These elements can occur in shales as well Hydrogen index of brine is less ( 0.92) than that of pure water (HI w =1), thus the measured neutron porosity ( N ) decreases Investigation depth of the neutron tool is in the flushed zone, the hydrogen index of the mud filtrate (HI mf ) depends on salinity HI mf ρ mf where ρ mf is density of mud filtrate, P is NaCl concentrate of mud filtrate (10-6 ppm) Detectors allow the counting of epithermal neutrons that are less sensitive to salt content 1 P Neutron-porosity logging
60 Hydrogen index of heavy oils is close to that of pore-water In case of gas and light oil: HI hc <<HI w and ρ ch << ρ w, less hydrogen, higher thermic neutron intensity is measured, derived neutron porosity is smaller than its true value In the flushed zone, mud filtrate and residual hydrocarbon occupy the pore space HI f S x0 HI mf S hc,irr HI hc S x0 HI mf (1S x0 )HI hc Hydrogen index of hydrocarbons can be calculated from density HI hc ρch 0.3, 2.2ρch, 0.3 ρch ρ 0.3 ch 0.8 Neutron-porosity logging
 2 HI 0.")
61 Φ (corr) N Φ N ΔΦ N,ex Φ N Still too small neutron porosity can be measured in gasbearing rocks after completing hydrocarbon correction Neutron tool is sensitive to hydrogen content, it can be seen in the figure that for both rock models the measured neutron porosity is N =15%, its reason is HI ma HI gas 0 Correction of neutron porosity for excavation effect (K1 is a lithological factor) 2 HI 0.4Φ 1 HI K 2Φ eff f eff f Neutron-porosity logging
62 In hydrocarbon-bearing zones, the observed (apparent) neutron porosity ( N ) can be approximated by the following probe response equation Φ N Φ eff S x0φn,mf 1 Sx0 ΦN,hc,irr VshΦN,sh Vma,iΦ N, ma,i n i1 where N,mf, N,hc,irr, N,sh, N,ma are the neutron porosities of mud filtrate, residual hydrocarbon, shale, matrix, respectively, n is the number of rock-forming mineral components Neutron response function allows the calculation of (theoretical) neutron porosity within the framework of forward problem (see inverse modeling section) Neutron-porosity logging
63 Determination of total (fluid) porosity Qualitative identification of gas-bearing zones In combination with other logs, it can be used to calculate porosity more accurately, to estimate shale volume and to identify lithology Estimation of secondary porosity ( 2 = t 1 ) together with sonic porosity log ( 2 N S ) It can be used both in open and cased boreholes, in the latter case the measured signal is influenced by the thickness of the casing, and the thickness and quality of the cement sheath In case of epithermal neutron detection, the presence of neutron absorbent elements do not influence the measurement, therefore it is more suitable for the evaluation of gas-bearing reservoirs Neutron-porosity logging
64
65 Gamma interactions are pair production (not measurable in boreholes), Compton-scattering and photoelectric absorption Rocks are exposed to gamma radiation, scattered gamma radiation is observed Photons emitted from the source interact with the electrons of elements of the rock Compton-scattering ( MeV) - the incident gamma photon pushes out the electron of the atom and it travels forward with the remained energy, the intensity of the scattered gamma radiation is detected. In case of elements with low atomic number the measure of scattering depends on electron density. The measured apparent density is equal (with a good approximation) to the bulk density of the rock Gamma-gamma logging
 where constant a depends on the energy of source, constant b depends on sourcedetector distance (length of the sonde) and detector sensitivity Sonde is pushed against the borehole wall,")
66 Source of medium energy gamma rays is used ( 60 Co or 137 Cs of 662keV) Intensity of scattered gamma radiation (I - ) is proportional to the bulk density of rocks (ρ b ) I γ ae γ bρ b Ellis and Singer (2007) where constant a depends on the energy of source, constant b depends on sourcedetector distance (length of the sonde) and detector sensitivity Sonde is pushed against the borehole wall, which maximizes the information obtained about the formation. The use of compensated tools automatically corrects for borehole effect (i.e. mud cake thickness) Penetration depth cm (flushed zone) Gamma-gamma logging
 Gamma-gamma")
67 On the spine and ribs plot, the count rates measured by the near and far detectors (beside different mud cake thickness and density) define one curve Density can be determined directly from the count rates without knowing the values of h mc and ρ mc Bulk density is defined by the crossing point of the given rib and the spine on the diagram Ferenczy and Kiss (1993) Gamma-gamma logging

68 Photoelectric effect - when applying a soft gamma source ( 241 Am of 62 kev) the incident photon interacts with the electron causing its ejection from the shell, the resulting photoelectron takes over all the energy of the photon, the incident photon is absorbed and the atom is excited, which retains to stable state by emitting characteristic gamma radiation Intensity of the characteristic gamma radiation is proportional to the atomic number Z P e Z 3.6 /10 where P e is photoelectric absorption (cross section) index, U is volumetric photoelectric absorption index (cross section: intrinsic likelihood of event) P e is sensitive to lithology (pore-fluid influences it hardly) P e measurement is excellent for fracture detection using barite mud Litho-Density tool allows the simultaneous measurement of density and P e (latter is proportional to the effective atomic number of rocks) U P ρ e e Gamma-gamma logging
69 Rock/Fluid ρ b (g/cm 3 ) P e (barn/e) U (barn/cm 3 ) Barite Calcite Dolomite Halite Hematite Pyrite Quartz Fresh Water Brine (120 kppm) Oil Gas Clean Sandstone Contaminated Sandstone Shale Anthracite Gamma-gamma logging
 U U Φ U ma t f (1 Φ )U U/(1 Φ ) Volumes of three types of mineral components can be estimated V")

70 Sonde responses (UP e ρ b ) can be used for quantitative interpretation (when U f 0 and Φ t is total porosity) U U Φ U ma t f (1 Φ )U U/(1 Φ ) Volumes of three types of mineral components can be estimated V V V ma,1 ma,1 ma,1 U ρ ma,1 ma,1 V V V ma,2 ma,2 ma,2 V ρ U ma,3 ma,2 ma,2 V 1 V t ρ t ma,3 ma,3 U ma,3 ma ma,3 ρ U ma ma Schlumberger With the P e ρ b diagram, lithology and porosity can be determined Gamma-gamma logging
71 Observed bulk density (ρ b ) depends on porosity and densities of rock matrix (ρ ma ) and pore fluids (ρ f ) including mud filtrate, water and hydrocarbon ρ b Φρ f (1 Φ)ρ ma Density-derived porosity of clean porous formations Φ D ρ ρ ma ma ρ ρ b f Porosity decreases with increasing rock density. When ρ ma ρ b, negative porosity is obtained, which allows the indication of heavy minerals Gamma-gamma logging
72 Density of shales are different (2.2ρ sh 2.65), the density of interbedded (laminar) shale is usually greater, than that of shale dispersed in the pore space. Density difference between the shale and matrix specifies the amount of shale correction Observed bulk density of shaly rocks can be approximated ρb Φ ρ V ρ (1 Φ V )ρ eff Normally dispersed clay slightly decreases the measured density (ρ ma ρ sh 0.15 g/cm 3 ) and increases the apparent porosity ρ b Φ eff Shale corrected bulk density is calculated ρ ρ f f (korr.) b sh sh (1 Φ ρ b eff V )ρ sh ma ρ eff V ma sh ρ sh ρ sh ma ma ρ sh Gamma-gamma logging
73 Density of hydrocarbons (especially gas) has lower density than formation water Observed bulk density is lower in a hydrocarbon-bearing rock than in the same rock occupied by water Apparent bulk density measured with the density tool should be corrected ρ ρ ρ Correction is applied using an approximate formula eff b hc,irr Δρb 1.07Φ S P ρ 1.23ρ a Density-derived porosity in oil-bearing intervals is higher, in gasbearing zones it is much higher, than the true porosity b mf hc Gamma-gamma logging
74 In hydrocarbon-bearing zones, the observed (apparent) bulk density ( b ) can be approximated by the following probe response equation ρ b Φ e S x0ρmf 1 Sx0ρhc Vshρsh Vma,iρ ma,i n i1 where mf, hc, sh, ma are densities of mud filtrate, residual hydrocarbon, shale and matrix, respectively, n is the number of mineral components Density response function allows the calculation of (theoretical) bulk density within the framework of forward problem (see inverse modeling section) Gamma-gamma logging
75 Estimation of porosity (best performance in oil and water reservoirs) Lithological composition is determined in combination with other porosity sensitive logs Evaluation of shaly sand(stone) formations Detection of gas-bearing zones Identification of evaporite minerals Identification of heavy minerals (ores, anhydrite) Identification of coals (low rock density) Determination of composition of rocks in a complex lithology Determination of secondary porosity together with the sonic log ( 2 D S ) Gamma-gamma logging

76 MOL Group Gas-bearing formations Well logs: SP - Spontaneous potential CAL - Caliper GR - Natural gamma-ray CNL - Compensated neutron ATL - Acoustic traveltime DEN - Density Porosity logs
77
78 t R 1 t 1 t 2 Δt t 1 t 3 t 2 t 4 t 5 t 3 t R and 2 t R 1 t R 2 t 4 t 1 t 2 t 4 t 5 Sonde is equipped with ultrasonic transmitter(s) and two or more piezoelectric receivers Transit time of acoustic (elastic) wave propagating through 1 m (or 1 ft) interval in the wall rock is measured Observed parameter is the acoustic interval time ( t) in units of μs/m unit (i.e. refracted P wave slowness) Sonic logging
 wave Shear wave - it propagates from the transmitter to formation as compressional wave, as transverse wave in the rock and back to the receiver as compressional wave Mud")
79 Ellis and Singer (2007) First arrival - longitudinal (compressional) wave, which propagates from the transmitter to the rock in the mud, than it refracts in the rock, finally returns to the receiver as compressional (pressure) wave Shear wave - it propagates from the transmitter to formation as compressional wave, as transverse wave in the rock and back to the receiver as compressional wave Mud wave - it propagates from the transmitter to the receiver directly in the mud column with the velocity corresponding the compressional wave velocity of mud (hard to differentiate in the full waveform) Stoneley wave - it is a dispersive surface wave propagating on the mud-rock surface with smaller velocity than the mud wave. Its velocity depends on frequency, hole caliper, shear wave velocity of the formation, density of mud and formation, velocity of mud wave (used for permeability estimation and detecting the location of fractures) Sonic logging


80 Baker Hughes SPWLA glossary Sonic logging
81 Rock / Fluid t p (μs/ft) Sandstone 56 Limestone 49 Dolomite 44 Clay Salt 66.7 Coal 115 Casing 57 Fresh water, Mud filtrate 189 Brine, Mud filtrate 185 Oil 230 Gas (Methane) 602 Sonic logging
 and different hole sizes, compensated")
 In case of the")


82 Ferenczy and Kiss (1993) Because of the inclined (eccentric) sonde position (inclined drilling) and different hole sizes, compensated acoustic sonde is generally used (min. 2 transmitters and 2 pairs of receivers) In case of the conventional tool (1 transmitter and 2 receivers) the observed quantity is tt 4 as t 3 t 5 Solution is the use of more transmitters with 2 receivers per transmitter (BHC sonde) Corrected acoustic interval time data is obtained by calculating the arithmetic mean of individual traveltime data Sonic logging

83 Because of the wave absorption the far receiver detects higher propagation time than the true one (e.g. in unconsolidated formations, gas reservoirs, fractured rocks) Cycle slipping - the far receiver does not detect the first arrival, a subsequent phase is detected Traveltime stretching - the far receiver detects within one period, but not at the same place, as the near receiver Spikes appear on the acoustic log Serra (1984) Sonic logging
84 Estimation of primary porosity in clastic rocks and secondary porosity ( 2 N S ) in fractured rocks (According to the Fermat principle the path taken between two points by a wave is the path that can be traversed in least time. The propagation time in fractures is maximal, therefore the wave avoids them. The acoustic measurement gives information only about primary porosity) Permeability estimation from Stoneley wave travel times In-situ determination of elastic moduli from the travel times of P and S waves Qualitative determination of reservoir fluid (e.g. based on cycle slipping) Aid for seismic interpretation (together with the density log the calculation of acoustic impedance and synthetic seismograms for improving the seismic velocity model Cement Bond Log (CBL) informs on the quality of bond of the cement to the casing and formation Variable Density Log (VDL) detects gas-bearing zones and control the cement quality Cross dipole measurements (stress direction analysis, mapping of fracture systems, estimation of permeability) Circumferential Borehole Imaging Log (CBIL) is used for borehole-wall imaging and checking the casing conditions Sonic logging
85 Acoustic traveltime is a function of formation porosity and lithology Wyllie time average equation assumes an empirical relation between porosity and acoustic travel time 1 v v f 1 Φ v ma Δt ΦΔt f (1 Φ)Δt ma where v f, t f, v ma, t ma, v sh, t sh are the velocities and acoustic interval times of the pore fluid, rock matrix and shale, respectively Sonic log-derived porosity in clean formations Φ S Δt Δt f Δt Δt ma ma Sonic logging

86 Sonic logging
87 Wyllie formula is only valid in consolidated sandstones with primary porosity and carbonates Overburden pressure causes the underlying rocks to be compacted, the velocity increases up to a limit ( 3000 m/s) In poorly consolidated (loose) rocks, until the velocity limit is not reached ( t sh >330 μs/m), the observed value of t and sonic porosity calculated from the Wyllie formula is higher than the true value Empirical correction is applied to correct Wyllie s porosity data c p C Δt 330 sh or c Φ p S Φ Φ Δt Δt S R f Δt Δt Φ Φ 1, where c p is the compaction correction factor, t sh is the acoustic travel time of shale (usually t sh > t ma ), C is a compaction coefficient of shale ( ) S D ma ma 1 c Φ Φ p S N (S w V sh 0) Sonic logging


88 Given value of compaction correction factor is uncertain, which strongly influences the calculation of porosity No need for the compaction correction if the porosity is considered as a nonlinear function of t Sonic porosity can be calculated empirically 1 Δt Φ S Φ Δt f 1 Φ Δt Δt Δt α Δt ma ma 2 where is between RHG equation gives a better estimate than the Wyllie formula on a wider range of porosity Raymer et al. (1980) Sonic logging
89 Assuming the same rock composition and porosity, the observed acoustic travel time of oil or gas saturated rocks is higher than that of water saturated rocks Hydrocarbon effect is small in consolidated and low porosity rocks; effect of residual hydrocarbons being in the flushed zone is negligible Empirical correction is used in unconsolidated rocks with high porosity (shallow invasion of mud) Φ Φ (corr) (corr) (for gas) (for oil) Travel time of hydrocarbons is given empirically in the sonic response function Δt hc (ρ hc 0.05)Δ t 0.7 Φ where t o and t g are the acoustic travel time of oil and gas, respectively S 0.9 Φ o S 0.95 ρ hc Δt g /0.9 Sonic logging
90 Necessary in shaly rocks (V sh 0), where the acoustic travel time of shales ( t sh ) is usually higher (the velocity is lower) than that of the rock matrix, thus, porosity is higher than the true one Modified Wyllie equation for consolidated formations with shale laminae S Δt ΦΔt Δt Δt Δt Δt f ma ma f (1 Φ V V sh Δt Δt sh f where Φ s,sh is the sonic porosity of shale Modified Wyllie equation for consolidate formations with dispersed shale content Δt Φ V S sh Δt f sh Δt Δt Δt Δt Δt Δt f ma ma ma ma )Δt ma V f sh Δt Δt Δt Δt Δt (1 Φ V V sh sh )Δt ma ma ma sh V sh s,sh Sonic logging
91 In hydrocarbon-bearing zones, the observed acoustic travel time ( t) can be approximated by the following probe response equation Δt x0δt mf 1 Sx0Δt hc VshΔtsh Vma,iΔt ma,i Φ S where t mf, t hc, t sh, t ma are the acoustic travel times of mud filtrate, hydrocarbon, shale, matrix, respectively, n is the number of mineral components In unconsolidated formations the compaction correction factor should also be taken into account Sonic response function allows the calculation of (theoretical) acoustic travel time within the framework of forward problem (see inverse modeling section) n i1 Sonic logging
 In impermeable rocks, the theoretical travel time of the Stoneley wave (calculated) ρmf 2 2 ΔtSt Δt s Δt mf ρb where t s is the travel time of shear wave In permeable rocks, permeability can")
92 Bala (2010) Haldorsen et al. (2006) In impermeable rocks, the theoretical travel time of the Stoneley wave (calculated) ρmf 2 2 ΔtSt Δt s Δt mf ρb where t s is the travel time of shear wave In permeable rocks, permeability can be estimated from the observed Stoneley travel time by K=f(I St,a,b), where I st = t St (meas)/ t St (calc) is the Stoneley-index, a and b are regional constants depending on lithology, porosity and formation fluid Sonic logging
 wave generated by the dipole transmitters, the particle motion of which is perpendicular to the direction of wave propagation.")
93 Baker Hughes Monopole sources cannot excite refracted shear waves in slow formations (velocity of mud is higher) Dipole sondes contain two dipole sources oriented orthogonally along the tool X and Y axes and a receiver array Flexural wave is a dispersive (guided) wave generated by the dipole transmitters, the particle motion of which is perpendicular to the direction of wave propagation. Radially asymmetric compressional wave in the borehole causes pressure increase in one direction, and pressure decrease in the opposite direction (like a wave traveling along a rope fixed at one end). In low frequency boundary case its slowness is equal to that of the shear wave Shear wave splitting - in azimuthally anisotropic rocks the shear wave splits into two orthogonally polarized flexural wave components that propagate with different velocities (i.e. fast and slow shear waves) In the crossline signal the contribution of the two shear waves depends on the directional angle of anisotropy (Θ) Sonic logging

94 Badri et al. (2000) Source of anisotropy is the spatial alignment of mineral grains, layers, fractures, faults, tectonic stress. They cause wave velocity to vary with direction Shear waves propagate faster in polarization direction parallel to fractures than perpendicular to them (see figure in case of fractures parallel to borehole wall) Steps of S wave data processing are filtering, cross correlation of full waveform trace signals, rotation, velocity analysis of in-line data, directional correction Magnitude of shear wave anisotropy is characterized by the relative difference between the travel times of fast and slow shear waves (DTSSLOW-DTSFAST)/AVGDTS Sonic logging
 Natural or drilling")
 Azimuth of the fast shear wave propagation is parallel to the direction of")
95 Baker Atlas (2001) Regional and local stress fields (horizontal and vertical or overburden stress components) Natural or drilling induced fractures (e.g. breakout is formed in the direction of minimum horizontal stress, and so increases the diameter of the borehole) Azimuth of the fast shear wave propagation is parallel to the direction of maximal horizontal stress, and that of the slow shear wave is parallel to the direction of minimal horizontal stress Design of hydraulic fracture treatments to improve oil or gas well performance Hydraulic fracture will usually penetrate the formation in a plane normal to minimum stress, or parallel to the plane of maximum stress. Any stress anisotropy (tectonic stress) will cause the fracture to be other than vertical Sonic logging
96

97 Schlumberger Combination of porosity logs
, the points corresponding the data pairs fit on characteristic lithological lines (line between the matrix and fluid points) or in their neighbourhood, the indicated values on the")
98 MOL Group Porosity (%) Sand line Dolomite line Limestone line Applicable to a more accurate estimation of porosity and identification of lithology Measured quantities are plotted in one coordinate system (crossplot), the points corresponding the data pairs fit on characteristic lithological lines (line between the matrix and fluid points) or in their neighbourhood, the indicated values on the lithological lines show the porosity value of a clean (water saturated) rock Porosity is marked by the perpendicular lines falling on the plotted point and the lithological lines corresponding to the given mineral combination N ρ b crossplot gives an estimate to porosity independent of lithology (with 2% estimation error), but regarding the lithology it provides ambiguous solution Detection of shale and gas, differentiation between dry and wet shales Combination of porosity logs

99 Schlumberger M-N plot is based on the combination of three porosity logs M, N are calculated as lithological parameters depending on lithology and independent of porosity, they are the gradients of acoustic, density and neutron density crossplots Δtf Δt M ρ ρ N Φ N,f ρ b Discrete points show the different mineral types (for salty and fresh muds), dashed lines indicate the practical range of porosity b Φ ρ f N f Combination of porosity logs

100 Apparent values of matrix parameters are plotted on the crossplot ρ Δt ma ma ρ b Φ 1 Φ N,D Δt Φ 1 Φ N,D N,S ρ N,S f Δt f Halliburton where Φ N,D and Φ N,S are porosities estimated from neutron vs. density and neutron vs. acoustic crossplots, respectively Diagram allows the estimation of mineral composition; one mineral (point), two minerals (line), three minerals (triangle) Distance of the plotted points from the tip of the triangle is inversely proportional to the quantity of the given mineral Estimation of porosity is not possible Combination of porosity logs
101
102 Halliburton Protons (hydrogen nuclei) of the pore fluid are polarized with strong stationary magnetic field then a radio frequency pulse train is generated by an antenna Time constant of the polarization process is the polarization time T 1 (for pore water ms, for oil ms and for gas ms) Between two pulses, after turning off the magnetic field, the magnetic moments of the protons precess around the direction of the original magnetic field. Because of the spatial dependence and inhomogeneity of the magnetic field the protons are not in phase, therefore the measured 2.2 khz decaying signal quickly decays A set of signals at Larmour frequency is induced in the receiver coil as the effect of radio frequency excitation (pulsing). Response of the repeated (pulsing) magnetic field is the spin-echo sequence called echo-train Initial amplitude of the envelope of the measured signal sequence is proportional to the number of protons in the formation (the measurement is sensitive to hydrogen index) NMR logging


103 Coates et al. (1999) NMR logging

104 Asquith and Krygowski (2004) Relaxation time T 2 is the time constant of the relaxation process showing exponential decay (for pore water ms, for oil ms and for gas ms) T 2 relaxation time depends on pore size and pore fluid type. When the water (or bound water) occupies a small pore space, small T 2 times are measured and vice versa Protons of the matrix and bound water of shale (and capillaries) have small T 2 times (n100 s), but free pore fluids have high T 2 times (n100 ms) Hydrocarbons stretch the distribution of T 2 values depending on hydrocarbon type, viscosity and its amount During the measurement a T 2 time constant sequence is measured at a given depth, which frequency (occurrence) distribution is displayed on a well log NMR logging
105 NMR measurement is practically lithology independent, it is sensitive only to pore fluids (at some inches of investigation depth) Determination of effective porosity and bound water saturation of water and hydrocarbon reservoirs More accurate determination of secondary porosity compared to procedures based on conventional well logs (this fact has been confirmed by core measurements) Determination of permeability of hydrocarbon reservoirs Identification of hydrocarbon type Determination of pore-size (or grain-size) distribution Determination of the quantity of moveable fluids Detection of gas based on density-porosity vs. NMR porosity crossplot NMR logging
106 Effect of rock matrix and irreducible water can be eliminated, if the measurement starts with a ms time-delay compared to the beginning of the precession, in this case, the initial amplitude of measured signal is proportional to the amount of free fluid Free Fluid Index (FFI) is the volume of fluids, which chemically or electrically are not bound to shale or matrix and move freely in the pore space Measured signal originates from the flushed zone FFI S S S 1 S x0 hc,irr In the knowledge of porosity the irreducible water saturation is calculated FFI S w, irr 1 With known porosity and irreducible water saturation the absolute permeability can be calculated by e.g. using Timur s equation w,irr w,irr NMR logging
 Initial amplitude of single echoes carries information on porosity From each T 2 relaxation time of the echo train a porosity (Φ NMR ) value can be estimated by using inverse modeling Area")
107 Coates et al. (1999) Initial amplitude of single echoes carries information on porosity From each T 2 relaxation time of the echo train a porosity (Φ NMR ) value can be estimated by using inverse modeling Area under the curve of frequency distribution of T 2 relaxation times gives an estimate to porosity (when S w =1) Based on the density distribution function, the pore-size distribution can be obtained T 2 cut-off is the value at where the bound and moveable fluids are distinguished (23 33 ms is the default value used in sands, it is usually higher in carbonates) NMR logging
108 Permeability increases with effective porosity and pore size. Conventional methods determine a matrix permeability, which underestimate the permeability of mixed porosity rocks (e.g. fractured hydrocarbon reservoirs) Coates model depends on a T 2 cutoff k NMR Φ C NMR T 2 -average model is independent on a T 2 cutoff k a NMR 4 FFI BVI 4 2 Φ T NMR 2 2 Asquith and Krygowski (2004) where T 2 is the geometric mean of T 2 values, C and a are lithology dependent constants NMR logging


109 Coates et al. (1999) NMR logging
110
 Resistivity")
111 Asquith and Gibson (1982) Resistivity logging

112 Schlumberger B is a surface electrode and A, M, N electrodes are mounted on the sonde. Electric current flows into the formation through the electrode pair A-B, voltage is measured on the electrode pair M-N, apparent resistivity R a is derived in units of ohmm Lateral sonde - distance M-N is small in comparison with distance A-0 (0 denotes the midpoint of distance M-N, the spacing of the sonde is distance A-0 Normal sonde - distance of electrode N is minimum times the distance A-M (spacing of the sonde) Resistivity logging

113 Measuring current of conventional specific resistivity sondes are led by highly conductive (high salinity) muds or low resistivity adjacent beds, thus an unfocused direct current field is formed Conventional resistivity logs do not characterize the formation, which causes problems especially in the interpretation of thin and high resistivity layers Solution is the application of logging tools evolving focused current field called laterolog sondes Ellis and Singer (2007) Resistivity logging
, the potential difference proportional to the resistivity of the rock is observed between one of the monitoring electrodes and an electrode placed at the surface.")
114 Schlumberger Focusing (guard) electrodes A 1 and A 2 force the current of the measuring electrode A 0 into the formation, the monitoring electrodes M 1 and M 1 and M 2 and M 2 are short-circuited in pairs (they are on same potential), the potential difference proportional to the resistivity of the rock is observed between one of the monitoring electrodes and an electrode placed at the surface. Focusing is possible on different scales and sondes with different investigation depths are available Dual (DLL) laterolog tool operates with two different spacings and frequency (35Hz 20kHz) simultaneously (i.e. deep and shallow penetration: LLd and LLs) Applicable in salty muds (R mf <3R w ) and formations with high R t. It cannot be applied in oil-based muds (no electric coupling between the tool and formation) and air-drillings (no invasion) Resistivity logging
.")
115 Serra (1984) Microlog is a pad type sonde pressed to the borehole wall, three electrodes with 1 1 inch distances (conventional resistivity logging) Micronormal mode (A 0 -M 2 ) measures R x0 with average penetration of 3 4 inches (invaded zone). Microinverse mode (M 1 -M 2 ) measures R mc with 1 2 inches penetration (mud cake) Positive separation of resistivity curves (R norm >R inv ) refers to the presence of mud cake and permeable formation. No separation or negative separation indicates an impermeable bed Applied primarily as a mud cake indicator, its drawback is its sensitivity to hole size, microlog should be corrected for mud cake Resistivity logging
 uses a spherical current field (by not too deep investigation depth), it is more focused than RMLL tool and")
116 Microlaterolog (RMLL) utilizes a focused current field, which provides a reliable value of R x0 in case of small and medium mud cake thicknesses, the measured signal originates primarily from the flushed zone, investigation depth is 10 cm Spherically Focused Microresistivity Log (RSFL) uses a spherical current field (by not too deep investigation depth), it is more focused than RMLL tool and less sensitive to mud cake, DLL sonde is usually equipped with it to make a measurement of R x0 Proximity log (RPL) is composed of a metal sonde pad and electrodes separated by insulating beds, electrode A 0 contacts with the borehole on a great surface for smaller power fluctuation. Tool provides accurate R x0 also at thick mud cakes; resistivity R t may influence the reading in case of small invasion depth Resistivity logging
 Corrected true resistivity of the formation (corr) R (R t t /R )R LLD Resistivity of invaded zone R x0 R t (R /R t (korr.")
117 Method assumes a step resistivity profile (R x0, R t ) Tornado diagram is used to determine R x0, R t and d i from dual laterolog (R LLD, R LLS ) and microresistivity data (e.g. R MFSL ) Corrected true resistivity of the formation (corr) R (R t t /R )R LLD Resistivity of invaded zone R x0 R t (R /R t (korr.) x0 ) LLD Schlumberger Resistivity logging
 eddy (Foucault) currents in the formation, which are proportional to the conductivity of the rock.")
118 Schlumberger High frequency (20 khz) alternating current with constant intensity is lead into the transmitter coil. EM field of the current induces high frequency (concentric with the axis of sonde) eddy (Foucault) currents in the formation, which are proportional to the conductivity of the rock. EM field of the Foucault currents induces voltage in the receiver coil, which is proportional to the electric conductivity (ms/m) of the rock Resistivity is directly plotted on the well log in units of ohmm Induction measurements are distorted by the skin-effect (i.e. measured signal and the depth of investigation decreases especially in highly conductive rocks), borehole effect, adjacent beds (smaller R t is measured especially at high R t /R s ), effect of invasion (great invasion depth and small R x0 ) Resistivity logging
119 Hunka et al. (1990) In case of multi-coil sondes the signals of receiver coils are summed up to minimize the effect of borehole, shoulder beds and invasion Array induction tool was developed to measure with several coils at different frequencies simultaneously (i.e. shallow, medium and deep penetration) Applicable in freshwater or electrically non-conductive (oil-based or air-drilling) muds (R mf >3R w ), and formations with small and medium R t Not used in salty muds and in (thin) layers with resistivity higher than 100 ohmm Resistivity logging
 and conductivity 0.")
120 Geometric factor (G) describes the portion of the measured signal by a sonde, which originates from the volume of the given geometry (assuming homogeneous medium) A cylindrically symmetric zone characterized by geometric factor G n (as a weight) and conductivity Uninvaded Zone (25% info) Invaded zone (75% info) C n contributes to the measured conductivity C a with the product G n C n. In the mud, in the invaded zone, in the uninvaded zone and in the shoulder beds equation G n =1 fulfils Geometric factor vs. invasion depth diagram gives that what portion of the observed information originates from the invaded and the uninvaded zone at the investigation depth corresponding to the diameter of the invaded zone In case of step resistivity profile the corrected resistivity Ellis and Singer (2007) 1 Gx0 1 G R R R (corr) IL x0 t x0 Resistivity logging
121 Determination of the invasion profile and true resistivity by sondes using different depths of investigation Determination of porosity Determination of water saturation Identification and separation of water and hydrocarbon reservoirs Detection of changes in grain sizes Borehole imaging based on microresistivity measurements e.g. by using Formation MicroScanner (FMS) tool Permeability estimation in shallow aquifers (Csókás method) Water prospecting involves conventional resistivity tools, while focused sondes are used in hydrocarbon exploration Resistivity logging
 Resistivity")
122 Conductive invasion R mf < R w Rider (2000) Resistivity logging

123 Ellis and Singer (2007) Resistive invasion R mf > R w Shale (R sh ) Hydrocarbon reservoir and/or porosity decrease Aquifer Shale Hydrocarbon reservoir and/or porosity decrease Resistivity logging
124 Archie s formula can be applied to the flushed zone R0 FR R FR Water saturation of clean formations in the flushed zone S x0 n w R R (aquifer) x0 (hc res.) x0 Porosity of hydrocarbon reservoirs derived from resistivity logs S x0 n a Φ m R R mf (hc res.) x0 Porosity of aquifers derived from resistivity logs (S x0 =1, a 1, mn2) Φ R R R x0 Φ mf x0 n R FR R mf mf (hc res.) x0 m a S n x0 R R mf (hc res.) x0 Resistivity logging
125 In the knowledge of R x0 exponent n=2) and R t, the Archie s formulae derive (saturation S S w x0 R R mf Empirical relation between the water saturations of invaded and uninvaded zones (α= ) S Hydrocarbon exponent α=1/5 is generally used for giving an estimate to water saturation S w R R Ratio R mf /R w can be calculated from the SP log, R x0 and R t can be estimated from Tornado charts x0 α x0 S w x0 mf / R / R / R / R t w t w 5/8 Resistivity logging

126 Gonçalvès and Rousseau-Gueutin (2008) Clay minerals have an excess negative charge, which attracts the cations from the free pore water Cations surrounded by a hydrate envelope are adsorbed on the clay particles. Further off the surface of the mineral grains a diffuse layer develops the thickness of which is inversely proportional to salinity Depending on the salt content of pore water, cations of the diffuse layer can be removed by applying an electrical field Surplus conductivity originating from the excess charge contributes to the total conductivity of rock Resistivity logging
 Term X can be approximated in different empirical ways Resistivity logging")
127 In shaly formations, the shale content should also be taken account in water saturation estimation Archie s formula should be modified by adding a term of excess conductivity of clay C t 1 R t Cw S F n Sw FR w n w C X excess Ellis and Singer (2007) Term X can be approximated in different empirical ways Resistivity logging
128 De Witte s dispersed shale model - free water and clay particles dispersed in the pore space conduct an electric current like a mixture of electrolytes 1 R t 2 Φ S a q R S q R w where porosity Φ includes the pore volume of free water, hydrocarbons, and dispersed shale, water saturation S is the fraction of intermatrix porosity occupied by formation-water and dispersed-shale mixture, q is the pore volume occupied by dispersed shale, S w =(S-q)/(1-q) is water saturation in the fraction of true effective porosity By combining the above equations, water saturation is calculated S w 1 1 q a 2 R R w t q sh 2 R R qr R sh 2R sh w sh 2R sh w Resistivity logging
129 Laminated shaly sand model - resistivities of sand and shale are connected in parallel 1 R t 1 V R sd lam V R where R sh and R sd are the resistivities of shale and clean sand laminae, respectively, V lam is the bulk volume fraction of shale Formation porosity is calculated from the resistivity of clean sand laminae R sd and its porosity sd R sd F sd R S w 2 w a Φ 2 sd R S w 2 w Φ lam sh Φ sd 1 V lam Resistivity response equation connecting R t and S w 1 R t 1- V 2 2 Φ Sw lam ar w V R lam sh S w 1- V Φ lam 2 ar w 1 R t V R lam sh Resistivity logging
130 Schlumberger s (total) shale model - a quadratic response function was developed based upon laboratory investigations and field experience, which is independent of the type and distribution of shale 1 R t ar 2 2 Φ Sw w 1 Vsh R sh where V sh is the total volume of shale, R sh is the resistivity of a near-by shale layer, the second term of the left side is the excess conductivity of shale Poupon and Leveaux (Indonesia) model - empirical equations are used for water saturation estimation both in the flushed and uninvaded zones of hydrocarbon reservoirs 1 R 1 R t x0 V V sh S w 10.5V m sh Φ S sh V 10.5Vsh n sh R sh R sh ar Φ w ar m mf w S x0 n Resistivity logging
131 Exchangeable cations in the electrochemical double layer can be displaced by other cations of the free pore water and those of adsorbed on neighboring clay particles. Cation exchange capacity (CEC) measures the quantity of cations (in units of mmole/g) that a clay mineral can accommodate on its negatively charged surface, which is often expressed in terms of its contribution per unit pore volume (Q v in mekv/cm 3 ). CEC is proportional to the specific surface area of the clay Waxman-Smith model - term XQ v, but the measurement of CEC causes inconvenience in the analysis of well logs. Dual water model - conductivity response function for insulating rock matrix C t m Φt S a n wt C we m Φt S a n wt V w C V w w V V wb wb C where C we is equivalent conductivity, V w and V wb are the bulk volumes of formation and bound water, respectively, Φ t is total porosity, S wt is total water saturation including bound and free water. Effective porosity and water saturation of clean formation Φ eff Φ t 1 S wb and wb S m Φt S a w n wt C w Swt S 1 S wb S S wb wb wt C wb C w Resistivity logging
132
 is specified by the dielectric properties of rocks Electric polarization induced by electric field E (V/m) D εe where is dielectric constant (As/Vm), D is the vector of electric induction")
133 Schlumberger EM wave propagation in high frequencies (25 MHz 1.1 GHz) is specified by the dielectric properties of rocks Electric polarization induced by electric field E (V/m) D εe where is dielectric constant (As/Vm), D is the vector of electric induction (As/m 2 ) EPT sonde measures both the propagation time of EM wave t pm (ns/m) and attenuation of that A m (db/m) between two receivers at a penetration of 3-15 cm. The former is specified by phase shift, while the latter is given by amplitude contraction Polar compounds (e.g. water) have high dielectric constants, molecules are orientated by EM wave, rock matrix and hydrocarbons being non-polar compounds have small dielectric constant, EM wave is less attenuated by them Propagation velocity of EM waves in rocks is inversely proportional to the dielectric constant Special logging techniques
134 Rock/Fluid * t p (ns/m) Sandstone Dolomite Limestone Anhydrite Gypsum Halite Shale Freshwater (25 0 C) Oil Gas *Dielectric constant relative to air Special logging techniques
135 Because of the small transmitter-receiver spacing, spherical wave approximation is used, therefore the raw attenuation data should be corrected for spherical spreading Energy loss is the greatest in highly conductive rocks (e.g. brine, shale, bound water), the (lossy) propagation time (t pm ) measured by the EPT sonde is recalculated to loss-free time (t p ) EPT response function used in clean reservoirs t p Φ t t p t 2 pm Am 3604 S x0tp,mf 1 Sx0tp,hc 1 Φt tp, ma Water saturation of the flushed zone in the knowledge of EPT times of rock constituents S x0 t p t p,ma Φt t p,ma t p,hc Φ t t t p,mf Method allows for an optimal use of porosity estimation in aquifers, the advantage of which is its insensitivity to salinity. Water and oil-bearing reservoirs can be separated more easily compared to conventional resistivity tools p,hc Special logging techniques


136 MALÅ Observed in Otaniemi, Finland (2002) Special logging techniques


137 t v dl Measurement configuration Velocity (or absorption) tomography Special logging techniques


138 CBIL sonde Acoustic amplitude and traveltime image logs Special logging techniques

139 Halliburton Caliper tool provides a continuous measurement of borehole size in the units of inch or cm Arms are used for centralization and pushing the sonde to the borehole wall. Each arm is connected to a potentiometer, which causes the resistance to change as the diameter of the borehole changes, creating a varying electrical signal that represents the changing shape of the borehole Applications are separation of permeable and impermeable beds (i.e. detection of cavern and mud cake), the thickness of mud cake h mc d d/2 where d n and d are the nominal (drill-bit) and measured diameters, respectively; detection of fractures and vugs; determination of borehole volume and amount of mud filtrate invasion; estimation of cement volume required in casing operations n Special logging techniques
140 Testing the condition of cased boreholes - CBL and VDL logs - determination of the quality of cement bound, strength and fracturing - CBIL log - analysis of the casing (indicating damage of casing, fractures), designation of places of perforations - CCL (Casing Collar Locator) log - determination of the locations of casing joints - Gamma-gamma log - check of the gravel Production well logging (PWL) methods - GR log - determination of relative depth and lithology - Time-lapse neutron-neutron and neutron-gamma measurements - studying the change in water and hydrocarbon saturation during exploitation, indication of the displacement of gas-fluid phase boundary - BATS (Borehole Audio Tracer Survey) logs - locating the gas infiltration, detection of gas flow-through (at several frequencies) - Special gamma-gamma measurement measurement of fluid density in the well - Spinner and advanced flowmeters - flow velocity, flow rate and fluid composition - Special logging tools - pressure, temperature, differential temperature (determination of geothermal gradient, determination of the place of inflow in the well, flow behind casing, location of injection in an injection well) - Resistivity measurements - conductive tools are not feasible, induction measurements can be made in plastic casing (e.g. water exploration) Special logging techniques
141
")


142 Larionov model (young rocks) Larionov model (old rocks) Inverse modelling Linear approximation based on GR index Asquith and Krygowski (2004) Szabó et al. (2013) Interpretation of well logs
143 1 DEN BARW RD BM POR SW DEN POR DENMF GR CN POR CNMF BCOR 1 SX0 BN SX0 ALFA DENMF BETA VSH GRSH DENSH VSD GRSD DENSD GRSD AT POR( SX0 ATMF (1-SX0) ATCH) VSH ATSH VSD ATSD K U TH BC VSH CNSH VSD CNSD 1 [ PORSX0 KMF DENMF VSH KSH DENSH VSD KSD DENSD] DEN 1 [ PORSX0 UMF DENMF VSH USH DENSH VSD USD DENSD] DEN 1 [ PORSX0 THMF DENMF VSH THSH DENSH VSD THSD DENSD] DEN VSH DENSH VSD DENSD Calculated well logs DEN GR CN AT K U TH RD effective density natural gamma-ray intensity neutron porosity acoustic travel time potassium uranium thorium resistivity (uninvaded zone) Petrophysical parameters POR effective porosity SX0,SW water saturation VSH shale volume VSD quartz (sand) volume Zone parameters MF - mud filtrate CH - hydrocarbon SH - shale SD - sand W - pore water BA, BM, BN - textural constants Interpretation of well logs
144 Interpretation of well logs
 parameters A set of local joint inversion procedures are solved to estimate the model parameters Slightly overdetermined")
145 Gearhart Well logs serve as input data, petrophysical parameters represent the model that should be estimated, the relation between the data and model are given by response functions applicable to predict synthetic well logs Inversion unknowns are petrophysical (reservoir) parameters A set of local joint inversion procedures are solved to estimate the model parameters Slightly overdetermined inverse problem solved by the weighted least squares method (weigh coefficients are data variances), prediction errors should be normalized because of the different magnitudes of data Layer thicknesses are normally determined manually or by cluster analysis (they are not in the local response functions) Interval inversion approach for improving overdetermination rate and estimation accuracy, estimation of layer thicknesses and zone parameters varying slowly in the processed interval Interpretation of well logs
146 Applied to solve an overdetermined inverse problem (N>M) Objective function to be minimized Weighting matrix Solution of the inverse problem ( E/ m=0) is the estimated model vector ) (m (d) T 1 (d) T (est) d W G G W G m min d d E 2 N 1 k k c k m k 2 RD 2 RS 2 U 2 K 2 GR (d) σ σ σ σ σ W Interpretation of well logs
 It leads to the weighted least squares solution of the inverse problem M 1 j j m j k (o) k (o) k (o) k (m) k (o) k k k m m g d 1 d d d d e f o")
147 Data types have different magnitudes and dimensional units Consider the normalized deviation between the k-th field and calculated data It is favorable to use normalization also in the model space Let us shorten the above expression with new symbols ( ) It leads to the weighted least squares solution of the inverse problem M 1 j j m j k (o) k (o) k (o) k (m) k (o) k k k m m g d 1 d d d d e f o M 1 j (o) j j m j k (o) k (o) j (o) k (o) k (m) k m m m g d m d d d f o m o j k (o) k (o) j ki (o) j j j (o) k (o) k (m) k k m g d m G m m x d d d y W y G WGx G min Wf f E Gx y f T T T m m m 0 Interpretation of well logs


148 MOL Group and Dept. of Geophysics UM Interpretation of well logs

149 Input well logs Result of cluster analysis Interpretation of well logs
 Evaluation of shale volume and hydraulic conductivity by factor")
150 Szabó et al. (2015) Evaluation of shale volume and hydraulic conductivity by factor analysis of hydrogeophysical well logs Interpretation of well logs
INTRODUCTION TO LOGGING TOOLS
 BY: MUHAMMAD ZAHID INTRODUCTION TO LOGGING TOOLS 1- SPONTANEOUS POTENTIAL (SP) The Spontaneous potential survey, (sp) was one of the first measurements, which was carried out, in a well bore. The SP log
Neutron Log. Introduction
 Neutron Log Introduction This summary focuses on the basic interactions between the tool s signal and measured information, that help characterize the formation. It is not intended to be a comprehensive
Basics of Geophysical Well Logs_Porosity
 1 Porosity Logs Porosity (F), can be defined as the ratio between the volume of the pores and the total rock volume. Porosity defines the formation fluid storage capabilities of the reservoir. Well logs
Passive or Spontaneous Logs (SP, GR, SPECTRA GR, CALIPER)
") Passive or Spontaneous Logs (SP, GR, SPECTRA GR, CALIPER) By Abiodun Matthew Amao Sunday, March 09, 2014 Well Logging PGE 492 1 Lecture Outline Introduction Spontaneous Potential (SP) Log Tool Physics
Passive or Spontaneous Logs (SP, GR, SPECTRA GR, CALIPER) By Abiodun Matthew Amao Sunday, March 09, 2014 Well Logging PGE 492 1 Lecture Outline Introduction Spontaneous Potential (SP) Log Tool Physics
Well Logging. Salam Al Rbeawi 2011
 Well Logging Salam Al Rbeawi 2011 Well Logging: Is a technique used for formation evaluation to determine the size of the reservoir and the amount of oil and gas in place. The following parameters can
FORMATION EVALUATION PETE 321
 FORMATION EVALUATION PETE 321 DENSITY AND NEUTRON LOGS Summer 2010 David Schechter Fluorescent Intervals in 1U Sand Sharp transition between oil saturated pay and non-pay observed by fluorescence in core
15. THE NEUTRON LOG 15.1 Introduction
 15. THE NEUTRON LOG 15.1 Introduction The neutron log is sensitive mainly to the amount of hydrogen atoms in a formation. Its main use is in the determination of the porosity of a formation. The tool operates
Well Logging Importance in Oil and Gas Exploration and Production
 Well Logging Importance in Oil and Gas Exploration and Production Dr. R. Giri Prasad 1 1 Associate Professor, Dept. of Petroleum Engineering, Aditya Engineering College, hod_pt@aec.edu.in I. INTRODUCTION
There are five main methods whereby an unstable isotope can gain stability by losing energy. These are:
 10. RADIOACTIVITY LOGGING 10.1 Introduction Radioactivity is used in several different types of logging tool. There are those that measure the natural radiation generated by the formation, such as the
LITTLE ABOUT BASIC PETROPHYSICS
 LITTLE ABOUT BASIC PETROPHYSICS Author: MUHAMMAD ZAHID M.Sc (Applied Geology) Specialization in Petrophysics University of Azad Jammu & Kashmir, Muzaffarabad. ENTER Introduction - Determination of Physical
Module for: Resistivity Theory (adapted/modified from lectures in PETE 321 (Jensen/Ayers))
)") (PETE 663 Formation Evaluation and the Analysis of Reservoir Performance (Fall 2003)) Module for: Resistivity Theory (adapted/modified from lectures in PETE 321 (Jensen/Ayers)) J. L. Jensen W.B. Ayers
(PETE 663 Formation Evaluation and the Analysis of Reservoir Performance (Fall 2003)) Module for: Resistivity Theory (adapted/modified from lectures in PETE 321 (Jensen/Ayers)) J. L. Jensen W.B. Ayers
GEOLOGICAL LOG INTERPRETATION TUTORIAL
 GEOLOGICAL LOG INTERPRETATION TUTORIAL Text and Figures by Geoff Bohling and John Doveton The following pages will familiarize you with the basics of the geological interpretation of common logs as they
INTRODUCTION TO APPLIED GEOPHYSICS
 INTRODUCTION TO APPLIED GEOPHYSICS Petroleum Geoengineering MSc 2018/19 Semester 1 COURSE COMMUNICATION FOLDER University of Miskolc Faculty of Earth Science and Engineering Institute of Geophysics and
Formation Evaluation: Logs and cores
 These powerpoint files were produced for the Earth History class at the Free University Berlin, Department of Geological Sciences The copyright for texts, graphical elements, and images lies with C. Heubeck,
Oil and Natural Gas Corporation Limited, 4th Floor GEOPIC, Dehradun , Uttarakhand
 Sedimentoical Core Samples A Case Study of Western Offshore Basin, India Ashok Soni*, Pradeep Kumar and B.S. Bisht Oil and Natural Gas Corporation Limited, 4th Floor GEOPIC, Dehradun-248195, Uttarakhand
6. THE BOREHOLE ENVIRONMENT. 6.1 Introduction. 6.2 Overburden Pressures
 6. THE BOREHOLE ENVIRONMENT 6.1 Introduction Wireline logging has a single clearly defined purpose: to give accurate and representative data on the physical properties of the rock formations and fluids
THE UNIVERSITY OF TRINIDAD & TOBAGO
 THE UNIVERSITY OF TRINIDAD & TOBAGO B. A. SC. PETROLEUM ENGINEERING ALTERNATE 2012 FINAL EXAMINATIONS Course Code and Title: Programme: DATE: DURATION: FMEV 2002 - BASIC WELL LOGGING BASc B.A.SC. Petroleum
Mechanical Properties Log Processing and Calibration. R.D. Barree
 Mechanical Properties Log Processing and Calibration R.D. Barree Logging for Mechanical Properties Acoustic logs Measure compressional and shear velocity or slowness (1/v) Can be affected by fractures,
COPYRIGHT PETROSKILLS LLC
 RESISTIVITY LOGGING AND INTERPRETATION CORE Invasion and the Borehole Environment Part 1 LEARNING OBJECTIVES By the end of this lesson, you will be able to: Explain mud filtrate invasion and describe the
Nuclear Magnetic Resonance Log
 Objective The development of the nuclear magnetic resonance (NMR) log was fueled by the desire to obtain an estimate of permeability from a continuous measurement. Previous work had relied on empirical
MUDLOGGING, CORING AND CASED HOLE LOGGING BASICS COPYRIGHT. Cased Hole Logging. By the end of this lesson, you will be able to:
 LEARNING OBJECTIVES MUDLOGGING, CORING AND CASED HOLE LOGGING BASICS Cased Hole Logging By the end of this lesson, you will be able to: Identify common Cased Hole Logs and understand why the data are needed
PETROPHYSICS WELL LOG INTERPRETATION
 PETROPHYSICS WELL LOG INTERPRETATION MS in Petroleum Geoengineering Semester 2, 2018/19 COURSE COMMUNICATION FOLDER University of Miskolc Faculty of Earth Science and Engineering Institute of Geophysics
Variety of Cementation Factor between Dolomite and Quartzite Reservoir
 Variety of Cementation Factor between Dolomite and Quartzite Reservoir Dr. Bahia M. Ben Ghawar, Dr. Khulud M. Rahuma 2 Dept. of Petroleum Engineering Tripoli University Abstract: Cementation factor is
Fundamentals Of Petroleum Engineering FORMATION EVALUATION
 Fundamentals Of Petroleum Engineering FORMATION EVALUATION Mohd Fauzi Hamid Wan Rosli Wan Sulaiman Department of Petroleum Engineering Faculty of Petroleum & Renewable Engineering Universiti Technologi
HYDROGEOPHYSICAL CHARACTERIZATION OF GROUNDWATER FORMATIONS BASED ON WELL LOGS: CASE STUDY ON CENOZOIC CLASTIC AQUIFERS IN EAST HUNGARY
 Geosciences and Engineering, Vol. 4, No. 6 (2015), pp. 45 71. HYDROGEOPHYSICAL CHARACTERIZATION OF GROUNDWATER FORMATIONS BASED ON WELL LOGS: CASE STUDY ON CENOZOIC CLASTIC AQUIFERS IN EAST HUNGARY NORBERT
GEO4270 EXERCISE 2 PROSPECT EVALUATION
 GEO4270 EXERCISE 2 PROSPECT EVALUATION GEO4270 Integrated Basin Analysis and Prospect Evaluation 1. Integrated Seismic (reflection/refraction), Gravity and Magnetics and Basin Modelling Large Scale Structures
CHAPTER II Principles and classification of well logging methods
 7 CHAPTER II Principles and classification of well logging methods 2.1 INTRODUCTION There are many different methods of well logging that can be employed for solving various problems connected with geophysical
water L v i Chapter 4 Saturation
 4. Resistivity The presence of hydrocarbons is identified by the electrical resistance of the formation. These electrical properties of rocks depend on the pore geometry and fluid distribution. That is,
An empirical method for estimation of anisotropic parameters in clastic rocks
 An empirical method for estimation of anisotropic parameters in clastic rocks YONGYI LI, Paradigm Geophysical, Calgary, Alberta, Canada Clastic sediments, particularly shale, exhibit transverse isotropic
Understanding NMR. Geoff Page Baker Hughes Region Petrophysics Advisor Baker Hughes Incorporated. All Rights Reserved.
 Understanding NMR Geoff Page Baker Hughes Region Petrophysics Advisor 1 2017 B A K E R H U G H E S I N C O R P O R A TED. A LL R I G H TS R E S E R V E D. TERMS A N D C O N D I TI O N S O F U S E : B Y
GY 402: Sedimentary Petrology
 UNIVERSITY OF SOUTH ALABAMA GY 402: Sedimentary Petrology Lecture 27: Introduction to Wireline Log Interpretations Instructor: Dr. Douglas W. Haywick Last Time Carbonate Diagenesis Diagenesis 0.5 mm PPL
SPE These in turn can be used to estimate mechanical properties.
 SPE 96112 Pressure Effects on Porosity-Log Responses Using Rock Physics Modeling: Implications on Geophysical and Engineering Models as Reservoir Pressure Decreases Michael Holmes, SPE, Digital Formation,
New Generation Permeability Logs
 P - 05 New Generation Permeability Logs RR Tiwari B&S Asset, ONGC, Mumbai, India, Email: rrtiwari@rediffmail.com Summary Permeability distribution of the rock is of utmost importance while creating a dynamic
ECS Elemental Capture Spectroscopy Sonde. Fast, accurate lithology evaluation
 ECS Elemental Capture Spectroscopy Sonde Fast, accurate lithology evaluation Applications n Identify carbonate, gypsum, and anhydrite; quartz, feldspar, and mica; pyrite, siderite, coal, and salt fractions
Acoustic Anisotropy Measurements and Interpretation in Deviated Wells
 Acoustic Anisotropy Measurements and Interpretation in Deviated Wells X. M. Tang, and D. Patterson, Houston Technology Center, Baker Atlas, Houston, Texas, USA ABSTRACT Many acoustic anisotropy measurements
Reservoir Rock Properties COPYRIGHT. Sources and Seals Porosity and Permeability. This section will cover the following learning objectives:
 Learning Objectives Reservoir Rock Properties Core Sources and Seals Porosity and Permeability This section will cover the following learning objectives: Explain why petroleum fluids are found in underground
FORMATION EVALUATION PETE 321
 FORMATION EVALUATION PETE 321 CROSSPLOTS (Porosity and Lithology) Summer 2010 TWO-MEASUREMENT POROSITY CROSSPLOTS Two measurements determine two unknowns Formations with one lithology Lithology Porosity
N121: Modern Petrophysical Well Log Interpretation
 Summary This course presents the principles and methods associated with the petrophysical interpretation of openand cased-hole wireline and LWD well logs. Open-hole topics covered include the use of log
SOLUTIONS TO END- OF-CHAPTER PROBLEMS
 SOLUTIONS TO END- OF-CHAPTER PROBLEMS for Well Logging for Earth Scientists by Darwin V. Ellis and Julian M. Singer Published by Springer, P.O. Box 17, 3300 AA Dordrecht, The Netherlands 2007 Solution
IMPROVED ESTIMATION OF MINERAL AND FLUID VOLUMETRIC CONCENTRATIONS IN THINLY-BEDDED AND INVADED FORMATIONS
 IMPROVED ESTIMATION OF MINERAL AND FLUID VOLUMETRIC CONCENTRATIONS IN THINLY-BEDDED AND INVADED FORMATIONS Zoya Heidari and Carlos Torres-Verdín, The University of Texas at Austin; William E. Preeg, Consultant
Log Interpretation Parameters Determined from Chemistry, Mineralogy and Nuclear Forward Modeling
 Log Interpretation Parameters Determined from Chemistry, Mineralogy and Nuclear Forward Modeling Michael M. Herron and Susan L. Herron Schlumberger-Doll Research Old Quarry Road, Ridgefield, CT 6877-418
Geophysics of Exploration for Water. Geoelectric methods III. edited by Peter Vass
 Geophysics of Exploration for Water Geoelectric methods III edited by Peter Vass The phenomenon of induced polarization was already noticed at the early stage of applying direct current electrical methods
Basics of Geophysical Well Logs_Lithology&Resis7vity
 1 Spontaneous Poten7al When the well bore is filled by a water based mud and in presence of an alterna7on of permeable and impermeable layers, due to electrochemical phenomena, electrical currents are
Norbert P. Szabó and Mihály Dobróka
 Society of Petroleum Engineers Norbert P. Szabó and Mihály Dobróka Department of Geophysics University of Miskolc dobroka@uni-miskolc.hu Foreword Formation Evaluation Using Well-Logging Data Petrophysical
Rock Physics of Shales and Source Rocks. Gary Mavko Professor of Geophysics Director, Stanford Rock Physics Project
 Rock Physics of Shales and Source Rocks Gary Mavko Professor of Geophysics Director, Stanford Rock Physics Project 1 First Question: What is Shale? Shale -- a rock composed of mud-sized particles, such
Site Characterization & Hydrogeophysics
 Site Characterization & Hydrogeophysics (Source: Matthew Becker, California State University) Site Characterization Definition: quantitative description of the hydraulic, geologic, and chemical properties
Neutron Detection. n interactions with matter n detection High/low energy n detectors
 Neutron Detection Example of n detection: Well logging Reservoir/Formation Evaluation Brief introduction to neutron generation Continuous sources Large accelerators Pulsed neutron generators n interactions
Petrophysics. Theory and Practice of Measuring. Properties. Reservoir Rock and Fluid Transport. Fourth Edition. Djebbar Tiab. Donaldson. Erie C.
 Petrophysics Theory and Practice of Measuring Reservoir Rock and Fluid Transport Properties Fourth Edition Djebbar Tiab Erie C. Donaldson ELSEVIER AMSTERDAM BOSTON HEIDELBERG LONDON NEW YORK OXFORD PARIS
Competing Effect of Pore Fluid and Texture -- Case Study
 Competing Effect of Pore Fluid and Texture -- Case Study Depth (m) Sw Sxo. m Poisson's Ratio.. GOC.1 5 7 8 9 P-Impedance OWC 15 GR.. RHOB.5 1 Saturation...5. 1. 1.5 Vs (km/s).. Poisson's Ratio 5 7 P-Impedance
Geoelectricity. ieso 2010
 Geoelectricity ieso 2010 1 RESISTIVITY SURVEY AT VENETO VILLA GRITTI AT THE TOWN OF TREVISO (VENETO REGION) The survey was carried out to verify the underground presence of the fondations of a rustic building.
A Review of Log-Based Techniques for Measuring Clay Volume
 A Review of Log-Based Techniques for Measuring Clay Volume Sherif Farag Schlumberger Richard Holland Lundin Rt/Ro (log scale) The Effect of Archie s m and n S n w R R o t R t a m R S w n w Rt/Ro (log scale)
Some Aspects on Well Log Interpretation of Lithological Analysis of Shaly Sand*
 TECHNICAL PAPER Some Aspects on Well Log Interpretation of Lithological Analysis of Shaly Sand* by Toshinobu Itoh** and Seiichi Hirakawa*** Summary: Geophysical well log interpretation methods have able
PETROPHYSICAL EVALUATION CORE COPYRIGHT. Resistivity, Archie, and Saturation Determination Part 1. By the end of this lesson, you will be able to:
 LEANING OBJECTIVES PETOPHYSICAL EVALUATION COE esistivity, Archie, and Saturation Determination Part 1 By the end of this lesson, you ill be able to: List to or more ays to approach ater saturation, S,
Comparison of Classical Archie s Equation with Indonesian Equation and Use of Crossplots in Formation Evaluation: - A case study
 P-310 Summary Comparison of Classical Archie s Equation and Use of Crossplots in Formation Evaluation: - A case study Nitin Sharma In petroleum Exploration and Development Formation Evaluation is done
Determination of the Laminar, Structural and Disperse Shale Volumes Using a Joint Inversion of Conventional Logs*
 Determination of the Laminar, Structural and Disperse Shale Volumes Using a Joint Inversion of Conventional Logs* Ambrosio Aquino-López 1, Aleksandr Mousatov 1, Mikhail Markov 1, and Elena Kazatchenko
Introduction to Formation Evaluation Abiodun Matthew Amao
 Introduction to Formation Evaluation By Abiodun Matthew Amao Monday, September 09, 2013 Well Logging PGE 492 1 Lecture Outline What is formation evaluation? Why do we evaluate formation? What do we evaluate?
FORMATION EVALUATION PETE 663
 FORMATION EVALUATION PETE 663 SHALY SAND EVALUATION - B Summer 2010 SHALY FORMATION ISSUES Water Saturation Obstacles with Shaly Sands Fresh formation water can cause conventional analysis to overestimate
But these are what we really measure with logs..
 The role of the petrophysicist in reservoir characterization and the analysis of reservoir performance. What do we bring to the table? What do we want to take home? Bob Cluff The Discovery Group Inc. consulting
Improved Cased-hole Formation Evaluation: The Added Value of High Definition Spectroscopy Measurement
 Improved Cased-hole Formation Evaluation: The Added Value of High Definition Spectroscopy Measurement MAGNESIUM CARBONATE MAGNESIUM CLAY TYPING ALUMINIUM IN-SITU TOC COMPLEX MINERALS Chiara Cavalleri,
Petrophysics Designed to Honour Core Duvernay & Triassic
 Petrophysics Designed to Honour Core Duvernay & Triassic Robert V. Everett Robert V. Everett Petrophysics Inc. Mike Berhane Alberta Geological Survey, AER Tristan Euzen IFP Technologies (Canada) Inc. James
3. Magnetic Methods / 62
 Contents Preface to the Second Edition / xv Excerpts from Preface to the FirstEdition / xvii Mathematical Conventions / xix 1. Introduction / 1 Reference / 5 2. Gravity Methods / 6 2. I. Introduction /
Petrophysical Data and Open Hole Logging Operations Basics COPYRIGHT. Introduction to Petrophysical Data and Open Hole Logging Operations Basics
 Learning Objectives Petrophysical Data and Open Hole Logging Operations Basics Introduction to Petrophysical Data and Open Hole Logging Operations Basics By the end of this lesson, you will be able to:
Stochastic Modeling & Petrophysical Analysis of Unconventional Shales: Spraberry-Wolfcamp Example
 Stochastic Modeling & Petrophysical Analysis of Unconventional Shales: Spraberry-Wolfcamp Example Fred Jenson and Howard Rael, Fugro-Jason Introduction Recent advances in fracture stimulation techniques
UNIT 4 SEDIMENTARY ROCKS
 UNIT 4 SEDIMENTARY ROCKS WHAT ARE SEDIMENTS Sediments are loose Earth materials (unconsolidated materials) such as sand which are transported by the action of water, wind, glacial ice and gravity. These
NEW SATURATION FUNCTION FOR TIGHT CARBONATES USING ROCK ELECTRICAL PROPERTIES AT RESERVOIR CONDITIONS
 SCA2016-055 1/6 NEW SATURATION FUNCTION FOR TIGHT CARBONATES USING ROCK ELECTRICAL PROPERTIES AT RESERVOIR CONDITIONS Oriyomi Raheem and Hadi Belhaj The Petroleum Institute, Abu Dhabi, UAE This paper was
Verification of Archie Constants Using Special Core Analysis and Resistivity Porosity Cross Plot Using Picket Plot Method
 Int'l Journal of Computing, Communications & Instrumentation Engg. (IJCCIE) Vol. 4, Issue (207) ISSN 2349-469 EISSN 2349-477 Verification of Archie Constants Using Special Core Analysis and Resistivity
Hydrogeophysics - Seismics
 Hydrogeophysics - Seismics Matthias Zillmer EOST-ULP p. 1 Table of contents SH polarized shear waves: Seismic source Case study: porosity of an aquifer Seismic velocities for porous media: The Frenkel-Biot-Gassmann
Response of a Multidetector Pulsed Neutron Porosity Tool
 Response of a Multidetector Pulsed Neutron Porosity Tool H. D. Scott, P. D. Wraight, J. L. Thornton, J-R. Olesen, R. C. Hertzog, D. C. McKeon, T. DasGupta, I. J. Albertin Schlumberger Wireline & Testing
An Integrated Petrophysical Approach for Shale Gas Reservoirs
 An Integrated Petrophysical Approach for Shale Gas Reservoirs Richard Arnold & Matt Bratovich Baker Hughes Reservoir Development Services 1 2014 B A K E R H U G H E S I N C O R P O R A TED. A LL R I G
Slimline Capabilities
 Slimline Capabilities Drilling Evaluation Better mineral logging starts with better technology. Weatherford provides a full range of high-resolution slimline logging services on a proven, lightweight,
ROCK PHYSICS DIAGNOSTICS OF NORTH SEA SANDS: LINK BETWEEN MICROSTRUCTURE AND SEISMIC PROPERTIES ABSTRACT
 ROCK PHYSICS DIAGNOSTICS OF NORTH SEA SANDS: LINK BETWEEN MICROSTRUCTURE AND SEISMIC PROPERTIES PER AVSETH, JACK DVORKIN, AND GARY MAVKO Department of Geophysics, Stanford University, CA 94305-2215, USA
ELECTRICAL RESISTIVITY TOMOGRAPHY
 NOTIO Association Clay Technological Centre C/ Río Cabriel s/n 45007 Toledo Tel.: 925 24 11 62 info@notio.es www.notio.es Page 1 / 7 SUMMARY 1. PHYSICAL FUNDAMENTALS OF THE... 3 1.1. ELECTRICAL BEHAVIOR
Theoretical and Experimental Studies of Seismoelectric Conversions in Boreholes
 COMMUNICATIONS IN COMPUTATIONAL PHYSICS Vol. 3, No. 1, pp. 109-120 Commun. Comput. Phys. January 2008 Theoretical and Experimental Studies of Seismoelectric Conversions in Boreholes Zhenya Zhu 1,, Shihong
Borehole Geophysics. Acoustic logging measurements
 Acoustic logging measurements - Review of basic physics background - Concept of P- and S-wave measurements and logging tools - Tube waves - Seismic imaging - Synthetic seismograms - Field application examples
Electrical prospecting involves detection of surface effects produced by electrical current flow in the ground.
 Electrical Surveys in Geophysics Electrical prospecting involves detection of surface effects produced by electrical current flow in the ground. Electrical resistivity method Induced polarization (IP)
HOW. HOW vehicle mounted units portable units also available. HOW, WHEN & WHY to Geophysically Log in S.I.?
 HOW, WHEN & WHY to Geophysically Log in S.I.? by Kim Beesley HOW HOW vehicle mounted units portable units also available Access to borehole Depth of borehole sump / rat -hole? 1 HOW? - subject to borehole
Log Ties Seismic to Ground Truth
 26 GEOPHYSICALCORNER Log Ties Seismic to Ground Truth The Geophysical Corner is a regular column in the EXPLORER, edited by R. Randy Ray. This month s column is the first of a two-part series titled Seismic
COPYRIGHT PETROSKILLS LLC
 RESISTIVITY LOGGING TOOLS AND INTERPRETATION CORE LEARNING OBJECTIVES The Resistivity Logging Tools By the end of this lesson, you will be able to: Explain the tool physics and applications of resistivity
Exploration / Appraisal of Shales. Petrophysics Technical Manager Unconventional Resources
 Exploration / Appraisal of Shales Rick Lewis Petrophysics Technical Manager Unconventional Resources Organic Shale Factors Controlling Gas Reservoir Quality Conventional sandstone Mineral framework Gas
MONTE CARLO MODELING OF NUCLEAR MEASUREMENTS IN VERTICAL AND HORIZONTAL WELLS IN THE PRESENCE OF MUD- FILTRATE INVASION AND SALT MIXING
 MONTE CARLO MODELING OF NUCLEAR MEASUREMENTS IN VERTICAL AND HORIZONTAL WELLS IN THE PRESENCE OF MUD- FILTRATE INVASION AND SALT MIXING Alberto Mendoza, The University of Texas at Austin, William Preeg,
Evaluation of Rock Properties from Logs Affected by Deep Invasion A Case Study
 Evaluation of Rock Properties from Logs Affected by Deep Invasion A Case Study Jahan Zeb a, Reece Murrell b a CGG Australia, 1 Ord Street, West Perth, WA 6005 Contact email: Jahan.Zeb@cgg.com b Esso Australia,
Geophysics for Environmental and Geotechnical Applications
 Geophysics for Environmental and Geotechnical Applications Dr. Katherine Grote University of Wisconsin Eau Claire Why Use Geophysics? Improve the quality of site characterization (higher resolution and
Cased Hole Logging Reading Assignment. (Last Updated 16 December 2015)
") Cased Hole Logging Reading Assignment (Last Updated 16 December 2015) NOTICE AND DISCLAIMER The information contained herein and/or these workshop/seminar proceedings (WORK) was prepared by or contributed
Cased Hole Logging Reading Assignment (Last Updated 16 December 2015) NOTICE AND DISCLAIMER The information contained herein and/or these workshop/seminar proceedings (WORK) was prepared by or contributed
Minerals and Rocks Chapter 20
 Minerals and Rocks Chapter 20 Emily and Megan Earth System Science Interconnected Rocks and minerals Interior processes Erosion and deposition Water and air Elements of Earth by weight Made of atoms Earth
RESEARCH PROPOSAL. Effects of scales and extracting methods on quantifying quality factor Q. Yi Shen
 RESEARCH PROPOSAL Effects of scales and extracting methods on quantifying quality factor Q Yi Shen 2:30 P.M., Wednesday, November 28th, 2012 Shen 2 Ph.D. Proposal ABSTRACT The attenuation values obtained
APPLIED GEOPHYSICS. MS in Petroleum Engineering. Semester 1, 2018/19 COURSE COMMUNICATION FOLDER
 APPLIED GEOPHYSICS MS in Petroleum Engineering Semester 1, 2018/19 COURSE COMMUNICATION FOLDER University of Miskolc Faculty of Earth Science and Engineering Institute of Geophysics and Geoinformatics
Sediment. Weathering: mechanical and chemical decomposition and disintegration of rock and minerals at the surface
 Sediment Some basic terminology Weathering: mechanical and chemical decomposition and disintegration of rock and minerals at the surface Erosion: removal of weathered rock and minerals from one place to
Chapter 2 Electrical Logging
 Chapter 2 Electrical Logging 2.1 The Foundation of Electrical Resistivity The resistivity of a substance is its ability to impede the flow of electrical currents. The ability of a formation to conduct
INTRODUCTION TO WELL LOGS And BAYES THEOREM
 INTRODUCTION TO WELL LOGS And BAYES THEOREM EECS 833, 7 February 006 Geoff Bohling Assistant Scientist Kansas Geological Survey geoff@kgs.ku.edu 864-093 Overheads and resources available at http://people.ku.edu/~gbohling/eecs833
Emily and Megan. Earth System Science. Elements of Earth by weight. Crust Elements, by weight. Minerals. Made of atoms Earth is mostly iron, by weight
 Emily and Megan Chapter 20 MINERALS AND ROCKS Earth System Science Interconnected Rocks and minerals Interior processes Erosion and deposition Water and air Elements of Earth by weight Made of atoms Earth
About Earth Materials
 Grotzinger Jordan Understanding Earth Sixth Edition Chapter 3: EARTH MATERIALS Minerals and Rocks 2011 by W. H. Freeman and Company About Earth Materials All Earth materials are composed of atoms bound
Rock physics and AVO applications in gas hydrate exploration
 Rock physics and AVO applications in gas hydrate exploration ABSTRACT Yong Xu*, Satinder Chopra Core Lab Reservoir Technologies Division, 301,400-3rd Ave SW, Calgary, AB, T2P 4H2 yxu@corelab.ca Summary
NOTICE CONCERNING COPYRIGHT RESTRICTIONS
 NOTICE CONCERNING COPYRIGHT RESTRICTIONS This document may contain copyrighted materials. These materials have been made available for use in research, teaching, and private study, but may not be used
INVESTIGATION ON THE EFFECT OF STRESS ON CEMENTATION FACTOR OF IRANIAN CARBONATE OIL RESERVOIR ROCKS
 SCA4-41 1/7 INVESTIGATION ON THE EFFECT OF STRESS ON CEMENTATION FACTOR OF IRANIAN CARBONATE OIL RESERVOIR ROCKS R. Behin, RIPI, NIOC This paper was prepared for presentation at the International Symposium
Course Title: Discipline: Reservoir Level: Intermediate Duration: 5 Days Instructor: JAMES J. SMOLEN, Ph.D. About the course: Audience: Agenda:
 Course Title: Cased Hole and Production Log Evaluation Discipline: Reservoir Level: Intermediate Duration: 5 Days Instructor: JAMES J. SMOLEN, Ph.D. About the course: This 5-day program is a comprehensive
IMPROVED ASSESSMENT OF IN-SITU FLUID SATURATION WITH MULTI-DIMENSIONAL NMR MEASUREMENTS AND CONVENTIONAL WELL LOGS
 IMPROVED ASSESSMENT OF IN-SITU FLUID SATURATION WITH MULTI-DIMENSIONAL NMR MEASUREMENTS AND CONVENTIONAL WELL LOGS Kanay Jerath and Carlos Torres-Verdín, The University of Texas at Austin Germán Merletti,
Technology of Production from Shale
 Technology of Production from Shale Doug Bentley, European Unconventional, Schlumberger May 29 th, 2012 Johannesburg, South Africa What are Unconventional Reservoirs Shale both Gas & Oil Coal Bed Methane
Petrophysical Charaterization of the Kwale Field Reservoir Sands (OML 60) from Wire-line Logs, Niger Delta, Nigeria. EKINE, A. S.
 from Wire-line Logs, Niger Delta, Nigeria. EKINE, A. S.") JASEM ISSN 1119-8362 All rights reserved Full-text Available Online at wwwbiolineorgbr/ja J Appl Sci Environ Manage December, 2009 Vol 13(4) 81-85 Petrophysical Charaterization of the Kwale Field Reservoir
JASEM ISSN 1119-8362 All rights reserved Full-text Available Online at wwwbiolineorgbr/ja J Appl Sci Environ Manage December, 2009 Vol 13(4) 81-85 Petrophysical Charaterization of the Kwale Field Reservoir
Electrical Methods. Resistivity Surveying
 Electrical Methods Resistivity Surveying Geologic Resistivity 1101 Resistivity surveying investigates variations of electrical resistance, by causing an electrical current to flow through the subsurface
GRAIN SORTING, POROSITY, AND ELASTICITY. Jack Dvorkin and Mario A. Gutierrez Geophysics Department, Stanford University ABSTRACT
 GRAIN SORTING, POROSITY, AND ELASTICITY Jack Dvorkin and Mario A. Gutierrez Geophysics Department, Stanford University July 24, 2001 ABSTRACT Grain size distribution (sorting) is determined by deposition.