Topic-1 Describing Data with Numerical Measures
|
|
|
- Georgia Gilbert
- 5 years ago
- Views:
Transcription

1 Topic-1 Describing Data with Numerical Measures
2 Central Tendency (Center) and Dispersion (Variability) Central tendency: measures of the degree to which scores are clustered around the mean of a distribution Dispersion: measures the fluctuations (variability) around the characteristics of central tendency
3 Measures of Center A measure along the horizontal axis of the data distribution that locates the center of the distribution.
4 Arithmetic Mean or Average The mean of a set of measurements is the sum of the measurements divided by the total number of measurements. x n å i 1 n x i where n number of measurements å x i sum of all the measurements
5 Example The set:, 9, 1, 5, 6 å x x i 6. 6 n 5 5 If we were able to enumerate the whole population, the population mean would be called m (the Greek letter mu ).
6 Median The median of a set of measurements is the middle measurement when the measurements are ranked from smallest to largest. The position of the median is 0.5(n + 1) once the measurements have been ordered.
7 Example The set :, 4, 9, 8, 6, 5, 3 n 7 Sort :, 3, 4, 5, 6, 8, 9 Position:.5(n + 1).5(7 + 1) 4 th Median 4 th largest measurement The set:, 4, 9, 8, 6, 5 n 6 Sort:, 4, 5, 6, 8, 9 Position:.5(n + 1).5(6 + 1) 3.5 th Median (5 + 6)/ 5.5 average of the 3 rd and 4 th measurements
8 Mode The mode is the measurement which occurs most frequently. The set:, 4, 9, 8, 8, 5, 3 The mode is 8, which occurs twice The set:,, 9, 8, 8, 5, 3 There are two modes 8 and (bimodal) The set:, 4, 9, 8, 5, 3 There is no mode (each value is unique).
9 Example The number of quarts of milk purchased by 5 households: Mean? x å x n Median? i m Mode? (Highest peak) mode Relative frequency 10/5 8/5 6/5 4/5 / Quarts 3 4 5

10 Extreme Values The mean is more easily affected by extremely large or small values than the median. The median is often used as a measure of center when the distribution is skewed.
11 Extreme Values Symmetric: Mean Median Skewed right: Mean > Median Skewed left: Mean < Median
12 Measures of Variability A measure along the horizontal axis of the data distribution that describes the spread of the distribution from the center. Range üdifference between maximum and minimum values Interquartile Range üdifference between third and first quartile (Q 3 -Q 1 ) Variance üaverage * of the squared deviations from the mean Standard Deviation üsquare root of the variance Definitions of population variance and sample variance differ slightly.
13 The Range The range, R, of a set of n measurements is the difference between the largest and smallest measurements. Example: A botanist records the number of petals on 5 flowers: 5, 1, 6, 8, 14 The range is R Quick and easy, but only uses of the 5 measurements.
14 Percentile 50 th Percentile 5 th Percentile 75 th Percentile º Median (Q ) º Lower Quartile (Q 1 ) º Upper Quartile (Q 3 ) Interquartile Range: IQRQ 3 Q 1
15 The position of p-th percentile is 0.p(n + 1) The position of Q 1 is The position of Q 3 is 0.5(n + 1) 0.75(n + 1) once the measurements have been ordered. If the positions are not integers, find the quartiles by interpolation.
16 Example The prices ($) of 18 brands of walking shoes: Position of Q 1 0.5(18 + 1) 4.75 Position of Q (18 + 1) 14.5 üq 1 is 3/4 of the way between the 4 th and 5 th ordered measurements, or Q (65-65) 65.
17 Example The prices ($) of 18 brands of walking shoes: Position of Q 1 0.5(18 + 1) 4.75 Position of Q (18 + 1) 14.5 üq 3 is 1/4 of the way between the 14 th and 15 th ordered measurements, or Q (75-74) 74.5 üand IQR Q 3 Q
18 90-th percentile P 90 The position of 90-th percentile is 0.9(18 + 1)17.1 The prices ($) of 18 brands of walking shoes: P (95-90) 90.5
19 The Variance The variance is measure of variability that uses all the measurements. It measures the average deviation of the measurements about their mean. Flower petals: 5, 1, 6, 8, x 9 5 x
20 The Variance The variance of a population of N measurements is the average of the squared deviations of the measurements about their mean m. s å ( - m N x i ) The variance of a sample of n measurements is the sum of the squared deviations of the measurements about their mean, divided by (n 1). s å ( x i - x ) n - 1
21 The Standard Deviation In calculating the variance, we squared all of the deviations, and in doing so changed the scale of the measurements. To return this measure of variability to the original units of measure, we calculate the standard deviation, the positive square root of the variance. Population standard deviation : s s Sample standard deviation : s s
22 Two Ways to Calculate the Sample Variance Use the Definition Formula: xi x i Sum x ( x - x) i s s s å( xi n x)
23 Two Ways to Calculate the Sample Variance Use the calculation formula: x i x i Sum s s ( å xi ) å xi - n n s
24 Using Measures of Center and Spread: The Empirical Rule Given a distribution of measurements that is approximately mound-shaped: üthe interval m ±scontains approximately 68% of the measurements. üthe interval m ± s contains approximately 95% of the measurements. üthe interval m ± 3s contains approximately 99.7% of the measurements.


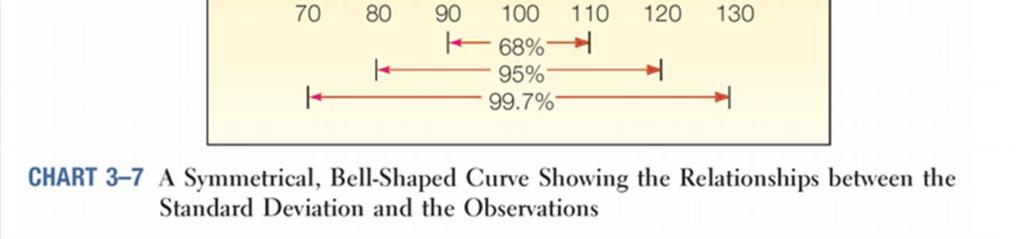
25 The Empirical Rule: An Example
26 Approximating s From Chebysheff s Theorem and the Empirical Rule, we know that R» 4-6 s To approximate the standard deviation of a set of measurements, we can use: s» R / 4 or s» R / 6 for a large dataset.
27 Approximating s The ages of 50 tenured faculty at a state university R s» R / 4 44/ 4 11 Actual s 10.73
28 Measures of Relative Standing Where does one particular measurement stand in relation to the other measurements in the data set? How many standard deviations away from the mean does the measurement lie? This is measured by the z-score. z - score x - s x Suppose s. s 4 s s x 5 x 9 x 9 lies z std dev from the mean.
29 z-scores z-scores between and are not unusual. z-scores should not be more than 3 in absolute value. z-scores larger than 3 in absolute value would indicate a possible outlier. Outlier Not unusual Outlier z Somewhat unusual
30 Constructing a Box Plot (Refer Lecture -1) ücalculate Q 1, the median (Q ), Q 3 and IQR. üdraw a horizontal line to represent the scale of measurement. üdraw a box using Q 1, the median, Q 3. Q 1 m Q 3
31 Constructing a Box Plot cont. üisolate outliers by calculating ülower fence: Q IQR üupper fence: Q IQR ümeasurements beyond the upper or lower fence is are outliers and are marked (*). * LF Q 1 m Q 3 UF
32 Example Amt of sodium in 8 brands of cheese: Q m 35 Q m Q 1 Q 3
33 Example IQR Lower fence (47.5) 1.5 Upper fence (47.5) Outlier: x 50 * m LF Q 1 Q 3 UF
34 Grouped and Ungrouped Data
35 Sample Mean Ungrouped data: x n x x + x + i å 1 1 K n n i + x n n number of observation Grouped data: x k å * fi xi k i 1 1 æ çå n n è i 1 f i x * i ö ø n sum of the frequencies k number class f i frequency of each class * x i midpoint of each class
36 Example: - ungrouped data Resistance of 5 coils: 3.35, 3.37, 3.8, 3.34, 3.30 ohm. The average: x n åxi i n 5
37 Example: - grouped data Frequency Distributions of the life of 30 tires in 1000 km * Boundaries Midpoint Frequency, f i i x * k Total n 30 i i å i 1 f i x i x k å fix i 1 f n 11, * i
38 Sample Variance Ungrouped data: 1 1 ) ( ø ö ç è æ å å å n n x x n x x s n i i n i i n i i Grouped data: 1) ( ) ( 1 1 * * - ø ö ç è æ - å å n n x f x f s k i k i i i i i
39 Example- ungrouped data Sample: Moisture content (%) of kraft paper are: 6.7, 6.0, 6.4, 6.4, 5.9, and 5.8. s (31.6) - (37.) (6-1) Sample standard deviation, s 0.35 %
40 Calculating the Sample Standard Deviation - Grouped Data Standard deviation for a grouped sample: Table: Car speeds in km/h Boundaries * xi fi * f i x i * f i x i s k * ( f ixi i 1 å k æ ) - çå fix è i 1 ( n -1) (90,74) - (9354) 96 Total s 9. 9 (96-1) * i ö ø n
41 Mode Grouped Data For grouped data, class mode (or, modal class) is the class with the highest frequency. Where: d d l Mode L + d 1 d + 1 L Lower boundary of the modal class frequency of modal class frequency of the pre modal class 1 d frequency of modal class frequency of the post modal class length of the modal class l
42 Example of Grouped Data (Mode) Based on the grouped data below, find the mode Class Limit Boundaries f Cum Freq Cum Rel Freq Modal Class (third) L l 10 d d Mode 1 L + l d d + d
43 Percentile (Ungrouped Data) The p-th percentile class from the frequency table: k (n x p)/100 where n total frequency and p is the p-th percentile Find the p-th class in which the value of k lies in the corresponding cumulative frequency group.
44 Percentile (Grouped Data) Sp LBCp + k - CFB f p l k n p 100 n number of observations LBCp Lower Boundary of the percentile class CFB Cumulative frequency of the class before Cp l Class width fp Frequency of percentile class
45 Example- Percentile for grouped data Using the previous table of freq, find the median and 80 th percentile? Class Limit Boundaries f Cum Freq Cum Rel Freq
46 Median, S50 k C 50 LBC p (119 18) (3 rd class) CFB 13 l f p S 50 æ 0-13 ö ç 10 è 13 ø th percentile, S80 k C 80 LBC p S (19 138) (4 rd class) 18.5 CFB 6 l 10 8 f p æ 3-6 ö ç 10 è 8 ø 136
47 Coefficient of Variation(CV) When comparing between data sets with different units or widely different means, one should use the coefficient of variation for comparison instead of the standard deviation. The Coefficient of Variation can be written as CV s x We express CV as a percentage by multiplying 100 Less than 30% consider good
Describing Data with Numerical Measures
 10.08.009 Describing Data with Numerical Measures 10.08.009 1 Graphical methods may not always be sufficient for describing data. Numerical measures can be created for both populations and samples. A parameter
Unit 2. Describing Data: Numerical
 Unit 2 Describing Data: Numerical Describing Data Numerically Describing Data Numerically Central Tendency Arithmetic Mean Median Mode Variation Range Interquartile Range Variance Standard Deviation Coefficient
Lecture 2 and Lecture 3
 Lecture 2 and Lecture 3 1 Lecture 2 and Lecture 3 We can describe distributions using 3 characteristics: shape, center and spread. These characteristics have been discussed since the foundation of statistics.
2011 Pearson Education, Inc
 Statistics for Business and Economics Chapter 2 Methods for Describing Sets of Data Summary of Central Tendency Measures Measure Formula Description Mean x i / n Balance Point Median ( n +1) Middle Value
MgtOp 215 Chapter 3 Dr. Ahn
 MgtOp 215 Chapter 3 Dr. Ahn Measures of central tendency (center, location): measures the middle point of a distribution or data; these include mean and median. Measures of dispersion (variability, spread):
Lecture Slides. Elementary Statistics Tenth Edition. by Mario F. Triola. and the Triola Statistics Series. Slide 1
 Lecture Slides Elementary Statistics Tenth Edition and the Triola Statistics Series by Mario F. Triola Slide 1 Chapter 3 Statistics for Describing, Exploring, and Comparing Data 3-1 Overview 3-2 Measures
3 Lecture 3 Notes: Measures of Variation. The Boxplot. Definition of Probability
 3 Lecture 3 Notes: Measures of Variation. The Boxplot. Definition of Probability 3.1 Week 1 Review Creativity is more than just being different. Anybody can plan weird; that s easy. What s hard is to be
3.1 Measures of Central Tendency: Mode, Median and Mean. Average a single number that is used to describe the entire sample or population
 . Measures of Central Tendency: Mode, Median and Mean Average a single number that is used to describe the entire sample or population. Mode a. Easiest to compute, but not too stable i. Changing just one
DEPARTMENT OF QUANTITATIVE METHODS & INFORMATION SYSTEMS QM 120. Spring 2008
 DEPARTMENT OF QUANTITATIVE METHODS & INFORMATION SYSTEMS Introduction to Business Statistics QM 120 Chapter 3 Spring 2008 Measures of central tendency for ungrouped data 2 Graphs are very helpful to describe
Measures of Central Tendency
 Measures of Central Tendency Summary Measures Summary Measures Central Tendency Mean Median Mode Quartile Range Variance Variation Coefficient of Variation Standard Deviation Measures of Central Tendency
MATH 117 Statistical Methods for Management I Chapter Three
 Jubail University College MATH 117 Statistical Methods for Management I Chapter Three This chapter covers the following topics: I. Measures of Center Tendency. 1. Mean for Ungrouped Data (Raw Data) 2.
Chapter 4. Displaying and Summarizing. Quantitative Data
 STAT 141 Introduction to Statistics Chapter 4 Displaying and Summarizing Quantitative Data Bin Zou (bzou@ualberta.ca) STAT 141 University of Alberta Winter 2015 1 / 31 4.1 Histograms 1 We divide the range
Chapter 3. Data Description
 Chapter 3. Data Description Graphical Methods Pie chart It is used to display the percentage of the total number of measurements falling into each of the categories of the variable by partition a circle.
ADMS2320.com. We Make Stats Easy. Chapter 4. ADMS2320.com Tutorials Past Tests. Tutorial Length 1 Hour 45 Minutes
 We Make Stats Easy. Chapter 4 Tutorial Length 1 Hour 45 Minutes Tutorials Past Tests Chapter 4 Page 1 Chapter 4 Note The following topics will be covered in this chapter: Measures of central location Measures
Statistics for Managers using Microsoft Excel 6 th Edition
 Statistics for Managers using Microsoft Excel 6 th Edition Chapter 3 Numerical Descriptive Measures 3-1 Learning Objectives In this chapter, you learn: To describe the properties of central tendency, variation,
After completing this chapter, you should be able to:
 Chapter 2 Descriptive Statistics Chapter Goals After completing this chapter, you should be able to: Compute and interpret the mean, median, and mode for a set of data Find the range, variance, standard
Math 14 Lecture Notes Ch Percentile
 .3 Measures of the Location of the Data Percentile g A measure of position, the percentile, p, is an integer (1 p 99) such that the p th percentile is the position of a data value where p% of the data
Unit Two Descriptive Biostatistics. Dr Mahmoud Alhussami
 Unit Two Descriptive Biostatistics Dr Mahmoud Alhussami Descriptive Biostatistics The best way to work with data is to summarize and organize them. Numbers that have not been summarized and organized are
Perhaps the most important measure of location is the mean (average). Sample mean: where n = sample size. Arrange the values from smallest to largest:
. Sample mean: where n = sample size. Arrange the values from smallest to largest:") 1 Chapter 3 - Descriptive stats: Numerical measures 3.1 Measures of Location Mean Perhaps the most important measure of location is the mean (average). Sample mean: where n = sample size Example: The number
1 Chapter 3 - Descriptive stats: Numerical measures 3.1 Measures of Location Mean Perhaps the most important measure of location is the mean (average). Sample mean: where n = sample size Example: The number
Descriptive Statistics-I. Dr Mahmoud Alhussami
 Descriptive Statistics-I Dr Mahmoud Alhussami Biostatistics What is the biostatistics? A branch of applied math. that deals with collecting, organizing and interpreting data using well-defined procedures.
Lecture 11. Data Description Estimation
 Lecture 11 Data Description Estimation Measures of Central Tendency (continued, see last lecture) Sample mean, population mean Sample mean for frequency distributions The median The mode The midrange 3-22
Unit 2: Numerical Descriptive Measures
 Unit 2: Numerical Descriptive Measures Summation Notation Measures of Central Tendency Measures of Dispersion Chebyshev's Rule Empirical Rule Measures of Relative Standing Box Plots z scores Jan 28 10:48
Lecture 2. Descriptive Statistics: Measures of Center
 Lecture 2. Descriptive Statistics: Measures of Center Descriptive Statistics summarize or describe the important characteristics of a known set of data Inferential Statistics use sample data to make inferences
Section 3. Measures of Variation
 Section 3 Measures of Variation Range Range = (maximum value) (minimum value) It is very sensitive to extreme values; therefore not as useful as other measures of variation. Sample Standard Deviation The
additionalmathematicsstatisticsadditi onalmathematicsstatisticsadditionalm athematicsstatisticsadditionalmathem aticsstatisticsadditionalmathematicsst
 additionalmathematicsstatisticsadditi onalmathematicsstatisticsadditionalm athematicsstatisticsadditionalmathem aticsstatisticsadditionalmathematicsst STATISTICS atisticsadditionalmathematicsstatistic
Determining the Spread of a Distribution Variance & Standard Deviation
 Determining the Spread of a Distribution Variance & Standard Deviation 1.3 Cathy Poliak, Ph.D. cathy@math.uh.edu Department of Mathematics University of Houston Lecture 3 Lecture 3 1 / 32 Outline 1 Describing
Last Lecture. Distinguish Populations from Samples. Knowing different Sampling Techniques. Distinguish Parameters from Statistics
 Last Lecture Distinguish Populations from Samples Importance of identifying a population and well chosen sample Knowing different Sampling Techniques Distinguish Parameters from Statistics Knowing different
Objective A: Mean, Median and Mode Three measures of central of tendency: the mean, the median, and the mode.
 Chapter 3 Numerically Summarizing Data Chapter 3.1 Measures of Central Tendency Objective A: Mean, Median and Mode Three measures of central of tendency: the mean, the median, and the mode. A1. Mean The
Math 120 Introduction to Statistics Mr. Toner s Lecture Notes 3.1 Measures of Central Tendency
 Math 1 Introduction to Statistics Mr. Toner s Lecture Notes 3.1 Measures of Central Tendency The word average: is very ambiguous and can actually refer to the mean, median, mode or midrange. Notation:
3.1 Measure of Center
 3.1 Measure of Center Calculate the mean for a given data set Find the median, and describe why the median is sometimes preferable to the mean Find the mode of a data set Describe how skewness affects
Statistics I Chapter 2: Univariate data analysis
 Statistics I Chapter 2: Univariate data analysis Chapter 2: Univariate data analysis Contents Graphical displays for categorical data (barchart, piechart) Graphical displays for numerical data data (histogram,
Example 2. Given the data below, complete the chart:
 Statistics 2035 Quiz 1 Solutions Example 1. 2 64 150 150 2 128 150 2 256 150 8 8 Example 2. Given the data below, complete the chart: 52.4, 68.1, 66.5, 75.0, 60.5, 78.8, 63.5, 48.9, 81.3 n=9 The data is
A is one of the categories into which qualitative data can be classified.
 Chapter 2 Methods for Describing Sets of Data 2.1 Describing qualitative data Recall qualitative data: non-numerical or categorical data Basic definitions: A is one of the categories into which qualitative
SUMMARIZING MEASURED DATA. Gaia Maselli
 SUMMARIZING MEASURED DATA Gaia Maselli maselli@di.uniroma1.it Computer Network Performance 2 Overview Basic concepts Summarizing measured data Summarizing data by a single number Summarizing variability
Lecture 3B: Chapter 4, Section 2 Quantitative Variables (Displays, Begin Summaries)
") Lecture 3B: Chapter 4, Section 2 Quantitative Variables (Displays, Begin Summaries) Summarize with Shape, Center, Spread Displays: Stemplots, Histograms Five Number Summary, Outliers, Boxplots Mean vs.
Lecture 3B: Chapter 4, Section 2 Quantitative Variables (Displays, Begin Summaries) Summarize with Shape, Center, Spread Displays: Stemplots, Histograms Five Number Summary, Outliers, Boxplots Mean vs.
Range The range is the simplest of the three measures and is defined now.
 Measures of Variation EXAMPLE A testing lab wishes to test two experimental brands of outdoor paint to see how long each will last before fading. The testing lab makes 6 gallons of each paint to test.
Statistics I Chapter 2: Univariate data analysis
 Statistics I Chapter 2: Univariate data analysis Chapter 2: Univariate data analysis Contents Graphical displays for categorical data (barchart, piechart) Graphical displays for numerical data data (histogram,
P8130: Biostatistical Methods I
 P8130: Biostatistical Methods I Lecture 2: Descriptive Statistics Cody Chiuzan, PhD Department of Biostatistics Mailman School of Public Health (MSPH) Lecture 1: Recap Intro to Biostatistics Types of Data
Determining the Spread of a Distribution
 Determining the Spread of a Distribution 1.3-1.5 Cathy Poliak, Ph.D. cathy@math.uh.edu Department of Mathematics University of Houston Lecture 3-2311 Lecture 3-2311 1 / 58 Outline 1 Describing Quantitative
Revision Topic 13: Statistics 1
 Revision Topic 13: Statistics 1 Averages There are three common types of average: the mean, median and mode. The mode (or modal value) is the data value (or values) that occurs the most often. The median
What is Statistics? Statistics is the science of understanding data and of making decisions in the face of variability and uncertainty.
 What is Statistics? Statistics is the science of understanding data and of making decisions in the face of variability and uncertainty. Statistics is a field of study concerned with the data collection,
MEASURES OF LOCATION AND SPREAD
 MEASURES OF LOCATION AND SPREAD Frequency distributions and other methods of data summarization and presentation explained in the previous lectures provide a fairly detailed description of the data and
Chapter Four. Numerical Descriptive Techniques. Range, Standard Deviation, Variance, Coefficient of Variation
 Chapter Four Numerical Descriptive Techniques 4.1 Numerical Descriptive Techniques Measures of Central Location Mean, Median, Mode Measures of Variability Range, Standard Deviation, Variance, Coefficient
Determining the Spread of a Distribution
 Determining the Spread of a Distribution 1.3-1.5 Cathy Poliak, Ph.D. cathy@math.uh.edu Department of Mathematics University of Houston Lecture 3-2311 Lecture 3-2311 1 / 58 Outline 1 Describing Quantitative
STP 420 INTRODUCTION TO APPLIED STATISTICS NOTES
 INTRODUCTION TO APPLIED STATISTICS NOTES PART - DATA CHAPTER LOOKING AT DATA - DISTRIBUTIONS Individuals objects described by a set of data (people, animals, things) - all the data for one individual make
CIVL 7012/8012. Collection and Analysis of Information
 CIVL 7012/8012 Collection and Analysis of Information Uncertainty in Engineering Statistics deals with the collection and analysis of data to solve real-world problems. Uncertainty is inherent in all real
Slide 1. Slide 2. Slide 3. Pick a Brick. Daphne. 400 pts 200 pts 300 pts 500 pts 100 pts. 300 pts. 300 pts 400 pts 100 pts 400 pts.
 Slide 1 Slide 2 Daphne Phillip Kathy Slide 3 Pick a Brick 100 pts 200 pts 500 pts 300 pts 400 pts 200 pts 300 pts 500 pts 100 pts 300 pts 400 pts 100 pts 400 pts 100 pts 200 pts 500 pts 100 pts 400 pts
Chapter 3 Data Description
 Chapter 3 Data Description Section 3.1: Measures of Central Tendency Section 3.2: Measures of Variation Section 3.3: Measures of Position Section 3.1: Measures of Central Tendency Definition of Average
Ø Set of mutually exclusive categories. Ø Classify or categorize subject. Ø No meaningful order to categorization.
 Statistical Tools in Evaluation HPS 41 Dr. Joe G. Schmalfeldt Types of Scores Continuous Scores scores with a potentially infinite number of values. Discrete Scores scores limited to a specific number
Lecture Slides. Elementary Statistics Twelfth Edition. by Mario F. Triola. and the Triola Statistics Series. Section 3.1- #
 Lecture Slides Elementary Statistics Twelfth Edition and the Triola Statistics Series by Mario F. Triola Chapter 3 Statistics for Describing, Exploring, and Comparing Data 3-1 Review and Preview 3-2 Measures
Chapter 3. Measuring data
 Chapter 3 Measuring data 1 Measuring data versus presenting data We present data to help us draw meaning from it But pictures of data are subjective They re also not susceptible to rigorous inference Measuring
= n 1. n 1. Measures of Variability. Sample Variance. Range. Sample Standard Deviation ( ) 2. Chapter 2 Slides. Maurice Geraghty
 2. Chapter 2 Slides. Maurice Geraghty") Chapter Slides Inferential Statistics and Probability a Holistic Approach Chapter Descriptive Statistics This Course Material by Maurice Geraghty is licensed under a Creative Commons Attribution-ShareAlike.
Chapter Slides Inferential Statistics and Probability a Holistic Approach Chapter Descriptive Statistics This Course Material by Maurice Geraghty is licensed under a Creative Commons Attribution-ShareAlike.
Histograms allow a visual interpretation
 Chapter 4: Displaying and Summarizing i Quantitative Data s allow a visual interpretation of quantitative (numerical) data by indicating the number of data points that lie within a range of values, called
Chapter 4.notebook. August 30, 2017
 Sep 1 7:53 AM Sep 1 8:21 AM Sep 1 8:21 AM 1 Sep 1 8:23 AM Sep 1 8:23 AM Sep 1 8:23 AM SOCS When describing a distribution, make sure to always tell about three things: shape, outliers, center, and spread
Statistics and parameters
 Statistics and parameters Tables, histograms and other charts are used to summarize large amounts of data. Often, an even more extreme summary is desirable. Statistics and parameters are numbers that characterize
TOPIC: Descriptive Statistics Single Variable
 TOPIC: Descriptive Statistics Single Variable I. Numerical data summary measurements A. Measures of Location. Measures of central tendency Mean; Median; Mode. Quantiles - measures of noncentral tendency
Descriptive Univariate Statistics and Bivariate Correlation
 ESC 100 Exploring Engineering Descriptive Univariate Statistics and Bivariate Correlation Instructor: Sudhir Khetan, Ph.D. Wednesday/Friday, October 17/19, 2012 The Central Dogma of Statistics used to
Describing distributions with numbers
 Describing distributions with numbers A large number or numerical methods are available for describing quantitative data sets. Most of these methods measure one of two data characteristics: The central
BNG 495 Capstone Design. Descriptive Statistics
 BNG 495 Capstone Design Descriptive Statistics Overview The overall goal of this short course in statistics is to provide an introduction to descriptive and inferential statistical methods, with a focus
Tastitsticsss? What s that? Principles of Biostatistics and Informatics. Variables, outcomes. Tastitsticsss? What s that?
 Tastitsticsss? What s that? Statistics describes random mass phanomenons. Principles of Biostatistics and Informatics nd Lecture: Descriptive Statistics 3 th September Dániel VERES Data Collecting (Sampling)
QUANTITATIVE DATA. UNIVARIATE DATA data for one variable
 QUANTITATIVE DATA Recall that quantitative (numeric) data values are numbers where data take numerical values for which it is sensible to find averages, such as height, hourly pay, and pulse rates. UNIVARIATE
Chapter 3: Displaying and summarizing quantitative data p52 The pattern of variation of a variable is called its distribution.
 Chapter 3: Displaying and summarizing quantitative data p52 The pattern of variation of a variable is called its distribution. 1 Histograms p53 The breakfast cereal data Study collected data on nutritional
Stats Review Chapter 3. Mary Stangler Center for Academic Success Revised 8/16
 Stats Review Chapter Revised 8/16 Note: This review is composed of questions similar to those found in the chapter review and/or chapter test. This review is meant to highlight basic concepts from the
Lecture 6: Chapter 4, Section 2 Quantitative Variables (Displays, Begin Summaries)
") Lecture 6: Chapter 4, Section 2 Quantitative Variables (Displays, Begin Summaries) Summarize with Shape, Center, Spread Displays: Stemplots, Histograms Five Number Summary, Outliers, Boxplots Cengage Learning
Lecture 6: Chapter 4, Section 2 Quantitative Variables (Displays, Begin Summaries) Summarize with Shape, Center, Spread Displays: Stemplots, Histograms Five Number Summary, Outliers, Boxplots Cengage Learning
2/2/2015 GEOGRAPHY 204: STATISTICAL PROBLEM SOLVING IN GEOGRAPHY MEASURES OF CENTRAL TENDENCY CHAPTER 3: DESCRIPTIVE STATISTICS AND GRAPHICS
 Spring 2015: Lembo GEOGRAPHY 204: STATISTICAL PROBLEM SOLVING IN GEOGRAPHY CHAPTER 3: DESCRIPTIVE STATISTICS AND GRAPHICS Descriptive statistics concise and easily understood summary of data set characteristics
Numerical Measures of Central Tendency
 ҧ Numerical Measures of Central Tendency The central tendency of the set of measurements that is, the tendency of the data to cluster, or center, about certain numerical values; usually the Mean, Median
Chapter 6 The Standard Deviation as a Ruler and the Normal Model
 Chapter 6 The Standard Deviation as a Ruler and the Normal Model Overview Key Concepts Understand how adding (subtracting) a constant or multiplying (dividing) by a constant changes the center and/or spread
F78SC2 Notes 2 RJRC. If the interest rate is 5%, we substitute x = 0.05 in the formula. This gives
 F78SC2 Notes 2 RJRC Algebra It is useful to use letters to represent numbers. We can use the rules of arithmetic to manipulate the formula and just substitute in the numbers at the end. Example: 100 invested
Types of Information. Topic 2 - Descriptive Statistics. Examples. Sample and Sample Size. Background Reading. Variables classified as STAT 511
 Topic 2 - Descriptive Statistics STAT 511 Professor Bruce Craig Types of Information Variables classified as Categorical (qualitative) - variable classifies individual into one of several groups or categories
1. Exploratory Data Analysis
 1. Exploratory Data Analysis 1.1 Methods of Displaying Data A visual display aids understanding and can highlight features which may be worth exploring more formally. Displays should have impact and be
Measures of center. The mean The mean of a distribution is the arithmetic average of the observations:
 Measures of center The mean The mean of a distribution is the arithmetic average of the observations: x = x 1 + + x n n n = 1 x i n i=1 The median The median is the midpoint of a distribution: the number
Chapter 1 - Lecture 3 Measures of Location
 Chapter 1 - Lecture 3 of Location August 31st, 2009 Chapter 1 - Lecture 3 of Location General Types of measures Median Skewness Chapter 1 - Lecture 3 of Location Outline General Types of measures What
Quantitative Tools for Research
 Quantitative Tools for Research KASHIF QADRI Descriptive Analysis Lecture Week 4 1 Overview Measurement of Central Tendency / Location Mean, Median & Mode Quantiles (Quartiles, Deciles, Percentiles) Measurement
Further Mathematics 2018 CORE: Data analysis Chapter 2 Summarising numerical data
 Chapter 2: Summarising numerical data Further Mathematics 2018 CORE: Data analysis Chapter 2 Summarising numerical data Extract from Study Design Key knowledge Types of data: categorical (nominal and ordinal)
Chapter 2: Descriptive Analysis and Presentation of Single- Variable Data
 Chapter 2: Descriptive Analysis and Presentation of Single- Variable Data Mean 26.86667 Standard Error 2.816392 Median 25 Mode 20 Standard Deviation 10.90784 Sample Variance 118.981 Kurtosis -0.61717 Skewness
Describing distributions with numbers
 Describing distributions with numbers A large number or numerical methods are available for describing quantitative data sets. Most of these methods measure one of two data characteristics: The central
Describing Data: Numerical Measures GOALS. Why a Numeric Approach? Chapter 3 Dr. Richard Jerz
 Describing Data: Numerical Measures Chapter 3 Dr. Richard Jerz 1 GOALS Calculate the arithmetic mean, weighted mean, median, and mode Explain the characteristics, uses, advantages, and disadvantages of
Lecture 3: Chapter 3
 Lecture 3: Chapter 3 C C Moxley UAB Mathematics 26 January 16 3.2 Measurements of Center Statistics involves describing data sets and inferring things about them. The first step in understanding a set
CHAPTER 2: Describing Distributions with Numbers
 CHAPTER 2: Describing Distributions with Numbers The Basic Practice of Statistics 6 th Edition Moore / Notz / Fligner Lecture PowerPoint Slides Chapter 2 Concepts 2 Measuring Center: Mean and Median Measuring
Measures of disease spread
 Measures of disease spread Marco De Nardi Milk Safety Project 1 Objectives 1. Describe the following measures of spread: range, interquartile range, variance, and standard deviation 2. Discuss examples
Chapter 1: Exploring Data
 Chapter 1: Exploring Data Section 1.3 with Numbers The Practice of Statistics, 4 th edition - For AP* STARNES, YATES, MOORE Chapter 1 Exploring Data Introduction: Data Analysis: Making Sense of Data 1.1
STAT 200 Chapter 1 Looking at Data - Distributions
 STAT 200 Chapter 1 Looking at Data - Distributions What is Statistics? Statistics is a science that involves the design of studies, data collection, summarizing and analyzing the data, interpreting the
Lecture 2. Quantitative variables. There are three main graphical methods for describing, summarizing, and detecting patterns in quantitative data:
 Lecture 2 Quantitative variables There are three main graphical methods for describing, summarizing, and detecting patterns in quantitative data: Stemplot (stem-and-leaf plot) Histogram Dot plot Stemplots
ST Presenting & Summarising Data Descriptive Statistics. Frequency Distribution, Histogram & Bar Chart
 ST2001 2. Presenting & Summarising Data Descriptive Statistics Frequency Distribution, Histogram & Bar Chart Summary of Previous Lecture u A study often involves taking a sample from a population that
Ø Set of mutually exclusive categories. Ø Classify or categorize subject. Ø No meaningful order to categorization.
 Statistical Tools in Evaluation HPS 41 Fall 213 Dr. Joe G. Schmalfeldt Types of Scores Continuous Scores scores with a potentially infinite number of values. Discrete Scores scores limited to a specific
Measures of Location. Measures of position are used to describe the relative location of an observation
 Measures of Location Measures of position are used to describe the relative location of an observation 1 Measures of Position Quartiles and percentiles are two of the most popular measures of position
Midrange: mean of highest and lowest scores. easy to compute, rough estimate, rarely used
 Measures of Central Tendency Mode: most frequent score. best average for nominal data sometimes none or multiple modes in a sample bimodal or multimodal distributions indicate several groups included in
Describing Distributions With Numbers Chapter 12
 Describing Distributions With Numbers Chapter 12 May 1, 2013 What Do We Usually Summarize? Measures of Center. Percentiles. Measures of Spread. A Summary. 1.0 What Do We Usually Summarize? source: Prof.
Chapter 3: Displaying and summarizing quantitative data p52 The pattern of variation of a variable is called its distribution.
 Chapter 3: Displaying and summarizing quantitative data p52 The pattern of variation of a variable is called its distribution. 1 Histograms p53 Spoiled ballots are a real threat to democracy. Below are
2.1 Measures of Location (P.9-11)
") MATH1015 Biostatistics Week.1 Measures of Location (P.9-11).1.1 Summation Notation Suppose that we observe n values from an experiment. This collection (or set) of n values is called a sample. Let x 1
MATH1015 Biostatistics Week.1 Measures of Location (P.9-11).1.1 Summation Notation Suppose that we observe n values from an experiment. This collection (or set) of n values is called a sample. Let x 1
Chapter 5. Understanding and Comparing. Distributions
 STAT 141 Introduction to Statistics Chapter 5 Understanding and Comparing Distributions Bin Zou (bzou@ualberta.ca) STAT 141 University of Alberta Winter 2015 1 / 27 Boxplots How to create a boxplot? Assume
Chapter 1. Looking at Data
 Chapter 1 Looking at Data Types of variables Looking at Data Be sure that each variable really does measure what you want it to. A poor choice of variables can lead to misleading conclusions!! For example,
Σ x i. Sigma Notation
 Sigma Notation The mathematical notation that is used most often in the formulation of statistics is the summation notation The uppercase Greek letter Σ (sigma) is used as shorthand, as a way to indicate
Descriptive Data Summarization
 Descriptive Data Summarization Descriptive data summarization gives the general characteristics of the data and identify the presence of noise or outliers, which is useful for successful data cleaning
Describing Distributions with Numbers
 Topic 2 We next look at quantitative data. Recall that in this case, these data can be subject to the operations of arithmetic. In particular, we can add or subtract observation values, we can sort them
Introduction to Statistics
 Introduction to Statistics By A.V. Vedpuriswar October 2, 2016 Introduction The word Statistics is derived from the Italian word stato, which means state. Statista refers to a person involved with the
Chapter 1:Descriptive statistics
 Slide 1.1 Chapter 1:Descriptive statistics Descriptive statistics summarises a mass of information. We may use graphical and/or numerical methods Examples of the former are the bar chart and XY chart,
Review for Exam #1. Chapter 1. The Nature of Data. Definitions. Population. Sample. Quantitative data. Qualitative (attribute) data
 data") Review for Exam #1 1 Chapter 1 Population the complete collection of elements (scores, people, measurements, etc.) to be studied Sample a subcollection of elements drawn from a population 11 The Nature
Review for Exam #1 1 Chapter 1 Population the complete collection of elements (scores, people, measurements, etc.) to be studied Sample a subcollection of elements drawn from a population 11 The Nature
Measures of Central Tendency and their dispersion and applications. Acknowledgement: Dr Muslima Ejaz
 Measures of Central Tendency and their dispersion and applications Acknowledgement: Dr Muslima Ejaz LEARNING OBJECTIVES: Compute and distinguish between the uses of measures of central tendency: mean,
STATISTICS. 1. Measures of Central Tendency
 STATISTICS 1. Measures o Central Tendency Mode, median and mean For a sample o discrete data, the mode is the observation, x with the highest requency,. 1 N F For grouped data in a cumulative requency