MEASURES OF LOCATION AND SPREAD
|
|
|
- Leonard Leonard
- 6 years ago
- Views:
Transcription
1 MEASURES OF LOCATION AND SPREAD Frequency distributions and other methods of data summarization and presentation explained in the previous lectures provide a fairly detailed description of the data and how it is distributed in the sample. In case of categorical variables this will be usually enough. But in case of quantitative variables we have more methods to summerize and present the data. Since quantitative variables are numbers (whether discrete or continuous) we can order them and summarize them in terms of how they are clustered and spread out in the sample. Quantitative variables can be summarized in terms of location of different values (measures of location or measures of central tendency) and how they are spread in the sample (measures of spread or variation) MEASURES OF LOCATION (Measures of Central Tendency) Measures of location tell us how different values of the variable are located when the data is ordered. There are three measures of location which are the median, the mode and the mean. Each of these measures has its own advantages and disadvantages which depend on the type of data being summarized. Median When we order the variables in ascending or descending way, the median is the value that divides the distribution into two equal parts so that there is the same number of observations above and below the median. For example: Age of 15 women in a survey was as follows: 17, 25, 36, 23, 44, 39, 19, 22, 30, 33, 42, 28, 27, 22, 18 To calculate the median, we rearrange the values in an ascending order. The observation number 8 (27 years) is the middle observation, i.e. there are 7 observation on either side of 27, so the median age is 27 years. When there is an even number of data values, there is no single middle value. In this case the median is calculated by the average of the central pair of values i.e. we add up the two central values and divide the result by 2. For example in table 2 there are 16 observations, there is no middle value for 16. The median fo this data will is calculated from the two values in the middle of the data i.e. observations 7 and 8: Median age =(27+ 28)/2= 55/2=27.5 years Table 1 Table 2 ID Age ID Age Median for Frequency Distributions The median for a frequency distribution is simply the value at which the cumulative relative frequency is 50%. Biostatistics for medical students: written by Dr. Nasih Othman, Sulaimani Polytechnic University
2 Mode The mode of a distribution is simply the value that occurs most frequently. A distribution may have more than one mode. In the example above, 22 is repeated twice, so it is the mode. Mean The mean is the average of all values. The mean is calculated from the sum of all values divided by the number of observations. If we assume that each of n observations (n is the sample size) has a value xi then the mean will be: Example: Age of 15 women in a survey was as follows: 17, 25, 36, 23, 44, 39, 19, 22, 30, 33, 42, 28, 27, 22, 18 Mean age of the women= sum of all ages/n= ( )/15 =425/15= 28.3 years The mean age of the sample is 28.3 years. Mean for Frequency Distributions If we have grouped data from a frequency table and we don t have individual values, we can still calculate the mean from the grouped data by calculating the total for each interval (frequency X midpoint) and then adding up totals for all intervals and dividing the total by the sample size. If f is frequency of each interval, the mean will be calculated in the following way: Table 1 displays grouped data for Hb of 50 women. To calculate sum of each interval we first calculate the midpoint for the interval (column 3), multiply this with the frequency (colum 2) to calculate sum of the values for each interval (column 4). Mean Hb= [(4*8.5) + (7 *9.5) +(18*10.5)+ (13*11.5)+ (3*12.5)+ (4*13.5)+ (1*14.5)]/50 Mean Hb=545/50=10.9 gm Therefore the mean Hb of the 5o women is 10.9 gm. Table 1. Calculation of mean Hb of 50 women from a frequency distribution table Sum of Hb Frequency Mid-point interval and over Total Biostatistics for medical students: written by Dr. Nasih Othman, Sulaimani Polytechnic University
3 Properties of the Mean, Median & Mode 1. The mean, mode and median will be similar if the data is normally distributed (symmetrically distributed around the mean). If the data is not normally distributed the three measures will be different. 2. The mean is sensitive to outliers; the others are not. An outlier is an extreme value, a value which is far from the rest of the values. If there are outliers in the data, the mean will be affected. The mode and the median are not affected by outliers. 3. The mode may be affected by small changes in the data but the mean and median are not affected by small changes in the data. Which measures we should use? Generally if the data distribution is not symmetrical (there are outliers) the median is a better measure of location than the mean. When we want to perform statistical analysis for inference, the mean is more flexible and useful to use. But, if the data is not symmetrically distributed (not normally distributed), even for statistical inference, we have to use the median. Biostatistics for medical students: written by Dr. Nasih Othman, Sulaimani Polytechnic University
4 MEASURES OF SPREAD If we look at a set of quantitative data displayed as a frequency distribution or a graph, we can say whether the observations are widely spread out from the mean or clustered around the mean. But this is not enough; it is usually necessary to describe this variability of the observations as a numerical value. Such a value is called a measure of spread. A measure of spread of the data along with the mean provides a better informative summary of a data set. There are 3 main ways to summarize the variability of a set of data (three measures of spread): 1. Range: gives the range of all values 2. Percentiles; reports what values are located in certain percentages of the whole data 3. The standard deviation: calculates a single numerical measure of the spread around the mean Each measure has its own advantages but the standard deviation is most useful in statistical calculations. Range The simplest way to describe the spread of a set of observations is to report the range from the minimum value to the maximum. Therefore a range tells as the lowest value and the highest value and hence the difference in-between. The problem with this is that it reports the most extreme values which may not represent the majority of the data. The actual distribution of all the values in-between these two extremes are not summarized in any way. Example: Age of 15 women in a survey was as follows: 17, 25, 36, 23, 44, 39, 19, 22, 30, 33, 42, 28, 27, 22, 18 To calculate the range we first order the values from minimum ti maximum, then we identify the smallest and the biggest value and report it. 17, 18, 19, 22, 22, 23, 25, 27, 28, 30, 33, 36, 39, 42, 44 The range is years or years. This means that age of the women is spread out from 17 to 44 years, including 44. Sometimes when we report range we also report the interval (the difference between maximum and minimum). For example difference between 44 and 17 (44-17) is 27 years. Then we say range was 27 years, (17-44). Percentiles A percentile (or centile) is the value below which a given percentage of the data has occurred. For example, in the graph below of the height of a group of people, the 5% percentile is 145 cm meaning that 5% of the group had height below 145 cm. The 95% percentile is 165cm which means that 95% of the group had height below 165 cm. By specifying these two percentiles we give a range in which 90% of the data lies and thus Biostatistics for medical students: written by Dr. Nasih Othman, Sulaimani Polytechnic University


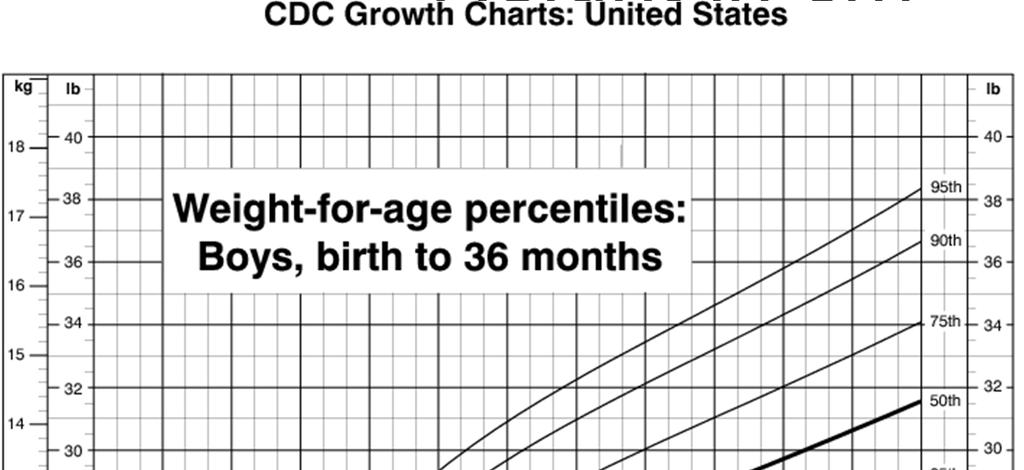
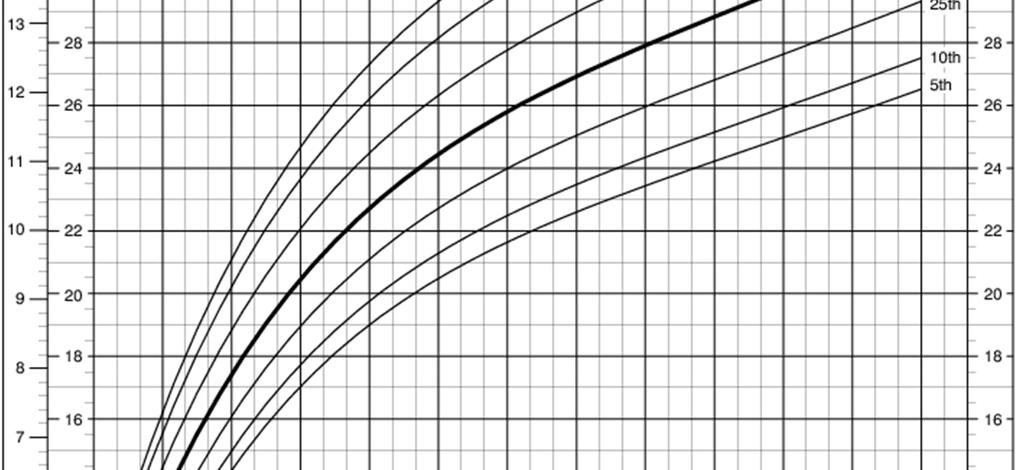
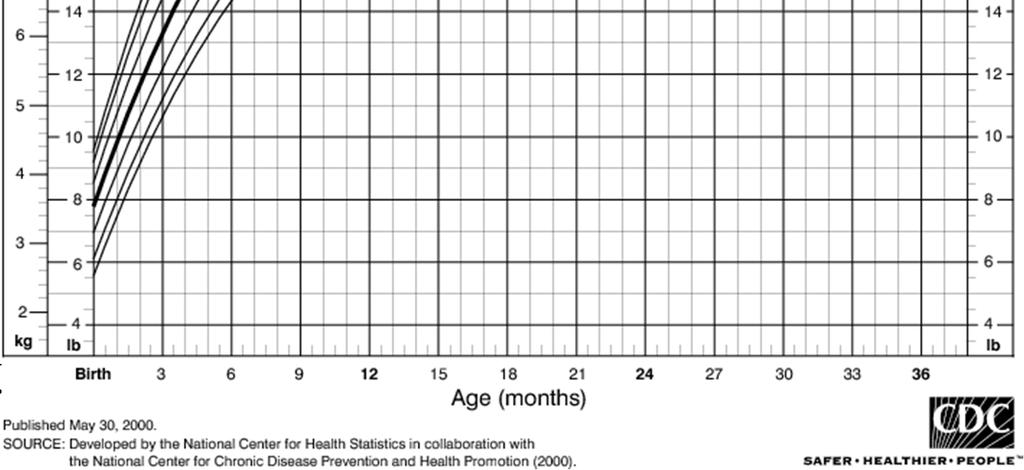
5 Height in cm Biostatistics for medical students: written by Dr. Nasih Othman, Sulaimani Polytechnic University
6 Standard Deviation The most common way of quantifying the variability of a distribution is to calculate its standard deviation. This method uses all the observations, by accounting for all deviations from the mean. By deviations we mean the differences between each observation and the mean. The standard deviation is a sort of average of all the deviations. Mathematically, if we say each observation has a value Xi (where i = 1 to n) then the distance from the mean value,x, will be (X -Xi). With n observations we will have n such distances. We calculate the average of these distances by summing all the observed deviations and dividing by n. Average Deviation = [ (Xi- X )]/n However, simply calculating the average deviation is not sufficient. In fact this equation will always give an average deviation of zero, because positive deviations from the mean will always exactly balance the negative deviations. What we are interested in is the magnitude of the deviations. If we square the deviations before summing them, we will always get a positive quantity. Dividing this by the total number of observations then gives a measure of average deviation from the mean, known as the variance. Variance, S² = [ (Xi- X )²]/n-1 Note. In this equation we use n-1, not n, as the denominator, because we are estimating the population variance. The problem with the variance is that it is squared, and so it is not in the same unit as the original data. For example height of individuals will be in square cm which is unit of area, not height. If we take the square root of the variance we get a measure of variability in the same units as the raw data. This quantity is called the standard deviation and tells us the average distance of all the observations in a dataset from the mean. Standard Deviation, S = [ (Xi- X )²]/n-1 Example: calculate variance and standard deviation for the following set of data on weight of 10 people in Kgs. 61, 75, 65 58, 78, 82, 70, 72, 91, 77 For calculating variance, first calculate the mean weight X = Xi/n= ( )/10=72.9 years Then calculate variance by the formula Variance, S² = [ (Xi- X )²]/n-1 Biostatistics for medical students: written by Dr. Nasih Othman, Sulaimani Polytechnic University
7 Variance= [ )+( ) )+( )+( )+( )+( )+( )+( )+( )] ² /9=99.2 Then calculate standard deviation by taking the square root of the variance S= variance= 99.2=9.96 What does this mean? The standard deviation for the data was 10 Kg, meaning that on average each observation was 10 kg away from the mean (either more or less than the mean). How normal data is distributed i.e. spread out in relation to standard deviation? For data that is normally distributed: About 68% of the data lies within 1 standard deviation of the mean About 95% of the data lies within 2 standard deviations of the mean About 99% of the data lies within 3 standard deviations of the mean These proportions apply to all normal distributions, regardless of the total number of data values or the width of the distribution. The standard deviation helps to summarize the distribution of data. The standard deviation plays an important role in statistical data analysis. Biostatistics for medical students: written by Dr. Nasih Othman, Sulaimani Polytechnic University
Unit 2. Describing Data: Numerical
 Unit 2 Describing Data: Numerical Describing Data Numerically Describing Data Numerically Central Tendency Arithmetic Mean Median Mode Variation Range Interquartile Range Variance Standard Deviation Coefficient
Chapter 1 - Lecture 3 Measures of Location
 Chapter 1 - Lecture 3 of Location August 31st, 2009 Chapter 1 - Lecture 3 of Location General Types of measures Median Skewness Chapter 1 - Lecture 3 of Location Outline General Types of measures What
Unit Two Descriptive Biostatistics. Dr Mahmoud Alhussami
 Unit Two Descriptive Biostatistics Dr Mahmoud Alhussami Descriptive Biostatistics The best way to work with data is to summarize and organize them. Numbers that have not been summarized and organized are
Descriptive Statistics-I. Dr Mahmoud Alhussami
 Descriptive Statistics-I Dr Mahmoud Alhussami Biostatistics What is the biostatistics? A branch of applied math. that deals with collecting, organizing and interpreting data using well-defined procedures.
additionalmathematicsstatisticsadditi onalmathematicsstatisticsadditionalm athematicsstatisticsadditionalmathem aticsstatisticsadditionalmathematicsst
 additionalmathematicsstatisticsadditi onalmathematicsstatisticsadditionalm athematicsstatisticsadditionalmathem aticsstatisticsadditionalmathematicsst STATISTICS atisticsadditionalmathematicsstatistic
Last Lecture. Distinguish Populations from Samples. Knowing different Sampling Techniques. Distinguish Parameters from Statistics
 Last Lecture Distinguish Populations from Samples Importance of identifying a population and well chosen sample Knowing different Sampling Techniques Distinguish Parameters from Statistics Knowing different
Statistics and parameters
 Statistics and parameters Tables, histograms and other charts are used to summarize large amounts of data. Often, an even more extreme summary is desirable. Statistics and parameters are numbers that characterize
Numerical Measures of Central Tendency
 ҧ Numerical Measures of Central Tendency The central tendency of the set of measurements that is, the tendency of the data to cluster, or center, about certain numerical values; usually the Mean, Median
Ø Set of mutually exclusive categories. Ø Classify or categorize subject. Ø No meaningful order to categorization.
 Statistical Tools in Evaluation HPS 41 Fall 213 Dr. Joe G. Schmalfeldt Types of Scores Continuous Scores scores with a potentially infinite number of values. Discrete Scores scores limited to a specific
Chapter 3. Measuring data
 Chapter 3 Measuring data 1 Measuring data versus presenting data We present data to help us draw meaning from it But pictures of data are subjective They re also not susceptible to rigorous inference Measuring
Sampling (Statistics)
") Systems & Biomedical Engineering Department SBE 304: Bio-Statistics Random Sampling and Sampling Distributions Dr. Ayman Eldeib Fall 2018 Sampling (Statistics) Sampling is that part of statistical practice
Systems & Biomedical Engineering Department SBE 304: Bio-Statistics Random Sampling and Sampling Distributions Dr. Ayman Eldeib Fall 2018 Sampling (Statistics) Sampling is that part of statistical practice
Describing distributions with numbers
 Describing distributions with numbers A large number or numerical methods are available for describing quantitative data sets. Most of these methods measure one of two data characteristics: The central
A is one of the categories into which qualitative data can be classified.
 Chapter 2 Methods for Describing Sets of Data 2.1 Describing qualitative data Recall qualitative data: non-numerical or categorical data Basic definitions: A is one of the categories into which qualitative
Lecture 2. Descriptive Statistics: Measures of Center
 Lecture 2. Descriptive Statistics: Measures of Center Descriptive Statistics summarize or describe the important characteristics of a known set of data Inferential Statistics use sample data to make inferences
Math 120 Introduction to Statistics Mr. Toner s Lecture Notes 3.1 Measures of Central Tendency
 Math 1 Introduction to Statistics Mr. Toner s Lecture Notes 3.1 Measures of Central Tendency The word average: is very ambiguous and can actually refer to the mean, median, mode or midrange. Notation:
Determining the Spread of a Distribution Variance & Standard Deviation
 Determining the Spread of a Distribution Variance & Standard Deviation 1.3 Cathy Poliak, Ph.D. cathy@math.uh.edu Department of Mathematics University of Houston Lecture 3 Lecture 3 1 / 32 Outline 1 Describing
P8130: Biostatistical Methods I
 P8130: Biostatistical Methods I Lecture 2: Descriptive Statistics Cody Chiuzan, PhD Department of Biostatistics Mailman School of Public Health (MSPH) Lecture 1: Recap Intro to Biostatistics Types of Data
Chapter 2 Descriptive Statistics
 Chapter 2 Descriptive Statistics Lecture 1: Measures of Central Tendency and Dispersion Donald E. Mercante, PhD Biostatistics May 2010 Biostatistics (LSUHSC) Chapter 2 05/10 1 / 34 Lecture 1: Descriptive
What is statistics? Statistics is the science of: Collecting information. Organizing and summarizing the information collected
 What is statistics? Statistics is the science of: Collecting information Organizing and summarizing the information collected Analyzing the information collected in order to draw conclusions Two types
KCP e-learning. test user - ability basic maths revision. During your training, we will need to cover some ground using statistics.
 During your training, we will need to cover some ground using statistics. The very mention of this word can sometimes alarm delegates who may not have done any maths or statistics since leaving school.
Topic-1 Describing Data with Numerical Measures
 Topic-1 Describing Data with Numerical Measures Central Tendency (Center) and Dispersion (Variability) Central tendency: measures of the degree to which scores are clustered around the mean of a distribution
Lecture 2 and Lecture 3
 Lecture 2 and Lecture 3 1 Lecture 2 and Lecture 3 We can describe distributions using 3 characteristics: shape, center and spread. These characteristics have been discussed since the foundation of statistics.
BIOS 2041: Introduction to Statistical Methods
 BIOS 2041: Introduction to Statistical Methods Abdus S Wahed* *Some of the materials in this chapter has been adapted from Dr. John Wilson s lecture notes for the same course. Chapter 0 2 Chapter 1 Introduction
Example 2. Given the data below, complete the chart:
 Statistics 2035 Quiz 1 Solutions Example 1. 2 64 150 150 2 128 150 2 256 150 8 8 Example 2. Given the data below, complete the chart: 52.4, 68.1, 66.5, 75.0, 60.5, 78.8, 63.5, 48.9, 81.3 n=9 The data is
CIVL 7012/8012. Collection and Analysis of Information
 CIVL 7012/8012 Collection and Analysis of Information Uncertainty in Engineering Statistics deals with the collection and analysis of data to solve real-world problems. Uncertainty is inherent in all real
MAT Mathematics in Today's World
 MAT 1000 Mathematics in Today's World Last Time 1. Three keys to summarize a collection of data: shape, center, spread. 2. Can measure spread with the fivenumber summary. 3. The five-number summary can
Chapter 3. Data Description
 Chapter 3. Data Description Graphical Methods Pie chart It is used to display the percentage of the total number of measurements falling into each of the categories of the variable by partition a circle.
Revision Topic 13: Statistics 1
 Revision Topic 13: Statistics 1 Averages There are three common types of average: the mean, median and mode. The mode (or modal value) is the data value (or values) that occurs the most often. The median
Objective A: Mean, Median and Mode Three measures of central of tendency: the mean, the median, and the mode.
 Chapter 3 Numerically Summarizing Data Chapter 3.1 Measures of Central Tendency Objective A: Mean, Median and Mode Three measures of central of tendency: the mean, the median, and the mode. A1. Mean The
Ø Set of mutually exclusive categories. Ø Classify or categorize subject. Ø No meaningful order to categorization.
 Statistical Tools in Evaluation HPS 41 Dr. Joe G. Schmalfeldt Types of Scores Continuous Scores scores with a potentially infinite number of values. Discrete Scores scores limited to a specific number
SESSION 5 Descriptive Statistics
 SESSION 5 Descriptive Statistics Descriptive statistics are used to describe the basic features of the data in a study. They provide simple summaries about the sample and the measures. Together with simple
MATH 117 Statistical Methods for Management I Chapter Three
 Jubail University College MATH 117 Statistical Methods for Management I Chapter Three This chapter covers the following topics: I. Measures of Center Tendency. 1. Mean for Ungrouped Data (Raw Data) 2.
Histograms allow a visual interpretation
 Chapter 4: Displaying and Summarizing i Quantitative Data s allow a visual interpretation of quantitative (numerical) data by indicating the number of data points that lie within a range of values, called
3.1 Measures of Central Tendency: Mode, Median and Mean. Average a single number that is used to describe the entire sample or population
 . Measures of Central Tendency: Mode, Median and Mean Average a single number that is used to describe the entire sample or population. Mode a. Easiest to compute, but not too stable i. Changing just one
Lecture 2. Quantitative variables. There are three main graphical methods for describing, summarizing, and detecting patterns in quantitative data:
 Lecture 2 Quantitative variables There are three main graphical methods for describing, summarizing, and detecting patterns in quantitative data: Stemplot (stem-and-leaf plot) Histogram Dot plot Stemplots
DEPARTMENT OF QUANTITATIVE METHODS & INFORMATION SYSTEMS QM 120. Spring 2008
 DEPARTMENT OF QUANTITATIVE METHODS & INFORMATION SYSTEMS Introduction to Business Statistics QM 120 Chapter 3 Spring 2008 Measures of central tendency for ungrouped data 2 Graphs are very helpful to describe
Measures of Central Tendency and their dispersion and applications. Acknowledgement: Dr Muslima Ejaz
 Measures of Central Tendency and their dispersion and applications Acknowledgement: Dr Muslima Ejaz LEARNING OBJECTIVES: Compute and distinguish between the uses of measures of central tendency: mean,
Review for Exam #1. Chapter 1. The Nature of Data. Definitions. Population. Sample. Quantitative data. Qualitative (attribute) data
 data") Review for Exam #1 1 Chapter 1 Population the complete collection of elements (scores, people, measurements, etc.) to be studied Sample a subcollection of elements drawn from a population 11 The Nature
Review for Exam #1 1 Chapter 1 Population the complete collection of elements (scores, people, measurements, etc.) to be studied Sample a subcollection of elements drawn from a population 11 The Nature
STAT 200 Chapter 1 Looking at Data - Distributions
 STAT 200 Chapter 1 Looking at Data - Distributions What is Statistics? Statistics is a science that involves the design of studies, data collection, summarizing and analyzing the data, interpreting the
Describing Distributions With Numbers
 Describing Distributions With Numbers October 24, 2012 What Do We Usually Summarize? Measures of Center. Percentiles. Measures of Spread. A Summary Statement. Choosing Numerical Summaries. 1.0 What Do
2011 Pearson Education, Inc
 Statistics for Business and Economics Chapter 2 Methods for Describing Sets of Data Summary of Central Tendency Measures Measure Formula Description Mean x i / n Balance Point Median ( n +1) Middle Value
ADMS2320.com. We Make Stats Easy. Chapter 4. ADMS2320.com Tutorials Past Tests. Tutorial Length 1 Hour 45 Minutes
 We Make Stats Easy. Chapter 4 Tutorial Length 1 Hour 45 Minutes Tutorials Past Tests Chapter 4 Page 1 Chapter 4 Note The following topics will be covered in this chapter: Measures of central location Measures
Elementary Statistics
 Elementary Statistics Q: What is data? Q: What does the data look like? Q: What conclusions can we draw from the data? Q: Where is the middle of the data? Q: Why is the spread of the data important? Q:
Determining the Spread of a Distribution
 Determining the Spread of a Distribution 1.3-1.5 Cathy Poliak, Ph.D. cathy@math.uh.edu Department of Mathematics University of Houston Lecture 3-2311 Lecture 3-2311 1 / 58 Outline 1 Describing Quantitative
SUMMARIZING MEASURED DATA. Gaia Maselli
 SUMMARIZING MEASURED DATA Gaia Maselli maselli@di.uniroma1.it Computer Network Performance 2 Overview Basic concepts Summarizing measured data Summarizing data by a single number Summarizing variability
Variety I Variety II
 Lecture.5 Measures of dispersion - Range, Variance -Standard deviation co-efficient of variation - computation of the above statistics for raw and grouped data Measures of Dispersion The averages are representatives
Tastitsticsss? What s that? Principles of Biostatistics and Informatics. Variables, outcomes. Tastitsticsss? What s that?
 Tastitsticsss? What s that? Statistics describes random mass phanomenons. Principles of Biostatistics and Informatics nd Lecture: Descriptive Statistics 3 th September Dániel VERES Data Collecting (Sampling)
Determining the Spread of a Distribution
 Determining the Spread of a Distribution 1.3-1.5 Cathy Poliak, Ph.D. cathy@math.uh.edu Department of Mathematics University of Houston Lecture 3-2311 Lecture 3-2311 1 / 58 Outline 1 Describing Quantitative
3.1 Measure of Center
 3.1 Measure of Center Calculate the mean for a given data set Find the median, and describe why the median is sometimes preferable to the mean Find the mode of a data set Describe how skewness affects
Perhaps the most important measure of location is the mean (average). Sample mean: where n = sample size. Arrange the values from smallest to largest:
. Sample mean: where n = sample size. Arrange the values from smallest to largest:") 1 Chapter 3 - Descriptive stats: Numerical measures 3.1 Measures of Location Mean Perhaps the most important measure of location is the mean (average). Sample mean: where n = sample size Example: The number
1 Chapter 3 - Descriptive stats: Numerical measures 3.1 Measures of Location Mean Perhaps the most important measure of location is the mean (average). Sample mean: where n = sample size Example: The number
STP 420 INTRODUCTION TO APPLIED STATISTICS NOTES
 INTRODUCTION TO APPLIED STATISTICS NOTES PART - DATA CHAPTER LOOKING AT DATA - DISTRIBUTIONS Individuals objects described by a set of data (people, animals, things) - all the data for one individual make
a) 3 cm b) 3 cm c) cm d) cm
 3 cm b) 3 cm c) cm d) cm") (1) Choose the correct answer: 1) =. a) b) ] - [ c) ] - ] d) ] [ 2) The opposite figure represents the interval. a) [-3, 5 ] b) ] -3, 5 [ c) [ -3, 5 [ d) ] -3, 5 ] -3 5 3) If the volume of the sphere is
(1) Choose the correct answer: 1) =. a) b) ] - [ c) ] - ] d) ] [ 2) The opposite figure represents the interval. a) [-3, 5 ] b) ] -3, 5 [ c) [ -3, 5 [ d) ] -3, 5 ] -3 5 3) If the volume of the sphere is
Describing Data: Numerical Measures
 Describing Data: Numerical Measures Chapter 3 Learning Objectives Calculate the arithmetic mean, weighted mean, geometric mean, median, and the mode. Explain the characteristics, uses, advantages, and
Looking at Data Relationships. 2.1 Scatterplots W. H. Freeman and Company
 Looking at Data Relationships 2.1 Scatterplots 2012 W. H. Freeman and Company Here, we have two quantitative variables for each of 16 students. 1) How many beers they drank, and 2) Their blood alcohol
Describing Distributions With Numbers Chapter 12
 Describing Distributions With Numbers Chapter 12 May 1, 2013 What Do We Usually Summarize? Measures of Center. Percentiles. Measures of Spread. A Summary. 1.0 What Do We Usually Summarize? source: Prof.
Statistics 1. Edexcel Notes S1. Mathematical Model. A mathematical model is a simplification of a real world problem.
 Statistics 1 Mathematical Model A mathematical model is a simplification of a real world problem. 1. A real world problem is observed. 2. A mathematical model is thought up. 3. The model is used to make
Quantitative Tools for Research
 Quantitative Tools for Research KASHIF QADRI Descriptive Analysis Lecture Week 4 1 Overview Measurement of Central Tendency / Location Mean, Median & Mode Quantiles (Quartiles, Deciles, Percentiles) Measurement
CHAPTER 4 VARIABILITY ANALYSES. Chapter 3 introduced the mode, median, and mean as tools for summarizing the
 CHAPTER 4 VARIABILITY ANALYSES Chapter 3 introduced the mode, median, and mean as tools for summarizing the information provided in an distribution of data. Measures of central tendency are often useful
Statistics in medicine
 Statistics in medicine Lecture 1- part 1: Describing variation, and graphical presentation Outline Sources of variation Types of variables Fatma Shebl, MD, MS, MPH, PhD Assistant Professor Chronic Disease
Biostatistics for biomedical profession. BIMM34 Karin Källen & Linda Hartman November-December 2015
 Biostatistics for biomedical profession BIMM34 Karin Källen & Linda Hartman November-December 2015 12015-11-02 Who needs a course in biostatistics? - Anyone who uses quntitative methods to interpret biological
Describing Distributions
 Describing Distributions With Numbers April 18, 2012 Summary Statistics. Measures of Center. Percentiles. Measures of Spread. A Summary Statement. Choosing Numerical Summaries. 1.0 What Are Summary Statistics?
Summarizing Measured Data
 Summarizing Measured Data 12-1 Overview Basic Probability and Statistics Concepts: CDF, PDF, PMF, Mean, Variance, CoV, Normal Distribution Summarizing Data by a Single Number: Mean, Median, and Mode, Arithmetic,
Chapter 4. Displaying and Summarizing. Quantitative Data
 STAT 141 Introduction to Statistics Chapter 4 Displaying and Summarizing Quantitative Data Bin Zou (bzou@ualberta.ca) STAT 141 University of Alberta Winter 2015 1 / 31 4.1 Histograms 1 We divide the range
Describing distributions with numbers
 Describing distributions with numbers A large number or numerical methods are available for describing quantitative data sets. Most of these methods measure one of two data characteristics: The central
Measures of Central Tendency
 Measures of Central Tendency Summary Measures Summary Measures Central Tendency Mean Median Mode Quartile Range Variance Variation Coefficient of Variation Standard Deviation Measures of Central Tendency
Lesson 5.4: The Normal Distribution, page 251
 6. For females: Midpoint Salary ($) Frequency 22 5 92 27 5 52 32 5 9 37 5 42 5 4 47 5 52 5 3 57 5 3 x = $27 39.3 = $724.2 For males: Midpoint Salary ($) Frequency 25 86 35 78 45 28 55 2 65 22 75 85 4 95
The empirical ( ) rule
 rule") The empirical (68-95-99.7) rule With a bell shaped distribution, about 68% of the data fall within a distance of 1 standard deviation from the mean. 95% fall within 2 standard deviations of the mean. 99.7%
The empirical (68-95-99.7) rule With a bell shaped distribution, about 68% of the data fall within a distance of 1 standard deviation from the mean. 95% fall within 2 standard deviations of the mean. 99.7%
Lecture 6: Chapter 4, Section 2 Quantitative Variables (Displays, Begin Summaries)
") Lecture 6: Chapter 4, Section 2 Quantitative Variables (Displays, Begin Summaries) Summarize with Shape, Center, Spread Displays: Stemplots, Histograms Five Number Summary, Outliers, Boxplots Cengage Learning
Lecture 6: Chapter 4, Section 2 Quantitative Variables (Displays, Begin Summaries) Summarize with Shape, Center, Spread Displays: Stemplots, Histograms Five Number Summary, Outliers, Boxplots Cengage Learning
For instance, we want to know whether freshmen with parents of BA degree are predicted to get higher GPA than those with parents without BA degree.
 DESCRIPTIVE ANALYSIS For instance, we want to know whether freshmen with parents of BA degree are predicted to get higher GPA than those with parents without BA degree. Assume that we have data; what information
Describing Data with Numerical Measures
 10.08.009 Describing Data with Numerical Measures 10.08.009 1 Graphical methods may not always be sufficient for describing data. Numerical measures can be created for both populations and samples. A parameter
OBJECTIVES INTRODUCTION
 M7 Chapter 3 Section 1 OBJECTIVES Suarize data using easures of central tendency, such as the ean, edian, ode, and idrange. Describe data using the easures of variation, such as the range, variance, and
Frequency Distribution Cross-Tabulation
 Frequency Distribution Cross-Tabulation 1) Overview 2) Frequency Distribution 3) Statistics Associated with Frequency Distribution i. Measures of Location ii. Measures of Variability iii. Measures of Shape
Descriptive Univariate Statistics and Bivariate Correlation
 ESC 100 Exploring Engineering Descriptive Univariate Statistics and Bivariate Correlation Instructor: Sudhir Khetan, Ph.D. Wednesday/Friday, October 17/19, 2012 The Central Dogma of Statistics used to
2.1 Measures of Location (P.9-11)
") MATH1015 Biostatistics Week.1 Measures of Location (P.9-11).1.1 Summation Notation Suppose that we observe n values from an experiment. This collection (or set) of n values is called a sample. Let x 1
MATH1015 Biostatistics Week.1 Measures of Location (P.9-11).1.1 Summation Notation Suppose that we observe n values from an experiment. This collection (or set) of n values is called a sample. Let x 1
Data Analysis and Statistical Methods Statistics 651
 Data Analysis and Statistical Methods Statistics 651 http://www.stat.tamu.edu/~suhasini/teaching/ Suhasini Subba Rao Review In the previous lecture we looked at the statistics of M&Ms. This example illustrates
ST Presenting & Summarising Data Descriptive Statistics. Frequency Distribution, Histogram & Bar Chart
 ST2001 2. Presenting & Summarising Data Descriptive Statistics Frequency Distribution, Histogram & Bar Chart Summary of Previous Lecture u A study often involves taking a sample from a population that
MATH 1150 Chapter 2 Notation and Terminology
 MATH 1150 Chapter 2 Notation and Terminology Categorical Data The following is a dataset for 30 randomly selected adults in the U.S., showing the values of two categorical variables: whether or not the
Higher Secondary - First year STATISTICS Practical Book
 Higher Secondary - First year STATISTICS Practical Book th_statistics_practicals.indd 07-09-08 8:00:9 Introduction Statistical tools are important for us in daily life. They are used in the analysis of
Describing Data: Numerical Measures. Chapter 3
 Describing Data: Numerical Measures Chapter 3 Learning Objectives Calculate the arithmetic mean, weighted mean median, and the mode. Explain the characteristics, uses, advantages, and disadvantages of
Lecture 3: Chapter 3
 Lecture 3: Chapter 3 C C Moxley UAB Mathematics 26 January 16 3.2 Measurements of Center Statistics involves describing data sets and inferring things about them. The first step in understanding a set
Algebra 2. Outliers. Measures of Central Tendency (Mean, Median, Mode) Standard Deviation Normal Distribution (Bell Curves)
 Standard Deviation Normal Distribution (Bell Curves)") Algebra 2 Outliers Measures of Central Tendency (Mean, Median, Mode) Standard Deviation Normal Distribution (Bell Curves) Algebra 2 Notes #1 Chp 12 Outliers In a set of numbers, sometimes there will be
Algebra 2 Outliers Measures of Central Tendency (Mean, Median, Mode) Standard Deviation Normal Distribution (Bell Curves) Algebra 2 Notes #1 Chp 12 Outliers In a set of numbers, sometimes there will be
TOPIC: Descriptive Statistics Single Variable
 TOPIC: Descriptive Statistics Single Variable I. Numerical data summary measurements A. Measures of Location. Measures of central tendency Mean; Median; Mode. Quantiles - measures of noncentral tendency
What is Statistics? Statistics is the science of understanding data and of making decisions in the face of variability and uncertainty.
 What is Statistics? Statistics is the science of understanding data and of making decisions in the face of variability and uncertainty. Statistics is a field of study concerned with the data collection,
Sampling, Frequency Distributions, and Graphs (12.1)
") 1 Sampling, Frequency Distributions, and Graphs (1.1) Design: Plan how to obtain the data. What are typical Statistical Methods? Collect the data, which is then subjected to statistical analysis, which
1 Sampling, Frequency Distributions, and Graphs (1.1) Design: Plan how to obtain the data. What are typical Statistical Methods? Collect the data, which is then subjected to statistical analysis, which
Section 7.2 Homework Answers
 25.5 30 Sample Mean P 0.1226 sum n b. The two z-scores are z 25 20(1.7) n 1.0 20 sum n 2.012 and z 30 20(1.7) n 1.0 0.894, 20 so the probability is approximately 0.1635 (0.1645 using Table A). P14. a.
Chapter 2: Tools for Exploring Univariate Data
 Stats 11 (Fall 2004) Lecture Note Introduction to Statistical Methods for Business and Economics Instructor: Hongquan Xu Chapter 2: Tools for Exploring Univariate Data Section 2.1: Introduction What is
BIOL 51A - Biostatistics 1 1. Lecture 1: Intro to Biostatistics. Smoking: hazardous? FEV (l) Smoke
 Smoke") BIOL 51A - Biostatistics 1 1 Lecture 1: Intro to Biostatistics Smoking: hazardous? FEV (l) 1 2 3 4 5 No Yes Smoke BIOL 51A - Biostatistics 1 2 Box Plot a.k.a box-and-whisker diagram or candlestick chart
BIOL 51A - Biostatistics 1 1 Lecture 1: Intro to Biostatistics Smoking: hazardous? FEV (l) 1 2 3 4 5 No Yes Smoke BIOL 51A - Biostatistics 1 2 Box Plot a.k.a box-and-whisker diagram or candlestick chart
CHAPTER 8 INTRODUCTION TO STATISTICAL ANALYSIS
 CHAPTER 8 INTRODUCTION TO STATISTICAL ANALYSIS LEARNING OBJECTIVES: After studying this chapter, a student should understand: notation used in statistics; how to represent variables in a mathematical form
200 participants [EUR] ( =60) 200 = 30% i.e. nearly a third of the phone bills are greater than 75 EUR
![200 participants [EUR] ( =60) 200 = 30% i.e. nearly a third of the phone bills are greater than 75 EUR](/thumbs/87/96058730.jpg "200 participants [EUR] ( =60) 200 = 30% i.e. nearly a third of the phone bills are greater than 75 EUR") Ana Jerončić 200 participants [EUR] about half (71+37=108) 200 = 54% of the bills are small, i.e. less than 30 EUR (18+28+14=60) 200 = 30% i.e. nearly a third of the phone bills are greater than 75 EUR
Ana Jerončić 200 participants [EUR] about half (71+37=108) 200 = 54% of the bills are small, i.e. less than 30 EUR (18+28+14=60) 200 = 30% i.e. nearly a third of the phone bills are greater than 75 EUR
MEASURES OF CENTRAL TENDENCY
 MAT001-Statistics for Engineers MEASURES OF CENTRAL TENDENCY DESCRIPTIVE STATISTICAL MEASURES Graphical representation summarizes information in the data. In addition to the diagrammatic and graphic representations
Precision Correcting for Random Error
 Precision Correcting for Random Error The following material should be read thoroughly before your 1 st Lab. The Statistical Handling of Data Our experimental inquiries into the workings of physical reality
Statistics I Chapter 2: Univariate data analysis
 Statistics I Chapter 2: Univariate data analysis Chapter 2: Univariate data analysis Contents Graphical displays for categorical data (barchart, piechart) Graphical displays for numerical data data (histogram,
Overview of Dispersion. Standard. Deviation
 15.30 STATISTICS UNIT II: DISPERSION After reading this chapter, students will be able to understand: LEARNING OBJECTIVES To understand different measures of Dispersion i.e Range, Quartile Deviation, Mean
Essentials of Statistics and Probability
 May 22, 2007 Department of Statistics, NC State University dbsharma@ncsu.edu SAMSI Undergrad Workshop Overview Practical Statistical Thinking Introduction Data and Distributions Variables and Distributions
MATH 10 INTRODUCTORY STATISTICS
 MATH 10 INTRODUCTORY STATISTICS Tommy Khoo Your friendly neighbourhood graduate student. Week 1 Chapter 1 Introduction What is Statistics? Why do you need to know Statistics? Technical lingo and concepts:
Chapter 3 Data Description
 Chapter 3 Data Description Section 3.1: Measures of Central Tendency Section 3.2: Measures of Variation Section 3.3: Measures of Position Section 3.1: Measures of Central Tendency Definition of Average
Measures of Dispersion
 Measures of Dispersion MATH 130, Elements of Statistics I J. Robert Buchanan Department of Mathematics Fall 2017 Introduction Recall that a measure of central tendency is a number which is typical of all
Introduction to statistics
 Introduction to statistics Literature Raj Jain: The Art of Computer Systems Performance Analysis, John Wiley Schickinger, Steger: Diskrete Strukturen Band 2, Springer David Lilja: Measuring Computer Performance:
Lecture 11. Data Description Estimation
 Lecture 11 Data Description Estimation Measures of Central Tendency (continued, see last lecture) Sample mean, population mean Sample mean for frequency distributions The median The mode The midrange 3-22
3 Lecture 3 Notes: Measures of Variation. The Boxplot. Definition of Probability
 3 Lecture 3 Notes: Measures of Variation. The Boxplot. Definition of Probability 3.1 Week 1 Review Creativity is more than just being different. Anybody can plan weird; that s easy. What s hard is to be