The rheology and roll-to-roll processing of shearthickening
|
|
|
- Harriet Perkins
- 5 years ago
- Views:
Transcription

1 University of Massachusetts Amherst Amherst Doctoral Dissertations Dissertations and Theses 2017 The rheology and roll-to-roll processing of shearthickening particle dispersions Sunilkumar Khandavalli Follow this and additional works at: Part of the Complex Fluids Commons, Nanoscience and Nanotechnology Commons, Other Mechanical Engineering Commons, and the Polymer and Organic Materials Commons Recommended Citation Khandavalli, Sunilkumar, "The rheology and roll-to-roll processing of shear-thickening particle dispersions" (2017). Doctoral Dissertations This Open Access Dissertation is brought to you for free and open access by the Dissertations and Theses at Amherst. It has been accepted for inclusion in Doctoral Dissertations by an authorized administrator of Amherst. For more information, please contact
2 THE RHEOLOGY AND ROLL-TO-ROLL PROCESSING OF SHEAR-THICKENING PARTICLE DISPERSIONS A Dissertation Presented by SUNILKUMAR KHANDAVALLI Submitted to the Graduate School of the University of Massachusetts Amherst in partial fulfillment of the requirements for the degree of DOCTOR OF PHILOSOPHY September 2017 Mechanical and Industrial Engineering
3 c Copyright by Sunilkumar Khandavalli 2017 All Rights Reserved
4 THE RHEOLOGY AND ROLL-TO-ROLL PROCESSING OF SHEAR-THICKENING PARTICLE DISPERSIONS A Dissertation Presented by SUNILKUMAR KHANDAVALLI Approved as to style and content by: Jonathan P. Rothstein, Chair H. Henning Winter, Member Jonghyun Lee, Member Sundar Krishnamurthy, Department Head Mechanical and Industrial Engineering
5 ACKNOWLEDGMENTS First and foremost, my sincere gratitude to my advisor Jonathan P. Rothstein. Without his patient guidance and encouragement through out my PhD, I wouldn t have accomplished this thesis. I would like to thank him for all time and effort in guiding me through out this journey. I would like to thank Professor Abhijit P. Deshpande, my past advisor at Indian Institute of Technology Madras, who first introduced me to the field of rheology and the experience has been a great motivation to pursue PhD research in this exciting field. I would also like to thank my thesis committee members, Professor Henning Winter and Professor Jonghyun Lee, for their time in offering feedback on my thesis research. I want to thank Alex for working together on gravure printing project, which has been a great learning experience. Without my research group, this journey would have been no fun. I would like to thank the group, Kim, Theo, Robert, Sam, Anita, Zahra, Mike and all group members in the past for the great time I have had with them over the course. I would like to thank NSF for funding my thesis research. Last but not least, I want to thank my family and friends for their great support and encouragement throughout my graduate school. iv
6 ABSTRACT THE RHEOLOGY AND ROLL-TO-ROLL PROCESSING OF SHEAR-THICKENING PARTICLE DISPERSIONS SEPTEMBER 2017 SUNILKUMAR KHANDAVALLI B.Tech., INDIAN INSTITUTE OF TECHNOLOGY MADRAS, INDIA Ph.D., UNIVERSITY OF MASSACHUSETTS AMHERST Directed by: Professor Jonathan P. Rothstein Particle dispersions are ubiquitous in our daily lives ranging from food and pharmaceutical products to inks. Of great interest in the recent years, is the formulation of functional inks to process through potentially low-cost roll-to-roll technology to fabricate myriad flexible electronics. The formulations often contain several functional additives or rheological modifiers that can affect the microstructure, rheology and processing. The rheology of the ink formulations needs to be tuned for optimal processing to fabricate a device with desired performance. This thesis presents investigations on the rheology of particle dispersions and their processing in two roll-roll technologies, gravure printing and slot-die coating. Shear-thickening behavior is common in particle dispersions, particularly, concentrated particulate inks. We have investigated the elongational rheology of a shear-thickening particle dispersions, which is important in many printing and coating applications. The effect of polymer addition to the particle dispersions and associated interactions, with varying concentration and molecular weight, v
7 was studied. We find that, an optimal polymer concentration resulted in a strong strain-hardening behavior with a magnitude that is significantly larger than the shear-thickening magnitude. Understanding the non-linear viscoelastic behavior of materials is important, as the deformations in processing applications are typically very large. We have investigated the non-linear viscoelastic behavior of three shear thickening dispersions with different thickening mechanisms. These mechanisms include, i. flocculated by particle-polymer bridging, ii. hydrocluster formation and iii. jamming in dense suspensions. An important finding was that, the flocculated particle dispersions required a very large strain amplitudes to undergo thickening by particle-polymer bridging compared to the thickening mechanisms by hydrocluster formation and jamming. We next have investigated the processing behavior of shear thickening particle dispersions in roll-to-roll technologies. In gravure printing process, an efficient transfer of ink from gravure cell to the substrate is desired to print patterns with good print quality for desired product performance. We have conducted a study on how the rheology of a shear-thickening particle dispersion impacts the amount of ink transfer. We have observed distinct ink transfer behaviors associated with an extensional thickening, and an extensional thinning of the fluid at certain printing speeds, compared to the response of a Newtonian fluid. In a slot-die coating process, obtaining highly thin uniform films at high speeds is a challenge. Coating formulations often have a complex rheology, which can limit coating of defect free films. We have investigated the role of shear-thickening rheology on the stability of coating and the process window. The onset of shear-thickening was found to reduce the maximum web speeds for stable coating through the evolution of a ribbing defect. The presented investigations on the rheology of particle dispersions and their influence on roll-to-roll processing behavior would enable tuning of ink formulations and optimizing the process parameters towards fabrication of flexible electronics. vi
8 TABLE OF CONTENTS Page ACKNOWLEDGMENTS iv ABSTRACT v LIST OF TABLES xi LIST OF FIGURES xii CHAPTER 1. INTRODUCTION LARGE AMPLITUDE OSCILLATORY SHEAR RHEOLOGY OF SHEAR-THICKENING PARTICLE DISPERSIONS Introduction to shear-thickening dispersions Motivation Theoretical background Experimental Materials Shear rheometry Results and Discussion Steady shear rheology Small amplitude oscillatory shear rheology (SAOS) Large amplitude oscillatory shear rheology (LAOS) Fumed silica in PEO (FLOC) Fumed silica in PPG (HydroC) Cornstarch in water (JAM) vii
9 2.6 Conclusions ELONGATIONAL RHEOLOGY OF SHEAR-THICKENING FUMED SILICA NANOPARTICLES DISPERSIONS IN AN AQUEOUS POLYETHYLENE OXIDE SOLUTION Motivation Experimental Materials Rheological tools Shear rheometry Extensional rheometry Results and Discussions Shear rheology Effect of particle concentration Effect of polymer concentration Effect of polymer molecular weight Extensional rheology Effect of particle concentration Effect of polymer concentration Effect of polymer molecular weight Conclusions INK TRANSFER BEHAVIOR OF SHEAR THICKENING PARTICLE DISPERSIONS IN GRAVURE PRINTING Motivation Experimental Gravure experimental setup Test fluids Shear rheology A generalized Newtonian constitutive model Extensional rheology Results and discussion viii
10 4.4 Conclusions Acknowledgments INK TRANSFER BEHAVIOR OF SHEAR THICKENING AND VISCOELASTIC FLUIDS IN GRAVURE PRINTING: THE IMPACT OF SHEAR AND EXTENSIONAL DEFORMATION Introduction Experimental Experimental setup Test fluids Shear rheology Extensional rheology Results and discussion Ink transfer behavior of a shear thickening fluid Effect of extension Effect of shear Effect of shear and extension Ink transfer behavior of a viscoelastic fluid Effect of extension Effect of shear Effect of shear and extension Conclusions THE IMPACT OF SHEAR-THICKENING RHEOLOGY OF PARTICLE DISPERSIONS ON SLOT-DIE COATING Motivation Experimental Experimental setup Test fluids Shear rheology Extensional rheology Results and discussion ix
11 6.3.1 Newtonian fluids Non-Newtonian fluids Effect of coating gap Conclusions Acknowledgments CONCLUSIONS BIBLIOGRAPHY x
12 LIST OF TABLES Table Page 2.1 A tabulated summary of viscoelastic non-linearities of the three shear-thickening systems. The text highlighted in bold is the dominant non-linearity Rheological properties of fumed silica dispersions in an aqueous PEO The fitting parameters of shear-thickening fluid model given in Equation (4.1) for several silica nanoparticle concentrations Slot-die parameters and range of experimental operating parameters xi
13 LIST OF FIGURES Figure Page 2.1 A shear-thickening cornstarch in water suspension Steady shear viscosity as a function of shear rate for a series dispersions of ( ) FLOC, ( ) HydroC and ( ) JAM Linear viscoelastic measurements of the storage modulus (filled symbols) and loss modulus (hollow symbols) as a function of angular frequency for a series of dispersions of ( ) FLOC, ( ) HydroC and ( ) JAM Storage modulus (filled symbols) and loss modulus (hollow symbols) as a function of strain amplitude for FLOC. The data include experiments at several frequencies of ( ) 10 rad/s and ( ) 30 rad/s Elastic Lissajous-Bowditch plots, (blue) total stress and (black) elastic versus strain, for FLOC dispersion for several different strain amplitude and frequency. The raw waveforms are also co-plotted in black lines Non-linear viscoelastic measures a) G L (filled symbols), G M (hollow symbols) and b) η L (filled symbols), η M (hollow symbols) as a function of strain amplitude for FLOC. The data include experiments at frequencies of ( ) 10 rad/s and ( ) 30 rad/s a) Stiffening ratio and b) Thickening ratio as a function of strain function of strain amplitude for FLOC. The data include experiments at frequencies of ( ) 10 rad/s and ( ) 30 rad/s Viscous Lissajous-Bowditch plots, (red) total stress and (black) viscous versus strain, for FLOC dispersion for several different strain amplitude and frequency. The raw waveforms are shown in black lines Viscosity evolution under fixed shear rate for shear-thickening dispersions of ( ) FLOC at a shear rate of γ = 20 s 1, ( ) HydroC at γ = 7 s 1 and ( ) JAM (53 % Cornstarch in water) at γ = 15 s xii
14 2.10 Storage modulus (filled symbols) and loss modulus (hollow symbols) as a function of strain amplitude for HydroC. The data include experiments at several frequencies of ( ) 3 rad/s, ( ) 10 rad/s and ( ) 30 rad/s Elastic Lissajous-Bowditch plots, total stress versus strain, for HydroC dispersion for several different strain amplitude and frequency. The raw waveforms are shown in black line Non-linear viscoelastic measures a) G L (filled symbols), G M (hollow symbols) and b) η L (filled symbols), η M (hollow symbols) as function of strain amplitude for HydroC. The data include experiments at several frequencies of ( ) 3 rad/s, ( ) 10 rad/s and ( ) 30 rad/s Viscous Lissajous-Bowditch plots, total stress versus strain-rate, for HydroC dispersion for several different strain amplitude and frequency. The raw waveforms (black line) are co-plotted along with the reconstructed data a) Stiffening ratio and b) Thickening ratio as a function of strain function of strain amplitude for HydroC. The data include experiments at several frequencies of ( ) 3 rad/s, ( ) 10 rad/s and ( ) 30 rad/s Storage modulus (filled symbols) and loss modulus (hollow symbols) as a function of strain amplitude at 10 rad/s for JAM Elastic (blue) and viscous (red) Lissajous-Bowditch plots, total stress vs. strain/strain-rate for JAM suspension for several different strain amplitude at 10 rad/s. The raw waveforms (black line) are co-plotted along with the reconstructed data Non-linear viscoelastic measures a) G L (filled symbols), G M (hollow symbols) and b) η L (filled symbols), η M (hollow symbols) as a function of strain amplitude for JAM Stiffening ratio (filled symbols) and Thickening ratio (hollow symbols) as a function of strain amplitude at 10 rad/s for JAM suspension A comparison of first harmonic moduli for the three dispersions ( ) FLOC, ( ) HydroC and ( ) JAM. The data include storage modulus (filled symbols) and loss modulus (hollow symbols) as a function of strain amplitude at 10 rad/s xiii
15 2.20 A comparison of non-linear viscoelastic measures as a function of strain amplitude at 10 rad/s for the three dispersions ( ) FLOC, ( ) HydroC and ( ) JAM. The data include elastic measures, a) G L (filled symbols) and G M (hollow symbols), and dynamic viscosity measures, b) η L (filled symbols) and (hollow symbols) η M 3.1 Steady shear viscosity as a function of shear rate for a series of fumed silica dispersions in water. The data include a series of particle concentrations: ( ) 3 wt%, ( ) 4 wt% and ( ) 5 wt% Steady shear viscosity as a function of shear rate for a series of fumed silica dispersions in 0.6 wt% PEO (M w = 6 x 10 5 g/mol). The data include a series of different particle concentrations: ( ) 0 wt%, ( ) 3 wt%, ( ) 4 wt%, ( ) 4.5 wt% and ( ) 5 wt% Storage modulus (filled symbols) and loss modulus (hollow symbols) as a function of angular frequency for a series of fumed silica dispersions in 0.6 wt% PEO (M w = 6 x 10 5 g/mol). The data include a series of different particle concentrations: ( ) 3 wt%, ( ) 4 wt% and ( ) 5 wt% Steady shear viscosity as a function of shear rate for a series of 4.5 wt% fumed silica dispersions in an aqueous PEO solution (M w = 6 x 10 5 g/mol). The data include PEO concentrations of: ( ) 0.2 wt%, ( ) 0.4 wt%, ( ) 0.6 wt%, ( ) 0.8 wt% and ( ) 1 wt% Storage modulus as a function of frequency for a series of 4.5 wt% fumed silica dispersions in an aqueous PEO solution (M w = 6 x 10 5 g/mol). The data include PEO concentrations of: ( ) 0.2 wt%, ( ) 0.4 wt%, ( ) 0.6 wt% and ( ) 1 wt%. The data series for ( ) 5 wt% fumed silica nanoparticle dispersion in water without any polymer is also included Steady shear viscosity as a function of shear rate for a series of aqueous 0.6 wt% PEO solution. The data include for a series of PEO at several different molecular weights (M w ): ( ) 2 x 10 5 g/mol, ( ) 6 x 10 5 g/mol, ( ) 1 x 10 6 g/mol and ( ) 2 x 10 6 g/mol Steady shear viscosity as a function of shear rate for a series of 4.5 wt% fumed silica dispersions in an aqueous 0.6 wt% PEO solution. The data include for a series of PEO at several different molecular weights (M w ): ( ) 2 x 10 5 g/mol, ( ) 6 x 10 5 g/mol, ( ) 1 x 10 6 g/mol and ( ) 2 x 10 6 g/mol xiv
16 3.8 Storage modulus (filled symbols) and loss modulus (hollow symbols) as a function of angular frequency for a series of 4.5 wt% fumed silica nanoparticle dispersions in an aqueous 0.6 wt% PEO solution. The data include for a series of PEO at several different molecular weights (M w ): ( ) 2 x 10 5 g/mol, ( ) 6 x 10 5 g/mol and ( ) 2 x 10 6 g/mol. The data ( ) for 0.6 wt% aqueous PEO of molecular weight 2 x 10 6 g/mol without fumed silica nanoparticles is also included Diameter evolution as a function of time during a capillary breakup extensional rheology measurement for a series of fumed silica dispersions in an aqueous solution of 0.6 wt% PEO (M w = 6 x 10 5 g/mol). The data include a number of different particle concentrations: ( ) 3 wt%, ( ) 4 wt%, ( ) 4.5 wt% and ( ) 5 wt% Apparent extensional viscosity as a function of Hencky strain for a series of fumed silica dispersions in an aqueous 0.6 wt% PEO solution (M w : 6 x 10 5 g/mol). The data include several different particle concentrations: ( ) 3 wt%, ( ) 4 wt%, ( ) 4.5 wt% and ( ) 5 wt% Steady-state Trouton ratio, η E, /η o,( ) and extensional relaxation time, λ E,( ) as a function of fumed silica nanoparticle concentration in 0.6 wt% aqueous PEO solution (M w = 6 x 10 5 g/mol) Shear thickening magnitude, η max /η o,( ) and extensional hardening magnitude, η E,max /η o,( ) as a function of fumed silica nanoparticle concentration in 0.6 wt% aqueous PEO solution (M w = 6 x 10 5 g/mol) Apparent extensional viscosity as a function of Hencky strain for a series of 4.5 wt% fumed silica nanoparticle dispersions (M w = 6 x 10 5 g/mol) in water. The data include results for a number of different PEO concentrations: ( ) 0.2 wt%, ( ) 0.4 wt%, ( ) 0.6 wt% and ( ) 0.8 wt% Steady-state Trouton ratio, η E, /η o,( ) and extensional relaxation time, λ E,( ) as a function of PEO concentration (M w = 6 x 10 5 g/mol)at 4.5 wt% fumed silica concentration Shear thickening magnitude, η max /η o,( ) and extensional hardening magnitude, η E,max /η o,( ) as a function of PEO concentration (M w = 6 x 10 5 g/mol) for a 4.5 wt% fumed silica nanoparticle concentration xv
17 3.16 Apparent extensional viscosity as a function of Hencky strain for a series of 4.5 wt% fumed silica nanoparticle dispersions in an aqueous 0.6 wt% PEO solutions in water. The data include results for a number of different PEO molecular weights: ( ) 2 x 10 5, ( ) 6 x 10 5, ( ) 1 x 10 6 g/mol and ( ) 2 x 10 6 g/mol. The data ( ) for 0.6 wt% aqueous PEO of molecular weight 2 x 10 6 g/mol without fumed silica nanoparticles is also included Steady-state Trouton ratio, η E, /η o,( ) and extensional relaxation time, λ E,( ) as a function of PEO molecular weight. The concentration of aqueous PEO and fumed silica nanoparticles are at 0.6 wt% and 4.5 wt% respectively Shear thickening magnitude, η max /η o,( ) and extensional hardening magnitude, η E,max /η o,( ) as a function of PEO molecular weight. The concentration of aqueous PEO and fumed silica nanoparticles are at 0.6 wt% and 4.5 wt% respectively Schematic of gravure printing process (Source: Eckart Company) Schematic diagram of experimental setup used for idealized gravure cell study Steady shear viscosity as a function of shear rate for a series of fumed silica dispersions in PPG. The data include different particle concentrations of ( ) 7.5 wt%, ( ) 10 wt %, ( ) 15 wt% and ( ) 20 wt%. Solid lines are fits of the high-rate-thinning model of Equation (4.1) to experimental steady shear rheology data for various particle concentrations Experimental (symbols) and simulated (lines) FiSER type II extensional rheology data for different concentrations of silica nanoparticles dispersed in PPG. The concentrations include a) 20 wt% and b) 15 wt%. The imposed extension rates are ( ) 3 s 1, ( ) 4 s 1 and ( ) 5 s Terminal filament interface profiles for the 15 wt% silica nanoparticle dispersion in PPG with cavity-on-bottom. Top: computational results for comparison Terminal filament interface profiles for the 15 wt% silica nanoparticle dispersion in PPG with cavity-on-top xvi
18 4.7 Experimental (symbols) and computed (solid lines) fraction of fluid transferred from the cavity as a function of velocity for a 15 wt% fumed silica nanoparticle dispersion in PPG for two different cavity configurations. a) Cavity on bottom b) Cavity on top. (dotted line) Pickout fraction computed for Newtonian fluid with viscosity of 3.3 Pas for cavity on bottom case is also shown in Figure a Comparison of the evolution of conical filament profile at U = 100mm/s between experiment and computation for the 15 wt% silica in PPG dispersion Contour plots of viscosity and the corresponding strain rates, during conical profile evolution computed at U = 100mm/s for the 15 wt% silica nanoparticle model fluid a) Experimental (filled symbols) and b) computed (hollow symbols) pickout fraction for a series of concentrations of fumed silica nanoparticles dispersed in PPG for cavity on the bottom configuration. The data include particle concentrations of ( ) 7.5 wt%, ( ) 10 wt%, ( ) 15 wt% and ( ) 20 wt% Schematic diagram of experimental setup used for idealized gravure cell study Steady shear viscosity as a function of shear rate. The data include: a) ( ) 13Si-PPG, ( ) 8M PEO and ( ) Silicone oil Apparent extensional viscosity as a function of Hencky strain. The data include: ( ) 13Si-PPG and ( ) 8M PEO Pickout fraction as a function of extensional velocity, V z (filled symbols) and shear velocity, V x (hollow symbols). The data include: ( ) 13Si-PPG and ( ) silicone oil Terminal filament interface profiles of 13Si-PPG for imposed extensional velocity of a) V z = 35 mm/s, b) 80 mm/s, and shear velocity of c) V x = 7.5 mm/s and d) 25 mm/s Time evolution of a) pure shear-induced pickout at shear velocity of V x = 7.5 mm/s and b) pure-extension-induced pickout at an extensional velocity of V z = 10 mm/s for 13Si-PPG Schematic diagram of a) pure extensional motion, b) pure shear motion and c) mixed shear and extension motion of an idealized gravure cell imposed during the liquid transfer process xvii
19 5.8 Pickout fraction as a function of extensional velocity (filled symbols) and shear velocity (hollow symbol) for 13Si-PPG. Half-shaded symbols correspond to different fixed orthogonal velocities superimposed over varying extensional velocity. The shear velocities include: ( ) V x = 5 mm/s, ( ) 7.5 mm/s, ( ) 25 mm/s and ( ) 80 mm/s Filament interface profiles just prior to break up for the shear thickening test fluid, 13Si-PPG, for a combination of imposed extensional velocities and shear velocities Pickout fraction as a function of effective strain rate for 13SI-PPG. Filled symbols correspond to pure extension rate, γ zz = 3 V z /L i and hollow symbols correspond to pure shear rate, γ xz = V x /L i. The half-shaded symbols γ correspond to effective strain rate, γ e = 2 xz + γ 2 zz Pickout fraction as a function of extensional velocity (filled symbols) and shear velocity (hollow symbols). The data include: ( ) 8M PEO and ( ) silicone oil Pickout fraction as a function of extensional velocity (filled symbols) and shear velocity (hollow symbols) for the viscoelastic test fluid, 8M PEO. Half-shaded symbols correspond to different fixed shear velocities superimposed over varying extensional velocity. The superimposed shear velocities include: ( ) V x = 1 mm/s, ( ) 10 mm/s, ( ) 30 mm/s and ( ) 80 mm/s Terminal filament interface profiles of 8M PEO for a combination of imposed extensional velocities and orthogonal velocities Pickout fraction as a function of effective strain rate for the viscoelastic test fluid, 8M PEO. Filled symbols correspond to pure extension rate, γ zz = 3 V z /L i and hollow symbols correspond to pure shear rate, γ xz = V x /L i. The γ half-shaded symbols correspond to effective strain rate, γ e = 2 xz + γ 2 zz Schematic of slot-die coating experimental set-up Steady shear viscosity as a function of shear rate for a series of fumed silica dispersions in PPG. The data include a series of particle concentrations: ( ) 5.0 wt%, ( ) 7.5 wt% and ( ) 10 wt% xviii
20 6.3 a) Diameter evolution as a function of time during a capillary breakup extensional rheology measurements for the particle dispersions. The corresponding plots of extension rate versus Hencky strain are shown in the inset. b) apparent extensional viscosity as a function of Hencky strain for a series of fumed silica dispersions in PPG. The data include for a number of different particle concentrations: ( ) 5.0 wt%, ( ) 7.5 wt% and ( ) 10 wt% Flow rate, Q versus critical velocity for the onset of defect, V c, for different Newtonian fluids at a coating gap of 0.25 mm. The test fluids include ( ) PPG (η = 0.15 Pa.s), ( ) silicone oil (η = 5 Pa.s) and ( ) silicone oil (η = 30 Pa.s). The dotted line for silicon oil of 5 Pa.s represents the second critical velocity of the onset of ribbing defect. The coating defects beyond the critical velocities are labeled as AE for air entrainment, BL for breaklines and Rib for ribbing Images of coating for different Newtonian test fluids outside the operating window at a coating gap of 0.25 mm. The images include a) stable coating of 5 Pa.s silicone oil at Q = 30.5 mm 3 /s, V = 3.2 mm/s, b) air entrainment defect for 5 Pa.s silicone oil at Q = 30.5 mm 3 /s, V = 5.7 mm/s, c) ribbing defect for 5 Pa.s silicone oil at Q = 30.5 mm 3 /s, V = 11.8 mm/s, d) breaklines defect in 30 Pa.s silicone oil at Q = 24.9 mm 3, V = 4.1 mm/s e) air entrainment defect in 30 Pa.s silicone oil at Q = 24.9 mm 3, V = 4.8 mm/s and, f) irregular ribbing and air entrainment in PPG at Q = 22.2 mm 3 /s, V = 11.6 mm/s a) Flow rate, Q versus critical velocity for the onset of defect, V c and b) viscosity, η( γ c = V c /H), versus critical velocity for the onset of coating defect, V c for a series of fumed silica dispersions in PPG at a coating gap of 0.25 mm. The data include a series of particle concentrations: ( ) 0 wt%, ( ) 5.0 wt%, ( ) 7.5 wt% and ( ) 10 wt%. Symbols correspond to the data points presented in the operating window for different particle concentrations. The coating defects beyond the critical velocities are labeled as AE for air entrainment and Rib for ribbing Images of ribbing defect for a series of fumed silica dispersions in PPG outside the operating window for a coating gap of 0.25 mm. The images include for particle concentrations of a) 5 wt% at Q = 22.2 mm 3 /s, V = 12.7 mm/s b) 7.5 wt% at Q = 22.2 mm 3 /s, V = 14.4 mm/s and c) 10 wt% Q = 22.2 mm 3 /s, V = 13.5 mm/s xix
21 6.8 Time series of images of evolution of the ribbing instability of 10 wt% silica in PPG dispersions at a flow rate of 16.6 mm 3 /s and web speed of 6.5 mm/s at a coating gap of 0.1 mm. The images include a) stable coating at t = 0 s b) the upstream meniscus approaching the feed exit at t = 0.46 s, c-f) air fingers evolution at feed exit and propagation as ribbing downstream for t > 1.63 s Ribbing defect parameters, a) normalized mean thickness of the wet rib, d w = d/l, and b) number of wet ribs across the web, as a function of web velocity, V - V c, at a flow rate of 22.2 mm 3 /s for ( ) 7.5 wt% and ( ) 10 wt% fumed silica dispersion in PPG Normalized minimum wet thickness, t N, as a function of capillary number, Ca, for a series of test fluids. The data include a series of fumed silica dispersions in PPG with different particle concentrations: ( ) 0 wt%, ( ) 5.0 wt%, ( ) 7.5 wt% and ( ) 10 wt%. The data for Newtonian silicone oils of viscosities ( ) η = 5 Pa.s and ( ) η = 30 Pa.s is also included. The capillary number is evaluated as, Ca = η( γ c )V c /σ, where γ c = V c /H. The dotted line is a fit to the Newtonian fluid response using a viscocapillary model given in Eq a) Flow rate, Q, versus critical velocity for the onset of defect, V c, for 10 wt% fumed silica dispersion in PPG (filled symbols) and silicone oil with η = 30 Pa.s (hollow symbols) at different coating gaps and b) Shear viscosity, η( γ) versus critical velocity for the onset of defect, V c, for 10 wt% fumed silica dispersion in PPG and ( ) Newtonian silicone oil for different coating gaps. The data include for different coating gaps: ( ) 0.1 mm, ( ) 0.25 mm, ( ) 0.5 mm and ( ) 1 mm. The viscosity evaluated based on shear-rate in coating gap given by γ c = V c /H is shown in filled in symbols and for viscosity evaluated based on shear-rate in slot-gap given as γ g = 6Q/(LW 2 ) for 1 mm coating gap is shown in half shaded symbols, where W and L are slot-gap width and slot-die length. The coating defects beyond the critical velocities are labeled as AE for air entrainment, BL for breaklines and Rib for ribbing Images of coating defect at different coating gaps for 10 wt% fumed silica dispersion in PPG. The images include for coating gaps of a) 0.1 mm at Q = 22.2 mm 3 /s, V = 10.2 mm/s, b) 0.5 mm at Q = 36.1 mm 3 /s, V = 8.3 mm/s xx
22 6.13 Minimum wet thickness, t, as a function of capillary number, Ca, for 10 wt% fumed silica dispersion in PPG (filled symbols) and silicone oil with η = 30 Pa.s (hollow symbols). The data include for different coating gaps: ( ) 0.1 mm, ( ) 0.25 mm, ( ) 0.5 mm and ( ) 1 mm. The capillary number is evaluated as, Ca = η( γ)v c /σ, where the data evaluated using γ = V c/h is shown in filled symbols and for data evaluated for 1 mm coating gap using γ = 6Q/(WL 2 ) is shown in shaded symbols xxi
23 CHAPTER 1 INTRODUCTION Roll to roll coating and printing of flexible substrates is a technology of great industrial and commercial importance due to its high speeds, low cost and high throughput (1; 2). This technology enables the fabrication of thin organic, inorganic and mixed organic/inorganic with nanoscale patterns at high resolution for devices in wide applications in areas of energy, medicine and electronics. Gravure printing and slot-die coating are two important roll to roll processing technologies. Gravure is used to produce a high quality printing, with sharp and fine images. One of the challenges in gravure printing is to attain maximum ink transfer onto the substrate. Partial emptying of ink from cavities or generation of satellite drops in printing, results in a poor quality of printing and can affect device performance (3). Slot-die coating process is used to coat thin films with high uniformity at fast speeds. A stable coating is obtained only for a certain range of coating parameters (ink flow rate and substrate speed), called as coating window (4). Outside the coating window, several defects are observed such as, air entrainment, ribbing, breaklines (5; 6). It is desired to have a coating window as wide as possible. Often, obtaining thinner stable films at faster speeds is a challenge (7). Most investigations on the ink transfer performance in gravure printing (8; 9) and the stability of slot die coating process are often for the case of Newtonian fluids (10; 7). However, materials formulations processed through roll to roll methods for myriad applications can often have non- Newtonian rheological behavior (11; 12; 13). However, only relatively few studies are dedicated to roll-to-roll processing of non-newtonian fluids. These studies have shown that fluid rheology can strongly influence printing and coating behaviors (14; 15; 16). In this thesis we present in- 1
24 vestigations on the role of non-newtonian fluid rheology in gravure printing and slot-die coating processes. Particle dispersions are common in many applications in our daily life. Often ink formulations for flexible electronics are concentrated dispersions (11; 12), and can potentially exhibit shear thickening behavior. We use shear-thickening particle dispersions as a model non-newtonian fluid in the investigations on the role of fluid rheology in roll to roll processing. Understanding the shear-thickening behavior in particle dispersions is of immense interest to industry and academia, due to their intriguing mechanisms (17; 18; 19). We first present investigations on two rheological behaviors of shear-thickening particle dispersions that are relevant to many processing applications, not limited to roll-to-roll processing methods. The second chapter, is a study on the non-linear viscoelasticity of three shear thickening particle dispersions which exhibit different thickening mechanisms. The non-linear viscoelastic behaviors were compared and contrasted between the three systems. The third chapter is a study on the elongational rheology of fumed silica dispersions in an aqueous polyethylene oxides solutions. The effect of particle concentration, polymer concentration and polymer molecular weight on the elongation behavior, while comparing with the shear rheological behavior was studied. In the fourth and fifth chapters, the investigation of the impact of shear-thickening rheology on the liquid transfer behavior in gravure printing behavior was presented. The gravure printing flow during the ink transfer modeled both as extension and shear deformation cases in our experiments was presented. In the final chapter, the role of shear-thickening rheology on the maximum coating speeds for stable coating and minimum wet coating thickness was presented. 2
25 CHAPTER 2 LARGE AMPLITUDE OSCILLATORY SHEAR RHEOLOGY OF SHEAR-THICKENING PARTICLE DISPERSIONS 2.1 Introduction to shear-thickening dispersions Particle dispersions are ubiquitous in every day life. These rheologically complex fluids are found in a host of materials ranging from detergents, paints, food, cements, and pharmaceuticals. Shear-thickening dispersions are one interesting class of fluids, which are of enormous amount of interest in both academia (17) and industry (19). In a shear-thickening fluid, the viscosity abruptly increases with increasing shear rate. A classic example is the cornstarch and water mixture known as oobleck. Shear thickening can often have consequences in fluid handling causing damage in industrial processes by breaking equipment or fouling spraying equipment and pumps. Still when properly designed and handled, shear-thickening fluids have been exploited for a wide range of innovative applications. Examples of these applications include developing bullet proof soft body armor (20), machine mounts and damping devices (21; 22) and driving fluids for enhanced oil recovery (23). Shear-thickening in particle dispersions can occur by various mechanisms depending on the range of particle volume fraction (24) and the nature of solvent phase (25; 26). In Brownian dispersions stabilized by electrostatic or steric forces, for particle concentrations ranging from small to medium particle volume fractions, shear-thickening occurs due to the formation of hydroclusters (19). These dense particle clusters of tightly packed particles are held together by hydrodynamic interactions (27; 28). Beyond certain shear-rate, the hydrodynamic lubrication forces dominate all the other colloidal forces resulting in the formation of hydroclusters. The resulting anisotropy in 3
26 Figure 2.1: A shear-thickening cornstarch in water suspension the colloidal dispersions gives rise to large stress fluctuations and as a result large shear viscosities (29). The magnitude and the critical shear-rate for the onset of the shear-thickening, is influenced by several factors such as the thickness of polymer grafted layer, polymer molecular weight, particle size, particle surface chemistry and the viscosity of solvent medium (30; 31; 32; 33; 34). Partial stabilization of dispersion by the adsorption of large molecular weight polymer can also cause shear-thickening. The free ends of the adsorbed polymer chains can interact with the neighboring particles by bridging to one or more particles. During flow, the shear fields facilitate interaction between polymer chains and particles causing flocculation of the particles by bridging with polymer chains. The formation of such flocculated particle clusters causes shear-thickening (26). The shear-thickening behavior depends on a number of factors including, the particle concentration, size, polymer concentration and molecular weight (26; 35; 36). In dense non-brownian suspensions, close to random packing fraction, shear-thickening is due to dilatancy and eventual jamming that can result in a solid-like material (24; 37; 38; 39). To accommodate flow, the particles dilate due to crowding/confinement via the formation a dense jammed network of particle clusters. The dilatancy in hard-sphere dense suspensions is accompanied by a positive normal stress difference (N 1 ) (40; 41), distinct from continuous shear-thickening due to pure hydrodynamic forces which exhibit negative normal stress difference (42; 43). Large 4
27 stresses due to particle contact/frictional forces associated with the jammed structure are the cause for shear-thickening (24; 37). These jammed structures are dynamic, continuously reforming and breaking up, and are manifested by large stress fluctuations (44) and the discontinuous behavior in shear-thickening (45). 2.2 Motivation There has been immense interest in understanding the origins of shear-thickening behavior for various types of particle dispersions. The shear-thickening mechanism in Brownian and non- Brownian dense dispersions has been investigated extensively through various techniques including experiments, simulations and light scattering (24; 26; 46; 47; 27). However, studies on viscoelasticity of shear-thickening dispersions, especially the non-linear shear behavior at large deformations, are limited to steady-shear measurements and the measurements of the fundamental frequency moduli in oscillatory shear. Dynamic oscillatory shear rheology studies on Brownian steric or electrostatically stabilized systems, showed strong strain-stiffening behavior in the elastic moduli, G 1, in addition to strain-thickening in the loss moduli, G 1. The critical strain, in addition to frequency/strain-rate, was found to affect the onset and magnitude of strain-stiffening/thickening (25; 48; 49; 50) with the data following the Delaware-Rutgers rule. For the case of particle dispersions partially flocculated by polymer bridging, viscoelastic studies both linear (51; 35) and non-linear (36; 52), indicated that for these systems elasticity has an important role in the shearthickening mechanism. There have been several studies examining the non-linear viscoelasticity of dense suspensions, although none that have been shown to shear-thicken through steady shear rheology measurements (53; 54; 55; 56; 57). In transient shear and oscillatory shear measurements on dense suspensions, a strong non-linear response involving a stress undershoot, associated with microstructural rearrangements upon shear reversal has been observed (56; 57). Nam et al. (54) have conducted LAOS 5
28 experiments on concentrated suspensions of polymethylmethacrylate (PMMA) particles dispersed in Newtonian fluids, and have examined the effect of various factors such as particle volume fractions, medium viscosity and particle size on the non-linear behavior. The suspensions were found to show strong strain-stiffening behavior and the behavior has been attributed to shear-induced collision of particles (54). The critical strain amplitude for the onset of strain stiffening was found to decrease with increasing particle volume fraction, but was found to be independent of other factors such as, the medium viscosity, imposed angular frequency, and particle size (54). There have also been studies on shear-thickening suspensions through shear-cessation and normal stress difference measurements examining the role of elasticity associated with the shear-induced jammed structures and liquid to solid-like transition (44; 58; 59). The non-linear viscoelasticity studies of shear-thickening dispersions discussed to this point have been limited only to variations of the moduli associated with the fundamental harmonics of the imposed oscillation frequency. The higher harmonic contributions are often ignored due to their relatively low magnitudes (52; 25). However, the viscoelastic non-linearities due to the higher harmonics can offer important insights into the microstructural and physical mechanisms responsible for the non-linear rheological response. Additionally, even in the absence of a clear understanding of the physics, often a rheology fingerprint behavior can be ascribed/identified to specific material system through LAOS measurements (60; 61). Recent developments in nonlinear rheology enabled tools to characterize the large amplitude oscillatory shear behavior through meaningful material parameters and presentation methods (60; 61; 62). 2.3 Theoretical background In dynamic oscillatory shear rheology, a sinusoidal strain (or stress) signal is imposed on a material given as, γ(t) = γ o sin(ω 1 t), (2.1) 6
29 where γ 0 and ω 1 are input strain amplitude and frequency respectively. For small strain amplitudes, the resulting stress response is also sinusoidal. The linear viscoelastic response is represented as σ(t) = σ o sin(ω 1 t + δ 1 ). (2.2) The above equation can be rewritten as σ(t) = γ o [G 1(ω 1 )sin(ω 1 t) + G 1 (ω 1 )cos(ω 1 t)], (2.3) where the in-phase and out-of-phase components of the stress response are termed as storage modulus, G 1 and loss modulus, G 1. When the input strain amplitude is increased beyond a critical value, the stress response becomes non-linear and can be represented as σ(t,γ,ω) = Σσ n sin(nω 1 t + δ n ), (2.4) where additional higher harmonic stress components (n > 1) are present in the stress response. Therefore, the G 1 and G 1 based on fundamental harmonic do not fully describe the mechanical behavior beyond the linear viscoelastic limit and the higher harmonics cannot be ignored. One common method to examine a non-linear response is by performing Fourier transform and examining the frequency spectrum (63; 64). The intensity of higher stress harmonics harmonics are an indication of degree of non-linearity. This method has been a valuable tool for characterizing non-linear behavior for several materials such as, polymer melts, filled rubbers (65; 66), suspensions and emulsions (67; 68; 69; 70). Only odd harmonics appear in the non-linear region, and the appearance is assumed due to odd symmetry with respect to the directionality of shear strain (71). The appearance of even harmonics in Fourier spectrum can be attributed to the presence of secondary flows (72), asymmetric wall slip or edge effects (73). However, Fourier transform rheology lacks a direct physical interpretation of the material response. Another common method for 7
30 investigating non-linear response is graphical approach, where stress versus strain curves known as Lissajous-Bowditch curves are studied. The non-linear behavior of material can be identified from the shape of Lissajous-Bowditch or stress versus strain curve, as follows: linear - purely elastic; circle - purely viscous; ellipse - linear viscoelastic and distorted ellipse - non-linear viscoelastic. Thus, the progressive transition from linear to non-linear viscoelastic nature of the material with strain amplitude can be studied from the graphical representation. The total stress can be further be decomposed into elastic and viscous components through simple algebraic manipulations using even and odd nature of the trignometric functions (74). Extending Cho s stress decomposition (74) method, Ewoldt et al. (60) proposed more physically meaningful non-linear viscoelastic measures through representation of elastic and viscous stresses through orthogonal Chebyshev polynomials of the first kind. Ewoldt et al. (60) have also have defined non-linear viscoelastic moduli based on local material response at small and large instantaneous strains/strain-rates in an oscillatory cycle (60). The non-linear elastic material parameters are given in terms of Fourier coefficients as, G M = dσ dγ = γ=0 ng n (2.5) n=odd Where G M G L = σ γ = G n( 1) (n 1)/2 (2.6) γ=±γ0 n=odd is dynamic modulus measured at minimum strain, where the instantaneous strainrates approach large and G L is a large strain dynamic modulus. These measures can be obtained from Fourier coefficients or from numerical differentiation of the material response. In the linearviscoelastic regime, these measures reduced to first harmonic moduli, G M = G L = G 1 (ω). Similarly the corresponding non-linear viscous measures are given as, η M = dσ d γ = 1 γ=0 ω n ng n ( 1) (n 1)/2 (2.7) n=odd 8
31 η L = σ γ = 1 γ=± γ0 ω n Where η M is dynamic viscosity measured at minimum strain-rate and η L G n (2.8) n=odd is dynamic viscosity measured at maximum strain-rate. From these measures, intra-cycle viscoelastic non-linearities can also be quantified. The elastic non-linearity is quantified as strain-stiffening ratio, S, given by, S = G L G M G L (2.9) The elastic non-linearity is strain-stiffening for the case when S > 0 and is strain-softening when S < 0. While the corresponding intra-cycle viscous non-linearity, quantified as shear-thickening ratio, T, is given by, T = η L η M η L (2.10) For the case when T > 0, the behavior is intra-cycle shear-thinning and shear-thinning when T < 0. A detailed description of the non-linear viscoelastic measures can be found in (61; 60) 2.4 Experimental Materials Hydrophilic fumed silica 200) with specific surface area of 200 m 2 /g and primary particle size 12 nm was graciously supplied by Degussa. Polyethylene oxide (PEO) of various molecular weight (M w = 600 kg/mol and 2000 kg/mol) were purchased from Aldrich Chemicals. A fumed silica in PEO dispersion (FLOC) was prepared according to (35). A fumed silica dispersion in polypropylene glycol (M w = 1000 g/mol, Aldrich Chemicals) (HydroC) was prepared according to Chellamuthu et al. (18). Cornstarch was purchased from a local grocery store and the cornstarch suspension in water (JAM) was prepared according to Bischoff White et al. (75). 9
32 2.4.2 Shear rheometry Shear rheology was conducted on a stress-controlled TA DHR-3 rheometers using a 40 mm 2 aluminum cone-plate geometry at a constant temperature of 23 C temperature. A solvent trap was used to prevent sample evaporation during measurements. The samples were pre-sheared before conducting any rheological measurements to erase any shear history during sampling preparation and handing and allowed to rest for few minutes to reach equilibrium (76; 34; 35). Steady shear rheological measurements were conducted in the shear rate range of 0.01 to 100 s 1. The small amplitude oscillatory shear tests were conducted in the frequency range 1 to 100 rad/s, with a fixed strain amplitude chosen to place the measurements well within the linear viscoelastic region. The large amplitude oscillatory shear measurements were conducted for strain amplitude range between 0.01 to 1000 % for different frequencies between 3 and 30 rad/s. The high frequencies were used to insure that the solutions were probed at shear rates where shear thickening was observed in the steady shear measurements. A sufficient number of oscillatory cycles were run, ranging from 30 to 80, to ensure a steady-state measurement. The non-linear viscoelastic material parameters such as, the Lissajous-Bowditch plots and the non-linear viscoelastic parameters such as minimum/maximum-strain dynamic moduli and minimum/maximum-rate dynamic viscosity, were obtained using the Fourier-transform software application of the TA DHR-3 rheometer. The FT-Rheology application processes the raw torque signal and the extracts non-linear parameters from the reconstructed/filtered signal. The reconstructed stress signal was double checked with the steady raw stress signal to check for poor reconstruction of any noisy signal. The data points affected by noise or inaccurate analysis of the TRIOS software were either excluded from the manuscript or the non-linear viscoelastic parameters were recalculated from the Lissajous- Bowditch plots. As the LAOS measurements were performed on a stress controlled rheometer, the data can be affected by inertia (77). An oscillatory mapping of the geometry was performed to compensate for the influence of instrument inertia. However, when the torque generated by instrument inertia is large, the rheometer s compensation routines are not sufficient to completely 10
33 eliminate the effect of instrument inertia. To insure high quality data, the relative ratio of inertia torque to sample torque, T inertia /T sample, was checked for each experimental data point. When the ratio of inertial torque to sample torque was greater than 20 %, T inertia /T sample > 20 %, the data was discarded. Merger and Wilhelm (77) demonstrated that, beyond a ratio of 20 %, the sample response is affected by instrument inertia. However, below a ratio of 20 %, quantitative agreement between measurements on strain controlled and stress controlled rheometers can be achieved. Any experimental artifacts such as wall slip and edge fracture in measurements are identified by examining the presence of even harmonic intensity which are sensitive to asymmetric artifacts (73). For all cases, the magnitude of even harmonics were found to be very small. For FLOC and HydroC dispersions, the intensity of even harmonics relative to the fundamental (I 2 /I 1 ) were found to be less than 1 % and for JAM the even harmonics (I 2 /I 1 ) were found to be less than 7 %. All LAOS measurements were repeated several times to ensure consistency in the trends and are reproducible. 2.5 Results and Discussion Here we present a non-linear viscoelasticity investigation of three particle dispersions which shear-thicken by three different mechanisms. The first material system is fumed silica nanoparticles (4.5 wt%) dispersed in aqueous PEO (0.4 wt%) of M w = 600 kg/mol (FLOC). This system shear-thickens due to shear-induced formation of large particle clusters flocculated by polymer bridging (35; 26). The second system is fumed silica nanoparticles (20 wt%) dispersed in polypropylene glycol (HydroC). Shear-thickening in this system occurs due to the formation of hydroclusters where the lubrication hydrodynamic forces play an important role in shear-thickening (19; 18). The third system is a dense suspension of cornstarch in water (56 wt%) (JAM). This system shear-thickens by jamming mechanism, where the frictional/contact forces of the jammed particle clusters are responsible for the increase in viscosity (37; 38). The shear-thickening mechanisms of the three systems will be discussed in more detailed in the next section. The sample 11
34 S h e a r V is c o s ity, [P a.s ] S h e a r R a te [s -1 ] Figure 2.2: Steady shear viscosity as a function of shear rate for a series dispersions of ( ) FLOC, ( ) HydroC and ( ) JAM. preparation and the experimental protocol for rheology characterization was described in the sections and The three systems are labeled based on their shear-thickening mechanisms to make the interpretations easier. The objective of this study is to identify the viscoelastic nonlinearities associated with each mechanisms and compare/contrast between the three mechanisms. Prior to studying LAOS behavior, steady-shear and small amplitude oscillatory shear rheology behavior will be presented Steady shear rheology The steady-shear rheology of three particle dispersions, FLOC, HydroC and JAM are shown in Figure 2.2. The three dispersions exhibited shear-thickening by more than an order of magnitude at imposed shear rates between 2 s 1 and 10 s 1. The different mechanisms by which the three dispersions shear thicken have been well studied in literature. For the case of FLOC colloidal dispersion, the higher molecular weight PEO polymer has a strong affinity for adsorption onto the fumed silica surface through hydrogen bonded interactions (78). Under shear flow, the free ends of polymer chains adsorbed onto particles at equilibrium can adsorb onto more neighboring particles and can create a larger particle clusters bridged by polymer chains. Beyond a critical shear-rate 12
35 the increase in the cluster formation due to bridging of more particles by polymer chains induced by shear fields, results in a strong increase in the viscosity and the observed shear-thickening (26; 35; 36). The second system, HydroC colloidal dispersion, shear-thickens by hydrocluster mechanism (19). At very low Peclet number, Pe = a 2 γ/d 0, the microstructure relaxes through Brownian mechanism. Here D 0 is the diffusion coefficient of the particles in solution and a is the particle size. As the Peclet number is increased, the hydrodynamic forces begin to compete with Brownian. Beyond a critical increase in Peclet number, when the hydrodynamic forces predominate over Brownian, can result in the formation of large anisotropic hydroclusters. These hydroclusters are associated with large lubrication hydrodynamic forces and cause shear-thickening (19; 25; 18). For the case of JAM, a dense non-brownian suspension, the shear-thickening behavior is due to dilatancy and eventual jamming (24; 37; 38; 39). Due to confinement of the particles within boundaries and crowding at high volume fractions, the particles jam into the neighbouring particles inorder to accommodate the imposed flow. The resulting large stresses associated with the frictional forces due to particle contacts when jammed, are the cause for shear-thickening (24; 37; 38) Small amplitude oscillatory shear rheology (SAOS) The SAOS behavior is compared between the three shear-thickening dispersions in Figure 2.3. The FLOC exhibited a gel-like response, where the storage modulus, G 1, and loss modulus, G 1, were approximately independent of frequency. The predominantly elastic response is likely the result of gel-like microstructure at equilibrium resulting from the hydrogen bonded interactions between PEO polymer and silica groups of nanoparticles (35; 79). The HydroC dispersion, in contrast to FLOC, exhibited predominantly viscous-like behavior, where the loss modulus was consistently larger than the elastic modulus, G 1 > G 1, in the frequency range tested. Both the elastic and loss modulus scale approximately with a similar power law with frequency. These observations were consistent with the literature (80). The JAM suspension exhibited approximately 13
36 S to ra g e a n d L o s s M o d u lu s, G ' a n d G " [P a ] F re q u e n c y, ω [ra d /s ] Figure 2.3: Linear viscoelastic measurements of the storage modulus (filled symbols) and loss modulus (hollow symbols) as a function of angular frequency for a series of dispersions of ( ) FLOC, ( ) HydroC and ( ) JAM. a frequency independent behavior, with G 1 > G 1 indicating predominantly elastic behavior. At low concentrations the microstructure formed in particle dispersions typically relax through Brownian motion at equilibrium (81). However, because of the high particle volume fraction in the cornstarch-water (φ = 0.45), the relaxation time scales increase as the diffusivity of the particle is reduced, τ D 1 0, due to increased confinement between neighboring particles. The result is an increased elasticity as observed in Figure 2.3 and seen in the literature (81; 82) Large amplitude oscillatory shear rheology (LAOS) Fumed silica in PEO (FLOC) The large amplitude oscillatory shear behavior of fumed silica in PEO (FLOC) at different frequencies ranging from 10 to 30 rad/s is shown in Figure 2.4. The angular frequencies were chosen to ensure that the non-linear response of the fluid would be well into the shear-thickening regime observed in Figure 2.2. The storage, G 1, and loss modulus, G 1, were found to be independent of percent strain until about two or three percent strain, indicating linear viscoelastic behavior below that point. The storage modulus was approximately two orders of magnitude larger than the loss 14
37 G ' 1 a n d G " 1 [P a ] S tra in [% ] Figure 2.4: Storage modulus (filled symbols) and loss modulus (hollow symbols) as a function of strain amplitude for FLOC. The data include experiments at several frequencies of ( ) 10 rad/s and ( ) 30 rad/s. modulus indicating predominantly elastic behavior which is consistent with small amplitude oscillatory shear behavior shown in Figure 2.3. Beyond the linear viscoelastic limit (LVE), the elastic modulus was observed to decline with increasing strain, whereas the loss modulus exhibited a weak overshoot before declining at large strains. Such plastic non-linear behavior at large amplitudes is typical of weak colloidal gels (83) even those that are shear-thinning. The first-harmonic moduli response does not appear to be universal for colloidal systems flocculated by polymer bridging, some of those systems which shear-thicken in steady-shear by the same shear-induced bridging mechanism have been shown to possess an increased G 1 and G 1 in the non-linear region (52). The likely cause for the differences in response will be discussed in the later sections. The LAOS response for different frequencies showed no significant quantitative or qualitative differences in the trends in G 1 and G 1 behavior with increasing strain amplitude. In the non-linear viscoelastic region, higher harmonic stresses arise (64). Although, the dominant response was found to be from the first harmonic, additional insights can be gained from the response due to higher harmonics contribution. The non-linear response of FLOC can be visualized graphically from the elastic Lissajous-Bowditch plots. These plots of stress versus strain are 15
38 Strain [%] Stress Frequency, [rad/s] 10 rad/s 30 rad/s = 1 %, max = 3.7 Pa 1 %, 3.6 Pa Strain 2.8 %, 7.4 Pa 1.7 %, 5.5 Pa 4.7 %, 5.5 Pa 2.8 %, 7.7 Pa 7.8 %, 4.9 Pa 4.7 %, 7.1 Pa 12.5 %, 4.3 Pa 6 %, 6.3 Pa 21.6 %, 3.9 Pa 7.8 %, 5.6 Pa Figure 2.5: Elastic Lissajous-Bowditch plots, (blue) total stress and (black) elastic versus strain, for FLOC dispersion for several different strain amplitude and frequency. The raw waveforms are also co-plotted in black lines. 16
39 a ) G ' L a n d G ' M [P a ] S tra in [% ] b ) 5 0 M a n d L [P a.s ] S tra in [% ] Figure 2.6: Non-linear viscoelastic measures a) G L (filled symbols), G M (hollow symbols) and b) η L (filled symbols), η M (hollow symbols) as a function of strain amplitude for FLOC. The data include experiments at frequencies of ( ) 10 rad/s and ( ) 30 rad/s. 17
40 presented in Figure 2.5. As expected, in the linear viscoelastic limit at small strains, the resulting elastic Lissajous-Bowditch plots were found to be straight lines. In the non-linear regime, the plots become distorted due to the contribution of higher order harmonics. The non-linearities of FLOC were further examined through the local viscoelastic material properties quantified within an oscillatory cycle. The minimum-strain dynamic moduli, G M, and large-strain dynamic moduli, G L, are shown in Figure 2.6a as a function of strain amplitude. In the LVE region, these measures reduce to first-harmonic storage modulus as expected. In the nonlinear region, both G M and G L were found to decrease with increasing strain amplitude for all frequencies, indicating a softening behavior with both increasing imposed strain and strain rate within an oscillatory cycle. The minimum-strain (maximum-strain rate) modulus, G M, was found to decrease more quickly than the large-strain (minimum-strain rate) modulus, G L, with increasing strain amplitude. This suggests that the elastic non-linearity of FLOC is dominated by strain-ratesoftening of the elastic modulus. The strain-rate-softening behavior is likely due to alignment of the microstructure to the flow fields. The elastic non-linearities were further examined through the measure, stiffening ratio, S, plotted as a function of applied strain amplitude in Figure 2.7a. In the linear viscoelastic limits, where the elastic Lissajous-Bowditch plots look like straight lines, the stiffening ratio is S 0 as expected. As described in the theoretical background section, the stiffening ratio given by equation eq9 describes whether the elastic modulus softens, S < 0, or stiffens, S > 0, with increasing strain within an oscillatory cycle. In the non-linear region, beyond a strain of 4 %, the LAOS behavior of the FLOC within an oscillatory cycle was found to be strain-stiffening, S > 0. This can be observed in the elastic Lissajous-Bowditch plot as a sharp upturn in the stress at large strains. However, the behavior is in contrast to the large-strain dynamic moduli, G L, which was found to soften with increasing imposed strain amplitude. This discrepancy is the result of the definition of the stiffening ratio and can lead to misinterpretation of the results. The stiffening ratio can be greater than zero, S > 0, if the large strain modulus, G L, stiffens more quickly than the minimum 18
41 a ) S tiffe n in g R a tio, S S tra in [% ] b ) T h ic k e n in g R a tio, T S tra in [% ] Figure 2.7: a) Stiffening ratio and b) Thickening ratio as a function of strain function of strain amplitude for FLOC. The data include experiments at frequencies of ( ) 10 rad/s and ( ) 30 rad/s. 19
42 strain modulus, G M, or if G M softens more quickly than G L. Thus S > 0 can be interpreted as either strain-hardening or strain-rate softening of the material and only through examination of G L and G M can the distinction be made and the interpretation of the data be valid. In an oscillatory cycle, the strain and strain-rate vary orthogonally. As a result, within an oscillatory cycle, the strain rate goes to zero as the strain is maximized and vice versa. The elastic stress response within a given cycle can thus be affected by either the varying strain and/or the varying strain-rate. For the case of FLOC, based on the measurements of G L and G M, the dominant nonlinearity within the cycle is a softening with increasing strain-rate. Therefore, the non-linearity of FLOC within a cycle can be interpreted as strain-rate-softening rather than strain-stiffening. Similarly, the corresponding viscous non-linearities can be examined graphically from viscous Lissajous-Bowditch plots. These stress versus strain-rate plots are presented in the Figure 2.8. The viscous non-linearity quantified through the measures, minimum strain-rate dynamic viscosity, η M, and the large strain-rate dynamic viscosity, η L, are also shown in Figure 2.6b. Both the measures showed mild thickening behavior at medium strain amplitudes and thinning behavior at large strain amplitudes. However, the non-linearity of η L was found to be stronger than η M suggesting predominant strain-rate thickening at moderates strains followed by a strain-rate thinning behaviors with increasing strain amplitude. The viscous non-linearities are quantified using the shear-thickening ratio, T, and are presented in Figure 2.7b. As described in the theoretical background section, the shear-thickening ratio given by equation eq10 describes whether the viscosity thins, T < 0, or thickens, T > 0, with increasing strain rate. The shear thickening ratio of the FLOC was found to exhibit the same shear-thickening and shear-thinning behavior with increasing strain amplitude as η M and η L. The shear-thickening behavior of the FLOC at medium strain amplitudes is commonly attributed to the transients present at the start-up for colloidal systems (83). Such behavior could be related to the break down of gel-like microstructure built up at equilibrium/rest as has been observed in steady 20
![Strain [%] Stress Frequency, [rad/s] 10 rad/s 30 rad/s = 1 %, max = 3.7 Pa 1 %, 3.6 Pa Strain-rate 2.8 %, 7.4 Pa 1.](/docs-images/85/91914662/images/43-0.jpg "7 %, 5.5 Pa 4.7 %, 5.5 Pa 2.8 %, 7.7 Pa 7.8 %, 4.9 Pa 4.7 %, 7.1 Pa 12.5 %, 4.3 Pa 6 %, 6.3 Pa 21.6 %, 3.9 Pa 7.")
 total stress and (black) viscous versus strain, for FLOC dispersion for")
43 Strain [%] Stress Frequency, [rad/s] 10 rad/s 30 rad/s = 1 %, max = 3.7 Pa 1 %, 3.6 Pa Strain-rate 2.8 %, 7.4 Pa 1.7 %, 5.5 Pa 4.7 %, 5.5 Pa 2.8 %, 7.7 Pa 7.8 %, 4.9 Pa 4.7 %, 7.1 Pa 12.5 %, 4.3 Pa 6 %, 6.3 Pa 21.6 %, 3.9 Pa 7.8 %, 5.6 Pa Figure 2.8: Viscous Lissajous-Bowditch plots, (red) total stress and (black) viscous versus strain, for FLOC dispersion for several different strain amplitude and frequency. The raw waveforms are shown in black lines. 21
44 S h e a r V is c o s ity, [P a.s ] S tra in [% ] Figure 2.9: Viscosity evolution under fixed shear rate for shear-thickening dispersions of ( ) FLOC at a shear rate of γ = 20 s 1, ( ) HydroC at γ = 7 s 1 and ( ) JAM (53 % Cornstarch in water) at γ = 15 s 1. shear (19; 84). The strain-rate thinning at large strain amplitudes could be due to orientation or yielding of microstructure to the flow fields (26; 84). If the viscous non-linearities of the FLOC observed through LAOS are compared with the steady-shear measurements in Figure 2.2, a shear-thickening of the viscosity is expected for shearrates between 4 s 1 and 20 s 1. However, as seen in Figures 2.6b, 2.8 and 2.7b, this is clearly not the case. The inconsistency between the steady shear and LAOS measurements indicates a sensitivity of the associated shear-thickening mechanism to the instantaneous shear rates and strains imposed during the oscillatory cycle. Unlike steady-state deformation, the shear rates are not constant throughout a LAOS experiment. This can be demonstrated with a simple stress growth experiment. In Figure 2.9 viscosity is plotted against accumulated strain for our three fluids at a constant shear rate. At shear-rates where shear-thickening occurs, the viscosity of FLOC grows to a steadystate value only after a significant amount of strain is accumulated. This suggests that a minimum strain, in addition to a minimum shear-rate, is necessary for shear-thickening by the associated mechanism for these nanoparticle-polymer systems. In fact, the strains needed to achieve shear thickening for the HydroC are so large, γ > 100,000 %, that they cannot be achieved in LAOS. At smaller strains, the steady-shear viscosity of FLOC solution thins with increased strain. By 22
45 comparison, the strains needed to induce shear-thickening for both the HydroC or JAM are two or three orders of magnitude smaller and easily obtainable in LAOS. Interestingly, the first-harmonic moduli for some colloidal systems flocculated by polymer bridging which also shear-thicken in steady-shear by the same shear-induced bridging mechanism, show a contrasting increase in both the elastic and viscous modulus in the non-linear deformation range (52). These differing observations could be due to the difference in the critical strains associated with each material system required for shear-thickening to occur, however, the experiments of Otsubo do not contain the start up data needed to make this hypothesis conclusive. To summarize the LAOS behavior of FLOC, the system exhibited both strain softening and strain-rate softening of the elastic non-linearity. The strain-rate softening behavior appeared to be dominant over strain-softening response resulting in a positive stiffening ratio. The strain-rate softening behavior is likely due to yielding or break down of the microstructure. The viscous nonlinearity exhibited mild strain-rate thickening at medium strain-rates which could be due to dissipation of the equilibrium gel like microstructure. At large strain amplitudes, the behavior evolved to strain-rate thinning associated with microstructure yielding. In comparison to steady-shear, shear-thickening behavior by shear-induced mechanism was not observed in large amplitude oscillatory. The stress growth measurements indicated that very large strain amplitudes are required for shear-thickening to occur by such mechanism too large in fact to be achieved in LAOS Fumed silica in PPG (HydroC) The amplitude sweeps of the solution of fumed silica in PPG (HydroC) for angular frequencies ranging from 3 to 30 rad/s are shown in Figure In the LVE region, the loss modulus were found to be greater than storage modulus, G 1 > G 1, which indicates a predominantly viscous behavior. With increasing strain amplitude, both G and G initially showed strain softening/strainrate thinning behavior. This behavior became weaker as the frequency was increased. The strain softening/strain-rate thinning behavior could be due to alignment of the microstructure to the flow 23
46 G ' 1 a n d G " 1 [P a ] S tra in [% ] Figure 2.10: Storage modulus (filled symbols) and loss modulus (hollow symbols) as a function of strain amplitude for HydroC. The data include experiments at several frequencies of ( ) 3 rad/s, ( ) 10 rad/s and ( ) 30 rad/s. fields, similar to the shear-thinning regime observed in steady-shear behavior shown in Figure 2.2. Beyond a critical strain amplitude, both G 1 and G 1 were found to dramatically increase by more than an order of magnitude with increasing strain indicating both a strong strain-stiffening and a strong strain-rate thickening behavior (25; 18). The critical strain required for the onset of strainstiffening/thickening was seen to decrease with increasing angular frequency. This is likely due to an increasing Peclet number with increasing frequency and increased importance of the imposed flow tresses compared to diffusion. The elastic non-linearity of HydroC can be examined through the elastic Lissajous-Bowditch plots shown in Figure The corresponding quantified non-linear elastic measures, the minimumstrain dynamic moduli, G M, and the large-strain dynamic moduli, G L are shown in Figure 2.12a. At small strain amplitudes, the magnitudes of G M and G L were approximately equal indicating little non-linearity. Beyond a critical strain amplitude, both the G M and G L were found to increase dramatically with strain amplitude. This indicates a strong strain-stiffening and strain-rate-stiffening behavior similar to what was observed for the first-harmonic of the elastic moduli. Throughout the stiffening region, the magnitude of G M was found to be slightly larger than G L. This stiffening within an oscillatory cycle can be observed graphically from the distorted elastic Lissajous- 24
![Strain [%] Stress Frequency, [rad/s] 3 rad/s 10 rad/s 30 rad/s = 6.3 %, max = 0.7 Pa 2.5 %, 0.8 Pa 2 %, 1.1 Pa Strain 25 %, 2.6 Pa 10 %, 3.2 Pa 4 %, 2.](/docs-images/85/91914662/images/47-0.jpg "3 Pa 63 %, 6.3 Pa 16 %, 5.0 Pa 8 %, 4.6 Pa 150 %, 15 Pa 25 %, 7.6 Pa 10 %, 5.")

47 Strain [%] Stress Frequency, [rad/s] 3 rad/s 10 rad/s 30 rad/s = 6.3 %, max = 0.7 Pa 2.5 %, 0.8 Pa 2 %, 1.1 Pa Strain 25 %, 2.6 Pa 10 %, 3.2 Pa 4 %, 2.3 Pa 63 %, 6.3 Pa 16 %, 5.0 Pa 8 %, 4.6 Pa 150 %, 15 Pa 25 %, 7.6 Pa 10 %, 5.6 Pa 250 %, 27 Pa 40 %, 12 Pa 89 %, 3620 Pa 549 %, 394 Pa 150 %, 2510 Pa 111 %, 8154 Pa 641 %, 6309 Pa 166 %, 5787 Pa 129 %, Pa 700 %, 7156 Pa 179 %, 7052 Pa 138 %, Pa Figure 2.11: Elastic Lissajous-Bowditch plots, total stress versus strain, for HydroC dispersion for several different strain amplitude and frequency. The raw waveforms are shown in black line. 25
48 G ' M a n d G ' L [P a ] S tra in [% ] ' a n d ' L [P a.s ] S tra in [% ] Figure 2.12: Non-linear viscoelastic measures a) G L (filled symbols), G M (hollow symbols) and b) η L (filled symbols), η M (hollow symbols) as function of strain amplitude for HydroC. The data include experiments at several frequencies of ( ) 3 rad/s, ( ) 10 rad/s and ( ) 30 rad/s. 26
49 Bowditch plots shown in Figure 2.11 and result in softening of the stiffening ratio, S < 0, at large imposed strain amplitudes. As before, this result can be misinterpreted because it is not due to the softening of the moduli within a cycle, but the more rapid stiffening of the minimum strain (maximum strain rate) modulus, G M, compared to the large strain modulus, G L, as seen in Figure 2.12a. This is another example where the stiffening ratio can mask some of the details in the underlying non-linear rheology when an elastic response is dominated by non-linearities associated with increasing strain-rates. The appropriate interpretation thus is that the elastic nonlinearities of HydroC are strain-rate stiffening. The viscous non-linearities can be graphically visualized through viscous Lissajous-Bowditch plots shown in Figure The non-linear quantities, minimum strain-rate dynamic viscosity, η M, and large strain-rate dynamic viscosity, η L, were also presented in Figure 2.12b. Like the elastic non-linearities for HydroC, both η M and η L increase dramatically beyond a critical oscillatory strain amplitude. This is indicative of strain thickening and strain-rate thickening behavior mirroring the response of the first-harmonic of loss modulus. The details of non-linearities of HydroC within an oscillatory cycle were also investigated through the thickening ratios shown in Figure 2.14b. For the ω = 3 rad/s frequency case, in the thickening region, the maximum shear-rate dynamic viscosity, η L, was found to be consistently larger than the minimum shear-rate dynamic viscosity, η M, resulting in a positive thickening ratio, T > 0. This behavior is consistent with the variations in the loss modulus observed in Figure While for the larger frequency tested, ω > 3 rad/s, η M was found to be consistently larger than η L, resulting in a thinning of the thickening ratio, T < 0. This suggests that the appearance of shear-thinning in the Lissajous-Bowditch plots is predominantly due to strain-induced thickening of η M within the cycle. At these high frequencies, the shear rates through out most of the cycle is likely sufficient to induce hydrocluster formation and as a result with increasing strain more hydroclusters are formed and the fluid becomes more viscous. 27
![Strain [%] Stress Frequency, [rad/s] 3 rad/s 10 rad/s 30 rad/s = 6.3 %, max = 0.7 Pa 2.5 %, 0.8 Pa 2 %, 1.1 Pa Strain-rate 25 %, 2.6 Pa 10 %, 3.2 Pa 4 %, 2.3 Pa 63 %, 6.3 Pa 16 %, 5.0 Pa 8 %, 4.](/docs-images/85/91914662/images/50-6.jpg "6 Pa 150 %, 15 Pa 25 %, 7.6 Pa 10 %, 5.")
50 Strain [%] Stress Frequency, [rad/s] 3 rad/s 10 rad/s 30 rad/s = 6.3 %, max = 0.7 Pa 2.5 %, 0.8 Pa 2 %, 1.1 Pa Strain-rate 25 %, 2.6 Pa 10 %, 3.2 Pa 4 %, 2.3 Pa 63 %, 6.3 Pa 16 %, 5.0 Pa 8 %, 4.6 Pa 150 %, 15 Pa 25 %, 7.6 Pa 10 %, 5.6 Pa 250 %, 27 Pa 40 %, 12 Pa 89 %, 3620 Pa 549 %, 394 Pa 150 %, 2510 Pa 111 %, 8154 Pa 641 %, 6309 Pa 166 %, 5787 Pa 129 %, Pa 700 %, 7156 Pa 179 %, 7052 Pa 138 %, Pa Figure 2.13: Viscous Lissajous-Bowditch plots, total stress versus strain-rate, for HydroC dispersion for several different strain amplitude and frequency. The raw waveforms (black line) are co-plotted along with the reconstructed data. 28
51 a ) S tiffe n in g R a tio, S S tra in [% ] b ) T h ic k e n in g R a tio, T S tra in [% ] Figure 2.14: a) Stiffening ratio and b) Thickening ratio as a function of strain function of strain amplitude for HydroC. The data include experiments at several frequencies of ( ) 3 rad/s, ( ) 10 rad/s and ( ) 30 rad/s. 29
52 G ' 1 a n d G " 1 [P a ] S tra in [% ] Figure 2.15: Storage modulus (filled symbols) and loss modulus (hollow symbols) as a function of strain amplitude at 10 rad/s for JAM. To summarize, the HydroC at large strain amplitudes exhibited strong strain-stiffening and strain-rate stiffening non-linearities associated with hydrocluster mechanism. By comparison, however, the magnitude of the stiffening driven by the increasing large imposed strain-rates within a cycle was found to be more significant than the non-linearities induced by increasing the strain amplitudes within an oscillatory cycle. The corresponding viscous non-linearities showed strong strain-thickening and strain-rate thickening behavior at large strain amplitudes. However, the thickening behavior was found to depend on frequency. For low frequencies, ω = 3 rad/s, the thickening was dominated by non-linearities associated with the behavior at strain-rates. While at high frequencies, ω > 3 rad/s, the thickening of the viscosity was dominated by large-strain-induced non-linearities and was less sensitive to increasing strain rates within an oscillatory cycle Cornstarch in water (JAM) The amplitude sweep of cornstarch in water (JAM) at 10 rad/s frequency is shown in Figure Unfortunately, the study at a wider frequency range was not possible due to experimental difficulties. At small strain amplitudes, the storage modulus was found to be larger than the loss modulus, G 1 > G 1, indicating a predominantly elastic behavior. With increasing strain amplitude, 30
53 the moduli initially declined, indicating a strain softening/strain-rate thinning behavior. This behavior is likely due to the alignment of particles to the shear-fields, similar to shear-thinning regime in steady-shear rheology shown in Figure 2.2. Note that in Figure 2.15, data points appear to be missing at moderate strains of 3 % and 80 %. Using the protocol described in the experimental section, the data within this range was found to affected by instrument inertia and was removed. This was caused primarily by shear thinning of the fluid viscosity and the resulting reduction of the viscous stresses. At larger strains, the onset of shear thickening increased the shear stress by more than an order of magnitude. As a result, at these larger strains, the inertial contribution to the measured torque again fell below the 20 % threshold and the data was included. At large strains, both storage and loss moduli showed strong strain stiffening/strain-rate thickening behavior. The mechanism for the stiffening/thickening behavior appears to be similar to jamming that has been observed in steady-shear measurements. Such stiffening of elastic modulus has also been reported for dense non-colloidal suspensions and has been attributed to shear-induced migration of particles (54). The elastic non-linearities of JAM can be visualized through the Lissajous-Bowditch plots are presented in Figure The non-lineartiy was examined through the measurements of minimumstrain dynamic modulus, G M, and the large-strain dynamic modulus, G L, as a function of an applied strain as shown in Figure 2.17a. At low strain, the moduli were both found to soften with increasing strain amplitude. At the largest strains tested, this behavior was found to reverse itself and a strain stiffening and a strain-rate stiffening of the moduli was observed. The critical strain for the transition from softening to stiffening was similar to that observed for the first harmonic storage modulus. In the softening region, the minimum-strain dynamic modulus, G M, was found to decrease slightly faster than the large strain-dynamic modulus, G L. While in the stiffening region, the G M was observed to grow much more quickly than G L. This behavior suggests that the elastic non-linearities are predominantly driven by the increasing strain-rates. 31
![Strain [%] Stress Stress Frequency, = 10 rad/s](/docs-images/85/91914662/images/54-0.jpg "Elastic = 0.1 %, σ max = 0.35 Pa Viscous = 0.")


54 Strain [%] Stress Stress Frequency, = 10 rad/s Elastic = 0.1 %, σ max = 0.35 Pa Viscous = 0.1 %, σ max = 0.35 Pa Strain Strain-rate 1 %, 0.39 Pa 1 %, 0.39 Pa 2.5 %, 0.41 Pa 2.5 %, 0.41 Pa 80 %, 276 Pa 80 %, 276 Pa 89 %, 683 Pa 89 %, 683 Pa 89 %, 683 Pa 102 %, 1436 Pa 102 %, 1436 Pa 132 %, 7083 Pa 132 %, 7083 Pa Figure 2.16: Elastic (blue) and viscous (red) Lissajous-Bowditch plots, total stress vs. strain/strainrate for JAM suspension for several different strain amplitude at 10 rad/s. The raw waveforms (black line) are co-plotted along with the reconstructed data. 32
55 G ' L a n d G ' M [P a ] S tra in [% ] η' M a n d η' L [P a.s ] S tra in [% ] Figure 2.17: Non-linear viscoelastic measures a) G L (filled symbols), G M (hollow symbols) and b) η L (filled symbols), η M (hollow symbols) as a function of strain amplitude for JAM S tiffe n in g R a tio, S ( ) T h ic k e n in g R a tio, T ( ) E S tra in [% ] Figure 2.18: Stiffening ratio (filled symbols) and Thickening ratio (hollow symbols) as a function of strain amplitude at 10 rad/s for JAM suspension. 33
56 To further illustrate the elastic non-linearities observed within a given oscillatory cycle, the stiffening ratio is shown in Figure 2.18a. As we have seen a number of times already, the stiffening ratio is misleading. At intermediate strains, the stiffening ratio was found to be strain-stiffening, S > 0, not because the moduli are increasing, but because the minimum strain (maximum strain rate) modulus increases faster than the large strain modulus. Additionally, at large strains, the stiffening ratio appears to be strain-softening, S < 0. As a result, the appropriate interpretations of the non-linearities occuring within an oscillatory cycle is that at moderate strain amplitudes the elastic nonlinearities of the JAM system were strain-rate softening and at large applied strain amplitudes the elastic non-linearities transition to a strain-rate stiffening behavior as the particles begin to interact and suspension begins to jam. The viscous non-linearity of JAM can be visualized through Lissajous-Bowditch plots in Figure The non-linearities were quantified through the local measurements of minimum strainrate dynamic viscosity, η M, and the large strain-rate dynamic viscosity, η L, as shown in Figure 2.17b. Both the viscosities initially exhibited strain/strain-rate thinning behavior at small strains. At large strain amplitudes, this behavior reversed itself becoming strain/strain-rate thickening. This behavior is quite similar to observations of first-harmonic loss modulus. The strainthickening was found to be as much as two orders of magnitude stronger than the strain-rate thickening. This observation makes intuitive sense as it is the solid-solid interaction between particles that are known to cause shear thickening in these JAM systems. The non-linearities within an oscillatory cycle can be further examined through thickening ratios shown in Figure 2.18b. The thickening ratio at medium strains was found to show shearrate-thinning. At large strain-amplitudes, the thickening ratio remained shear-thinning even as both the dynamic viscosities transitioned to strain-rate thickening. This inconsistency, is again a result of the details of the oscillatory cycle. Both η M and η L increase with applied strain, but the minimum strain-rate (maximum strain) viscosity η M increases much more quickly resulting in a thinning within the cycle as the strain rate is increased, even though both viscosities show 34
57 G ' 1 a n d G " 1 [P a ] S tra in [% ] Figure 2.19: A comparison of first harmonic moduli for the three dispersions ( ) FLOC, ( ) HydroC and ( ) JAM. The data include storage modulus (filled symbols) and loss modulus (hollow symbols) as a function of strain amplitude at 10 rad/s. dramatic thickening when compared to the viscosity at small strains. A complete analysis of the viscous LAOS measurements for JAM indicates the observed non-linearities are the result of a strong strain-thickening behavior across all the strains applied. To summarize the LAOS behavior of JAM, the elastic non-linearity with increasing strain amplitude was found to be strain/strain-rate softening behavior at applied strains just larger than the linear viscoelastic limit, followed by a strong strain/strain-rate stiffening behavior at larger applied strains. The viscous non-linearity initially showed strain/strain-rate thinning at small applied strains and evolved to strong strain/strain-rate thickening with increasing applied strain amplitude. The viscous non-linearities were dominated by strain thickening of the minimum strain-rate dynamic viscosity. 2.6 Conclusions Large amplitude oscillatory shear behavior was investigated for three shear-thickening dispersions, FLOC, HydroC and JAM, which shear-thicken by different mechanisms. The first material FLOC shear-thickens due to shear-induced formation of particle clusters flocculated by polymer bridging. The second system HydroC, shear-thickens by the formation of hydroclusters. The third 35
58 a ) G ' M a n d G ' L [P a ] S tra in [% ] b ) ' M a n d ' L [P a.s ] S tra in [% ] Figure 2.20: A comparison of non-linear viscoelastic measures as a function of strain amplitude at 10 rad/s for the three dispersions ( ) FLOC, ( ) HydroC and ( ) JAM. The data include elastic measures, a) G L (filled symbols) and G M (hollow symbols), and dynamic viscosity measures, b) η L (filled symbols) and η M (hollow symbols). 36
59 system JAM shear-thickens by jamming mechanism. The viscoelastic non-linearities were examined through Lissajous-Bowditch plots and through local non-linear measures of an oscillatory cycle such as, G M, G L, η M and η L. The viscoelastic non-linearities of the three shear-thickening systems are summarized in Table 2.1. The first harmonic moduli and the local non-linear viscoelastic measures of the three systems are compared in Figures 2.19 and 2.20 respectively. The first harmonic moduli response of the three shear-thickening systems indicated that, at moderate strain-amplitudes, both HydroC and JAM have exhibited strain/strain-rate softening and strain/strain-rate thinning behavior, associated microstructure alignment to the flow fields. However, the thinning/softening behavior of HydroC was considerably less pronounced than JAM. While at large strain amplitudes, both HydroC and JAM have showed strong strain/strain-rate stiffening and strain/strain-rate thickening behaviors associated with hydroclusters formation and the inter-particle jamming mechanisms. However, the stiffening/thickening in JAM was found to much more dramatic than HydroC and larger by more than an order magnitude. The viscous non-linearities of HydroC and JAM were found to present strain and strain-rate thickening in good agreement with the steady-shear behavior. While the FLOC, in contrast, was found to show strain/strain-rate softening elastic non-linearity throughout the non-linear regime tested here. The viscous non-linearity did exhibit a mild strain/strain-rate thickening at medium strain-rates which could be due to dissipation of the equilibrium gel like microstructure, but at large strain amplitudes, the behavior evolved to strain/strain-rate thinning associated with microstructure yielding. This response is quite different from the steady-shear behavior of FLOC. When the viscous nonlinearity of FLOC is compared with steady-shear, no strain-rate thickening was observed, even though the critical strain-rates necessary for strain-thickening are achieved. The stress growth experiments indicated that large strains are required for strain-thickening to occur by the associated shear-induced polymer bridging mechanism, leading to this discrepancy. However, both HydroC and JAM were found to need relatively smaller strain amplitudes to induce shear-thickening by the associated mechanisms. 37
60 The non-linear viscoelastic moduli, G M, G L, η M and η L were examined to study the effect of strain and strain-rate on viscoelastic non-linearites within a given LAOS cycle. For all three shear-thickening systems, the trends of the non-linear viscoelastic moduli with increasing strain amplitude were found to be qualitatively similar to the first harmonic moduli throughout the nonlinear range. However, the relative dominance of strain or strain-rates driving the viscoelastic non-linearities has been found to vary between the shear-thickening systems, yielding a LAOS fingerprint that can be used to differentiate between the three different shear thickening mechanisms. A summary of these finding can be found in Table 2.1 with the dominant modes highlighted in bold. For all three shear-thickening systems, as seen in Figure 2.20, the elastic non-linearities were found to be primarily driven by strain-rates rather than the strain amplitude. For the case of FLOC the behavior was predominantly strain-rate softening throughout the non-linear range. While for HydroC, the non-linearity was very weak at moderate strain amplitudes. However at large strain amplitudes, the strain-rate stiffening was found to be slightly more important than the strain-stiffening. For the case of JAM, the behaviors were predominantly strain-rate softening, followed by a strain-rate stiffening with increasing strain amplitude. Similarly, the corresponding viscous non-linearities were examined through dynamic viscosities, η M and η L, to study the relative importance of strain or strain-rates in the viscous non-linearity of the three shear-thickening systems. A comparison of the viscous non-linearities of all three systems is presented in Figure The FLOC was found to exhibit a predominantly strain-rate dominant viscous non-linearity throughout the non-linear regime. At medium strain amplitudes the response was mildly strain-rate thickening. At large strain amplitudes, the behavior evolved to strain-rate thinning. For the case of FLOC, the viscous non-linearities were found to be dominated by the effect of increasing strain-rates. While for HydroC and JAM, the relative dominance of strain or strain-rate induced viscous non-linearity was found to depend on the strain amplitude and frequency. For the case of HydroC, at low frequency of ω = 3 rad/s, the strain-rate thickening at large strain amplitudes was found to be a little larger than strain-thickening. While at 38
61 higher frequency, ω > 3 rad/s, the strain-thickening behavior was found to be modestly stronger than the strain-rate thickening. In both cases, the degree of strain and strain-rate thickening were essentially the same. For the case of JAM, at medium strain amplitudes, the behavior was predominantly strain-rate thinning. While at large strain amplitudes, the dominant behavior of JAM was strain-thickening rather than strain-rate thickening. The predominant strain-induced thickening behavior at large strain amplitudes of JAM is similar to that of HydroC observed at high frequencies. However, the magnitude of viscoelastic non-linearities occuring within a LAOS cycle for the case HydroC were very much smaller than what was observed in the case of either FLOC or JAM. In this LAOS study, we have observed strong differences in the viscoelastic non-linearities of the three shear-thickening systems in both strain and strain-rate space, although they share a common shear-thickening feature in steady-shear. We believe this LAOS study offered valuable insights into the viscoelastic non-linearities of three shear-thickening dispersions each with a different shear-thickening. 39
62 Table 2.1: A tabulated summary of viscoelastic non-linearities of the three shear-thickening systems. The text highlighted in bold is the dominant non-linearity. Material Mechanism Frequency [rad/s] Elastic non-linearity Viscous non-linearity G M and G L η M and η L Moderate strain Large strain Moderate strain Large strain FLOC Shear-induced bridging strain softening & strain-rate softening strain softening & strain-rate softening strain thickening & strain-rate thickening strain thinning & strain-rate thinning 3 strain softening & strain-rate softening strain stiffening & strain-rate stiffening strain thinning & strain-rate thinning strain thickening & strain-rate thickening HydroC Hydrocluster strain softening & strain-rate softening strain stiffening & strain-rate stiffening strain thinning & strain-rate thinning strain thickening & strain-rate thickening JAM Jamming 10 strain softening & strain-rate softening strain stiffening & strain-rate stiffening strain thinning & strain-rate thinning strain thickening & strain-rate thickening 40
63 CHAPTER 3 ELONGATIONAL RHEOLOGY OF SHEAR-THICKENING FUMED SILICA NANOPARTICLES DISPERSIONS IN AN AQUEOUS POLYETHYLENE OXIDE SOLUTION 3.1 Motivation Extensional flows are of significant importance in many applications such as agrochemical spraying, enhanced oil recovery, coating flows, fibre spinning, food processing and coating flows (85; 15; 23). However, there are limited studies dedicated to the extensional rheology of suspensions and colloidal dispersions when compared to shear. Bischoff White et al. (75) studied the extensional rheology of corn starch in water suspensions using filament stretching extensional rheometer (FiSER) and capillary breakup extensional rheometer (CaBER), to investigate the mechanism of strain hardening. The corn starch in water suspensions demonstrated a strong extensional hardening beyond a critical extensional rate. The extensional-hardening behavior was attributed to the aggregation of particle clusters to form interconnected jammed network. Extensional measurements of silica nanoparticles in aqueous polyethylene solution of high molecular weight (4 and 8 million g/mol) using capillary breakup extensional rheometer are presented in the appendix of Wang et al. (86), in connection with the tubeless siphon studies on silica nano suspensions. The nanoparticles in PEO suspensions were found to enhance the extensional flow properties. However, their study was limited to few samples (only two particle concentrations, particle sizes and PEO molecular weights) and therefore, the trends based on particle concentration, particle size and molecular weight, and the behavioral mechanisms, was not investigated systematically. Xu et al. (87) investigated the morphology and rheology of an entangled nanofiber/glycerol-water disper- 41
64 sions using opposed jet device. The dispersions showed extensional thinning behavior which is likely a result of breakdown of entangled nanofiber network structure under extensional stress. Ma et al. (88) used capillary breakup extensional rheometer to investigate the difference in extensional rheology of a Newtonian epoxy, and a series of dispersions of carbon nanotubes in the epoxy. The extensional viscosity measurements were in good agreement with theoretical predictions of Batchelor (89) and Shaqfeh and Fredrickson (90), who studied rigid rod particles in extensional flows. The extensional viscosity enhancement observed for carbon nanotube dispersions is the result of orientation of carbon nanotube in the flow direction during the stretch. Chellamuthu et al. (18) investigated the extensional rheology of dispersions of fumed silica particles suspended in low molecular weight polypropylene glycol using filament stretching rheometer combined with light scattering measurements to elucidate the microstructure evolution during the flow. Beyond critical extensional rate, a dramatic increase in strain-hardening of extensional viscosity was observed akin to the thickening transition observed in shear, but with a larger magnitude and at reduced critical deformation rates. Light scattering measurements showed that strain-hardening was due to alignment of nanoparticles due to formation of large aggregates in the flow direction. These were the first direct observations of hydrodynamic clustering in extensional flow. Fumed silica has been an attractive material as a rheological modifier due to its thixotropic behavior and thickening agent. Due to its high specific surface area and branching structure it displays remarkable rheological properties. Therefore, fumed silica has tremendous technological applications such as solid electrolytes in fuel cell technology (91), stabilizing agent in foams (92) and emulsions (93) and viscosity modifier for enhanced oil recovery (23). Fumed silica is also widely used as fillers in polymer composites due to improved thermo-mechanical properties (94; 95). Polyethylene oxide (PEO) is a water soluble, flexible, non-ionic polymer has potential applications such as, lithium ion batters (91), turbulent drag reduction (96), flocculant in pulp and paper (97) and drug delivery (98). 42
65 3.2 Experimental Materials Polyethylene oxide (PEO) of various molecular weight (2 x 10 5 g/mol, 6 x 10 5 g/mol, 1 x 10 6 g/mol and 2 x 10 6 g/mol) were purchased from Aldrich Chemicals. The surface tension of the aqueous PEO solutions in water is 60 mn/m (15). Hydrophilic fumed silica 200) with specific surface area of 200 m 2 /g and primary particle size 12 nm was graciously supplied by Degussa. Initially polyethylene oxide (PEO) solutions were prepared by mixing appropriate amount of PEO in water and stirred for 24 hours at room temperature to form homogeneous solution. Fumed silica dispersions were then prepared by adding the appropriate amount of the PEO solution to fumed silica and then sonicated for 20 minutes. The samples were then stored in air tight glass bottles and were stirred using magnetic stirrer for 12 hours before the experiments were performed. The fully mixed dispersions appeared cloudy Rheological tools Shear rheometry Shear rheology was conducted on a stress-controlled TA Advantage 2000 and DHR-3 rheometers using a 40 mm aluminum parallel-plate geometry at a constant temperature of 23 C temperature. A solvent trap was used to prevent sample evaporation during measurements. The samples were pre-sheared before conducting any rheological measurements to erase any shear history during sampling preparation and handling (76; 34). The pre-shear conditions were determined by observing the evolution of viscosity at different shear rates. The time required to reach a steady state value at a given shear rate, was set as the duration of pre-shear and the shear rate was chosen below the limit of reversibility to avoid any sample denaturation. Thus pre-shear conditions were set as, pre-shear duration of four minutes at 50 s 1 shear rate. After pre-shear, samples were allowed to rest for 4 minutes to reach equilibrium. Steady shear rheological measurements were 43
66 conducted in the shear rate range of 0.1 to 100 s 1, both forward and backward cycles and showed little to no hysteresis. Small amplitude oscillatory shear tests were conducted in the frequency range 0.1 to 100 rad/s, with a fixed strain amplitude, chosen to place the measurements well within the linear viscoelastic region Extensional rheometry Capillary breakup extensional rheometer Extensional measurements were carried out using a capillary breakup extensional rheometry (CaBER). CaBER is a common technique for characterizing extensional properties of less concentrated and less viscous fluids (99; 100; 101). The CaBER measurements presented here were performed using a high-speed capillary breakup extensional rheometer designed and developed specifically for these experiments. In all of the CaBER experiments presented here, an initial nearly cylindrical fluid sample is placed between two cylindrical plates with radii of R = 2.5 mm and stretched with a constant velocity of U = 200 mm/s from an initial length L i = R to final length of L f. In these experiments the final stretch length is fixed at L f = 3 L i. Once the stretch is stopped, the capillary thinning of the liquid bridge formed between the two end plates or uniaxial extensional flow that is resisted by the viscous and elastic stresses developed by the flow within the filament. A number of rheological properties can be determined by monitoring the evolution of the filaments diameter as a function of time. These include the apparent extensional viscosity, η E, and the extensional relaxation time, λ E. The extension rate of the fluid filament is given by ε = 2 dr mid (t) R mid (t) dt (3.1) The evolution of an apparent extensional viscosity with this extension rate profile can easily be calculated by applying a force balance between capillary stresses and the viscous and elastic tensile stresses within the fluid filament neglecting inertia (100; 102). 44
67 η E,app = σ/r mid(t) σ = ε dd mid (t)/dt A number of limiting cases can be theoretically predicted for CaBER measurements. Papageorgiou (102) showed that for a Newtonian fluid the radius of the fluid filament will decay linearly with time, R mid (t) (t b - t), to the final breakup at t b. Entov and Hinch (103) showed that for an Oldroyd-B fluid with a relaxation time of λ, the radius will decay exponentially with time, R mid (t) exp(-t/3λ), resulting in a constant extension rate of ε = 2/3λ E. However for particle dispersions, the key is to create a flow strong enough that the Peclet number, Pe = R 2 mid ε/d 12, is large and flow dominates the Brownian motion of the particles (19). Here D 12 is the diffusion coefficient of the particles in solution. (3.2) To calculate the apparent extensional viscosity from experiments, the diameter measurements as a function of time can either be fit with a spline and then differentiated or, for more welldefined fluids such as viscoleastic fluids, the diameter can first be fit with an appropriate functional form and then be differentiated with respect to time (100). For these nanoparticle dispersions, the diameter decay is typically fit with a spline while regions of exponential decay were used to determine the extensional relaxation time of each fluid. 3.3 Results and Discussions In this study, the shear and extensional rheology of fumed silica nanoparticles dispersed in an aqueous polyethylene oxide (PEO) solution are investigated. The role of particle concentration, polymer concentration and polymer molecular weight on both the shear and the elongational behavior of the dispersions were examined. The sample preparation and the protocol for shear and extensional rheology characterized was described in sections and
68 0.4 S h e a r V is c o s ity, [P a.s ] S h e a r R a te [1 /s ] Figure 3.1: Steady shear viscosity as a function of shear rate for a series of fumed silica dispersions in water. The data include a series of particle concentrations: ( ) 3 wt%, ( ) 4 wt% and ( ) 5 wt% Shear rheology Prior to investigating shear-thickening behavior of fumed silica dispersions in aqueous polyethylene oxide (PEO), shear rheology was conducted on fumed silica dispersions in water and on neat PEO solutions separately, to examine the rheological behavior independently. The steady shear behavior of the aqueous PEO solutions (M w = 6 x 10 5 g/mol) appeared Newtonian with a constant viscosity for all concentrations. The viscosity was found to increase approximately linearly with concentration from 2.16 to 14.9 mpa.s over the range of PEO concentration tested. Additionally the linear viscoelastic response of these systems which are not shown here, were very weakly elastic and too noisy to obtain reliable, repeatable relaxation time data. Shear rheology of fumed silica dispersions in water at various particle concentrations, without any addition of polymer, is shown in Figure 3.1. The pure silica dispersions in water without polymer show shear thinning behavior and do not exhibit any shear thickening. Fumed silica are aggregates, synthesized by fusion of spherical SiO 2 with primary particles size of 12 nm into a larger particle that is fractal in nature. Fumed silica nanoparticles in water have been found to exist through SANS as aggregates due to strong hydrogen bonding (104). The shear thinning behavior could be due to rupture of 3D net- 46
69 1 0 S h e a r V is c o s ity, [P a.s ] S h e a r R a te [1 /s ] Figure 3.2: Steady shear viscosity as a function of shear rate for a series of fumed silica dispersions in 0.6 wt% PEO (M w = 6 x 10 5 g/mol). The data include a series of different particle concentrations: ( ) 0 wt%, ( ) 3 wt%, ( ) 4 wt%, ( ) 4.5 wt% and ( ) 5 wt%. work of the agglomerates and subsequent orientation of the microstructure along the direction of shear fields (19; 84) Effect of particle concentration Next, solutions of nanoparticles with PEO were studied in order to understand the impact of particle concentration on shear-thickening behavior. Steady shear experiments were conducted on fumed silica dispersions in aqueous polyethylene oxide (PEO) solution where the PEO molecular weight was 6 x 10 5 g/mol and its concentration was held fixed at 0.6 wt%, but where the fumed silica concentration was varied from 0-5 wt%. As shown in Figure 3.2, the dispersions containing PEO showed strong shear-thickening behavior. As expected, the viscosity at low shear rates was observed to increase with increase in particle concentration. At particle concentrations below 3 wt%, no shear thickening was observed. As the particle concentration was increased, the magnitude in the shear thickening was found to increase monotonically. The degree of shear thickening, η max /η o, for these samples is also tabulated in Table 4.1. The shear-thickening behavior of fumed silica has been observed in simple solvents like low molecular weight polypropylene glycol (PPG) 47
70 (105; 80; 18). As described in the introduction, the mechanism of shear thickening of neat particle dispersions is through the formation of hydro-clusters (106). PEO has been found to have strong affinity for adsorbing to fumed silica nanoparticles (78). When PEO is added to the dispersion they can prevent interaction and control agglomeration of the nanoparticles, through the formation of hydrogen bonding between the terminal hydroxyl or the ether group of PEO and the silanol groups of fumed silica. At low shear rates, the particles are influenced only by Brownian motion. Beyond a critical shear rate, the hydrodynamic forces can induce interactions between particles, making it possible for free end of an adsorbed polymer to bridge to another particle creating a shear-induced interconnections between particles. Additionally the adsorbed polymer may be deformed by the imposed shear flow allowing it to extend and bridge with one or more particles creating a 3D interconnected network. The result is likely the formation of particle clusters similar to those formed in the absence of PEO but typically at much lower particle concentrations. This formation of shear-induced clusters of particles flocculated by polymer bridging could result in the shear-thickening behavior (106; 26). At still higher shear rates, the viscosity is observed to drop as the 3D interconnected network begins to break down under high shear stresses. In Figure 3.2, we can observe an increase in the shear thickening magnitude with increasing particle concentration from 3 to 5 wt%. Similar trends were observed by Kamibayashi et al. (26). The impact of particle concentration in shear-thickening behavior is also similar to observed for fumed silica dispersions in low molecular weight PPG (105; 18). This is likely the result of an increase in the number of silica sites for the PEO chains to adsorb. As a result, the network that is formed at the onset of shear thickening is larger, more interconnected and stronger. No significant change in the critical shear rate for the onset of shear thickeningbehavior can be noticed. However, the maximum in viscosity is observed to shift to larger shear rates indicating a stronger network structure. Linear viscoelastic measurements were also conducted for different particle concentrations holding PEO concentration constant at 0.6 wt% as shown in Figure 3.3. For all particle con- 48
71 S to ra g e a n d L o s s M o d u lu s, G ' a n d G " [P a ] A n g u la r F re q u e n c y, [1 /s ] Figure 3.3: Storage modulus (filled symbols) and loss modulus (hollow symbols) as a function of angular frequency for a series of fumed silica dispersions in 0.6 wt% PEO (M w = 6 x 10 5 g/mol). The data include a series of different particle concentrations: ( ) 3 wt%, ( ) 4 wt% and ( ) 5 wt%. centrations tested, the storage modulus was found to be independent of frequency and significantly larger than the loss modulus, which was found to have a very weak dependency in frequency. This behaviour suggests interconnected network of fumed silica nanoparticles dispersions. The increasing trend in the moduli values suggests an increase in the 3D percolation network of fumed silica nanoparticles due to an increase in interparticle and particle-polymer hydrogen bonded interactions Effect of polymer concentration In order to understand the effect of polymer concentration on shear thickening of these systems, the shear rheology was measured for solutions with varying PEO concentration from 0.2 wt% to 1 wt% while fixing the fumed silica concentration at 4.5 wt%. A plot of several representative data sets is shown in Figure 3.4. An increase in shear-thickening behavior was observed with increasing PEO concentration up to 0.4 wt%. At this polymer concentration, the shear-thickening behavior was maximized. Further increases to the PEO concentration resulted in a decrease in 49
72 3 S h e a r V is c o s ity, [P a.s ] S h e a r R a te [1 /s ] Figure 3.4: Steady shear viscosity as a function of shear rate for a series of 4.5 wt% fumed silica dispersions in an aqueous PEO solution (M w = 6 x 10 5 g/mol). The data include PEO concentrations of: ( ) 0.2 wt%, ( ) 0.4 wt%, ( ) 0.6 wt%, ( ) 0.8 wt% and ( ) 1 wt%. shear thickening and eventually, at high PEO concentrations the elimination of shear thickening. Our hypothesis is that at low polymer concentrations, fewer polymer chains are available to bridge between silica particles. Therefore, the observed increase in shear-thickening behavior with increasing polymer concentration is likely due to increase in the availability of free polymer chains to bridge particles and form hydroclusters. However, increasing the polymer concentration will also simultaneously reduces the number of adsorption sites on the particles available for bridging under flow because they will be occupied or blocked by PEO already adsorbed to the particles under quiescent conditions. Additionally, like polymer brushes attached to a particle (31), the adsorbed PEO can increase steric repulsion, increasing the separation between the particles and reducing their hydrodynamic interactions. As a result, a decrease in shear thickening is observed in Figure 3.4 beyond a concentration of 0.4 wt%. Therefore, an optimal polymer concentration exists which maximized the magnitude of shear thickening. Unlike for particle concentrations, a strong correlation can be observed in Figure 3.4 between the shear rate required to induce shear thickening and the polymer concentration. Increasing the polymer concentrations from 0.2 to 0.8 wt% was found to reduce the critical shear rate for the onset of shear thickening by a factor of
73 S to ra g e M o d u lu s, G ' [P a ] A n g u la r F re q u e n c y, [1 /s ] Figure 3.5: Storage modulus as a function of frequency for a series of 4.5 wt% fumed silica dispersions in an aqueous PEO solution (M w = 6 x 10 5 g/mol). The data include PEO concentrations of: ( ) 0.2 wt%, ( ) 0.4 wt%, ( ) 0.6 wt% and ( ) 1 wt%. The data series for ( ) 5 wt% fumed silica nanoparticle dispersion in water without any polymer is also included. As flow and Peclet number increase, particle interactions increase as does their proximity due to hydrodynamic interactions (42). The critical shear rate for the onset of shear thickening depends on the interparticle distance (107), but also the likelihood of polymer bridging between particles which increases with increasing PEO concentration. The effect of polymer concentration on the onset of shear-thickening behavior observed here is similar to that reported in literature for similar systems (26). The effect of polymer concentration on linear viscoelastic behavior was also examined and is shown in Figure 3.5. The storage modulus exhibits frequency independent behavior in all cases and a non-monotonic behavior with increasing polymer concentration. The storage modulus initially increases to a maximum and then decreases beyond certain increase in polymer concentration. These measurements and their qualitative similarity to the shear thickening trends support the physical arguments made above. 51
74 S h e a r V is c o s ity, [P a.s ] E S h e a r R a te [1 /s ] Figure 3.6: Steady shear viscosity as a function of shear rate for a series of aqueous 0.6 wt% PEO solution. The data include for a series of PEO at several different molecular weights (M w ): ( ) 2 x 10 5 g/mol, ( ) 6 x 10 5 g/mol, ( ) 1 x 10 6 g/mol and ( ) 2 x 10 6 g/mol. 1 0 S h e a r V is c o s ity, [P a.s ] S h e a r R a te [1 /s ] Figure 3.7: Steady shear viscosity as a function of shear rate for a series of 4.5 wt% fumed silica dispersions in an aqueous 0.6 wt% PEO solution. The data include for a series of PEO at several different molecular weights (M w ): ( ) 2 x 10 5 g/mol, ( ) 6 x 10 5 g/mol, ( ) 1 x 10 6 g/mol and ( ) 2 x 10 6 g/mol. 52
75 Effect of polymer molecular weight In order to understand the effect of molecular weight on the shear behavior, four different polymer molecular weights (2 x 10 5 g/mol, 6 x 10 5 g/mol, 1 x 10 6 g/mol and 2 x 10 6 g/mol) were studied. The radius of gyration was estimated using empirical relation of Swenson et al. (108) for PEO solutions in water resulting in values are 28, 53, 72 and 110 nm for 2 x 10 5 g/mol, 6 x 10 5 g/mol, 1 x 10 6 g/mol and 2 x 10 6 g/mol molecular weights respectively. The shear rheology of aqueous solution of 0.6 wt% PEO without fumed silica particles are also shown in Figure 3.6. The behavior is Newtonian up to 1 x 10 6 g/mol molecular weight and is slightly shear thinning at 2 x 10 6 g/mol. The viscosity was found to scale linearly with increasing polymer molecular as expected for dilute polymer solutions (109), although a slight deviation from theory at the highest polymer molecular weight was observed. The observed deviation is likely the result of not obtaining a zero shear rate viscosity for the highest molecular weight sample. In Figure 3.7, four representative rheological data sets are presented for dispersions of 4.5 wt% fumed silica nanoparticles in an aqueous solution of 0.6 wt% PEO. Increasing the molecular weight from 200 to 600 kg/mol increased the shear-thickening behavior. A higher molecular weight polymer has longer chains and can bridge particles farther apart. Additionally, a higher molecular weight polymer can attach to a greater number of particles and increase the degree of bridging (79). As a result, with increase in molecular weight from 2 x 10 5 g/mol to 6 x 10 5 g/mol, an increase in the magnitude of shear-thickening behavior was observed. However, increasing the molecular weight further from 6 x 10 5 to 1 x 10 6 and finally to 2 x 10 6 g/mol the degree of shear thickening, the ratio of peak shear viscosity to the shear viscosity at the onset of thickening, was found to decrease. Here, the comparison between different polymer molecular weights is at a constant weight percent. Therefore, the number of molecules and thus the terminal -OH groups of PEO, decrease by a factor of 10 with increasing molecular weight from 2 x 10 5 to 2 x 10 6 g/mol. However, the total number of hydrophilic sites of PEO, terminal -OH and ether oxygen groups, remain unchanged as the weight percent is fixed. Therefore, the decrease in the shear-thickening behavior despite constant number 53
76 of PEO sites suggests a decreasing effectiveness in the formation of bridges between nanoparticles beyond certain increase in the polymer molecular weight. For stable dispersions, the adsorption of a higher molecular weight polymer, whose radius of gyration is greater than the particle, R g > R particle, may result in a significant increase in the polymer coverage of the particle surface area. Kawaguchi et al. (110) have also reported a greater particle surface area coverage at higher polymer molecular weights from the adsorption measurements of PEO onto fumed silica. The observed reduction in shear-thickening could thus be the result of a decreased number of interactions or bridging chains between neighboring nanoparticles (111). A decrease in the critical shear rate for the onset of shear thickening, γ c, with increasing molecular weight was also observed. This behavior is consistent with reported in literature (112; 80; 26). Adsorption of a polymer molecule on a particle may also increase the hydrodynamic radius of the particle, which effectively decreases the interparticle distance influencing the onset of shearthickening behavior. The critical shear rate for shear thickening has been shown to scale inversely with the particle size as, γ c a 2 or a 3 (31; 17). In order to gain further insights of the effect of polymer molecular weight on shear-thickening, linear viscoelastic experiments were also conducted on the nanoparticle dispersions at different polymer molecular weights as shown in Figure 3.8. At 2 x 10 5 and 6 x 10 5 g/mol PEO molecular weight, the moduli variation is frequency independent indicating an interconnected structure. However, increasing the molecular weight to 2 x 10 6 g/mol results in a sol-like response (G > G ) with moduli scaling power law with frequency, approaching G ω 2 and G ω at low frequency. Further, the frequency sweep response is quite similar to the case with pure polymer solution without any nanoparticles. This suggests that for the high molecular weight systems, the polymer and not the particles dominate the fluid s response. These results agree well with Kawaguchi et al. (110) who reported a similar reduction in the dynamic moduli for adsorption of higher PEO molecular weight to silica nanoparticles. 54
77 S to ra g e a n d L o s s M o d u lu s, G ' a n d G " [P a ] E -3 1 E A n g u la r F re q u e n c y, [1 /s ] Figure 3.8: Storage modulus (filled symbols) and loss modulus (hollow symbols) as a function of angular frequency for a series of 4.5 wt% fumed silica nanoparticle dispersions in an aqueous 0.6 wt% PEO solution. The data include for a series of PEO at several different molecular weights (M w ): ( ) 2 x 10 5 g/mol, ( ) 6 x 10 5 g/mol and ( ) 2 x 10 6 g/mol. The data ( ) for 0.6 wt% aqueous PEO of molecular weight 2 x 10 6 g/mol without fumed silica nanoparticles is also included Extensional rheology Effect of particle concentration capillary breakup extensional rheology of the silica dispersions was conducted varying particle concentration, polymer concentration and molecular weight as described in section In Figure 3.9, the evolution of the diameter for a series of silica particle concentrations is shown on a semi-log plot. Here the concentration and molecular weight of PEO are fixed at 0.6 wt% and 6 x 10 5 g/mol respectively. We can observe an increase in filament lifetime with increasing particle concentration. In order to calculate the apparent extensional viscosity, the diameter decay data was fit by a spline and then differentiated according to the equation 5.2. In Figure 3.10, the apparent extensional viscosity, η E, is shown as a function of Hencky strain for various particle concentrations. The apparent extensional viscosity is independent of Hencky strain at low strains, begins to increase beyond a certain Hencky strain, and levels off at high Hencky strains. This behavior is termed as strain-hardening. As expected, the apparent extensional viscosity at low 55
78 3 1 N o rm a liz e d D ia m e te r T im e [s ] Figure 3.9: Diameter evolution as a function of time during a capillary breakup extensional rheology measurement for a series of fumed silica dispersions in an aqueous solution of 0.6 wt% PEO (M w = 6 x 10 5 g/mol). The data include a number of different particle concentrations: ( ) 3 wt%, ( ) 4 wt%, ( ) 4.5 wt% and ( ) 5 wt%. A p p a re n t E x te n s io n a l V is c o s ity, Ε [P a.s ] H e n c k y S tra in, Figure 3.10: Apparent extensional viscosity as a function of Hencky strain for a series of fumed silica dispersions in an aqueous 0.6 wt% PEO solution (M w : 6 x 10 5 g/mol). The data include several different particle concentrations: ( ) 3 wt%, ( ) 4 wt%, ( ) 4.5 wt% and ( ) 5 wt%. 56
79 S te a d y -S ta te Τro u to n R a tio, / ( ) F u m e d S ilic a N a n o p a rtic le C o n c e n tra tio n [w t% ] E x te n s io n a l R e la x a tio n T im e, [m s ] ( ) Figure 3.11: Steady-state Trouton ratio, η E, /η o,( ) and extensional relaxation time, λ E,( ) as a function of fumed silica nanoparticle concentration in 0.6 wt% aqueous PEO solution (M w = 6 x 10 5 g/mol). strains, η E,o, increases with increase in particle concentration. The Trouton ratio, Tr = η E,o /η o, was found to be in the range of 5 to 10, which is slightly larger than 3, which is predicted for Newtonian fluids. There is some uncertainty as to which zero shear rate viscosity to choose as many of these samples show shear thinning even at the lowest shear rates measured. The value for η o is thus likely a little low for all these samples. Additionally, the particles are not spherical and Batchelor (89) showed that high aspect ratio particles can have large extensional viscosities. Thus the deviation from Tr = 3 could be due to the non-spherical or fractal nature of the fumed silica particles (89). The strain hardening behavior is mild at lower particle concentrations but increases strongly at higher particle concentration. The steady-state Trouton ratio, Tr = η E, /η o, and extensional relaxation time as a function of particle concentration is shown in the Figure The extensional relaxation time, λ E, was obtained by fitting the exponential diameter decay in the middle times to an exponential function. The characteristic extensional relaxation times thus calculated for various particle concentrations are shown in the Figure We can observe an increase in λ E with increase in particle concentration. We notice that the Tr and λ E increase quite quickly with increase in particle concentration 57
80 S h e a r T h ic k e n in g M a g n itu d e, m a x / o ( ) F u m e d S ilic a N a n o p a rtic le C o n c e n tra tio n [w t% ] E x te n s io n a l H a rd e n in g M a g n itu d e, Ε, m a x / Ε, o ( ) Figure 3.12: Shear thickening magnitude, η max /η o,( ) and extensional hardening magnitude, η E,max /η o,( ) as a function of fumed silica nanoparticle concentration in 0.6 wt% aqueous PEO solution (M w = 6 x 10 5 g/mol). beyond a 4 wt% particle concentration to a maximum of Tr = 160 and λ E = 6.4 ms respectively. The qualitative effect of particle concentration on strain hardening is consistent with the observations in literature (86; 18). In Chellamuthu et al. (18), the light scattering measurements during the extensional flow of fumed silica dispersions in low molecular weight PPG, indicated an alignment of string of interacting particles in the flow direction. We believe alignment and interaction of particles in the extensional flows presented here can result in the formation of multiple particle clusters bridged by the PEO chains, resulting in the strong strain hardening behavior presented in Figure The increase in the strain-hardening behavior with increasing silica particle concentration could be the result of increased bridging between particles and polymer chains and the development of a stronger interparticle network structure as was observed in the shear rheology and linear viscoelastic measurements. In shear rheology, a strong correlation between elastic modulus and shear-thickening behaviour by polymer-particle bridging mechanism has been demonstrated. Here we examine the trends in the elongational behavior as compared to shear-thickening to understand the mechanism of strain-hardening in elongational flow. The effect of particle concentration in the trends of shearthickening and strain-hardening are compared in Figure The magnitude of strain hardening 58
81 A p p a re n t E x te n s io n a l V is c o s ity, Ε [P a.s ] H e n c k y S tra in, Figure 3.13: Apparent extensional viscosity as a function of Hencky strain for a series of 4.5 wt% fumed silica nanoparticle dispersions (M w = 6 x 10 5 g/mol) in water. The data include results for a number of different PEO concentrations: ( ) 0.2 wt%, ( ) 0.4 wt%, ( ) 0.6 wt% and ( ) 0.8 wt%. was quantified as the ratio of steady-state apparent extensional viscosity and the apparent extensional viscosity at low Hencky strains, η E,o. Similarly, the magnitude of shear thickening was calculated as the ratio of the maximum attained viscosity in the shear thickening range and the viscosity at the onset of shear thickening, η max /η c. We can observe that both the magnitude of shear and extensional thickening show an increasing trend with increasing particle concentration. The effect of particle concentration on strain-hardening behavior is qualitatively similar to the shearthickening behavior. This suggests a similarity in the mechanism of strain-hardening and shearthickening behavior. However, the increase in the extensional hardening magnitude is greater than the shear thickening magnitude at higher particle concentrations. Finally, we should note that the extensional rheology of pure fumed silica dispersions was not possible to measure because, due to the low viscosity of the samples, the filament break-up time scales are too fast to accurately capture the capillary thinning process. 59
82 S te a d y -S ta te Τro u to n R a tio, / ( ) P E O C o n c e n tra tio n [w t% ] Figure 3.14: Steady-state Trouton ratio, η E, /η o,( ) and extensional relaxation time, λ E,( ) as a function of PEO concentration (M w = 6 x 10 5 g/mol)at 4.5 wt% fumed silica concentration E x te n s io n a l R e la x a tio n T im e, [m s ] ( ) S h e a r T h ic k e n in g M a g n itu d e, m a x / o ( ) P E O C o n c e n tra tio n [w t% ] Figure 3.15: Shear thickening magnitude, η max /η o,( ) and extensional hardening magnitude, η E,max /η o,( ) as a function of PEO concentration (M w = 6 x 10 5 g/mol) for a 4.5 wt% fumed silica nanoparticle concentration E x te n s io n a l H a rd e n in g M a g n itu d e, Ε, m a x / Ε, o ( ) 60
83 Effect of polymer concentration In order to understand the effect of polymer concentration on extensional rheology, CaBER measurements were conducted on a series of samples with varying polymer concentration from wt% with a particle concentration fixed at 4.5 wt% and a polymer molecular weight of 6 x 10 5 g/mol. The results are presented in the Figure As with shear, we observed a nonmonotonic trend in the magnitude of strain hardening with increasing PEO concentration. The strain-hardening behavior increases up to 0.4 wt% PEO and then decreases with further increase in PEO concentration. At 0.4 wt% PEO, the steady-state apparent extensional viscosity was found to increase by three orders of magnitude and continued increasing to very high Hencky strains. The steady-state Trouton ratio and extensional relaxation time are shown as a function of PEO concentration in the Figure A maximum in both the steady state Trouton ratio and the extensional relaxation time are observed at a PEO concentration of 0.4 wt% suggesting a clear optimal PEO concentration for both the shear and extensional thickening in these systems. The effect of PEO concentration on strain hardening and shear thickening is compared in Figure We can observe that the trends in the magnitude of strain hardening and shear-thickening behavior with increasing PEO concentration are qualitatively similar, where a maximum in both the behavior occurs at an optimum PEO concentration, which also occurs at the same 0.4 wt% PEO concentration. This strongly suggests that the effect of PEO concentration in strain hardening mechanism is similar to shear thickening. However, the increase in the extensional hardening magnitude is approximately two orders of magnitude greater than the shear thickening magnitude Effect of polymer molecular weight In order to understand the effect of polymer molecular weight, extensional rheology measurements of fumed silica nanoparticle dispersions in aqueous PEO solution were performed for a series of solutions using four different molecular weights of PEO, 2 x 10 5 g/mol, 6 x 10 5 g/mol, 1 x 10 6 g/mol and 2 x 10 6 g/mol as shown in the Figure Here the fumed silica concen- 61
84 A p p a re n t E x te n s io n a l V is c o s ity, Ε [P a.s ] H e n c k y S tra in, Figure 3.16: Apparent extensional viscosity as a function of Hencky strain for a series of 4.5 wt% fumed silica nanoparticle dispersions in an aqueous 0.6 wt% PEO solutions in water. The data include results for a number of different PEO molecular weights: ( ) 2 x 10 5, ( ) 6 x 10 5, ( ) 1 x 10 6 g/mol and ( ) 2 x 10 6 g/mol. The data ( ) for 0.6 wt% aqueous PEO of molecular weight 2 x 10 6 g/mol without fumed silica nanoparticles is also included. S te a d y -S ta te Τro u to n R a tio, / ( ) M o le c u la r W e ig h t, M [k g /m o l] w E x te n s io n a l R e la x a tio n T im e, [m s ] ( ) Figure 3.17: Steady-state Trouton ratio, η E, /η o,( ) and extensional relaxation time, λ E,( ) as a function of PEO molecular weight. The concentration of aqueous PEO and fumed silica nanoparticles are at 0.6 wt% and 4.5 wt% respectively. 62
85 S h e a r T h ic k e n in g M a g n itu d e, m a x / o ( ) M o le c u la r W e ig h t, M [k g /m o l] w E x te n s io n a l H a rd e n in g M a g n itu d e, Ε, m a x / Ε, o ( ) Figure 3.18: Shear thickening magnitude, η max /η o,( ) and extensional hardening magnitude, η E,max /η o,( ) as a function of PEO molecular weight. The concentration of aqueous PEO and fumed silica nanoparticles are at 0.6 wt% and 4.5 wt% respectively. tration and PEO concentration are fixed at 4.5 wt% and 0.6 wt% respectively. As expected, the apparent extensional viscosity at low Hencky strains was found to equal approximately Tr 3 and increase with increasing molecular weight. At large Hencky strains, the magnitude of strain hardening was found to also increase with increasing polymer molecular weight. As seen in Figure 3.17, these trends correspond to an increase in extensional relaxation time and steady-state Trouton ratio with increase in molecular weight. The effect of polymer molecular weight on the strain-hardening behavior is in agreement with reported for silica nanoparticle suspensions in high molecular weight PEO (4 and 8 million g/mol) PEO (86). Extensional rheology measurements for 2 x 10 6 g/mol molecular weight without any nanoparticles is also shown in the Figure The apparent extensional viscosity at low Hencky strains is lower compared to the dispersions of nanoparticles as expected. However, the magnitude of strain-hardening was found to be about two times greater than the dispersions containing nanoparticles. The elongational measurements for the PEO solutions of molecular weight lower than 2 x 10 6 g/mol could not be measured due to their low viscosity and the resulting extremely short life times of their filaments. 63
86 If we compare the effect of polymer molecular weight in both shear and extensional rheology by observing the trends of the magnitude of shear thickening and extensional hardening with increasing molecular weight in Figure 3.18, we notice a qualitatively different trends in the behavior. The shear thickening trend is non-monotonic with increasing molecular weight, where a maximum in shear-thickening behavior occurs at M w = 6 x 10 5 g/mol. Conversely, the strain hardening behavior was found to increase monotonically with increase in the molecular weight. The contrasting trends between shear thickening and strain hardening behavior suggest that the polymer chain length plays a different role in shear versus extensional flows. Clearly polymer elasticity and the deformation of polymer chains either in bulk or tethered between nanoparticles has a significant impact in the strain hardening mechanism for these nanoparticle/high molecular weight dispersions. 3.4 Conclusions The effect of particle concentration, polymer concentration and polymer molecular weight on both shear and elongational behavior of fumed silica dispersions were investigated. In shear, increasing particle concentration was found to increase the extent of shear-thickening. The effect of polymer concentration and molecular weight on the shear-thickening behavior was qualitatively similar. In each cases, a maximum shear thickening was found to occur at either an optimum polymer concentration and polymer molecular weight. In addition, increasing the polymer concentration and the polymer molecular weight was found to decrease the critical shear rate for the onset of shear thickening. The shear-thickening behavior was attributed to the formation of hydroclusters resulting from the polymer-particle bridging induced by the imposed shear flows. Linear viscoelastic measurements showed strong correlation between the trends in the elastic modulus and the shear-thickening behavior. Extensional rheological measurements were conducted using capillary breakup extensional rheometer. The effect of particle concentration and polymer concentration on the strain-hardening behavior was found to be qualitatively similar to shear thickening. 64
87 The similarity in the fluids response under shear and extension indicated a similar underlying physical mechanism. Increasing the particle concentration increased the magnitude of strain hardening similar to shear thickening. However, the increase in the magnitude of strain-hardening is larger compared to the shear thickening at higher particle concentrations. With increasing polymer concentration, the strain-hardening behavior showed a non-monotonic trend similar to shearthickening. At optimal conditions of 0.4 wt% PEO concentration, 6 x 10 6 g/mol molecular weight and 4.5 wt% fumed silica nanoparticle concentration, an enormous increase in the extensional viscosity was observed. Though the maximum in both the shear thickening and strain hardening behaviors occurred at the same optimal conditions, the magnitude of strain-hardening was found to be approximately two orders of magnitude larger than the shear thickening. The extensional strain-hardening mechanism is likely due to the polymer-particle bridging induced by flow. The study of the effect of polymer molecular weight on strain hardening behavior showed a contrasting trend to shear-thickening behavior. The strain-hardening behavior increased monotonically with increasing polymer molecular weight, as opposed to a maximum shear thickening at an optimum polymer molecular weight. This indicates the significant role of polymer elasticity in the elongational behavior at higher polymer molecular weight that predominates the hydrocluster mechanism in the shear-thickening behavior. 65
88 Table 3.1: Rheological properties of fumed silica dispersions in an aqueous PEO Sample M w [kg/mol] λ E [ms] Tr = η E, /η o η E,max /η o η max /η o γ c 3Si-0.6PEO Si-0.6PEO Si-0.6PEO Si-0.6PEO Si-0.2PEO Si-0.4PEO Si-0.8PEO Si-0.6PEO Si-0.6PEO Si-0.6PEO
89 CHAPTER 4 INK TRANSFER BEHAVIOR OF SHEAR THICKENING PARTICLE DISPERSIONS IN GRAVURE PRINTING 4.1 Motivation Roll to roll coating and printing of flexible substrates is a technology of great industrial and commercial importance due to its low cost and high throughput (1; 2). This technology enables the fabrication of thin organic, inorganic and mixed organic/inorganic films with nanoscale patterns at high resolution for devices in wide applications such as, solar cells, thin film transistors, organic light emitting diodes, biosensors and biodevices (113; 114; 115; 116; 12; 117). Gravure printing is a roll to roll processing technique used to coat/print thin films less than 50 µm for a wide variety of applications in high volumes such as magazines, packaging, flexible electronics, greeting cards and tapes (118; 15; 119; 13). In gravure process, a roller with desired engraving, typically in microns dimensions, is passed through an ink reservoir and the excess is metered off by passing by a doctor blade. The ink from the cavities is then deposited on to the substrate held by another roller at high speeds (up to 15 m/s). The schematic of gravure process is shown in Figure 4.1. During the ink transfer process, a liquid bridge is formed and stretched between the gravure cell (the cavity) and web, as the ink is deposited onto the substrate. The stability and breakup dynamics of the liquid bridge during the ink transfer can significantly affect the quality of the print or coated film. Partial emptying of the cavities or the formation of satellite drops can negatively impact the quality and the efficiency of the printing process (120). Including gravure printing, the dynamics of the liquid bridge are strongly relevant in other applications such as contact drop dispensing (121), float-zone crystallization (122) and oil recovery (123). Therefore, the dynamics, 67
, as well")
90 Figure 4.1: Schematic of gravure printing process (Source: Eckart Company) stability and breakup of the liquid bridge have been widely studied (121; 123; 124; 125; 126; 127). Numerous studies, both experimental and numerical, have been performed to better understand the dynamics of a liquid bridge uniaxially stretched between two flat plates (128; 129; 130), as well between a flat plate and a cavity (131; 132; 133; 134). There have also been numerical and experimental studies on ink transfer behavior considering pure shear (135; 136; 137), as well as a combination of shear and extensional motion (8; 9) of the liquid bridge in gravure printing. Printing fluids often are non-newtonian, as many inks contain large concentrations of particles and polymer additives (11; 12; 13). There have been studies reported only recently on the behavior of non-newtonian fluids during gravure printing. Huang et al. (134) performed numerical computations using volume of fluid (VOF) method to examine the break up dynamics of shear-thinning fluids. They observed a fast break up of the filament and the formation of more satellite drops for the case of shear-thinning fluids compared to Newtonian fluids. Ahmed et al. (138) employed numerical computations to investigate the ink transfer behavior of shear-thinning fluids between two flat plates. They examined the influence of inertia, surface tension and top plate contact angle 68
91 on the ink transfer ratio. Numerical computations on a shear-thinning fluid by Ghadiri et al. (139) showed that factors such as groove angle, groove depth and wettability can have significant impact on the filament dynamics and the amount of ink transfer. There have also been studies both experiments and computations dedicated to the influence of viscoelasticity on gravure printing (14; 15; 16). Ahn et al. (14) examined the influence of elasticity through numerical computations using Oldroyd-B model and observed significant differences in the velocity field and pressure distribution in the cavity between viscoelastic and Newtonian fluids. Sankaran and Rothstein (15) conducted experimental investigation using polyethylene oxide (PEO) fluids to study the impact of viscoelasticity, gravity and gravure cell design on the fluid transfer in gravure printing. Filament stabilization due to elasticity was found to enhance or worsen the fluid removal, depending on whether the fluid removal direction is aligned with or opposite to the direction of gravity. Computational studies later by Lee et al. (16) on the influence of viscoelasticity in gravure printing using FENE-P constitutive model were in excellent agreement with experiments (15). Their computations were able to extend beyond the parameters of the experiments to investigate a larger viscoelastic parameter space. 4.2 Experimental Gravure experimental setup In our experiments, a modified version of a filament stretching extensional rheometer was used to model the pickout process for an idealized gravure cell or cavity (15). The experimental setup, shown in Figure 4.2, consists of a computer-controlled linear motor attached to a aluminum plate which is in-line with the cavity. The initially cylindrical fluid bridge was stretched vertically from the cavity with constant velocity. In real gravure processes, the fluid bridge experiences a combination of shear and extensional deformation, with the latter being dominant at later times near the mid-plane and the former being important at earlier times and near the end plate/cell. For sim- 69
92 plicity, the touch down process that would occur in the real roll-to-roll coating is not modeled instead the initial fluid bridge has a finite aspect ratio. A truncated cone shaped cavity was fabricated by casting PDMS (Silgard 184) onto a negative mold of the cavity machined into aluminum. The cavity has a sidewall angle of α = 75 from horizontal, radius of R = 2.5 mm and a depth of h = 1 mm. The real gravure rollers have cavity features that are typically ten to hundred microns in order. Here the cavity dimensions were scaled for the convenience of a lab scale study. The effect of cavity size was probed numerically. A cylindrical fluid filament was held between the plate and cavity at an initial aspect ratio of L i /R = 0.3, where L i is the separation. The top plate was separated at different velocities ranging from mm/s to a final aspect ratio of L f /R 32, up to which the filaments survived in only a few cases. The stretching speed corresponded roughly to printing speed. The inertia effects were negligible in these tests as the Reynolds numbers were all very low, R < Reynolds number is the ratio of inertial to viscous forces given by, R = D 0 Uρ/η 0. Here D 0 and U are the characteristic diameter and velocity, while ρ and η 0 are the fluid density and viscosity. Because gravity is significant at these dimensions (the initial Bond number is greater than one, 2), tests were performed with cavity on both top and bottom configurations. Bond number quantifies the relative importance of gravity to interfacial tension forces and is given by, = ρgd 2 0 /4σ. Here σ is the interfacial tension of the fluid. The filament profile evolution during the stretch and the breakup process was examined using a high-speed video camera (Vision Research, Phantom 4.6). The initial and final mass of the fluid in the cavity was measured using a high precision mass balance (Mettler AC 100). The pickout fraction is defined as, φ = m/m, where m is mass transferred to the top plate and M is the total mass of the fluid. All the fluid transferred was assumed to be on the top plate; fluid lost by other mechanisms were ignored. The uncertainty in the experimentally measured values of pickout is just 2% or less. 70
93 U Linear servo motor R 0 L pinned contact line L 0 cavity z r h XYZ positioning stage Figure 4.2: Schematic diagram of experimental setup used for idealized gravure cell study. 71
94 4.2.2 Test fluids Our model fluid was fumed silica nanoparticles Evonik Industries; primary particle diameter 20nm, specific surface area 200m 2 /g) dispersed in polypropylene glycol (Aldrich Chemicals, average M.W 1000g/mol). A series of test fluids with varying concentration (7.5 wt% to 20 wt%) were prepared by mixing in a blender for an hour until a transparent and colorless dispersion was obtained. The resulting dispersions were kept in the vacuum chamber for several hours to remove the air bubbles before use (18). The surface tension was measured using a pendant drop tensiometer (Dataphysics OCA 15plus). The surface tension was found to be insensitive to the nanoparticle concentration, and was found to be σ 30mN/m. As described in the following sections, the shear and extensional rheology indicate that the test fluids are well-approximated as generalized Newtonian liquids Shear rheology The shear rheology was probed using a stress-controlled TA DHR-3 rheometer using a 40 mm aluminum parallel-plate geometry at a constant temperature of 25 C temperature with a solvent trap to prevent evaporation. The samples were pre-sheared to erase any shear history during sampling preparation and handing (76; 140). After pre-shear, samples were allowed to rest for 4 minutes to reach equilibrium. Steady shear viscosity measurements were conducted in the shear rate range of 0.1s 1 γ 100s 1. As shown in Figure 4.3, the test fluids were all found to be shear thinning at low shear rates. This behavior has been shown to result from the formation of strings of particles aligned along the direction of shear fields (19). All four test fluids were found to shear-thicken beyond a critical shear rate. The magnitude of shear-thickening was found to progressively increase with increasing particle concentration from 7.5 wt% to 20 wt%. The mechanism for the shear-thickening behavior of these nanoparticles has been attributed to the formation of large hydrodynamic-induced clusters of nanoparticles (19). The critical shear rate for the onset of shear rate of shear-thickening was 72
95 found to decrease with increasing particle concentration. Beyond a second critical shear rate, the fluids are expected to shear-thin; although experimental limitations in this study prevented this observation at high concentration test fluids, previous studies have shown the shear-thinning behavior (80; 141; 18; 105) S h e a r V is c o s ity, η [P a.s ] S h e a r R a te [s -1 ] Figure 4.3: Steady shear viscosity as a function of shear rate for a series of fumed silica dispersions in PPG. The data include different particle concentrations of ( ) 7.5 wt%, ( ) 10 wt %, ( ) 15 wt% and ( ) 20 wt%. Solid lines are fits of the high-rate-thinning model of Equation (4.1) to experimental steady shear rheology data for various particle concentrations A generalized Newtonian constitutive model The steady-shear rheology data for all particle concentrations were fit by a generalized Newtonian fluid model. The shear-thickening behavior of Aerosil/PPG systems is well-documented, and piece-wise generalized Newtonian constitutive laws to describe the shear viscosity have been previously reported (105; 141). To simplify the piece-wise description, we formulate a new generalized Newtonian constitutive law η t ( γ) = { η A + ( η 0 η A ) [1 + (λ1 γ) B 1 ] n 1 1 B 1 }{ 1 + A A [ 1 + (λ 2 γ) B 2 ] n 2 1 B 2 } (4.1) 73
96 The zero-shear and infinite-shear viscosities are η 0 and η, and the extent of shear-thickening is determined by A. The model is essentially a product of two Carreau models, one each for the shear-thinning and shear-thickening regions denoted by the subscripts 1 and 2, respectively. Each part of the model has a time constant λ, the power law exponent n, and a dimensionless transition parameter B. The critical shear rates for thinning and thickening are thus 1/λ 1 and 1/λ 2, respectively. For each suspension concentration, the parameters were fit to the measured steady shear viscosity and the results superimposed over the data in Figure 4.3. The values of the generalized Newtonian constitutive law parameters used to fit each of the fluids in Figure 4.3 are presented in Table Extensional rheology Filament stretching extensional rheometer Extensional rheology was probed by filament stretching extensional rheometry (FiSER), which is typically used to characterize fluids with a shear viscosity η > 1Pas (142; 143; 144; 145). We use the FiSER type II test, where the top plate is separated from the bottom plate with exponential velocity profile to impose a nearly constant extension rate ε on the fluid filament at the mid-plane. The apparent extension rate ε app is calculated from the mid-filament diameter decay rate, and used to infer the apparent extensional viscosity η E = τ zz τ rr / ε app, where the elastic normal stress difference τ zz τ rr is estimated from force measurement at the top plate and an approximate mid-plane force balance (146; 143). In Figure 4.4, the extensional viscosity is shown with respect to Hencky strain for test fluids with concentrations > 10 wt%. Unfortunately, measurements were not possible for concentrations below 10 wt% because of limitations of the force transducer sensitivity. As previously reported (18; 147; 86), the extensional thickening of the test fluids was found to increase with increasing nanoparticle concentration. Without adjusting any of the model parameters, the generalized Newtonian constitutive model qualitatively predicts the extensional rheology of the test fluids in 74
97 Figure 4.4. The agreement, however, is not perfect. The experimentally measured maximum extensional viscosities are systematically larger than the values predicted by the generalized Newtonian model. This discrepancy has also been described in (18), where analysis of extensional viscosity based on a modified Trouton ratio using the corresponding shear rate Tr = η E η( γ) = η E η( 3 ε) (4.2) demonstrated that extensional thickening is more dramatic than predicted by shear-thickening alone, and occurs at a slightly lower critical extension rates than the expected value of γ c / 3, where γ c is the critical shear rate for the onset of shear thickening. These effects are exacerbated with increasing particle concentration. For our test fluids, the particle concentrations were low enough that the generalized Newtonian model appears well-justified. For both 15 and 20 wt% test fluids, beyond extension rates of ε > 6 s 1, the extensional behavior could not be characterized using FiSER due to the formation of conical shaped filament profiles that made calculation of the extension rate and extensional viscosity impossible. These flow transitions will be discussed in more detailed in the context of liquid transfer measurements in section Results and discussion Measurements of liquid transfer from an idealized gravure cell were conducted on a series of nanoparticle dispersions. Pickout fractions were measured as a function of increasing stretching velocity from 0.1 to 200 mm/s. The liquid filament profile evolution of the 15 wt% test fluid was captured by video analysis and presented in Figures 4.5 and 4.6. For comparison, the predictions of the numerical simulations are presented alongside the experiments in Figure 4.5. The results show excellent agreement between the measured and simulated shapes and shape transitions. The pickout behavior of shear-thickening 15 wt% silica dispersion is shown in Figure 4.7 for both cavity on top and bottom cases. Pickout at vanishing velocities is higher for the cavity-on- 75
98 (a ) E x te n s io n a l V is c o s ity, [P a.s ] H e n c k y S tra in, ε (b ) E x te n s io n a l V is c o s ity, [P a.s ] H e n c k y S tra in, ε Figure 4.4: Experimental (symbols) and simulated (lines) FiSER type II extensional rheology data for different concentrations of silica nanoparticles dispersed in PPG. The concentrations include a) 20 wt% and b) 15 wt%. The imposed extension rates are ( ) 3 s 1, ( ) 4 s 1 and ( ) 5 s 1. 76
99 0.1 mm/s 0.2 mm/s 0.4 mm/s 0.8 mm/s 2 mm/s 4 mm/s 8 mm/s 18 mm/s 40 mm/s 80 mm/s 200 mm/s Figure 4.5: Terminal filament interface profiles for the 15 wt% silica nanoparticle dispersion in PPG with cavity-on-bottom. Top: computational results for comparison. 0.1 mm/s 0.2 mm/s 0.4 mm/s 0.8 mm/s 2 mm/s 4 mm/s 8 mm/s 18 mm/s 40 mm/s 80 mm/s 200 mm/s Figure 4.6: Terminal filament interface profiles for the 15 wt% silica nanoparticle dispersion in PPG with cavity-on-top. 77
.")
![(a ) F ra c tio n T ra n s fe rre d, 0.3 5 0.3 0 0.2 5 0.2 0 0.1 5 0.1 0 0.0 5 0.0 1 0.1 1 1 0 1 0 0 1 0 0 0 V e lo c ity [m m /s ] (b ) F ra c tio n T ra n s fe rre d, 0.6 5 0.6 0 0.5 5 0.5 0 0.](/docs-images/85/91914662/images/100-1.jpg "4 5 0.4 0 0.3 5 0.3 0 0.2 5 0.1 1 1 0 1 0 0 1 0 0 0 V e lo c ity [m m /s ] Figure 4.")
100 top configuration than for the cavity-on-bottom configuration; in this vanishing capillary number (Ca = ηu/σ) regime, the pickout is a quasi-equilibrium process governed solely by surface tension and gravity, implying that pickout is gravity-enhanced in the cavity-on-top configuration and viceversa due to gravitational sagging of the quasi-equilibrium liquid bridge profile (15; 16). (a ) F ra c tio n T ra n s fe rre d, V e lo c ity [m m /s ] (b ) F ra c tio n T ra n s fe rre d, V e lo c ity [m m /s ] Figure 4.7: Experimental (symbols) and computed (solid lines) fraction of fluid transferred from the cavity as a function of velocity for a 15 wt% fumed silica nanoparticle dispersion in PPG for two different cavity configurations. a) Cavity on bottom b) Cavity on top. (dotted line) Pickout fraction computed for Newtonian fluid with viscosity of 3.3 Pas for cavity on bottom case is also shown in Figure a. At low velocities, 0.1 < U < 2mm/s, with moderate Ca, the strain rates are low enough that the shear-thickening and extensional hardening are not active. The pickout behavior in this regime is qualitatively similar to that of Newtonian fluid, computed for comparison and shown as a dashed 78


101 line in Figure 4.7a. This is consistent with reports in literature (15; 16). One important observations from Figure 4.7b is that even in this Newtonian regime, the absolute value of pickout is severely under-predicted by computations. At intermediate velocities, 2 < U < 18mm/s, the pickout is dramatically depressed for the cavity-on-bottom configuration and dramatically enhanced for the cavity-on-top configuration. Both Figure 4.5 and Figure 4.6 show that, within this regime, with increasing velocity a more elongated filaments with increasing life time persist due to viscous stabilization by extensionalthickening which resists capillary break-up. The extensional thickening of the fluid allows more fluid to be removed from the cavity by increasing the break-up time of the fluid filament. A similar behavior was also reported for viscoelastic fluids, where long-lived filaments, that evolve as a result of thickening of the fluid s extensional viscosity, result in gravitational drainage over longer process time and dramatically influence the final pickout (15; 16). The model computations correctly predict the pickout behavior, specifically the critical velocities at which the local extrema in pickout occur. Figure 4.8: Comparison of the evolution of conical filament profile at U = 100mm/s between experiment and computation for the 15 wt% silica in PPG dispersion. At high velocities, U > 18mm/s, the pickout fraction begins to increase again and plateaus beyond 50 mm/s. The filaments profile beyond 50 mm/s evolve not as cylindrical but as conical profiles as shown in Figure 4.5. The profile evolutions with time/strain observed in the experiments 79
102 and predicted by the computations are shown in Figure 4.8. They change very little with increasing velocity beyond a critical velocity of about 50mm/s. This phenomenon is what prevented FiSER tests at high extension rate, as described earlier. As illustrated in Figure 4.9, this conical profile evolution is a result of self-accelerating shear-thinning at the mid-plane, where the strain-rate is highest and large enough to deform the fluid at rates well past the shear thickening regime into the second, more severe shear thinning regime observed in Figure 4.3. This resembles the phenomenon reported for yield stress fluids in extensional flows (148; 149). Removing the thinning of the shear and extensional viscosity at the highest deformation rates in the generalized Newtonian constitutive model was found to suppress the formulation of the conical filament profiles. In the velocity range, 18 < U < 50mm/s, the recovery of the fluid pickout from a minimum value represents a transition in pickout which corresponds to a shift in the dominant fluid behavior from extensional thickening to shear-thinning. Our numerical computations show that without significant high-rate-thinning of the shear and extensional viscosity, that the observed conical profiles cannot be recovered s 1 1 t = 0.04s Pa s t = 0.006s = D zz E = T 33 T 11 extension p = 2II 2D shear ( ) Figure 4.9: Contour plots of viscosity and the corresponding strain rates, during conical profile evolution computed at U = 100mm/s for the 15 wt% silica nanoparticle model fluid 80
103 The influence of rheological features on pickout was further explored by experiments at different particle concentrations ranging from wt%. The experiments and computations of the pickout behavior with increasing velocity, for the case where the cavity is on the bottom, are shown in Figure 4.10a and b respectively. With increasing particle concentration, the critical shear rates for shear-thickening and shear-thinning was found to shift to lower shear rates as shown in Figure 4.3. Correspondingly, the local extrema in the pickout fraction shift to lower process strain rates, again matching the critical shear rates for the rheological features. The extent of shear-thickening increases with particle concentrations, and the local minimum pickout is correspondingly deeper in the stabilized filament regime. The experiments and computations of the pickout behavior, for the case of cavity on top, is also presented in Figure 4.11a and b respectively. The height and position of the local maximum pickout correspond well to the critical shear rate and extent of shear-thickening. 4.4 Conclusions In this chapter, we investigated the impact of shear-thickening on liquid transfer from an idealized gravure cell through a combination of experiments and finite element computations. The amount of ink transfer with increasing velocity was measured for the shear-thickening dispersions at various particle concentrations. At low velocities, where the process strain rates are below the critical shear rate for shear-thickening, the pickout behavior is qualitatively similar to that of Newtonian fluids. At moderate velocities, the pickout exhibits a local extremum associated with persistence of long stable filaments due to extensional-thickening; the pickout is maximal when assisted by gravitational drainage (cavity-on-top) and vice versa. At high velocities, the filaments evolve into conical shapes due to shear-thinning. In this regime, the pickout is insensitive to velocity variation and is also unaffected by gravity. Computations predicted well the final pickout results when using a generalized Newtonian fluid model fitted to the measured shear viscosities. A 81
104 (a ) F ra c tio n T ra n s fe rre d, γ [s -1 ] (b ) F ra c tio n T ra n s fe rre d, γ [s -1 ] Figure 4.10: a) Experimental (filled symbols) and b) computed (hollow symbols) pickout fraction for a series of concentrations of fumed silica nanoparticles dispersed in PPG for cavity on the bottom configuration. The data include particle concentrations of ( ) 7.5 wt%, ( ) 10 wt%, ( ) 15 wt% and ( ) 20 wt%. 82
105 (a ) F ra c tio n T ra n s fe rre d, γ [s -1 ] (b ) F ra c tio n T ra n s fe rre d, γ [s -1 ] Figure 4.11: a) Experimental (filled symbols) and b) computed (hollow symbols) pickout fraction for a series of concentrations of fumed silica nanoparticles dispersed in PPG for the cavity on the top configuration. The data include particle concentrations of ( ) 15 wt% and ( ) 20 wt%. 83
106 Table 4.1: The fitting parameters of shear-thickening fluid model given in Equation (4.1) for several silica nanoparticle concentrations. Silica [Wt %] µ o [Pa s] µ [Pa s] B 1 n 1 λ 1 [s] B 2 n 2 λ 2 [s] A systematic study of the impact of shear-thickening model parameters on pickout features corroborates the experimental observations. To correlate pickout behavior to rheology, the appropriate process strain rate appears to be an early time shear rate. In conclusion, we demonstrate a sound basis for optimizing the liquid transfer fraction during a gravure printing process, namely to ensure coating speeds that avoid certain regimes in the shear-viscosity function where a) rate-thickening induces viscous stabilization and b) rate-thinning induces yield-like behavior resulting in a high fraction of liquid stuck in the cavity. 4.5 Acknowledgments The authors would like to thank NSF NSEC under Grant Nos. CMMI and through NSEC under Grant Nos. CMMI , CMMI , and CMMI Computations were supported in part by the Data Analysis and Visualization Cyberinfrastructure funded by NSF under Grant OCI ; by NIH award NCRR S10RR02950 and an IBM Shared University Research (SUR) Award in partnership with CISCO, Qlogic and Adaptive Computing; and by the Shared University Grid at Rice funded by NSF under Grant EIA , and a partnership between Rice University, Sun Microsystems, and Sigma Solutions, Inc. We would like to acknowledge the computations contributions by our collaborators Dr. Alex J. Lee and Dr. Matteo Pasquali from the Department of Chemical and Biomolecular Engineering at Rice University. 84
107 CHAPTER 5 INK TRANSFER BEHAVIOR OF SHEAR THICKENING AND VISCOELASTIC FLUIDS IN GRAVURE PRINTING: THE IMPACT OF SHEAR AND EXTENSIONAL DEFORMATION 5.1 Introduction Most studies on gravure printing of non-newtonian fluids have modeled liquid bridge stretching during ink transfer processes as a purely extensional flow (15; 150; 16; 139; 131; 132; 133; 134). In addition to extensional flow, in the real gravure printing process, the liquid bridge also experiences rotation and strong shear deformation due to relative motion between the top and bottom rollers. Unfortunately, only a few studies exist on gravure printing considering shear deformation of the liquid bridge during ink transfer and most have all been for Newtonian fluids (9; 135; 151; 152; 153). These studies using Newtonian fluids have found that, for a gravure printing process modeled as pure shear, the fluid pickout from gravure cells decreased with increasing capillary number at low to moderate capillary numbers (135; 151; 9; 152; 153). This is opposite to the trend observed in the pickout process modeled as pure extension (132; 8; 15; 152; 153). The driving mechanism for the shear pickout at low capillary number in shear has been attributed to a lateral capillary pressure gradient developed due to the non-symmetric meniscus curvature evolved in shear motion (135; 153). Capillary number is given as, Ca = ηv /σ, where η, σ, and V are fluid viscosity, surface tension and stretch speeds. Campana and Carvalho (153) conducted a computational study on fluid pickout from gravure cells for a wide capillary number space, 0.01 < Ca < 1, while imposing the complete roll-to-roll kinematics of the plate, including shear, extension and rotation. Through their simulations, they were able to observe the free surface profile evolution and contact line motion. 85
108 The results of their simulations showed a non-linear pickout behavior with increasing capillary number which was due in large part to the contact line mobility. At low capillary numbers, Ca < 0.1, the lateral contact line mobility resulted in a large pickout and a flow dominated by the shear and rotational motion of the gravure cell. Whereas, at large capillary numbers, contact line motion pinning resulted in a reduction in the pickout and a flow dominated by extensional motion of the top plate. Only one study on non-newtonian fluid case considering shear motion in gravure printing process has been reported recently by Chung and Kumar (154), where they conduct a computational study of the pickout behavior from model gravure cells for viscoelastic fluids cases considering a combination of horizontal and vertical substrate motion. For a pure horizontal substrate motion, the pickout was found to be improved for a viscoelastic case compared to a Newtonian fluid, due to a large first normal stress gradient generated near the downstream corner of the cavity. When an extensional motion superimposed over horizontal motion of the substrate, the pickout was found to be improved, with a stronger enhancement of the pickout fraction for viscoelastic fluids as compared to a Newtonian fluid. Previously, our research group has conducted studies on the effect of viscoelasticity (15) and shear-thickening (150) on the ink transfer behavior in gravure printing, modeling the ink transfer process as pure extensional deformation of the liquid bridge. To extend the previous studies, in this chapter we present the investigation on the effect of shear deformation, as well as a complex combination of shear and extensional deformation on the liquid bridge during the ink transfer process in gravure printing. The study is presented for both constant shear viscosity viscoelastic fluids and shear-thickening inelastic nanoparticle dispersions. The test fluids were chosen to be the same as the previous studies so that conclusions could be more easily drawn. The test fluids consisted of an aqueous polyethylene oxide (PEO) solution and fumed silica nanoparticle dispersion in polypropylene glycol (PPG). The amount of ink transferred from an idealized gravure cell was studied over 86

109 a wide range of extensional and shear deformation rates chosen to probe the tests fluids at rates capable of engaging shear thickening/thinning and viscoelastic effects. 5.2 Experimental Experimental setup Figure 5.1: Schematic diagram of experimental setup used for idealized gravure cell study. In our experiments, the gravure printing process was modeled as a combination of uniaxial extension and shear deformation of the liquid bridge during the ink transfer process. The experimental set-up was similar to that used in our previous study (15), but with a slight modification of the set-up, as shown in Figure 5.1. Uniaxial extensional motion on the liquid bridge was imposed using a modified version of a filament stretching extensional rheometer, where the top flat aluminum plate was replaced with an inverted gravure cell. To impose shear deformation, the bottom flat plate was attached to a servo-motor through a rotating fixture. Both the linear-motor and the servo-motor were computer-controlled to simultaneously impose the desired shear and extensional velocities. The truncated cone shaped gravure cell (cavity) was fabricated by casting PDMS (Silgard 184) onto a negative mold of the cavity machined into aluminum. The cavity has a sidewall angle of α = 75 from horizontal, radius of R = 2.5 mm and a depth of h = 1 mm. The real gravure rollers have cavity features that are typically ten to hundred microns in order. Here the 87
110 cavity dimensions were scaled for the convenience of a lab scale study. The result is that gravity is more important in our experiments than in a true gravure printing process (16). A cylindrical fluid filament was held between the plate and cavity at an initial aspect ratio of L i /R = 0.3, where L i is the separation. The initial separation between cavity and the plate which is larger than in a real printing process, was chosen for convenience of the experiments to make massing the fluid easier. There have been studies that have found a larger amount of ink trasfer for smaller cavity depths (15), initial liquid bridge aspect ratios and initial fluid volume (135). In pure extensional flow experiments, the top cavity was separated at different extensional velocities ranging from mm/s to a final aspect ratio of L f /R 32. At these aspect ratios, the filaments survived in only a few cases. In pure shear flow experiments, the bottom flat plate was separated with shear velocities ranging from 1 to 90 mm/s. The imposed speeds corresponded roughly to speeds experienced during gravure printing. The inertia effects were negligible in these tests as the Reynolds numbers were all very low, R = D 0 V ρ/η 0 < Here D 0 and U are the characteristic diameter and velocity, while ρ and η 0 are the fluid density and zero-shear-rate viscosity. The filament profile evolution during the stretching, shearing and the breakup process was examined using a high-speed video camera (Vision Research, Phantom 4.6). The initial and final mass of the fluid in the cavity was measured using a high precision mass balance (Mettler AC 100). The pickout fraction is defined as, φ = m/m, where m is mass transferred from the gravure cell to the flat plate and M is the total mass of the fluid. The uncertainty in the experimentally measured values of pickout was calculated to be below 2%. Here we present the study only for the gravure cavity-on-top configuration and have not presented the study for the cavity-on-bottom configuration as was done in Sankaran and Rothstein (15) due to experimental difficulties in accurately quantifying the pickout values, particularly at velocity regimes where elongated fluid filaments were observed. Under shear deformation, as the bottom plate is separated horizontally from the top plate, it does not remain vertically inline with top plate. As a result, when long filament evolved and break-up, some fraction of fluid did not 88
111 remain in the bottom plate, but was lost to the experimental stage area. This fraction of the fluid was difficult to quantify. As a result, in this orientation deposition volume is easy to quantify, but pickout volume is not. For that reason, we focused on the cavity-on-top configuration. As seen in Figure 5.1, the bottom plate was a cylindrical rod with a diameter of D = 5 mm. In all experiments presented here, the contact line of the liquid bridge was pinned at the edge of the rod. It should be noted that in a real gravure printing process, the contact line of the liquid bridge is not forcibly pinned but is free to move along a long flat substrate. In reality, however, either the fluid viscosity or the wettability of the substrate inhibit contact line motion. Clearly the spreading of the ink along the substrate is typically not a desired result for printing discrete patterns Test fluids The shear thickening test fluid was formulated from 13 wt% fumed silica nanoparticles Evonik Industries; primary particle diameter 7nm, specific surface area 380m 2 /g) dispersed in polypropylene glycol (PPG) (Aldrich Chemicals, average M.W 1000g/mol). In the text, this fluid will be given the acronym 13Si-PPG. The shear thickening fluid sample was prepared according to procedure reported in Khandavalli et al. (150). The viscoelastic test fluid formulated was polyethylene oxide (PEO) (Aldrich Chemicals) solution dissolved in water. The PEO was mixed with water and stirred for 24 h to obtain a homogenous solution. The viscoelastic fluid contained 20 wt% of 2 x 10 4 g/mol PEO to viscosify the solvent along with an additional 0.16 wt% of a high molecular weight 8 x 10 6 g/mol PEO to make the fluid elastic. In the text, this fluid will known to be as 8M PEO. The model Newtonian fluid used was a silicone oil with a viscosity of 5 Pa.s (RT5000, CANNON Instrument Co.). The surface tension of the shear thickening fluid, viscoelastic fluid and the Newtonian fluid were measured to be 30 mn/m, 58 mn/m and 20 mn/m respectively using a pendant drop tensiometer (Dataphysics OCA 15plus) (15). 89
112 8 0 S h e a r V is c o s ity, [P a.s ] S h e a r R a te [1 /s ] Figure 5.2: Steady shear viscosity as a function of shear rate. The data include: a) ( ) 13Si-PPG, ( ) 8M PEO and ( ) Silicone oil Shear rheology The steady shear rheology was probed using a stress-controlled TA DHR-3 rheometer using a 40 mm aluminum parallel-plate geometry at a constant temperature of 25 C with a solvent trap to prevent evaporation. The samples were pre-sheared to erase any shear history during sampling preparation and handing (76; 140). After pre-shearing, each of the sample was were allowed to rest for 4 minutes to reach equilibrium. Steady shear viscosity measurements were conducted in the shear rate range between 0.1s 1 γ 100s 1. The shear rheology measurements for the three test fluids, shear thickening fluid (13Si-PPG), viscoelastic fluid (8M PEO) and the Newtonian silicone oil, are shown in Figure 5.2. The shear thickening fluid at low shear rates exhibited a shear thinning behavior, resulting from the formation of strings of particles aligned along the direction of shear fields (19). At a critical shear rate of approximately γ = 10 s 1, the fluid viscosity was found to exhibit sudden shear thickening by more than an order of magnitude from 2 Pa.s to 50 Pa.s. The mechanism for the shear-thickening behavior of these nanoparticles has been attributed to the formation of large hydrodynamic-induced 90
113 clusters of nanoparticles (19). With further increase in the shear rate, the fluid was observed to shear-thin. The thinning at larger shear rates has been associated with yielding of the hydrocluster microstructure. The steady shear response of both the viscoelastic fluid and the silicone oil exhibited a constant shear viscosity of 0.2 Pa.s and 5 Pa.s respectively Extensional rheology E x te n s io n a l V is c o s ity, Ε [P a.s ] H e n c k y S tra in, Figure 5.3: Apparent extensional viscosity as a function of Hencky strain. The data include: ( ) 13Si-PPG and ( ) 8M PEO. The extensional viscosity of the three test fluids was measured using a capillary breakup extensional rheometer (CaBER). CaBER is typically used to characterize less viscous fluids making it perfectly suited for 8M PEO (103; 142; 101; 100; 102). The CaBER measurements presented here were performed using a high-speed capillary breakup extensional rheometer designed and developed specifically for these experiments. In CaBER experiments, a cylindrical liquid bridge is created between two circular plates and is stretched from an initial length, L 0, to a final length, L f, at a constant velocity. Once the stretch is stopped, the capillary thinning of the liquid bridge formed between the two end plates results in a uniaxial extensional flow that can be used to measure ex- 91
114 tensional viscosity and extensional relaxation time. By monitoring the evolution of the filament diameter as a function of time, the extension rate, ε, of the fluid filament can be calculated as ε = 2 R mid (t) dr mid (t). (5.1) dt The apparent extensional viscosity, η E, can be calculated by applying a force balance between capillary stresses and the viscous and elastic tensile stresses within the fluid filament ignoring inertia (100; 102) as η E,app = σ/r mid(t) ε = σ dd mid (t)/dt. (5.2) The initial and final aspect ratios of the liquid bridge were set as, Λ 0 = 1 and Λ f = 3. Where Λ 0 = L 0 /R 0 and L 0 is the initial separation between the plates. The apparent extensional viscosity, η E, as a function of Hencky strain, ε, for the shear thickening fluid and the viscoelastic fluid is shown in Figure 5.3. For both the fluids, the apparent extensional viscosity increases with increasing Hencky strain indicating extensional thickening of the fluids. At low Hencky strains, the Trouton ratio, Tr = η E,0 /η 0, for both fluids is approximately three, Tr 3. The steady-state Trouton ratio, Tr = η E, /η 0, of 13Si-PPG and 8M PEO were found to be approximately Tr = 50 and Tr = 2500, respectively, indicating significant extensional thickening of both the test fluids. These measurements are consistent with previous measurements of similar systems in the literature (150; 155). Fitting the 8M PEO data to an Oldroyd-B model, an extensional relaxation of λ E = 0.2 s was calculated. 92
115 P ic k o u t F ra c tio n V e lo c ity [m m /s ] Figure 5.4: Pickout fraction as a function of extensional velocity, V z (filled symbols) and shear velocity, V x (hollow symbols). The data include: ( ) 13Si-PPG and ( ) silicone oil. 5.3 Results and discussion Ink transfer behavior of a shear thickening fluid Effect of extension The fraction of ink transferred from an idealized gravure cell (also known as the pickout fraction) with increasing imposed extensional velocities, V z, and shear velocities, V x, was studied for the shear thickening fluid and compared to the results of a similar shear viscosity Newtonian fluid. The pickout behavior of this shear thickening fluid was previously studied for a purely extensional deformation through a combination of experiments and numerical simulations (150). The pure extensional pickout measurements have been repeated here so they could be used for comparison with the measurements for both pure shear and mixed kinematics gravure printing experiments. The pickout fraction with increasing extensional velocity from 0.5 mm/s V z 200 mm/s is shown in Figure 5.4 for both the shear thickening fluid and the Newtonian fluid. For velocities where the capillary number is low, the pickout is a quasi-equilibrium process and is governed predominantly by surface tension and gravity. As the velocity is increased, shear stresses become important and the effect of shear thickening becomes apparent. At low extensional velocities, V z < 3 mm/s, the 93

116 imposed extensional rate, ε = V z /L i, is not large enough to cause the extensional viscosity of the nanoparticle suspension suspension to thicken. As a result it should behave like a Newtonian fluid in this regime and the pickout behavior of 13Si-PPG found, as expected, to be similar to that of the Newtonian fluid. The lack of perfect collapse of the data in Figure 5.4 are due to differences in shear viscosity between the nanoparticle suspension and the Newtonian silicon oil. If the data were plotted against capillary number instead of extensional velocity these data would collapse well. Figure 5.5: Terminal filament interface profiles of 13Si-PPG for imposed extensional velocity of a) V z = 35 mm/s, b) 80 mm/s, and shear velocity of c) V x = 7.5 mm/s and d) 25 mm/s. At moderate extensional velocities, 3 mm/s < V z < 30 mm/s, the pickout fraction for 13S-PPG shown in Figure 5.4 was found to grow rapidly from 0.4 to 0.7 with increasing velocity due to the onset of thickening of the fluid s extensional viscosity as seen in Figure 5.3. Filament stretching extensional rheology measurements have shown that the onset of thickening of the extensional viscosity occurs at extension rates of ε cr γ cr / 3. Where γ cr is the critical shear rate for the onset of shear thickening which for the 13Si-PPG fluid was found to be γ cr = 10s 1. This analysis is consistent for the onset of extensional thickening effects at V z = 3 mm/s or an equivalent extension rate of ε cr 4 s 1. The large extensional viscosities of the 13Si-PPG solution in this regime are accompanied by long life times of the filaments pulled from the gravure cell as shown in 94
117 the Figure 5.5a. The stabilization of the fluid filaments against capillary breakup resulting from the large extensional viscosity of the fluid coupled with a break in the symmetry of the filament shape due to gravity has been shown through numerical simulations, to be the cause for the major pickout enhancement observed for shear thickening fluids (150). In this case, the pickout fraction was found to double from 38% to 68%. For large extensional velocities tested, V z > 30 mm/s, the pickout fraction was found to quickly decline with increasing imposed velocity to less than 30% before reaching a plateau. In this regime, the fluid filaments were found to evolve from a uniform cylindrical shape at low deformation rates to a pair conical shaped filaments attached to the top and bottom end plates as shown in Figure 5.5b. These conical shaped filaments were consistently observed within the high velocity plateau regime independent of the magnitude of the imposed velocity. The evolution of the conical shaped filament has been shown to be due to a sharp thinning of the shear and extensional viscosity of these fluids at large deformation rates (150). By comparison, the pickout fraction obtained for the Newtonian fluid was found to decrease monotonically with increasing extensional velocity. This trend is consistent with the prediction of numerical simulations for Newtonian fluids, with the gravure cell on the top plate for Bond numbers greater than one (16). The Bond number is the relative ratio of gravity to interfacial tension forces, B o = ρgr 2 /σ and is approximately B o 3 for the silicon oil tested here. The comparison with Newtonian fluid clearly demonstrates the dramatic impact shear thickening can have on gravure printing even in the absence of shear Effect of shear The effect of a pure shear deformation on the pickout of the shear thickening fluid from an idealized gravure cell was studied by imposing a velocity orthogonal to the stretch direction, V x, as seen in Figure 5.1. The shear velocity was varied from 1 to 90 mm/s and the results are presented alongside the extensional pickout data in Figure 5.4. At low shear velocities and capillary numbers, the pickout dynamics and fraction were predominantly governed by surface tension and gravity. 95
118 The shear-induced pickout behavior of the Newtonian and shear-thickening fluid superimpose in this regime with both appear to be decreasing slightly with increasing shear velocity as expected from theory, experiments and simulations (135; 151; 153). As the shear velocity was increased, the pickout fraction of each increased slowly and small differences between the two fluids arose due to the fact that the viscosity and thus the capillary number of the Newtonian fluid is larger than the shear-thickening fluid at any given shear velocity in this flow regime as long as the shear rates are below critical shear rate for shear thickening, γ = V x /L i < γ cr. As discussed previously, if the data were replotted as capillary number the Newtonian and shear thickening fluid data would superimpose in this regime. Slow growth in the pickout fraction is expected in this moderate capillary number regime, Ca > 0.25, as predicted by Campana and Carvalho (153). For shear velocities ranging between 5 mm/s < V x < 7.5 mm/s, the shear-induced pickout of the shear-thickening fluids was found to increase quickly as a result of shear thickening. The shear rate at the onset of pickout enhancement was found to be approximately γ = V x /L i 16s 1. This corresponds well with the shear thickening transition observed in the rheological measurement in Figure 5.2. Although the maximum pickout fraction was found to be much lower in shear than extension, 30% versus 70%, the changes resulting from the shear thickening transition still represents a 50% enhancement of the pickout fraction compared to the results from the low velocity regime. As shown in Figure 5.5c, elongated filaments with significantly increased lifetimes were found to evolve at the late stages of the shear-induced pickout process at these velocities. These elongated filaments appeared after the plates had fully separated. As a result, even though the initially imposed flow kinematics were pure shear, once the plates fully separated, the flow transitioned to an extensional flow albeit in the x-direction. Because these stretches are not vertical, in some cases, sagging of the fluid filament under gravity can be observed. With an increase in the shear velocity beyond V x > 7.5 mm/s, the shear-induced pickout fraction exhibited a slow decline before eventually reaching a plateau at large shear velocities. In the plateau regime, the filaments were found to evolve from an elongated cylindrical filament towards a conical 96

119 shape as shown in Figure 5.5d. These filament shapes are similar to those observed in the plateau regime of the extensional pickout although aligned in the x-direction and distorted some by the shearing at the edge of the plates. This suggest a similar shear and extensional viscosity thinning transition of the viscosity can impact both shear-induced and extension-induced pickout dynamics. This observation is reinforced by the pickout fraction for the shear and extensional flow induced pickout which approach each other in the regime where conical filaments were formed. Figure 5.6: Time evolution of a) pure shear-induced pickout at shear velocity of V x = 7.5 mm/s and b) pure-extension-induced pickout at an extensional velocity of V z = 10 mm/s for 13Si-PPG. In order to better understand the differences in the mechanism of shear and extensional pickout, the time evolution of shear and extensional pickout processes were examined through a high speed imaging. A sample time series for two experiments, a pure shear pickout and a pure extensional pickout with a velocity of V x = 7.5 mm/s and V z = 10 mm/s respectively are presented in Figure 5.6. During the shear pickout process, at initial times when the horizontal displacement (x) of the bottom flat plate was within the width of the gravure cavity (D), x < D, the liquid bridge underwent a predominant shear deformation, where the liquid was dragged from the gravure cell onto the land outside the cell area. The instantaneous shear rate imposed by the top plate motion can be approximated as, γ xz V x /L i. With time, the bottom flat plate moved out from under the 97
120 top plate (x > D). As this occurred, the shear flow is replaced by an elongational deformation, and the fluid on the cavity land is stretched until the breakup occurs. The late-stage evolution of shear-thickening filaments for pure shear-induced pickout at different velocities can be found in the bottom row of Figure 5.9. It is clear from these images that the filament evolution due to late stage elongational stretching was present, even at the lowest shear velocity of V x = 1 mm/s, after an initial shear deformation of the liquid bridge. The approximate transverse elongation rate after the plate separation, can be approximated as, γ xz = V x /X, where X = L 2 i + (V x t) 2 is the length of the filament. This transverse elongational rate decays with time because the imposed separation velocity is constant and eventually approaches γ xz α 1/t. The late stage filaments shapes and lengths formed during the shear pickout process were found to be quite similar to the filaments formed during extensional pickout, as shown in the first column of Figure 5.9. The qualitative similarity between the trends of shear-induced pickout and the extensional-induced pickout is likely due to similar late stage extensional deformation and break-up dynamics of the filament seen in Figure 5.9. Figure 5.7: Schematic diagram of a) pure extensional motion, b) pure shear motion and c) mixed shear and extension motion of an idealized gravure cell imposed during the liquid transfer process. Given the late stage similarities, the reduction of the shear-induced pickout compared to the extensional-induced pickout appears is most likely due to the shearing of the liquid bridge at early 98
121 times (x < D). At the early stages of the shear-induced pickout, the liquid from the gravure cell is forced to spread over the land bordering the gravure cavity. The formation of a static fluid reservoir on the cavity land driven out of the cavity by the shear deformation can be observed in the series of images in the bottom row of Figure 5.9. This expansion of fluid wetting area could be major factor limiting the final shear-induced pickout fraction. This spreading of fluid onto cavity land in shear is shown schematically in the Figure 5.7b and is absent in the extensional pickout out process due to axisymmetric stretching of the liquid bridge, as shown in the Figure 5.7a. In the next section, we show that when an extension velocity is superimposed over shear, as shown in the Figure 5.7c, this spreading of fluid onto the cavity land can be prevented, minimizing the loss of the pickout due to adhesion. Note, however, that the adhesion of the liquid in shear deformation and the resulting pickout loss could also be avoided by decreasing the wettability of the cavity land of the gravure cell through a physical and/or chemical pretreatment Effect of shear and extension T o ta l P ic k o u t F ra c tio n V e lo c ity [m m /s ] Figure 5.8: Pickout fraction as a function of extensional velocity (filled symbols) and shear velocity (hollow symbol) for 13Si-PPG. Half-shaded symbols correspond to different fixed orthogonal velocities superimposed over varying extensional velocity. The shear velocities include: ( ) V x = 5 mm/s, ( ) 7.5 mm/s, ( ) 25 mm/s and ( ) 80 mm/s. 99
122 In this section, we present a study of the influence of a combination of the shear and extensional deformation on the total pickout of a shear-thickening fluid. In the experiments, four different shear velocities were chosen to superimpose over a wide range of extensional velocities ranging from 0.1 V z 200 mm/s. The pickout results for these experiments with complex flow kinematics are shown in Figure 5.8. The fixed shear velocities were chosen from two shear pickout regimes; moderate velocities of V x = 5 mm/s and 7.5 mm/s velocities, where the shear pickout exhibited an enhancement due to late stage transverse extensional thickening and large velocities of V x = 25 mm/s and 80 mm/s, where the pickout plateaued due to shear and extensional thinning of the fluid. In the first regime, for fixed shear velocities of V x = 5 mm/s and 7.5 mm/s, as the simultaneouslyapplied extensional velocity was increased, the total pickout fraction was found to increase from the pure shear pickout values up to and then beyond the value associated with the pure extensional pickout process. For the V x = 5 mm/s case, the pure extension pickout fraction was improved by approximately 10% with the superposition of the shear velocity. This observed enhancement could be in part due to enhanced dewetting from the upstream gravure cell cavity corner as pictured in Figure 5.7c. The evolution in pickout behavior from shear dominated to extensionally dominated can be seen in the images of the final filament shape presented in Figure 5.9. For shear velocities below V x < 7.5 mm/s, the terminal filament shapes gradually approach the shape of pure extensional pickout as the strength of the extensional flow is increased. Note, however, that the stretch orientation in each case becomes aligned with the direction of the total velocity vector. Interestingly, for larger superimposed shear velocities of V x = 10 mm/s and 40 mm/s, as the extensional velocity was increased, the total pickout was found to increase only slightly before collapsing onto the high velocity terminal plateau value associated with pure extensional-induced pickout. As can be observed in Figure 5.9, at these velocity combinations the filaments were found to consistently evolve into the conical shaped filaments associated with the onset of extensional thinning of the fluid at large extension rates (150). 100


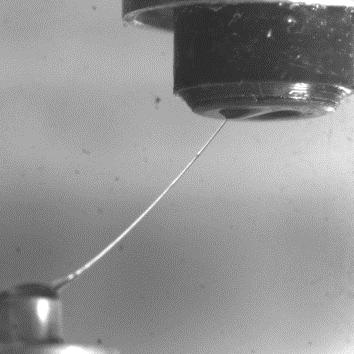


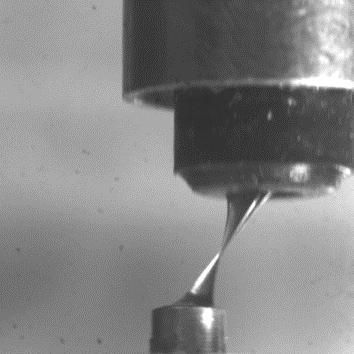


123 Extensional Velocity, V z 0 mm/s 2.5 mm/s 10 mm/s 35 mm/s 80 mm/s 0 mm/s 1 mm/s 7.5 mm/s 25 mm/s Shear Velocity, V x Figure 5.9: Filament interface profiles just prior to break up for the shear thickening test fluid, 13Si-PPG, for a combination of imposed extensional velocities and shear velocities. 101
124 P ic k o u t F ra c tio n E ffe c tiv e S tra in R a te [s -1 ] Figure 5.10: Pickout fraction as a function of effective strain rate for 13SI-PPG. Filled symbols correspond to pure extension rate, γ zz = 3 V z /L i and hollow symbols correspond to pure shear γ rate, γ xz = V x /L i. The half-shaded symbols correspond to effective strain rate, γ e = 2 xz + γ 2 zz 2. This observation suggests that the data could be better understood if the relative strength of the shear and extensional deformation on the fluid pickout were not shown as velocities, but instead γ: γ cast as an effective strain rate, γ e = 2 = γ 2 xz + γ 2 zz 2, where γ xz = V x /H and γ zz = 3V z /H. The results are presented in Figure In Figure 5.10, the pickout fraction for a combination of shear and extensional deformation collapses quite well when plotted against effective strain rate. The total pickout transitions from shear dominant to extensional dominant or vice-versa, can be clearly discriminated and it typically occurs once γ zz > γ xz. For the cases where the effective strain rates imposed were below the high extensional velocity plateau ( γ xz < 12s 1 ), the total pickout was found to improve by approximately 10% for any given effective strain rate with the addition of even the smallest amount of shear. This improvement in the total pickout could be due to an effective dewetting of the upstream contact line down the cavity wall induced by the combination of shear and the extensional motion imposed. Although it should be noted that, even after making several attempts to visualize the contact line motion, experimental challenge made it impossible to collect any conclusive evidence for or against complete dewetting. What appears to be dewetting 102
125 along the upstream corner of the gravure cell could simply be a large deformation of the fluid interface into the gravure cell while the contact line remained pinned at the upstream corner. We continue to explore new visualization techniques of the contact line motion in hopes of eventually being able to provide new insights on the mechanism of the ink transfer that can be utilized in future theoretical and computational studies. The pickout fraction in Figure 5.10 showed the same collapsed with increasing deformation rate as was observed pickout data for pure extension. However, it should be noted that, for the highest shear rates tested, γ xz > 12 s 1, the superposition of additional extensional deformation only resulted in a slight increase in the pickout fraction. In these cases, the total pickout did not follow the trend in extensional pickout fraction even when the extension rates imposed were much larger than the imposed shear rates, γ zz > γ xz. Instead the pickout fraction variation with deformation rate was similar to the pure shear result. In all cases, when the effective strain rate is larger than γ e > 90s 1 a plateau in the total pickout fraction was observed, accompanied by a conical filament profile as shown in Figure 5.9. These results clearly demonstrate the importance of both late stage extensional deformation and the initial shear deformation on the pickout process in gravure printing. They also validate the use of the effective strain rate for physically interpreting the data as nearly all the data collapsed onto a single master curve when recast in this way Ink transfer behavior of a viscoelastic fluid Effect of extension The effect of shear and extensional deformation on the pickout behavior of viscoelastic fluids was also studied in order to extend these observations to a second class of non-newtonian fluids. The pickout fraction with pure extensional velocities or pure shear velocities imposed between 0.1 mm/s < V < 200 mm/s are presented in Figure The data for the Newtonian silicone oil is also presented for comparison. The effect of extensional deformation on the pickout behavior of viscoelastic fluids was found to be consistent with the previous studies (15). The extensional pickout 103
126 P ic k o u t F ra c tio n V e lo c ity [m m /s ] Figure 5.11: Pickout fraction as a function of extensional velocity (filled symbols) and shear velocity (hollow symbols). The data include: ( ) 8M PEO and ( ) silicone oil. was found to strongly increase, by more than 71%, with increasing velocity from 10 mm/s to 200 mm/s from a value of 38% to 65%. By comparison, at these high velocities, the pickout fraction of the viscoelastic solution was more than twice the Newtonian silicone oil. At low velocities, the Weissenberg number, Wi = λ E ε << 1, is small. As a result, elastic effects are not important and, as expected, the data collapsed onto the results for the Newtonian fluid. The slight difference is due to the different in viscosity at these shear rate; the viscosity of the Newtonian fluid is significantly larger than the viscoelastic fluid. If the data were replotted as a function of capillary number instead of velocity, the Newtonian fluid data would shift to the right by a factor of more than ten and the data for both the fluids would collapse. At larger velocities, where the Weissenberg number is greater than one, Wi > 1, elastic effects become important resulting in the large deviation from the Newtonian result. As shown in first column of Figure 5.13, the filaments were found to exhibit an increased lifetime for V z > 10 mm/s because of the thickening of the extensional viscosity of the fluid. As described in the literature, the late stage break-up of the elongated filament near the top cavity and the subsequent gravitational drainage towards the bottom plate results in the enhancement of the extensionally-induced pickout (15; 16). 104
127 Effect of shear The effect of pure shear deformation on the fluid pickout is shown in Figure The pickout fraction of the viscoelastic fluid was found to increase slowly with increasing shear velocity up to a velocity of V x = 20 mm/s much like the Newtonian. Beyond V x > 20 mm/s, a sharp growth in the pickout fraction was observed within less than a decade change of 43% in imposed shear velocity. Over the same range of imposed shear velocities, the pickout fraction for the Newtonian fluid increased by only 10%. This behavior qualitatively matches the fluid response of pure extensional pickout although the viscoelastic enhancement in the shear-induced pickout fraction was slightly less dramatic. As shown in the bottom row of Figure 5.13, with increasing shear velocity, the filament shape just prior to breakup were found to become more elongated in the transverse direction with increasing shear velocity. The filaments were also observed to survive longer before breakup. This observation suggests there is a thickening of the extensional viscosity of the fluid at late stages of the shear pickout process where the pickout process morphs from a shear to a extensional flow in the x-direction. In the computational study performed by Chung and Kumar (154) for viscoelastic fluids, the presence of shear motion, for both the boundary condition with a pinned contact line at the top plate as well as with no free interface at the downstream (outlet) of the top plate, a growth in the normal stress at the top-corner of the cavity was found to enhance the pickout fraction. In our experiments, a similar pickout enhancement associated with a shear induced normal stress growth in the cavity corner in the initial shear motion is likely. Conversely, in the pure extensional motion, the computations by Lee et al. (16) on viscoelastic fluids show that such growth of the elastic normal stresses growth at the free surface near the cavity, albeit axisymmetric, were observed to hinder the fluid pickout at the initial times, however, the late stage filament dynamics were found to dominate the final pickout. One should note that although pickout fraction is improved with increasing shear velocity, the resulting elongated fluid filaments and the misalignment between the top and bottom plates at breakup will likely result in a significantly reduced printing fidelity 105
128 as the shear velocity is increased. Although printing quality is not quantified here, the presence of horizontal, highly stretched filaments is clearly not desired in most real world gravure printing applications Effect of shear and extension P ic k o u t F ra c tio n V e lo c ity [m m /s ] Figure 5.12: Pickout fraction as a function of extensional velocity (filled symbols) and shear velocity (hollow symbols) for the viscoelastic test fluid, 8M PEO. Half-shaded symbols correspond to different fixed shear velocities superimposed over varying extensional velocity. The superimposed shear velocities include: ( ) V x = 1 mm/s, ( ) 10 mm/s, ( ) 30 mm/s and ( ) 80 mm/s. Finally, we examined the influence of a combination of shear and extensional deformation on the pickout fraction of the viscoelastic fluids (8M PEO). The pickout fraction with increasing extensional velocity for a series of four different shear velocities is superimposed over the extensional flow data in Figure At low extensional velocities where shear effects dominate, the pickout fraction was found to be close to, but always slightly larger than, the pure shear-induced pickout fractions. As the extensional velocity was increased, the pickout fraction was found to increase and approach the values of pure extensional pickout, eventually mirroring the pure extensional pickout data for extensional velocities above V x > 10 mm/s. At these extensional velocities, the effects of strain hardening of the fluid s extensional viscosity to become dominant as seen from the 106


.")


129 .0.5 mm/s 10 mm/s long-lived filaments formed in Figure An enhancement in the total pickout fraction when an extensional motion is superimposed over horizontal motion has also been reported for numerical simulations of viscoelastic fluids (154). Extensional Velocity, V z 0 mm/s 75 mm/s 150 mm/s 0 mm/s 1 mm/s 10 mm/s 30 mm/s 80 mm/s Shear Velocity, V x Figure 5.13: Terminal filament interface profiles of 8M PEO for a combination of imposed extensional velocities and orthogonal velocities. The filament shapes just prior to breakup can be seen in Figure 5.13 for a wide range of combinations of extensional and shear velocities imposed. The filament were found to grow longer with increasing effective deformation rate and appear to dewet from the upstream gravure cavity corner with even the smallest amount of shear superimposed over the extensional flow. At high 107
130 shear velocities, however, the filament appeared to be driven past the downstream corner and onto the land surrounding the gravure cell cavity. This could explain why at moderate imposed shear velocities, V x 30 mm/s the pickout fraction appears to be improved by 5-8% with the addition of shear, but at large shear velocities, V x 80 mm/s, shear appears to be slightly detrimental to the pickout fraction T o ta l P ic k o u t F ra c tio n E ffe c tiv e S tra in R a te [s -1 ] Figure 5.14: Pickout fraction as a function of effective strain rate for the viscoelastic test fluid, 8M PEO. Filled symbols correspond to pure extension rate, γ zz = 3 V z /L i and hollow symbols correspond to pure shear rate, γ xz = V x /L i. The half-shaded symbols correspond to effective strain γ rate, γ e = 2 xz + γ 2 zz 2. The effect of shear and extensional deformation on the fluid pickout can be made clearer if, as before, were cast the data as a function of the effective strain rate. This is done in Figure For the cases where both shear and extensional deformation were superimposed, a clear transition from a shear-dominated to an extension-dominated response can be observed as the imposed extensional strain rate grows larger than the imposed shear rate, γ zz > γ xz. This result reinforces the importance of considering the local shear and extension rates of the imposed flow in order to fully understand and predict the effect of process parameter variation on gravure printing of non-newtonian liquids. 108
131 In this study we have examined the ink transfer behavior only for a cavity-on-top configuration for both shear thickening and viscoelastic fluids as mentioned previously. In the previous studies by our group (15; 150) on the ink transfer behavior for an extensional deformation imposed using the same test fluids, the role of gravity on the pickout has been examined for both cavity-on-top and cavity-on-bottom configurations, as the Bond number of both viscoelastic fluids and the shear thickening fluids are Bo 1. The fluid pickout was found to be assisted by gravity for a cavityon-top configuration and a vice-versa effect for a cavity-on-bottom configuration, with marked effect at velocities where the fluid undergoes extensional thickening. The pickout study for an imposed shear deformation, with cavity-on-bottom configuration, which was not presented due to experimental difficulties, we expect gravity to have a similar negative effect on the shear pickout. 5.4 Conclusions The impact of shear and extensional deformation on the liquid bridge during ink transfer from an idealized gravure cell was studied. The study was conducted for two different non-newtonian fluids; one a shear-thickening nanoparticle dispersions and the other a constant shear viscosity viscoelastic polymer solution. The pickout dynamics were studied over a range of extensional and shear velocities chosen to induced shear thickening and elastic effects in the two fluids. With the imposition of a pure extensional pickout process, the shear-thickening fluid was found to initially behave like a Newtonian fluid before growing quickly, by 86%, with increasing imposed velocity. The growth in pickout fraction resulted from the extensional thickening for the fluid and the growth of highly elongated fluid filaments pulled from the gravure cells. At large velocities, the pickout fraction strongly decayed, by a factor of approximately two, due to the dramatic thinning of extensional viscosity of these fluids at large extension rates. The result was the formation of conical-shaped fluid filaments. 109
132 The shear-induced pickout behavior of shear-thickening fluids was found to be qualitatively similar to that of extension-induced pickout, however, the amplitude of the growth and decay of the pickout fraction was significantly weaker. The observation of evolution of the fluid filament shapes during the shear pickout indicated a late stage transverse from a shear to an extensional deformation process, with the filaments evolving with similar shapes to those observed during the extensional pickout process albeit aligned horizontally rather than vertically. However, the shear-induced pickout fraction was found to be significantly lower than the extensional pickout for a given velocity. The comparison of the time evolution of filaments suggested the weaker shear-induced pickout fraction is due to the shearing motion of the liquid bridge which pulls the fluid from the gravure cell and forces it onto the land bordering the gravure cavity. The increased liquid solid contact area increased the adhesion strength and limited the final pickout fraction. This adhesion of the liquid in shear deformation and the resulting pickout loss could be avoided and the pickout fraction can be increased by decreasing the wettability of the land through a physical/chemical pretreatment. The effect of a combination of shear and extensional deformation on the pickout fraction of the shear thickening fluid was also studied. Superimposing extensional flow over shear improved the pickout fraction preventing the adhesion of the fluid onto gravity land area and eventually dominated by extensional deformation for γ zz > γ xz. For shear velocity below the rate-thinning pickout plateau regime, superimposing extensional velocities was found improve the pickout fraction for up to 10%, which is likely associated with asymmetric dewetting of the upstream cavity wall by the superimposed flow. Whereas for a shear velocity in the rate-thinning plateau regime, superposition of extensional velocities only exhibited a slight enhancement in the pickout fraction. The effect of shear and extensional deformation on the pickout fraction was further examined by casting the pickout data as a function of effective strain rate. The transitions of the pickout behavior from shear to extension-dominated deformation regimes or vice-versa were clearly observed as a function of strain rate. 110
133 For the case of viscoelastic fluids, the extension-induced pickout was found to exhibit a strong increase with increasing velocity, for up to 71%, compared to a Newtonian fluid. This enhancement in the pickout fraction is due to the extensional thickening of the fluid, accompanied by a longlived fluid filaments for Weissenberg number greater than one, Wi > 1. The shear-induced pickout exhibited a similar growth, by 43%, with increasing shear velocity. The enhancement in the shearinduced pickout is due to the late stage elongation deformation transversed from pure shear after the plates were fully separated and the resulting thickening of the extensional viscosity. This is further confirmed from the observation of the long uniform filaments with increased life-time similar to observed in the extension-induced pickout process. As before, the shear-induced pickout magnitude was found to significantly lower than that of the extension-induced pickout. The influence of a combination of shear and extensional deformation on the pickout fraction was also studied for the viscoelastic fluids. Superimposing a small extensional velocity on a predominantly shear flow improved pickout fraction by avoiding adhesion of the pickout on the on the gravure cavity land. Superimposing of extensional velocities over moderate shear velocity improved the total pickout fraction by roughly 5-8%. This increase could be due in some part to the enhanced interface deformation and perhaps even dewetting of the fluid at the upstream corner of the gravure cell due to the symmetry breaking effects of the added shear. Whereas at large shear velocities, superimposing extensional velocities was found to be minimize the pickout fraction by approximately 6%. When the pickout fraction is presented not as function of velocity but as a function of effective strain rate the data collapsed onto a single master curve. Using the effective strain rate a clear transition was observed between shear and extensional dominated response for γ zz > γ xz during the ink transfer process. 111
134 CHAPTER 6 THE IMPACT OF SHEAR-THICKENING RHEOLOGY OF PARTICLE DISPERSIONS ON SLOT-DIE COATING 6.1 Motivation Roll to roll printing is a continuous high throughput technology for fabricating flexible films. The technology can potentially lower significant cost of manufacturing flexible devices compared to conventional fabricating methods. Slot-die coating is a roll to roll processing technology used to obtain excellent uniformity and very efficient coating (4). It is commonly used in many applications such as adhesive, magnetic tapes, imaging films (156), solar cells (157), OLEDs (158), lithium-ion battery electrodes (159). Slot-die coating is a pre-meterd coating method where the desired thickness is predetermined by setting operating parameters, feed flow rate and substrate velocity. In slot-die coating process, the coating fluid is pumped through a narrow slit of the die, where it is distributed uniformly to coat onto the moving substrate under the die. A schematic of slot-die coating is shown in Figure 6.1. A stable and uniform coating is obtained only for a certain range of operating parameters, flow rate and substrate velocity called as operating window (160). Outside this window several coating defects such as air entrainment, flooding, ribbing, dripping and streaklines, are commonly observed (5; 6). The stability of the coating bead plays an important role in obtaining a stable and uniform coating. The coating bead is the fluid in the gap between the die and the substrate. A balance among several forces such as viscous, capillary, pressure, inertial and elastic forces is important for the stability of the coating bead (156). Numerous investigations, experimental, theoretical and numerical computations (160; 161; 10; 162; 163; 156; 164) exist on factors affecting the operating 112
135 window of slot-die coating and the mechanism of coating defects. Ruschak (160) examined the role of capillary pressures on the coating bead stability through quasi-static lubrication theory. Higgins and Scriven (161) extended the study including viscous effects. Lee et. al. (10) and Gutoff and Kendrick (162) experimentally determined the limiting operating parameters for stable coating, termed as low-flow limit, or minimum wet thickness. It is defined as the maximum coating speed for a given flow-rate (film thickness) or minimum flow-rate for a given coating speed at which a uniform coating is possible (163). The variation of minimum wet thickness or low-flow limit is commonly studied as a function of capillary number, Ca. The capillary number is the ratio of viscous to capillary forces given by Ca = µv/σ. Where µ is fluid viscosity, V is the substrate velocity and σ is the fluid surface tension. For Newtonian solutions, three regimes of minimum wet thickness versus capillary number have been observed (165; 10; 163; 7). At low Ca regime, the minimum wet thickness was found to increase with Ca. At moderate Ca, the minimum wet thickness was found to be independent of Ca. At large Ca, the minimum wet thickness was found to decrease with increasing Ca. Using flow visualization techniques, the mechanisms of the instability of the coating bead at upstream and downstream have also been studied (163; 156; 166; 6; 7). The shape of the fluid meniscus between die lip and the substrate at the low-flow limit has been correlated to different types of coating defects. The operating window can also be expanded by applying a vaccum upstream to create a pressure gradient across the coating bead (167; 4; 156; 164). In printing and coatings, the coating fluids are commonly non-newtonian or viscoelastic due to the addition of polymer additives or particles to the coating fluids. There have been several studies on the effect of polymer additives on the operating window of slot-die coating through experiments, flow visualization techniques and numerical simulations (5; 156; 164; 168). Ning et. al. (5) had examined the effect of polymer concentration on operating window. An optimal polymer concentration was found to maximize the operating window. Yang et. al. (165) studied the effect of polymer additives on the operating window and examined coating defects through 113
136 experiments and flow visualizations. If the defect is ribbing, addition of polymer had no effect on the operating window, while expanded the operating window if the defects are air entrainment or breaklines coupled with dripping. Romero et. al. (156; 164) in their computations and experiments have examined the low-flow limit of viscoelastic solutions and the mechanism of instability. At low Weissenberg numbers, Wi, extensional thickening expanded the operating window. However, at large Weissenberg numbers, Wi > 1, extensional thickening was found to have negative impact on the operating window. The Weissenberg number is defined as the product of the fluid relaxation time, λ, and shear rate imposed, γ. Several computational investigations also exist examining the role of viscoelasticity on slot-die coating (169; 168; 170; 171). Few studies exist on slot-die coating of shear-thinning solutions using blackstrap molasses (172; 173). Bhamidipati et. al. (172) through numerical simulation and experiments have found that the shear-thinning behavior can expand the coating window. The minimum wet thickness was found to be independent of Ca, similar to a regime observed for the case of Newtonian fluids (7). Didari et. al. (173) through numerical computations and experiments have examined the dynamic contact angle of the upstream meniscus of the coating bead at low-flow limit of shear-thinning fluid. The dynamic contact angle was found to correlate with the onset of air entrainment and dripping defect and increased with increasing capillary number. The variation of dynamic contact angle with capillary number was found to be independent of the degree of the shear-thinning. Literature also exits on slot-die coating of particle dispersions (174; 175; 176; 177). Yamamura et. al. (174) conducted coating tests on dilute suspensions of poly(methylmethacrylate) (PMMA) particles. The addition of particles was found to postpone the air entrainment. An optimal particle concentration and particle size has been found to maximize the critical velocity for the onset of air entrainment. A novel air-entrainment mechanism of air-film splitting by particle contacts has been proposed through lubrication model. Chu et. al. (175) through a combination of experiments, computations, and flow visualization examined the effect of particle concentration, size and surface texture on the operating window. They have conducted tests on suspensions of TiO 2 and 114
137 SiO 2 dispersed in an aqueous polyvinyl alcohol (PVA) solutions. The addition of particles was found to expand the coating window due to increased viscosity and increased interfacial tension associated with particle-polymer interactions. The particle texture such as porous or hard sphere, which influenced the interfacial tension, has also been found to affect the operating window. The same researchers (176) have studied the impact of polymer of adsorption onto particles and ph of the dispersions on slot-die coating using SiO 2 and TiO 2 dispersions in PVA solutions with varied molecular weight and degree of hydrolysis. An increase in the interfacial tension of dispersions or the amount of polymer adsorption was found to expand the coating window. Lin et. al. (177) investigated the effect of particle size and particle concentration on the operating window using dilute suspensions of poly(methylmethacrylate) (PMMA) particles in glycerol. They have observed two types of defects, ribbing and air entrainment outside the operating window. When the defect is ribbing, which is typically observed for low viscosity solutions, the operating window was found to be insensitive to the addition of particles. However, when the defect is air entrainment, for relatively high viscosity solutions, increasing particle concentration or decreasing particle size was found to expand the operating window. Most studies on slot-die coating were for homogenous Newtonian fluids or dilute suspensions. There are relatively few studies on the slot-die for the case of non-newtonian fluids. Roll-roll technology can involve slot-die coating of variety of suspensions for fabrication of materials for broad range of applications. At sufficiently large particle concentrations, the dispersions can potentially shear-thicken. We propose to investigate the effect of shear-thickening on slot-die coating by conducting tests on a series of particle dispersions. The shear-thickening material system for the study will be fumed silica nanoparticles dispersed in polypropylene glycol (PPG). 115
138 Coating fluid Syringe pump Slot-die Moving web Roller Hi-speed camera Recycle Blade Roller Slot Gap, W R Width, B Coating Gap, H Film Thickness, t Substrate Velocity, V Figure 6.1: Schematic of slot-die coating experimental set-up Table 6.1: Slot-die parameters and range of experimental operating parameters. Die parameters Dimensions Die length (L) 48 mm Die width (B) 24 mm Slot gap width (W) 0.50 mm Coating gap (H) mm Cavity radius (R) 4.7 mm Substrate velocity (V ) mm/s Pump flow rate (Q) mm 3 /s 116
139 6.2 Experimental Experimental setup The slot-die coating experiments were performed on a custom-built lab-scale slot-die coater. The schematic of the slot-die coating experimental set-up is shown in Figure 6.1. The critical dimensions of the slot die coater geometry in Figure 6.1 are presented in Table 6.1. A syringe pump (kd Scientific, model 100) was used to deliver the fluid through the slot-die set vertically downward, with flow rates ranging from 8 to 125 mm 3 /s. The coating fluid pumped through the slot-die was coated onto a PET substrate moving horizontally with velocities ranging from 1 mm/s to 25 mm/s using two steel rollers. The range of volumetric flow rates and the web speeds used satisfy the law of conservation of mass. The evolution and uniformity of the coating was visualized under the die through a high speed camera (Vision Research, Phantom 4.6). The coated fluid was recovered to recycle using a scraper at far downstream. In order to construct an operating window, the flow rate was held constant and the velocity of the substrate was increased incrementally to identify the critical velocity for the onset of coating defect. The process was repeated for different flow rates and coating gaps. The PET susbtrate (Melinex) used was measured using Atomic Force Microscopy (AFM) and found to have an rms roughness of 8 nm and the surface energy of PET reported in literature is approximately 41 mj/m 2 (178) Test fluids Our model fluid was fumed silica nanoparticles Evonik Industries; primary particle diameter 12nm, specific surface area 200m 2 /g) dispersed in polypropylene glycol (PPG) (Aldrich Chemicals, average M.W 1000g/mol). A series of test fluids with varying concentration (0 wt% to 10 wt%) were prepared by mixing in a blender for an hour until a transparent and colorless dispersion was obtained. The resulting dispersions were kept in the vacuum chamber for several hours to remove the air bubbles before use (18). The surface tension was measured using a pendant drop tensiometer (Dataphysics OCA 15plus). The surface tension was found to be 117
140 1 0 0 S h e a r V is c o s ity, [P a.s ] S h e a r R a te [1 /s ] Figure 6.2: Steady shear viscosity as a function of shear rate for a series of fumed silica dispersions in PPG. The data include a series of particle concentrations: ( ) 5.0 wt%, ( ) 7.5 wt% and ( ) 10 wt%. insensitive to the nanoparticle concentration, and was found to be σ = 30mN/m. Model fluids for Newtonian cases were silicone oil of viscosities 5 Pa.s (Silcone5) (RT5000, CANNON Instrument Co.) and 30 Pa.s (Silcone30) (VISCO-30M, GE Silicones) of surface tension, σ = 20mN/m. The equilibrium contact angle of PPG and silicone oil (5 Pa.s) on the PET substrate were measured from sessile drop method and found to be 19 and 32 respectively Shear rheology The shear rheology was probed using a stress-controlled TA DHR-3 rheometer using a 40 mm aluminum parallel-plate geometry at a constant temperature of 25 C temperature with a solvent trap to prevent evaporation. The samples were pre-sheared to erase any shear history during sampling preparation and handing (76; 34). After pre-shear, samples were allowed to rest for 4 minutes to reach equilibrium. Steady shear viscosity measurements were conducted in the shear rate range of 0.1s 1 γ 100s
141 The shear rheology of fumed silica nanoparticle dispersions in PPG with increasing silica concentration from 0 to 10 wt% is shown in Figure 6.2. The test fluids were all found to be shear thinning at low shear rates. This behavior has been shown to result from the formation of strings of particles aligned along the direction of shear fields (19). For concentrations above 5 wt% fumed silica, the fluids were found to shear-thicken beyond a critical shear rate. The magnitude of shearthickening was found to progressively increase with increasing silica concentration from 7.5 wt% to 10 wt%. The mechanism for the shear-thickening behavior of these nanoparticles has been attributed to the formation of large hydrodynamic-induced clusters of nanoparticles (19). The critical shear rate for the onset of shear rate of shear-thickening was found to decrease from γ c = 7 s 1 to γ c = 4 s 1 with increasing particle concentration. At even larger shear rates ( γ > 50 s 1 for 7.5 wt% and γ > 20 s 1 for 10 wt%), the fluids were found to again shear-thin due to yielding of the microstructure at the large applied shear stresses Extensional rheology Elongational viscosity of the test fluids was measured using a capillary breakup extensional rheometer (CaBER), as described in the section In the CaBER experiments presented here, the initial and final aspect ratios of the liquid bridge were set as, Λ 0 = 1 and Λ f = 3. Where Λ 0 = L 0 /R 0 and L 0 is the initial separation between the plates. Due to the shear-thickening nature of these dispersions for concentrations above 5 wt%, the initial step stretch is created at slower velocities ranging from 2 to 10 mm/s in order to minimize any influence of any deformation history on the capillary breakup process. The time scales of step stretch are smaller than the viscous breakup time scales, t v ηr 0 /σ, to observe capillary thinning (101). In Figure 6.3a, the diameter evolution for a series of particle dispersions in PPG with silica concentrations ranging from 5 wt% to 10 wt% is shown. An increase in the lifetime of the filament was observed with increasing particle concentration indicating an increasing extensional viscosity. The apparent extensional viscosity, η E, thus calculated using equation 5.2 is shown as a function 119
142 . D ia m e te r [m m ] E x te n s io S tra n in R a te a, te [1, /s ] [s -1 ] H e n k y S tra in, H e n c k y S tra in, T im e [s ] A p p a re n t E x te n s io n a l V is c o s ity, Ε [P a.s ] H e n c k y S tra in, Figure 6.3: a) Diameter evolution as a function of time during a capillary breakup extensional rheology measurements for the particle dispersions. The corresponding plots of extension rate versus Hencky strain are shown in the inset. b) apparent extensional viscosity as a function of Hencky strain for a series of fumed silica dispersions in PPG. The data include for a number of different particle concentrations: ( ) 5.0 wt%, ( ) 7.5 wt% and ( ) 10 wt%. 120
143 B L A E F lo w R a te, Q [m m /s ] Irre g u la r R ib + A E R ib C ritic a l V e lo c ity, V c [m m /s] Figure 6.4: Flow rate, Q versus critical velocity for the onset of defect, V c, for different Newtonian fluids at a coating gap of 0.25 mm. The test fluids include ( ) PPG (η = 0.15 Pa.s), ( ) silicone oil (η = 5 Pa.s) and ( ) silicone oil (η = 30 Pa.s). The dotted line for silicon oil of 5 Pa.s represents the second critical velocity of the onset of ribbing defect. The coating defects beyond the critical velocities are labeled as AE for air entrainment, BL for breaklines and Rib for ribbing. of Hencky strain, ε, for various particle concentrations in Figure 6.3b. The corresponding extensional rates, ε, calculated from the diameter decay using equation 5.1 are also shown in the inset. The apparent extensional viscosity at low strains was found to increase with increasing particle concentration as expected. Beyond a certain strain, the extensional viscosity increases indicating extensional thickening of the fluid. This behavior increases with increasing particle concentration. The Trouton ratio at low Hencky strains, Tr = η E,0 /η 0, for all particle concentrations is approximately three as expected, Tr 3. The effect of particle concentration on extensional thickening is consistent with the observations in literature (86; 18; 179). 121
144 6.3 Results and discussion Newtonian fluids Prior to investigating the influence of non-newtonian behavior on slot-die coating process, tests were conducted on three Newtonian fluids; two silicone oils one with a viscosity of η = 5 Pa.s (Silcone5) and the other with a viscosity of η = 30 Pa.s (Silcone30) along with pure polypropylene glycol (PPG) with a viscosity of η = 0.15 Pa.s. The operating window, flow rate versus critical velocity, usually obtained is a closed region, where several coating defects appear outside the window. The lower bound of the operating window, where flooding or dripping is commonly observed, was not possible to observe for most fluids due to experimental difficulties in obtaining velocities lower than 1 mm/s. Therefore, only upper critical velocity, V c, beyond which a coating defect is observed for different flow rates, was studied. The operating window for the Newtonian fluids are presented in Figure 6.4. The type of coating defect outside the operating window has also been presented. For all test fluids, as the volume flow rate of fluid through the slot die was increased, the critical web velocities for the onset of a coating defect was found to increase. As the fluid viscosity was increased from η = 0.15 Pa.s to η = 5 Pa.s, the critical web velocity for the onset of a coating defect for any given flow rates, was found to decrease by a factor of more than three. Increasing the viscosity further from η = 5 Pa.s to η = 30 Pa.s only slightly decreased the critical web velocities. This decrease in the critical web velocities for the onset of a coating defect with increasing viscosity suggests that the fluid viscosity has a negative impact on the size of the operating window. This behavior is consistent with the literature observations for the case of homogenous Newtonian solutions (166; 177; 180; 162; 181; 172; 182). Outside the operating window, a number of different types of coating defects were observed for the three fluids as shown in the images in Figure 6.5. For the Silicone5 fluid, the coating defect at low web speeds was initially observed to be air entrainment. As the velocity of the web was further increased well beyond the stable coating window a secondary transition from air entrainment to a regular pattern of alternating waves of dry and wet stripes across the web known as a ribbing defect 122

 stable coating of 5 Pa.s silicone oil at Q = 30.")
 ribbing defect for 5 Pa.s silicone oil at Q = 30.")
 air entrainment defect in 30 Pa.s silicone oil at Q = 24.")
145 (a) (b) (c) Dry lane Fluid lane Roll motion Air bubble 5 mm 5 mm 5 mm (d) (e) (f) Breakline 5 mm Wet spot 5 mm 5 mm Figure 6.5: Images of coating for different Newtonian test fluids outside the operating window at a coating gap of 0.25 mm. The images include a) stable coating of 5 Pa.s silicone oil at Q = 30.5 mm 3 /s, V = 3.2 mm/s, b) air entrainment defect for 5 Pa.s silicone oil at Q = 30.5 mm 3 /s, V = 5.7 mm/s, c) ribbing defect for 5 Pa.s silicone oil at Q = 30.5 mm 3 /s, V = 11.8 mm/s, d) breaklines defect in 30 Pa.s silicone oil at Q = 24.9 mm 3, V = 4.1 mm/s e) air entrainment defect in 30 Pa.s silicone oil at Q = 24.9 mm 3, V = 4.8 mm/s and, f) irregular ribbing and air entrainment in PPG at Q = 22.2 mm 3 /s, V = 11.6 mm/s. 123
146 was observed. An image of this ribbing defect is shown in Figure 6.5c. The critical velocity for the onset of ribbing for different volume flow rates of Silicone5 through the slot die coating head is also shown in Figure 6.4. For the case of the Silicone30 fluid, which is six times more viscous than Silicone5 fluid, the coating defect were found to evolve as breaklines as shown in the image presented in Figure 6.5d. Unlike Silicone5 fluid, no ribbing defect was observed at large velocities. However, the defect evolves to air entrainment at large velocities as shown in the Figure 6.5e. For the low viscosity PPG fluid, the coating defect outside the operating window is a combination of large irregular ribs and isolated dewetting spots as shown in the images in Figure 6.5e and 6.5f. Note that the high viscosity Newtonian silicone oils and the PPG fluids have slightly different static contact angles with the PET substrate. This difference can influence the operating window. It is possible that the silicon oil could be slightly less stable due to their larger advancing contact angle (183). However, when the Newtonian PPG and silicone oil experiments are renormalized using the Capillary number and plotted against film thickness, as we will discuss in the next section, the effect of contact angle does not appear to be important as all data appears to follow a consistent trend Non-Newtonian fluids In order to examine the effect of shear-thickening on the operating window, slot-die coating measurements were performed on a series of fumed silica nanoparticle dispersions in PPG with varying silica concentration ranging from 5 to 10 wt%. The volume flow rate of the fluid through the slot-die coater head versus the critical web velocity for the onset of coating defect is shown in Figure 6.6 for these non-newtonian test fluids and the pure PPG for reference. For all concentrations, the critical velocity for the onset of defect increased with increasing flow rate. As the particle concentration was increased from 0 wt% up to 7.5 wt%, the critical web velocity was observed to decrease by a factor of more than three. Increasing the particle concentration beyond 7.5 wt% concentration, was found to only slightly decrease the critical web velocity for the onset 124
147 3 a ) R ib /s ] R ib F lo w R a te, Q [m m R ib Irre g u la r R ib + A E C ritic a l V e lo c ity, V c [m m /s] b ) /H ) [P a.s ] S h e a r V is c o s ity, ( c = V c C ritic a l V e lo c ity, V c [m m /s] Figure 6.6: a) Flow rate, Q versus critical velocity for the onset of defect, V c and b) viscosity, η( γ c = V c /H), versus critical velocity for the onset of coating defect, V c for a series of fumed silica dispersions in PPG at a coating gap of 0.25 mm. The data include a series of particle concentrations: ( ) 0 wt%, ( ) 5.0 wt%, ( ) 7.5 wt% and ( ) 10 wt%. Symbols correspond to the data points presented in the operating window for different particle concentrations. The coating defects beyond the critical velocities are labeled as AE for air entrainment and Rib for ribbing. 125
148 of defect. The overall decrease in the critical web velocity for the onset of the coating defect with increasing particle concentration at any given flow rate suggests that the addition of particles has a negative impact on the size of the operating window. However, it is important to note that as seen in Figure 6.2 adding fumed silica particles to PPG increases the viscosity of the fluid. As shown for Newtonian fluids in Figure 6.4, it is known that increasing the viscosity of the test fluid destabilizes the coating window by reducing the critical web velocity for coating defect to appear. Here the fluids are non-newtonian and the fluid viscosities are not constant, but depend on the shear-rate within the slot-die and in the coating gap between the slot-die head and the moving web. The shear rate between the slot-die head and the moving web depends on both the volume flow rate of fluid and the velocity of the moving web. If we assume all the fluid is deposited on the web and none drips off the side of the web, we can derive the following velocity profile u = 6Q LH 3 (yh y2 ) +V (1 3y H )(1 y ). (6.1) H From eq3 the shear shear rate across the gap can be calculated as γ = 6Q 2y (1 LH2 H ) + V H (6y 4). (6.2) H The viscosity η( γ avg ) of each fluid is presented in Figure 6.6b evaluated at the average shear rate between the die and the moving web at the critical web velocity and the volume flow rate conditions associated with the onset of coating defect in Figure 6.6a. This data is presented so that the correlation of fluid viscosity to the trends in operating window can be examined for each different nanoparticle dispersions. For 5 wt% case, the critical shear rate at the onset of the coating defect are well into the high shear rate constant viscosity regime and do not vary much with the web velocity. For the concentration beyond 5 wt%, the critical shear rates at the onset of defect were all well into the shear-thickening regime. At those processing conditions, the 10 wt% case has a viscosity that is more than two orders of magnitude larger than both the 5 wt% case and the 126
 5 wt% at Q = 22.2 mm 3 /s, V = 12.7 mm/s b) 7.5 wt% at Q = 22.2 mm 3 /s, V = 14.4 mm/s and c) 10 wt% Q = 22.2 mm 3 /s, V = 13.5 mm/s.")


149 (a) (b) (c) 6.1 mm Wet rib 5.0 mm Dry rib 5 mm 5 mm 5 mm Figure 6.7: Images of ribbing defect for a series of fumed silica dispersions in PPG outside the operating window for a coating gap of 0.25 mm. The images include for particle concentrations of a) 5 wt% at Q = 22.2 mm 3 /s, V = 12.7 mm/s b) 7.5 wt% at Q = 22.2 mm 3 /s, V = 14.4 mm/s and c) 10 wt% Q = 22.2 mm 3 /s, V = 13.5 mm/s. pure PPG case. As seen for the Newtonian fluids in Figure 6.4, increased viscosity is known to reduce the coating window. The question we would like to answer is whether these variation can be explained by increased viscosity alone or whether shear thickening and the variation of fluid viscosity across the gap fundamentally change the stability window and the dynamics of coating defect. The images of different coating defects presented outside the operating window for the non- Newtonian fluids are shown in Figure 6.7. As described previously, at zero particle concentration, the coating defect outside the operating window appear as a combination of irregular bands and large dewetted regions or spots across the web. As the particle concentration was increased, the coating defect evolves to more uniform ribs with periodic patterns of dry and wet regions across the web. This ribbing instability is shown in the images in Figure 6.7 for the three different particle concentrations. The ribbing instability is one of the most commonly observed defect in coating flows for both Newtonian and viscoelastic fluids (184; 185; 186; 187; 188; 189; 190; 191; 184; 156). The mechanism of ribbing has been extensively investigated in literature, both theoretically (185; 192; 186) as well as experimentally (184; 156; 190). The ribbing evolution is commonly related to Saffmon-Taylor instabilty, a free surface flow instability where a fluid film splits in multiple films or fibrils due to adverse pressure gradient driven by viscous forces (193). The 127

 air fingers evolution at feed exit and propagation as ribbing downstream for t > 1.63 s.")


150 Upstream Upstream Feed exit a) 5 mm b) c) a) b) 5 mm 5 mm Roll motion 0 s Air fingers 0.46 s Air fingers 1.63 s d) c) 5 mm e) d) 5 mm f) 5 mm 3.26 s Ribbing 5.79 s 8.13 s Figure 6.8: Time series of images of evolution of the ribbing instability of 10 wt% silica in PPG dispersions at a flow rate of 16.6 mm 3 /s and web speed of 6.5 mm/s at a coating gap of 0.1 mm. The images include a) stable coating at t = 0 s b) the upstream meniscus approaching the feed exit at t = 0.46 s, c-f) air fingers evolution at feed exit and propagation as ribbing downstream for t > 1.63 s. evolution of the observed ribbing instability for the 10 wt% shear-thickening fluid is shown in Figure 6.8 as a series of images with increasing time for a constant volume flow rate and web speed. As the web velocity is increased, the upstream meniscus approaches the feed exit and air fingers evolve from the feed exit. These air fingers propagate further downstream, without breaking up into air pockets, evolving to a periodic array of stable long fluid stripes across the web separated by lanes of dry webbing. This evolution of ribbing is similar to reported by Romero et. al (156) for the case when no vaccum is applied upstream. However, they show that when a vacuum is applied at the upstream, the upstream meniscus is stabilized and the ribbing instability evolves instead from the downstream meniscus with air fingers invading the coating bead. We have further examined the intensity of the ribbing defect outside the operating window by comparing between different fumed silica concentrations in order to study the sensitivity of the instability to the fluids rheology and the strength of the shear-thickening behavior. From Figure 6.7, it is clear that as the particle concentration is increased, the intensity of the ribbing also increases 128
151 a ) N o rm a liz e d T h ic k n e s s o f W e t R ib, d w W e b V e lo c ity, V -V c [m m /s] b ) 1 2 N u m b e r o f W e t R ib s C ro ss-w e b W e b V e lo c ity, V -V c [m m /s] Figure 6.9: Ribbing defect parameters, a) normalized mean thickness of the wet rib, d w = d/l, and b) number of wet ribs across the web, as a function of web velocity, V - V c, at a flow rate of 22.2 mm 3 /s for ( ) 7.5 wt% and ( ) 10 wt% fumed silica dispersion in PPG. 129
152 with, the thickness of the wet ribs decreasing and the number of ribs increasing. These observations can be quantified as a function of web velocity and are compared between 7.5 wt% and 10 wt% concentrations at a fixed volume flow rate and increasing web velocity in Figure 6.9. The width of the dry and wet ribs and their placement across the web was not completely uniform, as a result error bars which quantify the experiment to experiment fluctuations are placed over the data in Figure 6.9a. Due to the rib pattern variations across the film, it was determined that the periodicity or wave number of the ribbing was not the appropriate variable to quantify. Instead, we present the number of wet ribs across the web in Figure 6.9b in addition to the mean thickness of the wet ribs. For both concentrations, with increasing velocity the mean thickness of wet rib was found to decrease while the number of wet ribs were found to increase. At any given velocity, the mean thickness of the wet ribs is lower for 10 wt% fumed silica dispersion compared to 7.5 wt% case and the number ribs is larger. These observations suggest that increasing shear-thickening behavior maximizes the intensity of ribbing instability by not only driving the instability to lower critical web velocity but by increasing the number of ribs and the rate of change of rib width with increasing web speed. Previous studies on dilute particle dispersions have reported that, when the coating defect is air entrainment, the addition of particles to a coating fluid improves the coating window (174; 175; 177). However, in the case of fumed silica nanoparticle dispersions in PPG the coating defect is ribbing, where the ribbing instability is known to occur due to large adverse pressure gradient (193), a different mechanism compared to air entrainment, which is commonly associated with a failure of dynamic wetting contact line (172; 194; 182). Lin et al. (177) have examined the influence of particle addition when the coating defect was ribbing. The addition of particles was not found to have any significant impact on operating window, however the observations were based on limited range of particle concentrations. In all their experiments the viscosity was quite low and Newtonian. Here shear thickening plays a significant role in the stability of the coating. 130
153 N o rm a liz e d M in im u m W e t T h ic k n e s s, t N C a p illa ry n u m b e r, C a Figure 6.10: Normalized minimum wet thickness, t N, as a function of capillary number, Ca, for a series of test fluids. The data include a series of fumed silica dispersions in PPG with different particle concentrations: ( ) 0 wt%, ( ) 5.0 wt%, ( ) 7.5 wt% and ( ) 10 wt%. The data for Newtonian silicone oils of viscosities ( ) η = 5 Pa.s and ( ) η = 30 Pa.s is also included. The capillary number is evaluated as, Ca = η( γ c )V c /σ, where γ c = V c /H. The dotted line is a fit to the Newtonian fluid response using a viscocapillary model given in Eq.6.3. One way to clearly see the effect of non-newtonian viscosity on the stability of slot die coating is to study the operating window by plotting the minimum wet thickness, t, as a function of the dimensionless capillary number, Ca = ηv c /σ. The capillary number is the dimensionless ratio of viscous to capillary forces. For the non-newtonian nanoparticle dispersions, the shear-ratedependent viscosity, η( γ), will be used to evaluate the viscosity where γ will be the average shear rate given in Equation 6.2. As a result, Ca = η( γ)v c /σ. The minimum wet thickness is calculated from conservation of mass to be, t = Q/(V c L), where L is the length of the die. The wet film thickness is commonly normalized with coating gap to form a dimensionless film thickness, t N = t/h. The normalized minimum wet thickness, t N, as a function of capillary number is presented in Figure 6.10 for all three particle dispersions and the Newtonian silicone fluids which were chosen because they had similar viscosities. At low capillary number regime, Ca << 1, where capillary forces are important compared to viscous forces, the minimum wet thickness was found to increase with increasing capillary number. This behavior is consistent with what has been reported in 131
154 literature and is commonly classified as regime I behavior of minimum wet thickness variation with increasing capillary number (10; 166). Following Carvalho et al. (163), the Newtonian fluid data in regime I was fit with the viscocapillary model ( ) 2 3/2 Ca = n (6.3) H/t 1 where n is fit parameter found to be, n = Based on theory (163), n = 0.65 for a low-flow limit condition, where a vacuum is applied at the upstream of the coating bead. This predicts a lower minimum wet thickness values compared to our experiments. This deviation is expected because we did not apply a vacuum at the upstream of the coating bead in the experiments here and is consistent with other group s findings (4; 195). For this low capillary number data, it is clear that the shear thinning of the 5 wt% solution has a detrimental effect on the coating stability. Due to shear thinning, a thin film cannot be easily deposited on the web. As seen in Figure 6.10, a film with a minimum coating thickness that is nearly twice large as that of the Newtonian fluid can only be deposited before the film becomes unstable. This is dramatic increase that only becomes evident when the effect of viscosity is removed by plotting the data as a function of shear rate dependent capillary number. For the larger capillary number regimes the particle concentrations in the dispersions are greater than > 7.5 wt% and shear thickening of the viscosity is observed. With increasing capillary number, the relative importance of viscous forces compared to capillary forces increases. As can be seen in Figure 6.10, the results in the high capillary number regime for Newtonian fluids show that the minimum wet thickness is not strongly dependent on capillary number. In this capillary number regime, the value of the normalized film thickness increases slowly from t N = 0.44 to t N = This behavior is consistent with the high capillary number limit observed for Newtonian fluids in the past (10; 7; 160; 161). Note now that unlike the 5 wt% shear-thinning case for which the complex fluid rheology destabilized the coating, for the shearthickening fluids, once the effects of Newtonian viscosity increase is accounted for through the 132
155 shear rate-dependent capillary number, shear thickening appears to stabilize the coating window. For the 10 wt% solution, this corresponds to a reduction in minimum coating wet film thickness of 12 % on average for a given capillary number. For the 7.5 wt% system, the wet film thickness is decreased by 8 % due to shear thickening. The deviation in the case of shear-thinning and shearthickening fluids, compared to Newtonian fluids, suggests that the viscosity variation of the fluid associated with changes in local shear rates across the coating gap, can have an important influence on the stability of the coating Effect of coating gap As seen in Figure 6.2 the shear-thickening fluids used here have quite a complex rheology. They shear-thin at low shear rates, shear thicken at moderate shear rates and shear thin again at large shear rates. By varying the coating gap, the range of experimentally accessible shear rates can be varied as seen in Equation 6.2 while simultaneously studying the impact of coating gap. Here we focused the gap dependent tests on the 10 wt% solution and the 30 Pa.s silicone oil for a range of coating gaps between 0.1 and 1 mm. The operating window constructed for the both the fluids is shown in Figure 6.11a. For both the Newtonian and non-newtonian fluids the critical velocities for the onset of defect was found to increase with decreasing the coating gap. This was consistent for all flow rates tested. This observation demonstrates that decreasing the coating gap allows one to deposit thinner films on the web and work at much higher speeds there by expanding the operating window. For the Newtonian fluid, the coating defects outside the operating window at all gaps were found to be breaklines. The effect of coating gap on the operating window for Newtonian fluids is consistent with reported in literature for the case of Newtonian fluids (10; 7; 180). The effect of coating gap on the shear-thickening fluid shown in Figure 6.11a was found to be slightly more profound than for the Newtonian fluid. At the largest coating gap, H = 1 mm, the critical web velocities were found to be lower, by as much as 7%, for the 10 wt% shear-thickening fluid compared to the Newtonian oil. However, as the coating gap was decreased to 0.5 mm and 133
156 F lo w R a te, Q [m m 3 a ) /s ] A E B L B L A E B L R ib B L R ib C ritic a l V e lo c ity, V c [m m /s] b ) S h e a r V is c o s ity, ( ), [P a.s ] C ritic a l V e lo c ity, V c [m m /s] Figure 6.11: a) Flow rate, Q, versus critical velocity for the onset of defect, V c, for 10 wt% fumed silica dispersion in PPG (filled symbols) and silicone oil with η = 30 Pa.s (hollow symbols) at different coating gaps and b) Shear viscosity, η( γ) versus critical velocity for the onset of defect, V c, for 10 wt% fumed silica dispersion in PPG and ( ) Newtonian silicone oil for different coating gaps. The data include for different coating gaps: ( ) 0.1 mm, ( ) 0.25 mm, ( ) 0.5 mm and ( ) 1 mm. The viscosity evaluated based on shear-rate in coating gap given by γ c = V c /H is shown in filled in symbols and for viscosity evaluated based on shear-rate in slot-gap given as γ g = 6Q/(LW 2 ) for 1 mm coating gap is shown in half shaded symbols, where W and L are slot-gap width and slot-die length. The coating defects beyond the critical velocities are labeled as AE for air entrainment, BL for breaklines and Rib for ribbing. 134
 0.5 mm at Q = 36.1 mm 3 /s, V = 8.3 mm/s.")

157 (a) (b) 5 mm 5 mm Figure 6.12: Images of coating defect at different coating gaps for 10 wt% fumed silica dispersion in PPG. The images include for coating gaps of a) 0.1 mm at Q = 22.2 mm 3 /s, V = 10.2 mm/s, b) 0.5 mm at Q = 36.1 mm 3 /s, V = 8.3 mm/s. below, the impact on the critical web velocities was found to change sign and the critical velocity became larger than that measured for the Newtonian fluid resulting in films with smaller minimum wet thickness. In fact, for the H = 0.1 mm gap, the critical web velocity was measured to be 18% larger for the shear-thickening fluid compared to Newtonian fluid. Further, the type of coating defect observed beyond the critical web speed was also found to be sensitive to the coating gap. The images of the coating defect outside the operating window for the 10 wt% shear-thickening fluid at different gaps are show in Figure For coating gaps equal to H = 0.25 mm and below, the coating defect was found to be ribbing. While for coating gaps of H 0.5 mm the coating defect was found to be air entrainment. Note that for the Newtonian fluid, the coating defect at all gaps was found to be breaklines. Additionally, the minimum wet thickness as a function of capillary number at different coating gaps was also studied for both Newtonian and 10 wt% shear-thickening fluid and is presented in Figure The capillary number was calculated using a shear-rate-dependent viscosity, η( γ), where the average shear-rate in coating gap, γ c, was given in Equation 6.2. At all gaps, for both shear-thickening and Newtonian fluid, the minimum wet thickness did not change significantly with increasing capillary number. With decreasing coating gap from H = 1 mm to 0.1 mm the minimum wet thickness was found to decrease for both shear-thickening and Newtonian fluids. 135
Large amplitude oscillatory shear rheology of three different shear-thickening particle dispersions
 Rheol Acta (205) 54:60 68 DOI 0.007/s00397-05-0855-x ORIGINAL CONTRIBUTION Large amplitude oscillatory shear rheology of three different shear-thickening particle dispersions Sunilkumar Khandavalli Jonathan
Supplementary Information. Text S1:
 Supplementary Information Text S1: In order to characterize the change in visco-elastic response in the course of a shear thickening transition in a controlled shear stress flow, on a fresh sample of for
Contents. Preface XIII. 1 General Introduction 1 References 6
 VII Contents Preface XIII 1 General Introduction 1 References 6 2 Interparticle Interactions and Their Combination 7 2.1 Hard-Sphere Interaction 7 2.2 Soft or Electrostatic Interaction 7 2.3 Steric Interaction
RHEOLOGY Principles, Measurements, and Applications. Christopher W. Macosko
 RHEOLOGY Principles, Measurements, and Applications I -56081-5'79~5 1994 VCH Publishers. Inc. New York Part I. CONSTITUTIVE RELATIONS 1 1 l Elastic Solid 5 1.1 Introduction 5 1.2 The Stress Tensor 8 1.2.1
The Large Amplitude Oscillatory Strain Response of Aqueous Foam: Strain Localization and Full Stress Fourier Spectrum
 The Large Amplitude Oscillatory Strain Response of Aqueous Foam: Strain Localization and Full Stress Fourier Spectrum By F. Rouyer, S. Cohen-Addad, R. Höhler, P. Sollich, and S.M. Fielding The European
Supplementary material to On the rheology of pendular gels and morphological developments in paste- like ternary systems based on capillary attraction
 Electronic Supplementary Material (ESI) for Soft Matter. This journal is The Royal Society of Chemistry 214 Supplementary material to On the rheology of pendular gels and morphological developments in
Viscoelasticity. Basic Notions & Examples. Formalism for Linear Viscoelasticity. Simple Models & Mechanical Analogies. Non-linear behavior
 Viscoelasticity Basic Notions & Examples Formalism for Linear Viscoelasticity Simple Models & Mechanical Analogies Non-linear behavior Viscoelastic Behavior Generic Viscoelasticity: exhibition of both
Fundamentals of Polymer Rheology. Sarah Cotts TA Instruments Rubber Testing Seminar CUICAR, Greenville SC
 Fundamentals of Polymer Rheology Sarah Cotts TA Instruments Rubber Testing Seminar CUICAR, Greenville SC Rheology: An Introduction Rheology: The study of stress-deformation relationships =Viscosity =Modulus
VISCOELASTIC PROPERTIES OF POLYMERS
 VISCOELASTIC PROPERTIES OF POLYMERS John D. Ferry Professor of Chemistry University of Wisconsin THIRD EDITION JOHN WILEY & SONS New York Chichester Brisbane Toronto Singapore Contents 1. The Nature of
QUIZ 2 OPEN QUIZ WHEN TOLD THERE ARE TWO PROBLEMS OF EQUAL WEIGHT. Please answer each question in a SEPARATE book
 2.341J MACROMOLECULAR HYDRODYNAMICS Spring 2012 QUIZ 2 OPEN QUIZ WHEN TOLD THERE ARE TWO PROBLEMS OF EQUAL WEIGHT Please answer each question in a SEPARATE book You may use the course textbook (DPL) and
Nonlinear Viscoelastic Behaviors of Different Types of O/W Emulsion-Based Mayonnaises in Several Shear Flow Fields
 ANNUAL TRANSACTIONS OF THE NORDIC RHEOLOGY SOCIETY, VOL 19, 211 Nonlinear Viscoelastic Behaviors of Different Types of O/W Emulsion-Based Mayonnaises in Several Shear Flow Fields Hye-Jin Ahn and Ki-Won
The effect of shear-thickening on the stability of slot-die coating
 The effect of shear-thickening on the stability of slot-die coating Sunilkumar Khandavalli a, Jonathan P. Rothstein,a a Mechanical and Industrial Engineering, University of Massachusetts Amherst, MA 01003
Colloidal Suspension Rheology Chapter 1 Study Questions
 Colloidal Suspension Rheology Chapter 1 Study Questions 1. What forces act on a single colloidal particle suspended in a flowing fluid? Discuss the dependence of these forces on particle radius. 2. What
Describing and prescribing the constitutive response of yield stress fluids using large amplitude oscillatory stress (LAOStress)
") Describing and prescribing the constitutive response of yield stress fluids using large amplitude oscillatory stress (LAOStress) Christopher J. Dimitriou, 1 Randy H. Ewoldt, 2 3, a) and Gareth H. McKinley
Describing and prescribing the constitutive response of yield stress fluids using large amplitude oscillatory stress (LAOStress) Christopher J. Dimitriou, 1 Randy H. Ewoldt, 2 3, a) and Gareth H. McKinley
SOLUTIONS TO CHAPTER 5: COLLOIDS AND FINE PARTICLES
 SOLUTIONS TO CHAPTER 5: COLLOIDS AND FINE PARTICLES EXERCISE 5.1: Colloidal particles may be either dispersed or aggregated. (a) What causes the difference between these two cases? Answer in terms of interparticle
Different experimental methods in stress and strain control to characterize non-linear behaviour
 Different experimental methods in stress and strain control to characterize non-linear behaviour Jörg Läuger Anton ar Germany GmbH, Ostfildern / Germany Phone: +49-711-7291-6, info.de@anton-paar.com, www.anton-paar.com
Pharmaceutical compounding I Colloidal and Surface-Chemical Aspects of Dosage Forms Dr. rer. nat. Rebaz H. Ali
 University of Sulaimani School of Pharmacy Dept. of Pharmaceutics Pharmaceutical Compounding Pharmaceutical compounding I Colloidal and Surface-Chemical Aspects of Dosage Forms Dr. rer. nat. Rebaz H. Ali
Viscoelastic Flows in Abrupt Contraction-Expansions
 Viscoelastic Flows in Abrupt Contraction-Expansions I. Fluid Rheology extension. In this note (I of IV) we summarize the rheological properties of the test fluid in shear and The viscoelastic fluid consists
Middle East Technical University Department of Mechanical Engineering ME 305 Fluid Mechanics I Fall 2018 Section 4 (Dr.
 Reading Assignments Middle East Technical University Department of Mechanical Engineering ME 305 Fluid Mechanics I Fall 2018 Section 4 (Dr. Sert) Study Set 1 You can find the answers of some of the following
Interfacial dynamics
 Interfacial dynamics Interfacial dynamics = dynamic processes at fluid interfaces upon their deformation Interfacial rheological properties: elasticity, viscosity, yield stress, Relation between macroscopic
Non-linear Stress Response of Non-gap-spanning Magnetic Chains Suspended. in a Newtonian Fluid Under Oscillatory Shear Test: A Direct Numerical
 Non-linear Stress Response of Non-gap-spanning Magnetic Chains Suspended in a Newtonian Fluid Under Oscillatory Shear Test: A Direct Numerical Simulation M.R. Hashemi, 1 M.T. Manzari, 1, 2, a) and R. Fatehi
Application of a Helmholtz resonator excited by grazing flow for manipulation of a turbulent boundary layer
 Application of a Helmholtz resonator excited by grazing flow for manipulation of a turbulent boundary layer Farzin Ghanadi School of Mechanical Engineering The University of Adelaide South Australia, 5005
On the effects of Non-Newtonian fluids above the ribbing instability
 On the effects of Non-Newtonian fluids above the ribbing instability L. Pauchard, F. Varela LÓpez*, M. Rosen*, C. Allain, P. Perrot** and M. Rabaud Laboratoire FAST, Bât. 502, Campus Universitaire, 91405
Rheology of Soft Materials. Rheology
 Τ Thomas G. Mason Department of Chemistry and Biochemistry Department of Physics and Astronomy California NanoSystems Institute Τ γ 26 by Thomas G. Mason All rights reserved. γ (t) τ (t) γ τ Δt 2π t γ
Contents. Preface XIII
 V Contents Preface XIII 1 General Introduction 1 1.1 Fundamental Knowledge Required for Successful Dispersion of Powders into Liquids 1 1.1.1 Wetting of Powder into Liquid 1 1.1.2 Breaking of Aggregates
Simulating shear thickening fluids with fractional derivatives
 Simulating shear thickening fluids with fractional derivatives Eric Brown, Oktar Ozgen, Marcelo Kallman University of California, Merced Fractional Calculus Day June 12, 2013 work supported by: DARPA-Army
USE OF RHEOLOGY AS A DEVELOPING AND TROUBLESHOOTING TOOL FOR PSA APPLICATIONS.
 USE OF RHEOLOGY AS A DEVELOPING AND TROUBLESHOOTING TOOL FOR PSA APPLICATIONS. Michael DeFrancisis, Applications Engineer, Henkel, Bridgewater, NJ Yayun Liu, Senior Development Scientist, Henkel, Bridgewater,
Ablaos Asphalt Binder Large Amplitude Oscillatory Shear
 Michael J. Farrar mfarrar@uwyo.edu Jean-Pascal Planche Alec Otto Cookman Steve Salmans Ablaos Asphalt Binder Large Amplitude Oscillatory Shear Binder ETG Baton Rouge, LA Sept. 16, 2014 Outline Linear Viscoelasticity
(2.1) Is often expressed using a dimensionless drag coefficient:
 Is often expressed using a dimensionless drag coefficient:") 1. Introduction Multiphase materials occur in many fields of natural and engineering science, industry, and daily life. Biological materials such as blood or cell suspensions, pharmaceutical or food products,
1. Introduction Multiphase materials occur in many fields of natural and engineering science, industry, and daily life. Biological materials such as blood or cell suspensions, pharmaceutical or food products,
How to measure the shear viscosity properly?
 testxpo Fachmesse für Prüftechnik 10.-13.10.2016 How to measure the shear viscosity properly? M p v Rotation Capillary Torsten Remmler, Malvern Instruments Outline How is the Shear Viscosity defined? Principle
Measuring the rheology of thermoplastic polymer melts
 Measuring the rheology of thermoplastic polymer melts Using rotational and capillary rheometry to characterize polymer melts RHEOLOGY AND VISCOSITY Introduction Rheology is the science of studying the
Madrid, 8-9 julio 2013
 VI CURSO DE INTRODUCCION A LA REOLOGÍA Madrid, 8-9 julio 2013 NON-LINEAR VISCOELASTICITY Prof. Dr. Críspulo Gallegos Dpto. Ingeniería Química. Universidad de Huelva & Institute of Non-Newtonian Fluid Mechanics
Polymer Rheology. P Sunthar. Department of Chemical Engineering Indian Institute of Technology, Bombay Mumbai , India
 Polymer Rheology P Sunthar Department of Chemical Engineering Indian Institute of Technology, Bombay Mumbai 400076, India P.Sunthar@iitb.ac.in 05 Jan 2010 Introduction Phenomenology Modelling Outline of
Journal of Non-Newtonian Fluid Mechanics
 Journal of Non-Newtonian Fluid Mechanics 175-176 (2012) 64 75 Contents lists available at SciVerse ScienceDirect Journal of Non-Newtonian Fluid Mechanics journal homepage: http://www.elsevier.com/locate/jnnfm
Seminar Basics on Rheology Extensional Characterization of Fluids
 The world leader in serving science Seminar Basics on Rheology Extensional Characterization of Fluids Why is there a need for Extensional Rheology? Extensional flow fields are relevant in many technical
Evaluating Pigment Dispersion Quality through Dynamic Oscillation Analysis John Meadows, Surface Specialties - UCB
 Evaluating Pigment Dispersion Quality through Dynamic Oscillation Analysis John Meadows, Surface Specialties - UCB Introduction The value of an ink s performance ultimately hinges on the quality of the
Misting in Forward Roll Coating: Structure Property Processing Relationships
 Doctoral Defense University of Minnesota October 27, 24 Misting in Forward Roll Coating: Structure Property Processing Relationships vs. App. Extensional Viscosity, Pa-s GRAVITY EFFECT 2 3 4 5 6 7 8 Hencky
NONLINEAR COMPLEX MODULUS IN BITUMENS
 NONLINEAR COMPLEX MODULUS IN BITUMENS J. Stastna, K. Jorshari and L. Zanzotto Bituminous Materials Chair University of Calgary 2500 University Drive NW Calgary, Alberta T2N 1N4 Canada Large Amplitude Oscillations
Applied Rheology Richard R. Eley, Ph.D. Senior Scientist ICI Paints Sprague Road Strongsville, OH 44136
 Applied Rheology Richard R. Eley, Ph.D. Senior Scientist ICI Paints 16651 Sprague Road Strongsville, OH 44136 The science of Rheology by definition is the study of the deformation and flow behavior of
c 2011 JOSHUA DAVID JOHNSTON ALL RIGHTS RESERVED
 c 211 JOSHUA DAVID JOHNSTON ALL RIGHTS RESERVED ANALYTICALLY AND NUMERICALLY MODELING RESERVOIR-EXTENDED POROUS SLIDER AND JOURNAL BEARINGS INCORPORATING CAVITATION EFFECTS A Dissertation Presented to
A Technique for Characterizing Complex Polymer Solutions in Extensional Flows. Gavin Braithwaite Stephen Spiegelberg
 A Technique for Characterizing Complex Polymer Solutions in Extensional Flows Gavin Braithwaite Stephen Spiegelberg Cambridge Polymer Group Inc. Ward Street, Somerville. MA 0243 http://www.campoly.com
Rheology of cellulose solutions. Puu Cellulose Chemistry Michael Hummel
 Rheology of cellulose solutions Puu-23.6080 - Cellulose Chemistry Michael Hummel Contents Steady shear tests Viscous flow behavior and viscosity Newton s law Shear thinning (and critical concentration)
::: Application Report
 Interfacial Shear Rheology of Coffee Samples Explore the secrets of a perfect crema! This application report presents typical measurements on the film formation and on the interfacial rheological properties
CM4655 Polymer Rheology Lab. Torsional Shear Flow: Parallel-plate and Cone-and-plate
 CM4655 Polymer heology Lab Torsional Shear Flow: Parallel-plate and Cone-and-plate (Steady and SAOS) Professor Faith A. Morrison Department of Chemical Engineering Michigan Technological University r (-plane
Lecture 2. Simple shear devices. Simple shear devices 2. Simple shear devices 3. Moving plate. Velocity V. Force F. Area A. height h.
 Lecture 2 Rheometry Simple shear devices Steady shear viscosity Normal stresses Oscillating shear Extensional viscosity Scalings Nondimensional parameter Simple shear devices Conceptual device for simple
Modelling the Rheology of Semi-Concentrated Polymeric Composites
 THALES Project No 1188 Modelling the Rheology of Semi-Concentrated Polymeric Composites Research Team Evan Mitsoulis (PI), Professor, NTUA, Greece Costas Papoulias (Research Student), NTUA, Greece Souzanna
Suspension Stability; Why Particle Size, Zeta Potential and Rheology are Important
 ANNUAL TRANSACTIONS OF THE NORDIC RHEOLOGY SOCIETY, VOL. 20, 2012 Suspension Stability; Why Particle Size, Zeta Potential and Rheology are Important Mats Larsson 1, Adrian Hill 2, and John Duffy 2 1 Malvern
Rheology The relationship between rheological response and material structure
 Rheology The relationship between rheological response and material structure Márta Berka University of Debrecen Dept of Colloid and Environmental Chemistry http://dragon.unideb.hu/~kolloid/ Introduction
Chain-configuration and rate dependent rheological properties in transient networks
 Electronic Supplementary Material (ESI) for Soft Matter. This journal is The Royal Society of Chemistry 204 Supplementary Information Chain-configuration and rate dependent rheological properties in transient
Low-dimensional intrinsic material functions for nonlinear viscoelasticity
 Author-created version, to be published in Rheologica Acta The final publication is available at www.springerlink.com (DOI: 1.17/s397-13-686-6) Low-dimensional intrinsic material functions for nonlinear
Lecture 7: Rheology and milli microfluidic
 1 and milli microfluidic Introduction In this chapter, we come back to the notion of viscosity, introduced in its simplest form in the chapter 2. We saw that the deformation of a Newtonian fluid under
The Capillary Breakup Extensional Rheometer (CABER )
") Cambridge Polymer Group, Inc. Testing, Consultation, and Instrumentation for Polymeric Materials CPGAN # 007 Not for Duplication or Distribution The Capillary Breakup Extensional Rheometer (CABER ) Introduction
Cambridge Polymer Group, Inc. Testing, Consultation, and Instrumentation for Polymeric Materials CPGAN # 007 Not for Duplication or Distribution The Capillary Breakup Extensional Rheometer (CABER ) Introduction
Origins of Mechanical and Rheological Properties of Polymer Nanocomposites. Venkat Ganesan
 Department of Chemical Engineering University of Texas@Austin Origins of Mechanical and Rheological Properties of Polymer Nanocomposites Venkat Ganesan $$$: NSF DMR, Welch Foundation Megha Surve, Victor
SUMMARY A STUDY OF VISCO-ELASTIC NON-NEWTONIAN FLUID FLOWS. where most of body fluids like blood and mucus are non-newtonian ones.
 SUMMARY A STUDY OF VISCO-ELASTIC NON-NEWTONIAN FLUID FLOWS Non-Newtonian fluids abound in many aspects of life. They appear in nature, where most of body fluids like blood and mucus are non-newtonian ones.
Introduction to Viscometry and Rheology, Basics, Rotational Testing. Basic Seminar Applied Rheology
 Introduction to Viscometry and Rheology, Basics, Rotational Testing Basic Seminar Applied Rheology Contents Definition of basic rheological parameters Viscosity and elasticity Deformation, shear stress
CH5716 Processing of Materials
 CH5716 Processing of Materials Ceramic Thick Film Processing Lecture MC5 Slurry Characterisation Specific Surface Area Powder size & specific surface area (area per unit wt) closely related As particle
Two Day Workshop on Rheology of Polymer Melts
 Two Day Workshop on Rheology of Polymer Melts : Organized by The Indian Society of Rheology, CoE SPIRIT, and Venture Center : Introduction to the fundamentals of rheology with special emphasis on the rheology
Rheological And Dielectric Characterization of Thermosetting Polymers. Jeffrey Gotro, Ph.D.
 Rheological And Dielectric Characterization of Thermosetting Polymers Outline Introduction Oscillatory parallel plate rheometry Dynamic dielectric measurements Simultaneous dynamic mechanical/dielectric
Rheological Properties
 Rheological Properties Shear Stress the force experienced by the liquid is proportional to the area of the upper plate and is defined as the shear stress, σ = F/A (Units = Nm -2 or Pascals [Pa]) Shear
Effect of associating polymer on the dispersion stability and rheology of suspensions
 Korea-Australia Rheology Journal Vol. 15, No. 1, March 2003 pp. 27-33 Effect of associating polymer on the dispersion stability and rheology of suspensions Yasufumi Otsubo* and Misao Horigome 1 Department
I. Comparison between rheological data obtained by using the shear rate sweep and frequency
 Electronic Supplementary Material (ESI) for Soft Matter. This journal is The Royal Society of Chemistry 2017 ELECTRONIC SUPPLEMENTARY INFORMATION (ESI) I. Comparison between rheological data obtained by
Non contact measurement of viscoelastic properties of biopolymers
 Non contact measurement of viscoelastic properties of biopolymers Christelle Tisserand, Anton Kotzev, Mathias Fleury, Laurent Brunel, Pascal Bru, Gérard Meunier Formulaction, 10 impasse Borde Basse, 31240
Micro and Macro in the Dynamics of Dilute Polymer Solutions
 Micro and Macro in the Dynamics of Dilute Polymer Solutions Ravi Prakash Jagadeeshan Complex Fluid Mechanics Closed form equations Constitutive Equations Stress Calculator Simulations (BDS etc) Homogeneous
c 2009 Michael Dean Bybee
 c 29 Michael Dean Bybee HYDRODYNAMIC SIMULATIONS OF COLLOIDAL GELS: MICROSTRUCTURE, DYNAMICS, AND RHEOLOGY BY MICHAEL DEAN BYBEE B.S., Brigham Young University, 23 M.S., University of Illinois at Urbana-Champaign,
Non-linear Viscoelasticity FINITE STRAIN EFFECTS IN SOLIDS
 FINITE STRAIN EFFECTS IN SOLIDS Consider an elastic solid in shear: Shear Stress σ(γ) = Gγ If we apply a shear in the opposite direction: Shear Stress σ( γ) = Gγ = σ(γ) This means that the shear stress
University Graz / Austria Institut für Chemie Volker Ribitsch
 University Graz / Austria Institut für Chemie Volker Ribitsch 1 Rheology Oscillatory experiments Dynamic experiments Deformation of materials under non-steady conditions in the linear viscoelastic range
Guideline for Rheological Measurements
 Guideline for Rheological Measurements Typical Measurements, Diagrams and Analyses in Rheology www.anton-paar.com General Information: = Measurement = Diagram = Analysis Important Rheological Variables:
Chapter 6 Molten State
 Chapter 6 Molten State Rheology ( 流變學 ) study of flow and deformation of (liquid) fluids constitutive (stress-strain) relation of fluids shear flow shear rate ~ dγ/dt ~ velocity gradient dv 1 = dx 1 /dt
Solvent casting flow from slot die
 Korea-Australia Rheology Journal, 27(4), 325-329 (November 2015) DOI: 10.1007/s13367-015-0032-x www.springer.com/13367 Short Communication Semi Lee and Jaewook Nam* School of Chemical Engineering, Sungkyunkwan
CM4650 Polymer Rheology
 CM4650 Polymer Rheology CM4650 Polymer Rheology Michigan Tech Professor Faith A. Morrison Department of Chemical Engineering Michigan Technological University Text: Faith A. Morrison, Understanding Rheology
RHEOLASER LAB MICRORHEOLOGY & END USE PROPERTIES ANALYSIS. MICRORHEOLOGY
 RHEOLASER LAB & END USE PROPERTIES ANALYSIS A NEW RHEOLOGY APPROACH TO CHARACTERISE END-USE PROPERTIES THE FIRST READY TO USE & END-USE PROPERTIES ANALYSER Rheolaser Rheolaser is the first Lab ready-to-use
Novel method for on-line rheology measurement in manufacturing of non- Newtonian liquids
 Novel method for on-line rheology measurement in manufacturing of non- Newtonian liquids Fridolin Okkels, Anders L. Østergård, Mohammad Amin Mohammadifar 2 Fluidan ApS, Kgs. Lyngby, Denmark 2 National
Discontinuous Shear Thickening
 Discontinuous Shear Thickening dynamic jamming transition Ryohei Seto, Romain Mari, Jeffrey F. Morris, Morton M. Denn Levich Institute, City College of New York First experimental data Williamson and Hecker
Polymer Dynamics and Rheology
 Polymer Dynamics and Rheology 1 Polymer Dynamics and Rheology Brownian motion Harmonic Oscillator Damped harmonic oscillator Elastic dumbbell model Boltzmann superposition principle Rubber elasticity and
Pharmaceutics I صيدالنيات 1. Unit 6
 Pharmaceutics I صيدالنيات 1 Unit 6 1 Rheology of suspensions Rheology, the study of flow, addresses the viscosity characteristics of powders, fluids, and semisolids. Materials are divided into two general
Rheological Modelling of Polymeric Systems for Foods: Experiments and Simulations
 Rheological Modelling of Polymeric Systems for Foods: Experiments and Simulations P.H.S. Santos a, M.A. Carignano b, O.H. Campanella a a Department of Agricultural and Biological Engineering, Purdue University,
PROPERTIES OF POLYMERS
 PROPERTIES OF POLYMERS THEIR CORRELATION WITH CHEMICAL STRUCTURE; THEIR NUMERICAL ESTIMATION AND PREDICTION FROM ADDITIVE GROUP CONTRIBUTIONS Third, completely revised edition By D.W. VÄN KREVELEN Professor-Emeritus,
An Overview of Non-Newtonian Fluid
 International Journal of Applied Science and Engineering 4(2): December, 2016: pp. 97-101 DOI: 10.5958/2322-0465.2016.00011.3 2016 New Delhi Publishers. All rights reserved An Overview of Non-Newtonian
Contents. Preface XI Symbols and Abbreviations XIII. 1 Introduction 1
 V Contents Preface XI Symbols and Abbreviations XIII 1 Introduction 1 2 Van der Waals Forces 5 2.1 Van der Waals Forces Between Molecules 5 2.1.1 Coulomb Interaction 5 2.1.2 Monopole Dipole Interaction
Rheology, Adhesion, and Debonding of Lightly Cross-linked Polymer Gels
 Rheology, Adhesion, and Debonding of Lightly Cross-linked Polymer Gels Nicholas B. Wyatt, and Anne M. Grillet 2 Materials Science and Engineering Division 2 Engineering Sciences Division Sandia National
A Comprehensive Approach to Barite Sag Analysis on Field Muds
 AADE-13-FTCE-30 A Comprehensive Approach to Barite Sag Analysis on Field Muds Sharath Savari, Sandeep Kulkarni, Jason Maxey, and Kushabhau Teke, Halliburton Copyright 2013, AADE This paper was prepared
Performance evaluation of different model mixers by numerical simulation
 Journal of Food Engineering 71 (2005) 295 303 www.elsevier.com/locate/jfoodeng Performance evaluation of different model mixers by numerical simulation Chenxu Yu, Sundaram Gunasekaran * Food and Bioprocess
Rheological study on the aging process in a polymeric fumed silica suspension
 ANNUAL TRANSACTIONS OF THE NORDIC RHEOLOGY SOCIETY, VOL. 15, 2007 Rheological study on the aging process in a polymeric fumed silica suspension F.J. Galindo Rosales 1, F.J. Rubio Hernández 2 and J.F. Velázquez
Rheology and Constitutive Equations. Rheology = Greek verb to flow. Rheology is the study of the flow and deformation of materials.
 Rheology and Constitutive Equations Rheology = Greek verb to flow Rheology is the study of the flow and deformation of materials. The focus of rheology is primarily on the study of fundamental, or constitutive,
Mechanical properties of polymers: an overview. Suryasarathi Bose Dept. of Materials Engineering, IISc, Bangalore
 Mechanical properties of polymers: an overview Suryasarathi Bose Dept. of Materials Engineering, IISc, Bangalore UGC-NRCM Summer School on Mechanical Property Characterization- June 2012 Overview of polymer
50%-50% Beam Splitters Using Transparent Substrates Coated by Single- or Double-Layer Quarter-Wave Thin Films
 University of New Orleans ScholarWorks@UNO University of New Orleans Theses and Dissertations Dissertations and Theses 5-22-2006 50%-50% Beam Splitters Using Transparent Substrates Coated by Single- or
Extensional rheology of shear-thickening nanoparticle suspensions
 PAPER www.rsc.org/softmatter Soft Matter Extensional rheology of shear-thickening nanoparticle suspensions Manojkumar Chellamuthu, Eric M. Arndt and Jonathan P. Rothstein* Received 19th November 2008,
MODELING ON THE BREAKUP OF VISCO-ELASTIC LIQUID FOR EFFERVESCENT ATOMIZATION
 1446 THERMAL SCIENCE, Year 2012, Vol. 16, No. 5, pp. 1446-1450 MODELING ON THE BREAKUP OF VISCO-ELASTIC LIQUID FOR EFFERVESCENT ATOMIZATION by Li-Juan QIAN * China Jiliang University, Hangzhou, China Short
MECHANICAL PROPERTIES
 MECHANICAL PROPERTIES Rheology S.C. BAYNE, 1 J.Y. Thompson 2 1 University of Michigan School of Dentistry, Ann Arbor, MI 48109-1078 sbayne@umich.edu 2 Nova Southeastern College of Dental Medicine, Ft.
Modeling of Anisotropic Polymers during Extrusion
 Modeling of Anisotropic Polymers during Extrusion Modified on Friday, 01 May 2015 10:38 PM by mpieler Categorized as: Paper of the Month Modeling of Anisotropic Polymers during Extrusion Arash Ahmadzadegan,
Shear rheology of polymer melts
 Shear rheology of polymer melts Dino Ferri dino.ferri@versalis.eni.com Politecnico Alessandria di Milano, 14/06/2002 22 nd October 2014 Outline - Review of some basic rheological concepts (simple shear,
2D TIME AVERAGED FLOW MAPPING OF DIE ENTRY IN FLOW OF HIGHLY CONCENTRATED SHEAR-THINNING AND SHEAR-THICKENING SUSPENSIONS
 2D TIME AVERAGED FLOW MAPPING OF DIE ENTRY IN FLOW OF HIGHLY CONCENTRATED SHEAR-THINNING AND SHEAR-THICKENING SUSPENSIONS Boris Ouriev (Ur ev) Bühler AG, Uzwil, CH-9244, Switzerland, e-mail: boris.ouriev@buhlergroup.com
1 Rheology of Disperse Systems
 7 1 Rheology of Disperse Systems Norbert Willenbacher and Kristina Georgieva 1.1 Introduction The rheology of disperse systems is an important processing parameter. Being able to characterize and manipulate
The effect of step-stretch parameters on capillary breakup extensional rheology (CaBER) measurements
 measurements") DOI 1.17/s397-9-357-9 ORIGINAL CONTRIBUTION The effect of step-stretch parameters on capillary breakup extensional rheology (CaBER) measurements Erik Miller Christian Clasen Jonathan P. Rothstein Received:
DOI 1.17/s397-9-357-9 ORIGINAL CONTRIBUTION The effect of step-stretch parameters on capillary breakup extensional rheology (CaBER) measurements Erik Miller Christian Clasen Jonathan P. Rothstein Received:
Pharmaceutics I. Unit 6 Rheology of suspensions
 Pharmaceutics I اينالديصيدلينيات 1 Unit 6 Rheology of suspensions 1 Rheology, the science of the flow or deformation of matter (liquid or soft solid) under the effect of an applied force. It addresses
DIFFERENCE IN THERMOFORMING PROCESSABILITY OBSERVED FOR THREE HIGH IMPACT POLYSTYRENES
 Page 1 of 5 DIFFERENCE IN THERMOFORMING PROCESSABILITY OBSERVED FOR THREE HIGH IMPACT POLYSTYRENES Caroline Woelfle, Kurt Koppi, Stephane Costeux, Todd Hogan, Joe Dooley, Ronald Van Daele, Alexander De
Large amplitude oscillatory shear of pseudoplastic and elastoviscoplastic materials
 Large amplitude oscillatory shear of pseudoplastic and elastoviscoplastic materials The MIT Faculty has made this article openly available. Please share how this access benefits you. our story matters.
Critical Phenomena under Shear Flow
 Critical Phenomena under Shear Flow Pavlik Lettinga, Hao Wang, Jan K.G. Dhont Close to a gas-liquid critical point, effective interactions between particles become very long ranged, and the dynamics of
The Rheology Handbook
 Thomas G. Mezger The Rheology Handbook For users of rotational and oscillatory rheometers 2nd revised edition 10 Contents Contents 1 Introduction 16 1.1 Rheology, rheometry and viscoelasticity 16 1.2 Deformation
Effect of surfactant adsorption on the rheology of suspensions flocculated by associating polymers
 Korea-Australia Rheology Journal Vol. 15, No. 4, December 2003 pp. 179-185 Effect of surfactant adsorption on the rheology of suspensions flocculated by associating polymers Yasufumi Otsubo* and Misao