Pharmacometrics : Nonlinear mixed effect models in Statistics. Department of Statistics Ewha Womans University Eun-Kyung Lee
|
|
|
- Hester Blair
- 5 years ago
- Views:
Transcription

1 Pharmacometrics : Nonlinear mixed effect models in Statistics Department of Statistics Ewha Womans University Eun-Kyung Lee 1

2 Clinical Trials Preclinical trial: animal study Phase I trial: First in human, small number of healthy v olunteers, dose finding Phase II/III trial: First in patient. Large number of patie nts. Prepare for FDA approval 2
3 Phase I clinical trial first in human small number of healthy volunteers, usually 10~20 Purpose find the right dose for human check toxicity After administration, collect the following information Cp: the drug concentration in blood Time: usually for 24 hours Effect: the effect of drug (eg. Blood pressure for hypertension drug) 3
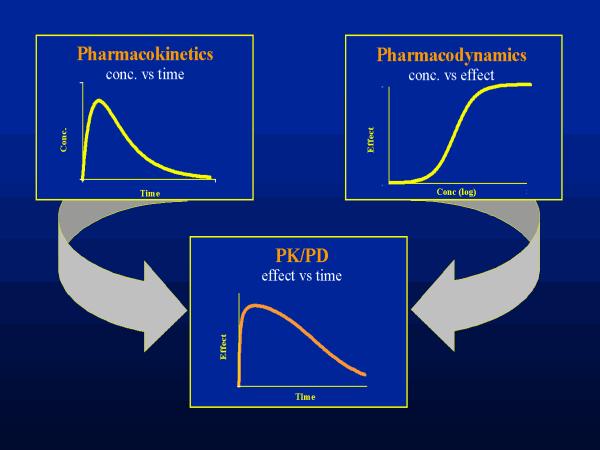
4 Pharmacometrics PK PD

5 Schematics of PK Absorption Distribution Metabolism Elimination 5
6 Schematics of PK and PD PD Efficacy Toxicity PK Tissue (Effect site) Distribution Drug admin Absorption Blood Metabolism Excretion 6
7 Theophylline 7
8 One-comp model: Oral admin. with 1 st order absorp. K a K e Elimination X GI Dose X B K a : 1 st order constant absorption rate Data : C t, t, dose Parameters : K a, K e, V K e : elimination constant rate V : volume of distribution (theoretical volume that total amount of admin. drug would have to occupy to provide the same concentration; large V, more diluted in the blood) Cl : clearance

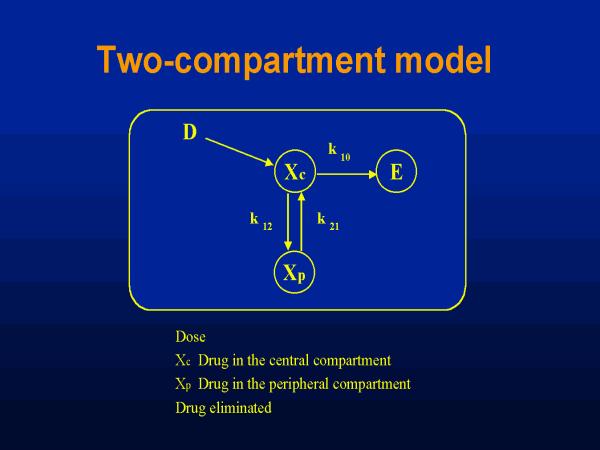
9 two-comp model
10 three-comp model
11 Population approach 1. Structural sub-model Overall trend using fixed-effect parameters 11
12 Population approach 2. Statistical sub-model 1) Intra-individual variability 12
13 Population approach 2) Inter-individual variability C ij : concentration of the ith patient and the jth timepoint K ai : absorption rate of the ith patient V i : volume of distribution of the ith patient K ei : elimination constant rate of the ith patient 13
14 Population approach 3. Covariance sub-model The relationship between covariate and model par ameter! Nonlinear mixed effect model with covariates 14
 θ : PK parameter(v, CL, Ka, etc)")
15 PK Model Individual level model Population level model y ij : measurement of i th subject at time t ij D i : dose t ij : time x i : covariates(weight, height, age, etc) θ : PK parameter(v, CL, Ka, etc) 15
16 Estimation Methods in NONMEM linear approximation approach First order method (FO) First order conditional method (FOCE) Laplacian method (Laplacian) EM algorithm based approach Iterative two stage (ITS) Important Sampling method (IMP) IMP assisted by mode a posteriori (IMPMAP) Stochastic approximation EM(SAEM) Bayesian approach 16
17 References for estimation methods Dempster, A. P., Laird N., and Rubin, D. B (1977) Maximum likelihood from incomplete data via the EM algorithm Laird, N. M. and Ware, J. H (1982) Random-effects models for longitudinal data Wu, C. F. (1983) On the convergence properties of the EM algorithm Lindstorm, M.J., and Bates, D. M(1988) Newton-Raphson and EM algorithms for linear mixed effects models for repeated-measures data Delyon, B., Laville, M., and Moulines, E.(1990) Convergence of a stochastic approximation version of the EM algorithm Lindstorm, M.J., and Bates, D.M(1990) Non-linear mixed-effects models for repeatedmeasures data Wolfinger, R. (1993) Laplace s approximation for nonlinear model Pinheiro, J.C. and Bates, D.M (1994) Approximations to the loglikelihood function in the nonlinear mixed effect model Davidian, M and Giltinan, D. M (1995) Nonlinear Models for Repeated Measurement Data Walker, S (1996) An EM algorithm for Nonlinear Random Effects Models Kuhn, E., and Lavielle, M. (2004) Coupling a stochastic approximation version of EM with a MCMC procedure Kuhn, E., and Lavielle, M.(2005) Maximum likelihood estimation in nonlinear mixed effects models Lavielle, M., and Meza, C. (2007) A parameter expansion version of the SAEM algorithm Meza, C., Jaffrezic, F., and Foulley, J-L (2007) REML estimation of variance parameters in nonlinear mixed effects models using the SAEM algorithm 17
18 Results from NONMEM fitting 1. Estimates of parameters PK/PD population parameter Inter-individual variablility Intra-individual variablility 2. Predictions PRED: predictive values without random effect ( when ) EBE: empirical Bayesian estimate of IPRED: individual level predicted values ( when ) 3. Residuals RES: residuals WRES: weighted residuals(for FO method) CWRES: conditional weighted residual (for FOCE method) 4. Covariates, TIME, DV, 18
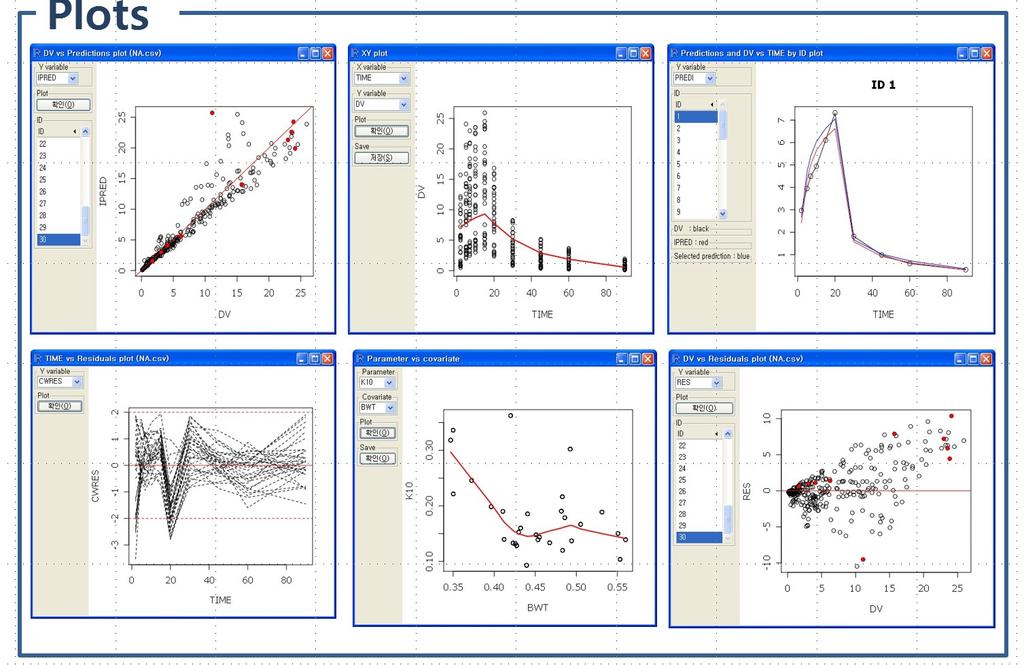
19 Graphical Method: Prediction-based(1) 1. Prediction-based : PRED, IPRED, etc. PRED vs DV(obs) plot with line of identity (black line) lines between points for an individual ID values for outer edges of data Regression line (red line) IPRED vs DV plot Source: Intermediate NONMEM 7 Workshop, 2010, Seoul, Korea 19
20 Graphical Method: Residual-based(1) 2. Residual-based : RES, WRES, CWRES, etc. WRES (weighted residual) : use for FO method CWRES (conditional WRES) : use for FOCE method 20
 lowess line line (red line) PRED")
21 Graphical Method: Residual-based(2) TIME vs. residual plot with lines between points for an individual ID values for outer edges of data line of y=0 (black line) lowess line line (red line) PRED vs. residual plot Covariate vs. residual plot Source: Intermediate NONMEM 7 Workshop, 2010, Seoul, Korea 21
22 Graphical Method: Residual-based(3) Estimation method vs. prediction/residual in NONMEM Estimation method PRED RES Weighted RES FO NPRED NRES NWRES FO INTER PREDI RESI WRESI FOCE CPRED CRES CWRES FOCE INTER CPREDI CRESI CWRESI MC based EPRED ERES ECWRES MC based INTER EPRED ERES EWRES MC based NPDE 22

23 Graphical Method: Residual-based(4) Source: Intermediate NONMEM 7 Workshop, 2010, Seoul, Korea 23

24 Graphical Method: Residual-based(5) Source: Intermediate NONMEM 7 Workshop, 2010, Seoul, Korea 24

25 Graphical Method: Residual-based(6) Source: Intermediate NONMEM 7 Workshop, 2010, Seoul, Korea 25

26 Shiny : Explore NONMEM data 26
27 Shiny : Explore NONMEM output 27

28 Shiny : Explore NONMEM output 28
29 Theophylline 29
30 Theophylline 30
31 Graphical Method: Simulation-based(1) Data Model : observed value, ith subject jth observation : observed time of ith subject jth observation : covariates of ith subject Estimate 31
32 Graphical Method: Simulation-based(2) Simulated data from model : estimates of Simulate data from 32

33 VPC : example Source: 33
34 VPC : Visual Predictive Checks (1) Step 1: Binning TIME data Make G intervals with Binning strategy Have similar amount of data in each bin No need binning if observation times are same between subjects 34
35 VPC : Visual Predictive Checks (2) Step 2: find PI of the original data Find 5%, 50%, 95% percentile of Also find median(50%percentile) of for each g=1,, G for each g=1,, G g med(tij) 5% percentile % percentile 95% percentile G * Prediction Interval(PI) of each bin is 5% percentile and 95% percentile 35
36 VPC : Visual Predictive Checks (3) Step 3: find PI of the simulation data Find 5%, 50%, 95% percentile of for each g=1,, G g 5% percentile % percentile 95% percentile G 36
37 VPC : Visual Predictive Checks (4) Step 4: find CI of 5%, 50%, and 95% percentile of the si mulation data (1) Find 5%, 50%, 95% percentile of for each g=1,, G and each k=1,,k 5% percentile 50% percentile 95% percentile k g 1 2 K k g 1 2 K k g 1 2 K G G G 37
38 VPC : Visual Predictive Checks (5) Step 4: find CI of 5%, 50%, and 95% percentile of the si mulation data (2) 5% percentile k 1 2 K g 1 2 G Find 2.5% and 97.5% percentile of CI of 5% percentile of the simulation data g 2.5% percentile % percentile G 38
39 VPC : Visual Predictive Checks (6) * Repeat this procedure for 50% and 95% percentile CI of 50% percentile of the simulation data g 2.5% percentile 1 2 G 97.5% percentile CI of 95% percentile of the simulation data g 2.5% percentile % percentile G 39
40 VPC : Visual Predictive Checks (7) Scatter VPC Make scatter plot of and with 3 lines - vs. - vs. - vs. Source: 40
41 VPC : Visual Predictive Checks (8) Percentile VPC Make plot with 6 lines - vs. - vs. - vs. - vs. - vs. - vs. Source: 41
42 VPC : Visual Predictive Checks (9) Confidence Interval VPC Make plot with 3 lines and 3 areas - vs. : line - vs. : line - vs. : line - vs. and : area - vs. and : area - vs. and : area 42

43 VPC : Visual Predictive Checks (10) Confidence Interval VPC Source: 43
44 VPC : Visual Predictive Checks (11) Handle covariate in VPC - Need to use stratification of covariate - For each strata, draw VPC plot - Pros - Allows subset of data/model to be inspected - Can increase resolution of model misspecification - Cons - Can dilute the signal - Multiple plot makes diagnostics complex - Use prediction correction 44
45 Prediction Correction (1) Step 1: Binning TIME/Covariate data Make T intervals with Make C intervals with Overall number of bins: G = T * C t T 1 T 2 T T c X 1 G 1 G 2 G T X 2 G T+1 X C G G 45
46 Prediction Correction (2) Step 2: Calculate pcvpc(prediction-corrected VPC) where : lower bound of yij from PRED : med(predij in bin g) : typical model prediction 46
47 Prediction Correction (3) Step 3: calculate pvcvpc(prediction- and variability-cor rected VPC) where 47
, Vol.")
48 Prediction Correction (4) Step 4: plot pcvpc and pvcvpc - Combine all bins and draw one plot in the same manner of VPC - Use pcyij / pvcyij instead of Yij Source: AAPS Journal(2013), Vol.13(2)
 VPC vs.")
, Vol.")
49 Prediction Correction (4) VPC vs. pcvpc Source: AAPS Journal(2013), Vol.13(2)
50 QVPC/BVPC (1) Data : observed value, ith subject jth observation (including missing) : observed time of ith subject jth observation Rearranged Data 50
51 QVPC/BVPC(2) Simulated Data from model Bootstrap sample from data 51
52 QVPC/BVPC(3) Quantified VPC 1. Find 2. Calculate 3. For each t, draw parallel boxes or 52

, Vol.")
53 QVPC/BVPC(3) Quantified VPC Source: J. Pharmacokinet Pharmacodyn(2008), Vol.35:
54 QVPC/BVPC(4) Bootstrap VPC 1. If, impute with 2. Find for each t and k k t K 54
55 QVPC/BVPC(5) Bootstrap VPC 3. Find 5%, 50%, 95% percentile of t 5% percentile % percentile 95% percentile 55
56 QVPC/BVPC(6) Bootstrap VPC 4. Draw scatter VPC plot and draw area with and draw line with and 56
57 Shiny : Visual Predictive Check 57
58 Shiny : Visual Predictive Check 58
59 Shiny : Visual Predictive Check 59

60 Shiny : Visual Predictive Check 60
61 Shiny : Visual Predictive Check 61
62 Shiny : Visual Predictive Check 62
63 fit4nm 63
64 fit4nm 64
65 fit4nm 65
66 fit4nm 66
67 fit4nm 67
68 fit4nm 68
69 fit4nm 69
70 fit4nm 70

71 asvpc: example (6) Bin-related weights Distance-related weights CI: 115 bins < 162 CI: 115 bins <
72 References Bergstrand, Hooker Wallin, and Karlsson (2011) Prediction-Corrected Visual Predictive Checks for Diagnosing Nonlinear Mixed-Effects Models, The AAPS Journal Vol 13(2) Brendel, K., Comets, E., Laffont, C., Laveille, C., and Mentre, F. (2006) Merics for External Model Evaluation with an Application to the Population Pharmacokinetics of Gliclazide, Pharmaceutical Researclh Vol 23(9) F. Mentre, and S. Escolano (2006) Prediction Discrepancies for the Evaluation of Nonlinear Mixed-Effects Models, Journal of Pharmacokinetics and Pharmacodynamics, 33(3), D. D. Wang, and S. Zhang (2012) Standardized Visual Predictive Check Versus Visual Predictive check for Model Evaluation, Journal of Clinical Pharmacology,52, P. R. Jadhav, and J. V.S. Gobburu (2005) A New Equivalence Based Metric for Predictive check to Qualify Mixed-Effects Models, The AAPS Journal, 7(3) E523-E531 E. Comets, K. Brendel, and F. Mentre (2008) Computing normalised prediction distribution errors to evaluate nonlinear mixed-effect models: The npde add-on package for R, Computer Methods and Programs in Biomedicine,90, MO Karlsson, and RM savic (2007) Diagnosing Model Diagnostics, Clinical Pharmacology and Therapeutics, 82(1), Y. Yano, S.L. Beal, and L. B. Sheiner (2001) Evaluating Pharmacokinetic/Pharmacodynamic Models Using the Posterior Predictive Check, Journal of Pharmacokinetics and Pharmacodynamics, 28(2), T.M. Post, J. I. Freijer, B. A. Ploeger, and M. Danhof (2008) Extensions to the Visual Predictive check to facilitate model performance evaluation, Journal of Pharmacokinetics and Pharmacodynamics, 35,
73 References X. Sun, K. Wu, and D. Cook (2011) PKgraph: An R package for graphically diagnosing population pharmacokinetic models, Computer methods and programs in biomedicine, 104, K. Ito and D. Murphy (2013) Application of ggplot2 to Pharmacometric Graphics, CPT: Pharmacometrics and systems Pharmacology, 2, e79 73


74 Questions 74

75 75
Estimation and Model Selection in Mixed Effects Models Part I. Adeline Samson 1
 Estimation and Model Selection in Mixed Effects Models Part I Adeline Samson 1 1 University Paris Descartes Summer school 2009 - Lipari, Italy These slides are based on Marc Lavielle s slides Outline 1
Extension of the SAEM algorithm for nonlinear mixed models with 2 levels of random effects Panhard Xavière
 Extension of the SAEM algorithm for nonlinear mixed models with 2 levels of random effects Panhard Xavière * Modèles et mé thodes de l'évaluation thérapeutique des maladies chroniques INSERM : U738, Universit
SAEMIX, an R version of the SAEM algorithm for parameter estimation in nonlinear mixed effect models
 SAEMIX, an R version of the SAEM algorithm for parameter estimation in nonlinear mixed effect models Emmanuelle Comets 1,2 & Audrey Lavenu 2 & Marc Lavielle 3 1 CIC 0203, U. Rennes-I, CHU Pontchaillou,
Stochastic approximation EM algorithm in nonlinear mixed effects model for viral load decrease during anti-hiv treatment
 Stochastic approximation EM algorithm in nonlinear mixed effects model for viral load decrease during anti-hiv treatment Adeline Samson 1, Marc Lavielle and France Mentré 1 1 INSERM E0357, Department of
F. Combes (1,2,3) S. Retout (2), N. Frey (2) and F. Mentré (1) PODE 2012
 S. Retout (2), N. Frey (2) and F. Mentré (1) PODE 2012") Prediction of shrinkage of individual parameters using the Bayesian information matrix in nonlinear mixed-effect models with application in pharmacokinetics F. Combes (1,2,3) S. Retout (2), N. Frey (2)
Prediction of shrinkage of individual parameters using the Bayesian information matrix in nonlinear mixed-effect models with application in pharmacokinetics F. Combes (1,2,3) S. Retout (2), N. Frey (2)
Fitting PK Models with SAS NLMIXED Procedure Halimu Haridona, PPD Inc., Beijing
 PharmaSUG China 1 st Conference, 2012 Fitting PK Models with SAS NLMIXED Procedure Halimu Haridona, PPD Inc., Beijing ABSTRACT Pharmacokinetic (PK) models are important for new drug development. Statistical
Description of UseCase models in MDL
 Description of UseCase models in MDL A set of UseCases (UCs) has been prepared to illustrate how different modelling features can be implemented in the Model Description Language or MDL. These UseCases
Nonlinear random effects mixture models: Maximum likelihood estimation via the EM algorithm
 Computational Statistics & Data Analysis 51 (2007) 6614 6623 www.elsevier.com/locate/csda Nonlinear random effects mixture models: Maximum lielihood estimation via the EM algorithm Xiaoning Wang a, Alan
Correction of the likelihood function as an alternative for imputing missing covariates. Wojciech Krzyzanski and An Vermeulen PAGE 2017 Budapest
 Correction of the likelihood function as an alternative for imputing missing covariates Wojciech Krzyzanski and An Vermeulen PAGE 2017 Budapest 1 Covariates in Population PKPD Analysis Covariates are defined
Evaluation of the Fisher information matrix in nonlinear mixed eect models without linearization
 Evaluation of the Fisher information matrix in nonlinear mixed eect models without linearization Sebastian Ueckert, Marie-Karelle Riviere, and France Mentré INSERM, IAME, UMR 1137, F-75018 Paris, France;
METHODS FOR POPULATION PHARMACOKINETICS AND PHARMACODYNAMICS
 METHODS FOR POPULATION PHARMACOKINETICS AND PHARMACODYNAMICS Emily Anne Colby A dissertation submitted to the faculty of the University of North Carolina at Chapel Hill in partial fulfillment of the requirements
Heterogeneous shedding of influenza by human subjects and. its implications for epidemiology and control
 1 2 3 4 5 6 7 8 9 10 11 Heterogeneous shedding of influenza by human subjects and its implications for epidemiology and control Laetitia Canini 1*, Mark EJ Woolhouse 1, Taronna R. Maines 2, Fabrice Carrat
1Non Linear mixed effects ordinary differential equations models. M. Prague - SISTM - NLME-ODE September 27,
 GDR MaMoVi 2017 Parameter estimation in Models with Random effects based on Ordinary Differential Equations: A bayesian maximum a posteriori approach. Mélanie PRAGUE, Daniel COMMENGES & Rodolphe THIÉBAUT
Inflammation and organ failure severely affect midazolam clearance in critically ill children
 Online Data Supplement Inflammation and organ failure severely affect midazolam clearance in critically ill children Nienke J. Vet, MD 1,2 * Janneke M. Brussee, MSc 3* Matthijs de Hoog, MD, PhD 1,2 Miriam
Extension of the SAEM algorithm for nonlinear mixed. models with two levels of random effects
 Author manuscript, published in "Biostatistics 29;1(1):121-35" DOI : 1.193/biostatistics/kxn2 Extension of the SAEM algorithm for nonlinear mixed models with two levels of random effects Xavière Panhard
TMDD Model Translated from NONMEM (NM- TRAN) to Phoenix NLME (PML)
 to Phoenix NLME (PML)") TMDD Model Translated from NONMEM (NM- TRAN) to Phoenix NLME (PML) Phoenix Modeling Language School March 22, 2018 Loan Pham, Ph.D. Senior Pharmacokinetic Scientist Camargo Pharmaceutical Services 9825
TMDD Model Translated from NONMEM (NM- TRAN) to Phoenix NLME (PML) Phoenix Modeling Language School March 22, 2018 Loan Pham, Ph.D. Senior Pharmacokinetic Scientist Camargo Pharmaceutical Services 9825
Pharmacokinetics Introduction to
 Wikimedia Commons Korinna Creative Commons Attribution-ShareAlike 3. Unported Introduction to Population PK Pharmacokinetics Introduction to Introduction to Population PK Helmut Schütz BEBAC Workshop Bucarest,
DESIGN EVALUATION AND OPTIMISATION IN CROSSOVER PHARMACOKINETIC STUDIES ANALYSED BY NONLINEAR MIXED EFFECTS MODELS
 DESIGN EVALUATION AND OPTIMISATION IN CROSSOVER PHARMACOKINETIC STUDIES ANALYSED BY NONLINEAR MIXED EFFECTS MODELS Thu Thuy Nguyen, Caroline Bazzoli, France Mentré UMR 738 INSERM - University Paris Diderot,
Extension of the SAEM algorithm to left-censored data in nonlinear mixed-effects model: application to HIV dynamics model
 Extension of the SAEM algorithm to left-censored data in nonlinear mixed-effects model: application to HIV dynamics model Adeline Samson 1, Marc Lavielle 2, France Mentré 1 1 INSERM U738, Paris, France;
Non-linear mixed-effects pharmacokinetic/pharmacodynamic modelling in NLME using differential equations
 Computer Methods and Programs in Biomedicine () 76, 31 Non-linear mixed-effects pharmacokinetic/pharmacodynamic modelling in NLME using differential equations Christoffer W.Tornøe a, *, Henrik Agersø a,
The estimation methods in Nonlinear Mixed-Effects Models (NLMM) still largely rely on numerical approximation of the likelihood function
 still largely rely on numerical approximation of the likelihood function") ABSTRACT Title of Dissertation: Diagnostics for Nonlinear Mixed-Effects Models Mohamed O. Nagem, Doctor of Philosophy, 2009 Dissertation directed by: Professor Benjamin Kedem Department of Mathematics
ABSTRACT Title of Dissertation: Diagnostics for Nonlinear Mixed-Effects Models Mohamed O. Nagem, Doctor of Philosophy, 2009 Dissertation directed by: Professor Benjamin Kedem Department of Mathematics
A Novel Screening Method Using Score Test for Efficient Covariate Selection in Population Pharmacokinetic Analysis
 A Novel Screening Method Using Score Test for Efficient Covariate Selection in Population Pharmacokinetic Analysis Yixuan Zou 1, Chee M. Ng 1 1 College of Pharmacy, University of Kentucky, Lexington, KY
The general concept of pharmacokinetics
 The general concept of pharmacokinetics Hartmut Derendorf, PhD University of Florida Pharmacokinetics the time course of drug and metabolite concentrations in the body Pharmacokinetics helps to optimize
Nonlinear mixed-effects models using Stata
 Nonlinear mixed-effects models using Stata Yulia Marchenko Executive Director of Statistics StataCorp LP 2017 German Stata Users Group meeting Yulia Marchenko (StataCorp) 1 / 48 Outline What is NLMEM?
Confidence and Prediction Intervals for Pharmacometric Models
 Citation: CPT Pharmacometrics Syst. Pharmacol. (218) 7, 36 373; VC 218 ASCPT All rights reserved doi:1.12/psp4.12286 TUTORIAL Confidence and Prediction Intervals for Pharmacometric Models Anne K ummel
Nonlinear Mixed Effects Models
 Nonlinear Mixed Effects Modeling Department of Mathematics Center for Research in Scientific Computation Center for Quantitative Sciences in Biomedicine North Carolina State University July 31, 216 Introduction
A comparison of estimation methods in nonlinear mixed effects models using a blind analysis
 A comparison of estimation methods in nonlinear mixed effects models using a blind analysis Pascal Girard, PhD EA 3738 CTO, INSERM, University Claude Bernard Lyon I, Lyon France Mentré, PhD, MD Dept Biostatistics,
Research Article. Multiple Imputation of Missing Covariates in NONMEM and Evaluation of the Method s Sensitivity to η-shrinkage
 The AAPS Journal, Vol. 15, No. 4, October 2013 ( # 2013) DOI: 10.1208/s12248-013-9508-0 Research Article Multiple Imputation of Missing Covariates in NONMEM and Evaluation of the Method s Sensitivity to
3 Results. Part I. 3.1 Base/primary model
 3 Results Part I 3.1 Base/primary model For the development of the base/primary population model the development dataset (for data details see Table 5 and sections 2.1 and 2.2), which included 1256 serum
A New Approach to Modeling Covariate Effects and Individualization in Population Pharmacokinetics-Pharmacodynamics
 Journal of Pharmacokinetics and Pharmacodynamics, Vol. 33, No. 1, February 2006 ( 2006) DOI: 10.1007/s10928-005-9000-2 A New Approach to Modeling Covariate Effects and Individualization in Population Pharmacokinetics-Pharmacodynamics
Integration of SAS and NONMEM for Automation of Population Pharmacokinetic/Pharmacodynamic Modeling on UNIX systems
 Integration of SAS and NONMEM for Automation of Population Pharmacokinetic/Pharmacodynamic Modeling on UNIX systems Alan J Xiao, Cognigen Corporation, Buffalo NY Jill B Fiedler-Kelly, Cognigen Corporation,
Robust design in model-based analysis of longitudinal clinical data
 Robust design in model-based analysis of longitudinal clinical data Giulia Lestini, Sebastian Ueckert, France Mentré IAME UMR 1137, INSERM, University Paris Diderot, France PODE, June 0 016 Context Optimal
Parameter Estimation in Nonlinear Mixed Effect Models Using saemix, an R Implementation of the SAEM Algorithm
 Parameter Estimation in Nonlinear Mixed Effect Models Using saemix, an R Implementation of the SAEM Algorithm Emmanuelle Comets, Audrey Lavenu, Marc Lavielle To cite this version: Emmanuelle Comets, Audrey
Longitudinal + Reliability = Joint Modeling
 Longitudinal + Reliability = Joint Modeling Carles Serrat Institute of Statistics and Mathematics Applied to Building CYTED-HAROSA International Workshop November 21-22, 2013 Barcelona Mainly from Rizopoulos,
Between-Subject and Within-Subject Model Mixtures for Classifying HIV Treatment Response
 Progress in Applied Mathematics Vol. 4, No. 2, 2012, pp. [148 166] DOI: 10.3968/j.pam.1925252820120402.S0801 ISSN 1925-251X [Print] ISSN 1925-2528 [Online] www.cscanada.net www.cscanada.org Between-Subject
Estimation, Model Selection and Optimal Design in Mixed Eects Models Applications to pharmacometrics. Marc Lavielle 1. Cemracs CIRM logo
 Estimation, Model Selection and Optimal Design in Mixed Eects Models Applications to pharmacometrics Marc Lavielle 1 1 INRIA Saclay Cemracs 2009 - CIRM Outline 1 Introduction 2 Some pharmacokinetics-pharmacodynamics
Multicompartment Pharmacokinetic Models. Objectives. Multicompartment Models. 26 July Chapter 30 1
 Multicompartment Pharmacokinetic Models Objectives To draw schemes and write differential equations for multicompartment models To recognize and use integrated equations to calculate dosage regimens To
Non-Linear Mixed-Effects Models with Stochastic Differential Equations: Implementation of an Estimation Algorithm
 Journal of Pharmacokinetics and Pharmacodynamics, Vol. 32, No. 1, February 2005 (Ó 2005) DOI: 10.1007/s10928-005-2104-x Non-Linear Mixed-Effects Models with Stochastic Differential Equations: Implementation
Case Study in the Use of Bayesian Hierarchical Modeling and Simulation for Design and Analysis of a Clinical Trial
 Case Study in the Use of Bayesian Hierarchical Modeling and Simulation for Design and Analysis of a Clinical Trial William R. Gillespie Pharsight Corporation Cary, North Carolina, USA PAGE 2003 Verona,
Estimating Nonlinear Mixed-Effects Models by the Generalized Profiling Method and its Application to Pharmacokinetics
 Estimating Nonlinear Mixed-Effects Models by the Generalized Profiling Method and its Application to Pharmacokinetics Liangliang Wang Department of Mathematics and Statistics McGill University, Montreal
Modelling a complex input process in a population pharmacokinetic analysis: example of mavoglurant oral absorption in healthy subjects
 Modelling a complex input process in a population pharmacokinetic analysis: example of mavoglurant oral absorption in healthy subjects Thierry Wendling Manchester Pharmacy School Novartis Institutes for
Population Approach. Pharmacokinetics. Analysis Approaches. Describing The Signal and the Noise
 1 Population Approach Describing The Signal and the Noise 2 Pharmacometrics Science Pharmacology Models Pharmacokinetics Pharmacodynamics Experiment Dose Concentration Effect 3 Analysis Approaches ANOVA
Evaluation of the Fisher information matrix in nonlinear mixed effect models using adaptive Gaussian quadrature
 Evaluation of the Fisher information matrix in nonlinear mixed effect models using adaptive Gaussian quadrature Thu Thuy Nguyen, France Mentré To cite this version: Thu Thuy Nguyen, France Mentré. Evaluation
Hierarchical expectation propagation for Bayesian aggregation of average data
 Hierarchical expectation propagation for Bayesian aggregation of average data Andrew Gelman, Columbia University Sebastian Weber, Novartis also Bob Carpenter, Daniel Lee, Frédéric Bois, Aki Vehtari, and
STAT 5500/6500 Conditional Logistic Regression for Matched Pairs
 STAT 5500/6500 Conditional Logistic Regression for Matched Pairs Motivating Example: The data we will be using comes from a subset of data taken from the Los Angeles Study of the Endometrial Cancer Data
Accurate Maximum Likelihood Estimation for Parametric Population Analysis. Bob Leary UCSD/SDSC and LAPK, USC School of Medicine
 Accurate Maximum Likelihood Estimation for Parametric Population Analysis Bob Leary UCSD/SDSC and LAPK, USC School of Medicine Why use parametric maximum likelihood estimators? Consistency: θˆ θ as N ML
PK-QT analysis of bedaquiline : Bedaquiline appears to antagonize its main metabolite s QTcF interval prolonging effect
 PK-QT analysis of bedaquiline : Bedaquiline appears to antagonize its main metabolite s QTcF interval prolonging effect Lénaïg Tanneau 1, Elin Svensson 1,2, Stefaan Rossenu 3, Mats Karlsson 1 1 Department
NONLINEAR MODELS IN MULTIVARIATE POPULATION BIOEQUIVALENCE TESTING
 Virginia Commonwealth University VCU Scholars Compass Theses and Dissertations Graduate School NONLINEAR MODELS IN MULTIVARIATE POPULATION BIOEQUIVALENCE TESTING Bassam Dahman Virginia Commonwealth University
Basic Concepts in Population Modeling, Simulation, and Model-Based Drug Development Part 2: Introduction to Pharmacokinetic Modeling Methods
 Tutorial Citation: CPT: Pharmacometrics & Systems Pharmacology (3), e38; doi:.38/psp.3.4 3 ASCPT All rights reserved 63-836/ www.nature.com/psp Basic Concepts in Population Modeling, Simulation, and Model-Based
Challenges in modelling the pharmacokinetics of isoniazid in South African tuberculosis patients
 PAGE 2005 Pamplona, Spain Challenges in modelling the pharmacokinetics of isoniazid in South African tuberculosis patients Justin J Wilkins 1, Grant Langdon 1, Helen McIlleron 1, Goonaseelan Pillai 2,
Linear, Generalized Linear, and Mixed-Effects Models in R. Linear and Generalized Linear Models in R Topics
 Linear, Generalized Linear, and Mixed-Effects Models in R John Fox McMaster University ICPSR 2018 John Fox (McMaster University) Statistical Models in R ICPSR 2018 1 / 19 Linear and Generalized Linear
Estimating terminal half life by non-compartmental methods with some data below the limit of quantification
 Paper SP08 Estimating terminal half life by non-compartmental methods with some data below the limit of quantification Jochen Müller-Cohrs, CSL Behring, Marburg, Germany ABSTRACT In pharmacokinetic studies
Restricted Maximum Likelihood in Linear Regression and Linear Mixed-Effects Model
 Restricted Maximum Likelihood in Linear Regression and Linear Mixed-Effects Model Xiuming Zhang zhangxiuming@u.nus.edu A*STAR-NUS Clinical Imaging Research Center October, 015 Summary This report derives
Research Article. Jacob Leander, 1,2 Joachim Almquist, 1,3 Christine Ahlström, 4 Johan Gabrielsson, 5 and Mats Jirstrand 1,6
 The AAPS Journal ( # 2015) DOI: 10.1208/s12248-015-9718-8 Research Article Mixed Effects Modeling Using Stochastic Differential Equations: Illustrated by Pharmacokinetic Data of Nicotinic Acid in Obese
Evaluation of bootstrap methods for estimating uncertainty of parameters in nonlinear mixedeffects
 Evaluation of bootstrap methods for estimating uncertainty of parameters in nonlinear mixed-effects models: a simulation study in population pharmacokinetics Hoai-Thu Thai, France Mentré, Nick Holford,
Biostat 2065 Analysis of Incomplete Data
 Biostat 2065 Analysis of Incomplete Data Gong Tang Dept of Biostatistics University of Pittsburgh October 20, 2005 1. Large-sample inference based on ML Let θ is the MLE, then the large-sample theory implies
Nonparametric Bayes approach for a semimechanistic pharmacodynamic model
 University of New Mexico UNM Digital Repository Mathematics & Statistics ETDs Electronic Theses and Dissertations 6-23-2015 Nonparametric Bayes approach for a semimechanistic pharmacokinetic and pharmacodynamic
Mixed effect model for the spatiotemporal analysis of longitudinal manifold value data
 Mixed effect model for the spatiotemporal analysis of longitudinal manifold value data Stéphanie Allassonnière with J.B. Schiratti, O. Colliot and S. Durrleman Université Paris Descartes & Ecole Polytechnique
MA/ST 810 Mathematical-Statistical Modeling and Analysis of Complex Systems
 MA/ST 810 Mathematical-Statistical Modeling and Analysis of Complex Systems Integrating Mathematical and Statistical Models Recap of mathematical models Models and data Statistical models and sources of
Principles of Covariate Modelling
 1 Principles of Covariate Modelling Nick Holford Dept of Pharmacology & Clinical Pharmacology University of Auckland New Zealand 2 What is a Covariate? A covariate is any variable that is specific to an
Model Selection in Bayesian Survival Analysis for a Multi-country Cluster Randomized Trial
 Model Selection in Bayesian Survival Analysis for a Multi-country Cluster Randomized Trial Jin Kyung Park International Vaccine Institute Min Woo Chae Seoul National University R. Leon Ochiai International
- 1 - By H. S Steyn, Statistical Consultation Services, North-West University (Potchefstroom Campus)
") - 1 - BIOAVAILABILIY AND BIOEQUIVALENCE By H. S Steyn, Statistical Consultation Services, North-West University (Potchefstroom Campus) 1. Bioavailability (see Westlake, 1988) 1.1 Absorption: he aim is
- 1 - BIOAVAILABILIY AND BIOEQUIVALENCE By H. S Steyn, Statistical Consultation Services, North-West University (Potchefstroom Campus) 1. Bioavailability (see Westlake, 1988) 1.1 Absorption: he aim is
Population Design in Nonlinear Mixed Effects Multiple Response Models: extension of PFIM and evaluation by simulation with NONMEM and MONOLIX
 Populaton Desgn n Nonlnear Mxed Effects Multple Response Models: extenson of PFIM and evaluaton by smulaton wth NONMEM and MONOLIX May 4th 007 Carolne Bazzol, Sylve Retout, France Mentré Inserm U738 Unversty
Bayesian pharmacometric modeling with BUGS, NONMEM and Stan
 Bayesian pharmacometric modeling with BUGS, NONMEM and Stan Bill Gillespie Metrum Research Group 22 May 215 c 215 Metrum Research Group Bayesian pharmacometric tools 22 May 215 1 / 52 Introduction Bayesian
Modeling biological systems - The Pharmaco-Kinetic-Dynamic paradigm
 Modeling biological systems - The Pharmaco-Kinetic-Dynamic paradigm Main features:. Time profiles and complex systems 2. Disturbed and sparse measurements 3. Mixed variabilities One of the most highly
Nonlinear pharmacokinetics
 5 Nonlinear pharmacokinetics 5 Introduction 33 5 Capacity-limited metabolism 35 53 Estimation of Michaelis Menten parameters(v max andk m ) 37 55 Time to reach a given fraction of steady state 56 Example:
Mixed effects models
 Mixed effects models The basic theory and application in R Mitchel van Loon Research Paper Business Analytics Mixed effects models The basic theory and application in R Author: Mitchel van Loon Research
Estimation of AUC from 0 to Infinity in Serial Sacrifice Designs
 Estimation of AUC from 0 to Infinity in Serial Sacrifice Designs Martin J. Wolfsegger Department of Biostatistics, Baxter AG, Vienna, Austria Thomas Jaki Department of Statistics, University of South Carolina,
Default Priors and Effcient Posterior Computation in Bayesian
 Default Priors and Effcient Posterior Computation in Bayesian Factor Analysis January 16, 2010 Presented by Eric Wang, Duke University Background and Motivation A Brief Review of Parameter Expansion Literature
Plot of Laser Operating Current as a Function of Time Laser Test Data
 Chapter Repeated Measures Data and Random Parameter Models Repeated Measures Data and Random Parameter Models Chapter Objectives Understand applications of growth curve models to describe the results of
Analysis of Incomplete Non-Normal Longitudinal Lipid Data
 Analysis of Incomplete Non-Normal Longitudinal Lipid Data Jiajun Liu*, Devan V. Mehrotra, Xiaoming Li, and Kaifeng Lu 2 Merck Research Laboratories, PA/NJ 2 Forrest Laboratories, NY *jiajun_liu@merck.com
EMPIRICAL DATA SETS in human fatigue and performance. Nonlinear Mixed-Effects Modeling: Individualization and Prediction
 onlinear Mixed-Effects Modeling: Individualization and Prediction Erik Olofsen, David F. Dinges, and Hans P.A. Van Dongen OLOFSE E, DIGES DF, VA DOGE HPA. onlinear mixedeffects modeling: individualization
Pharmacokinetic-Pharmacodynamic Modeling and Simulation
 Pharmacokinetic-Pharmacodynamic Modeling and Simulation Pharmacokinetic-Pharmacodynamic Modeling and Simulation Peter L. Bonate, PhD, FCP Genzyme Corporation San Antonio, TX USA Peter Bonate Genzyme Oncology
Beka 2 Cpt: Two Compartment Model - Loading Dose And Maintenance Infusion
 MEDSCI 719 Pharmacometrics Beka 2 Cpt: Two Compartment Model - Loading Dose And Maintenance Infusion Objective 1. To observe the time course of drug concentration in the central and peripheral compartments
The equivalence of the Maximum Likelihood and a modified Least Squares for a case of Generalized Linear Model
 Applied and Computational Mathematics 2014; 3(5): 268-272 Published online November 10, 2014 (http://www.sciencepublishinggroup.com/j/acm) doi: 10.11648/j.acm.20140305.22 ISSN: 2328-5605 (Print); ISSN:
Noncompartmental vs. Compartmental Approaches to Pharmacokinetic Data Analysis Paolo Vicini, Ph.D. Pfizer Global Research and Development David M.
 Noncompartmental vs. Compartmental Approaches to Pharmacokinetic Data Analysis Paolo Vicini, Ph.D. Pfizer Global Research and Development David M. Foster., Ph.D. University of Washington October 18, 2012
arxiv: v1 [stat.me] 10 Apr 2013
![arxiv: v1 [stat.me] 10 Apr 2013](/thumbs/81/84431243.jpg "arxiv: v1 [stat.me] 10 Apr 2013") Journal of Pharmacokinetics and Pharmacodynamics manuscript No. (will be inserted by the editor) Cross-Validation for Nonlinear Mixed Effects Models Emily Colby Eric Bair arxiv:1304.2828v1 [stat.me] 10
Journal of Pharmacokinetics and Pharmacodynamics manuscript No. (will be inserted by the editor) Cross-Validation for Nonlinear Mixed Effects Models Emily Colby Eric Bair arxiv:1304.2828v1 [stat.me] 10
Chapter 4 Multi-factor Treatment Designs with Multiple Error Terms 93
 Contents Preface ix Chapter 1 Introduction 1 1.1 Types of Models That Produce Data 1 1.2 Statistical Models 2 1.3 Fixed and Random Effects 4 1.4 Mixed Models 6 1.5 Typical Studies and the Modeling Issues
Assessing the Effect of Prior Distribution Assumption on the Variance Parameters in Evaluating Bioequivalence Trials
 Georgia State University ScholarWorks @ Georgia State University Mathematics Theses Department of Mathematics and Statistics 8--006 Assessing the Effect of Prior Distribution Assumption on the Variance
Empirical Likelihood Methods for Two-sample Problems with Data Missing-by-Design
 1 / 32 Empirical Likelihood Methods for Two-sample Problems with Data Missing-by-Design Changbao Wu Department of Statistics and Actuarial Science University of Waterloo (Joint work with Min Chen and Mary
Joint modeling of longitudinal and repeated time-to-event data using nonlinear mixed-effects models and the SAEM algorithm
 Joint modeling of longitudinal and repeated time-to-event data using nonlinear mixed-effects models and the SAEM algorithm Cyprien Mbogning, Kevin Bleakley, Marc Lavielle To cite this version: Cyprien
LONGITUDINAL DATA ANALYSIS
 References Full citations for all books, monographs, and journal articles referenced in the notes are given here. Also included are references to texts from which material in the notes was adapted. The
Noncompartmental vs. Compartmental Approaches to Pharmacokinetic Data Analysis Paolo Vicini, Ph.D. Pfizer Global Research and Development David M.
 Noncompartmental vs. Compartmental Approaches to Pharmacokinetic Data Analysis Paolo Vicini, Ph.D. Pfizer Global Research and Development David M. Foster., Ph.D. University of Washington October 28, 2010
Introduction to Statistical Population Modeling and Analysis for Pharmacokinetic Data
 Introduction to Statistical Population Modeling and Analysis for Pharmacokinetic Data Marie Davidian Department of Statistics, North Carolina State University Raleigh, North Carolina 27695-8203, U.S.A.
Test Strategies for Experiments with a Binary Response and Single Stress Factor Best Practice
 Test Strategies for Experiments with a Binary Response and Single Stress Factor Best Practice Authored by: Sarah Burke, PhD Lenny Truett, PhD 15 June 2017 The goal of the STAT COE is to assist in developing
Covariate Model Building in Nonlinear Mixed Effects Models
 Digital Comprehensive Summaries of Uppsala Dissertations from the Faculty of Pharmacy 59 Covariate Model uilding in Nonlinear Mixed Effects Models JKO RIING CT UNIVERSITTIS UPSLIENSIS UPPSL 2007 ISSN 1651-6192
A Bayesian Nonparametric Approach to Monotone Missing Data in Longitudinal Studies with Informative Missingness
 A Bayesian Nonparametric Approach to Monotone Missing Data in Longitudinal Studies with Informative Missingness A. Linero and M. Daniels UF, UT-Austin SRC 2014, Galveston, TX 1 Background 2 Working model
Multilevel Statistical Models: 3 rd edition, 2003 Contents
 Multilevel Statistical Models: 3 rd edition, 2003 Contents Preface Acknowledgements Notation Two and three level models. A general classification notation and diagram Glossary Chapter 1 An introduction
University of North Carolina at Chapel Hill
 University of North Carolina at Chapel Hill The University of North Carolina at Chapel Hill Department of Biostatistics Technical Report Series Year 2013 Paper 35 Cross-Validation for Nonlinear Mixed Effects
PHARMACOKINETIC DERIVATION OF RATES AND ORDERS OF REACTIONS IN MULTI- COMPARTMENT MODEL USING MATLAB
 IJPSR (2016), Vol. 7, Issue 11 (Research Article) Received on 29 May, 2016; received in revised form, 07 July, 2016; accepted, 27 July, 2016; published 01 November, 2016 PHARMACOKINETIC DERIVATION OF RATES
Statistical Methods. Missing Data snijders/sm.htm. Tom A.B. Snijders. November, University of Oxford 1 / 23
 1 / 23 Statistical Methods Missing Data http://www.stats.ox.ac.uk/ snijders/sm.htm Tom A.B. Snijders University of Oxford November, 2011 2 / 23 Literature: Joseph L. Schafer and John W. Graham, Missing
Measurement error as missing data: the case of epidemiologic assays. Roderick J. Little
 Measurement error as missing data: the case of epidemiologic assays Roderick J. Little Outline Discuss two related calibration topics where classical methods are deficient (A) Limit of quantification methods
Influence of covariate distribution on the predictive performance of pharmacokinetic models in paediatric research
 British Journal of Clinical Pharmacology DOI:1.1111/bcp.13 Influence of covariate distribution on the predictive performance of pharmacokinetic models in paediatric research Chiara Piana, 1 Meindert Danhof
Testing for bioequivalence of highly variable drugs from TR-RT crossover designs with heterogeneous residual variances
 Testing for bioequivalence of highly variable drugs from T-T crossover designs with heterogeneous residual variances Christopher I. Vahl, PhD Department of Statistics Kansas State University Qing Kang,
Introduction to Bayesian Statistics and Markov Chain Monte Carlo Estimation. EPSY 905: Multivariate Analysis Spring 2016 Lecture #10: April 6, 2016
 Introduction to Bayesian Statistics and Markov Chain Monte Carlo Estimation EPSY 905: Multivariate Analysis Spring 2016 Lecture #10: April 6, 2016 EPSY 905: Intro to Bayesian and MCMC Today s Class An
The pan Package. April 2, Title Multiple imputation for multivariate panel or clustered data
 The pan Package April 2, 2005 Version 0.2-3 Date 2005-3-23 Title Multiple imputation for multivariate panel or clustered data Author Original by Joseph L. Schafer . Maintainer Jing hua
Approaches to Modeling Menstrual Cycle Function
 Approaches to Modeling Menstrual Cycle Function Paul S. Albert (albertp@mail.nih.gov) Biostatistics & Bioinformatics Branch Division of Epidemiology, Statistics, and Prevention Research NICHD SPER Student
A Bayesian decision-theoretic approach to incorporating pre-clinical information into phase I clinical trials
 A Bayesian decision-theoretic approach to incorporating pre-clinical information into phase I clinical trials Haiyan Zheng, Lisa V. Hampson Medical and Pharmaceutical Statistics Research Unit Department
Obnoxious lateness humor
 Obnoxious lateness humor 1 Using Bayesian Model Averaging For Addressing Model Uncertainty in Environmental Risk Assessment Louise Ryan and Melissa Whitney Department of Biostatistics Harvard School of
Basics of Modern Missing Data Analysis
 Basics of Modern Missing Data Analysis Kyle M. Lang Center for Research Methods and Data Analysis University of Kansas March 8, 2013 Topics to be Covered An introduction to the missing data problem Missing