Research. Continuous Compaction Control MnROAD Demonstration Final Report
|
|
|
- Dorothy Peters
- 5 years ago
- Views:
Transcription


1 25-7 Final Report Continuous Compaction Control MnROAD Demonstration Research
2 Technical Report Documentation Page 1. Report No Recipients Accession No. MN/RC Title and Subtitle 5. Report Date CONTINUOUS COMPACTION CONTROL MnROAD DEMONSTRATION March Author(s) 8. Performing Organization Report No. D. Lee Petersen 9. Performing Organization Name and Address 1. Project/Task/Work Unit No. CNA Consulting Engineers 28 University Avenue, S.E. Minneapolis, Minnesota Contract (C) or Grant (G) No. (c) Sponsoring Organization Name and Address 13. Type of Report and Period Covered Minnesota Dept. of Transportation Office of Materials and Road Research 14 Gervais Avenue Maplewood, MN Supplementary Notes Federal Highway Administration 38 Jackson Street Suite 5 Galtier Plaza St. Paul, MN 5511 Final Report Sponsoring Agency Code 16. Abstract (Limit: 2 words) In September 24, engineers conducted a Continuous Compaction Control (CCC) demonstration at MnROAD, an outdoor pavement test facility. Continuous Compaction Control (CCC), also called Intelligent Compaction (IC), is a new technique in the United States construction market that uses an instrumented compactor to measure soil or asphalt compaction in real time and adjusts compactive effort accordingly to control the level of compaction. This demonstration used the BOMAG Compactor and focused on Young s soil modulus as the soil parameter of interest. CCC may potentially provide substantial benefits, including improved quality due to more uniform compaction, reduced compaction costs because effort is applied only where necessary, reduced life-cycle cost due to longer pavement life, and a stronger relationship between design and construction. State departments of transportation have expressed interest in exploring this method as a way of meeting quality-assurance requirements within a tight budget environment. In general, this study found CCC to be an effective quality-control mechanism for soil compaction. However, further questions arose as a result of the study and certain variables affected the results and measurements, including moisture content and the use of different measurement tools. Further research is needed to determine the level of uniformity in using CCC and the extent of reliability in achieving target values when using this method. 17. Document Analysis/Descriptors 18.Availability Statement Intelligent compaction Continuous compaction control Soil compaction Construction quality control Grading and base pavement No restrictions. Document available from: National Technical Information Services, Springfield, Virginia Security Class (this report) 2. Security Class (this page) 21. No. of Pages 22. Price Unclassified Unclassified 132
3 CONTINUOUS COMPACTION CONTROL MnROAD DEMONSTRATION Final Report Prepared by: D. Lee Petersen CNA Consulting Engineers 28 University Avenue, S.E. Minneapolis, MN For: John Siekmeier Minnesota Department of Transportation Office of Materials and Road Research 14 Gervais Avenue Mail Stop 645 Maplewood, MN 5519 March 25 Published by: Minnesota Department of Transportation Office of Research Services Mail Stop John Ireland Boulevard St. Paul, MN This report represents the results of research conducted by the authors and does not necessarily represent the views or policies of the Minnesota Department of Transportation. This report does not contain a standard or specified technique. The authors and the Minnesota Department of Transportation do not endorse products or manufacturers. Trade or manufacturers names appear herein solely because they are considered essential to this report.

4 Continuous Compaction Control MnROAD Demonstration Prepared for: Minnesota Department of Transportation and the Federal Highway Administration Prepared by: CNA Consulting Engineers March 25
5 Table of Contents 1 Introduction Demonstration Purpose Continuous Compaction Control (CCC) Background Terminology Description CCC Direct Benefits CCC in the Context of FHWA and Mn/DOT Initiatives Focus on Soil Modulus Demonstration Protocol Site Description Site Location Materials Construction Sequence Continuous Compaction Control Machine Technology Description BOMAG Compactor CCC Process and Documentation Field Measurements General Description CCC Machine Data Dynamic Cone Penetrometer GeoGauge Loadman Nuclear Density Gauge Plate Load Test Sand Cone Density Falling Weight Deflectometer Laboratory Measurements Field Measurements and Analysis Test Locations CCC Machine Data Documentation Target Values Companion Test Summary Dynamic Cone Penetrometer DCP Data Summary DCP Modulus Values as a Function of Depth Limit GeoGauge Light Weight Deflectometer Nuclear Density and Sand Cone Density Plate Load Tests Comparisons and Correlations Modulus Data for the Four Principal Test Methods Correlations Between BOMAG Data and Companion Tests Correlations Between Companion Tests Influence of Stress on Soil Modulus Influence of Moisture Content Other Factors Influencing Modulus Measurements Identification of Potential Problem Areas Other Experience Conclusions i
6 4.1 Conclusions Related to the Site, Materials and Procedures Conclusions from Experience with BOMAG Compactor Conclusions from Companion Testing Conclusions from Observation of Continuous Compaction Control Recommendations Recommendations Specific to the Demonstration Recommendations Regarding Geotechnical Data Management Recommendations Regarding Implementation of Continuous Compaction Control General Develop an Integrated Research and Implementation Program Top Research and Implementation Priorities Strawman Research and Implementation Plan Critical Research and Implementation Issues References Figures Appendix A Continuous Compaction Control Records Appendix B Dynamic Cone Penetrometer Data Appendix C Field Density and Laboratory Testing Data ii
7 List of Tables Table 1 Material Description Summary... 6 Table 2 BOMAG Machine Characteristics... 7 Table 3 Companion Test Summary Table 4 Summary of Testing by Soil Type Table 5 Summary of Dynamic Cone Penetrometer Testing Table 6 Summary of GeoGauge Modulus Data Table 7 Summary of Loadman (LWD) Modulus Data Table 8 Summary of Dry Densities Measured at Test Locations Table 9 Summary of Moisture Content Measurements at Test Locations Table 1 Plate Load Modulus Data for All Reload Cycles Table 11 Statistical Measures for the Four Principal Test Methods (Normal Distribution) Table 12 Statistical Measures for the Four Principal Methods (Lognormal Distribution) Table 13 Approximate Characteristics of the Testing Methods List of Figures All Figures are located after Section 5 and the References. Figure 1 Demonstration Test Location at the MnROAD Site Figure 2 Test Section Prior to Excavation Figure 3 Partially Excavated Test Section Figure 4 Four Soils Used in the Demonstration Figure 5 Concept of Stiffness and Modulus Determination from a Compactor Drum Vibration Figure 6 BOMAG Compactor Used in the Demonstration Figure 7 Schematic of BOMAG Variocontrol Technology for Continuous Compaction Control Figure 8 Possible Sequence of Collecting Surface-Covering Compaction Documentation Figure 9 Photos of Companion Testing Devices Figure 1 Typical Plate Load Test Load-Deflection Data Figure 11 Demonstration Site Cross Section Figure 12 Demonstration Site Plan View Figure 13 Example of Surface-Covering Compaction Documentation Figure 14 Example of Exported Data From BCMWin, with Companion Test Points Highlighted Figure 15 Demonstration Site Isometric View Figure 16 DCP Modulus for All Tests Figure 17 DCP Modulus Values as a Function of Depth Limit Figure 18 Companion Density Tests Figure 19 Plate Load Test Values for All Reload Cycles Figure 2 Distribution of Young s Modulus for Four Principal Test Methods Figure 21 Distribution of Young s Modulus for Four Principal Test Methods (lognormal distribution) Figure 22 Comparisons Between the BOMAG Data and Other Methods Figure 23 GeoGauge Test Comparison Figure 24 DCP Test Comparison Figure 25 Load-Displacement Data for Plate Load Test, Location 22a Figure 26 Stress Dependency of Modulus Measurements, Location 22 Figure 27 Stress Dependency of Modulus Measurements, Location 23 Figure 28 Comparison of Optimum to As-Compacted Moisture Content Figure 29 Percent Compaction by Location Figure 3 Comparison of In-Place to Optimum Moisture Content Figure 31 As-Built Section with Selected Modulus Data iii
8 Executive Summary This report documents a Continuous Compaction Control (CCC) demonstration conducted at the MnROAD facility during September 27 through September 3, 24. Continuous Compaction Control, also called Intelligent Compaction (IC), is a new technique in the United States construction market that uses an instrumented compactor to control soil or asphalt compaction in real time. This technology, which provides one of the first opportunities to apply process control to civil construction, is based on measuring the stiffness of the compacted soil. Initiatives in both the U.S. and Europe, started more than 1 years ago, have demonstrated the technical viability of measuring in situ soil stiffness and modulus. As the name implies, continuous compaction control combines the measurement of compaction level with feedback to adjust the compactive effort. The BOMAG compactor used for this demonstration project adjusts the compactive effort in real time to continue compaction of soils under the established target value, while preventing overcompaction of soils at or above the target value. The Minnesota Department of Transportation and the Federal Highway Administration have formal and informal initiatives to evaluate continuous compaction control. Other state DOTs are in various stages of evaluating continuous compaction control. The MnROAD demonstration site, section 54 on the low volume road test loop, was about 2 feet long, 8 feet deep and 25 feet wide. Four soils, listed in order from bottom to top, were used to construct the roadway foundation: 1. An ASTM SM soil removed from the excavation and stockpiled onsite, was used for the lower fill material. Pockets of SP sand were sparsely scattered throughout this material. 2. Three-inch-minus railroad ballast, used on top of the loamy sand 3. An ASTM SM soil from offsite was placed over the railroad ballast. 4. An ASTM GW-GM soil (crushed granite meeting Mn/DOT class 6 gradation) was used for the aggregate base. The bottom of the excavation was relatively wet due to a high water table and heavy rains the week before the demonstration. The machine used for the demonstration was a BOMAG Model BW 213 DH-3 BVC pertinent data about this model is in Table 2 BOMAG Machine Characteristics. The BOMAG compactor records modulus measurements as it compacts. These measurements can be printed to paper in the cab of the compactor or saved to a PCMCIA card using the BOMAG Compaction Management (BCM) system. Only one pass is printed at a time with onboard printer and measurements are not saved unless the BCM is used. The BCM logs the measurements every 1 cm and allows the user to create reports of the data showing surface coverage and measured values. The following portable devices and equipment were used to independently measure soil properties for comparison with the BOMAG measurements: dynamic cone penetrometer (DCP), Humboldt GeoGauge, Loadman light weight deflectometer (LWD), plate load test, nuclear density gauge, sand cone equipment and falling weight deflectometer (FWD). These companion tests were conducted at 23 locations within the test area. The principal companion tests (DCP, GeoGauge, LWD, sand cone and nuclear density) were performed at all locations, plate load tests were performed at only two locations. Two target values were used for the demonstration, depending upon material type. The Class 6 material used for the base course was compacted to a target value of 1 MPa. All other soils were compacted using a target value of 45 MPa. Because of the excessive moisture content of many of the soils used in the demonstration, the target values were generally not achieved. The following table provides the average, standard deviation, coefficient of variation, minimum value, maximum value and number of measurements for the four principal test methods. The BOMAG, LWD and GeoGauge data sets had 23 modulus values, and DCP data set had 22 modulus values. The table groups all soil types and compactive efforts. 1
9 Method Average (MPa) Standard Deviation (MPa) Coefficient of Variation Minimum (MPa) Maximum (MPa) BOMAG Compactor % LWD % GeoGauge % DCP (top 6 inches) % The histograms and statistical measures all indicate that the modulus values from the four methods are different. The BOMAG data has a wider range and is clustered toward lower values. GeoGauge data tends to be larger than the other methods, while the LWD and DCP data is intermediate between the BOMAG and GeoGauge. Correlations between companion tests were also investigated. The correlation coefficients were small, except for the GeoGauge-DCP relationship. Because the BOMAG and companion tests produce different soil stresses, the stress dependence of the soil modulus may be inferred from the test results. Data from the GeoGauge, LWD and BOMAG methods are consistent with the modulus-stress correlation from the plate load test. Note that the GeoGauge imparts the lowest stress, and that the LWD and BOMAG have stresses equivalent to the lower unloadreload cycles of the plate load test. Data from FWD testing indicates less stress dependence than other methods. GeoGauge and DCP modulus values show the trend of moisture content dependence expected for unbound materials. This dependence is similar in form to Proctor curves, with greater modulus values occurring near optimum, and smaller modulus values for moisture contents both wet and dry of optimum. At 22 of 23 test locations the compacted density was greater than 95 percent standard Proctor density. In the absence of surface-covering documentation and companion tests, the subgrade and base would have been accepted. Because of the additional documentation and testing, the real, observed nonuniform nature of the compacted materials was revealed. CCC provides a far superior quantitative measure of uniformity compared to existing standard QC/QA practice that utilizes point tests. Specific conclusions are: 1. The BOMAG compactor appears to be well made, rugged and easy to operate (both the traditional controls and the Vario controls and data storage). The BOMAG compactor measures and reports different E vib values depending upon the use of automatic (Variocontrol) or manual (fixed compactive effort) modes. 2. Different companion measurement tools produce different modulus values. Relatively good correlations were obtained between modulus values from the DCP and GeoGauge methods 3. A strong relationship between modulus and average contact stress was found for all devices that load the soil surface 4. Moisture content was found to affect both the compaction process and the measurement of soil modulus. Moisture content versus soil modulus relationships similar to those commonly observed for moisture content versus density were observed. 5. Under conditions similar to the demonstration, non-uniformly compacted soils would pass through traditional quality control and quality assurance procedures. 6. Continuous compaction control is an effective QC mechanism for soil compaction, because the surface-covering documentation adds value. Specific recommendations are: 1. Research and implementation activities for continuous compaction control should be continued. In particular, demonstrations should be performed on actual trunk highway construction projects, and t Department should integrate related aspects of machine control (including global positioning), pavement management and pavement design 2. Maintain flexibility regarding specific equipment for compaction and companion testing 3. Modify current compaction control, QC and QA practice when surface covering documentation is used. Count 2
10 1 Introduction 1.1 Demonstration Purpose This report documents a Continuous Compaction Control (CCC) demonstration conducted at the MnROAD facility during September 27 through September 3, 24. Continuous Compaction Control, also called Intelligent Compaction (IC), is a new technique in the United States construction market that uses an instrumented compactor to control soil or asphalt compaction in real time. This technology provides one of the first opportunities to apply process control to civil construction. 1.2 Continuous Compaction Control (CCC) Background Continuous compaction control is based on measuring the stiffness of the compacted soil. Initiatives in both the U.S. and Europe, started more than 1 years ago, have demonstrated the technical viability of measuring in situ soil stiffness. Commonly, the measured soil stiffness is used to estimate or compute in situ soil modulus, based on assumptions about soil behavior and the interaction between the compaction machine and the base or subgrade materials Terminology In any emerging technology, terminology varies among those involved until a standard develops. For the sake of clarity, the following definitions are used herein: 1. Surface covering documentation This phrase describes the combined location and compaction level data (typically stiffness, modulus, strength or a similar parameter) produced by a compactor over the entire surface of a compaction lift. 2. Continuous compaction control As the name implies, continuous compaction control combines the measurement of compaction level with feedback to adjust the compactive effort. The BOMAG compactor used for this demonstration project adjusts the compactive effort in real time to continue compaction of soils under the established target value, while preventing overcompaction of soils at or above the target value. 3. Intelligent compaction In this report, intelligent compaction is synonymous with continuous compaction control. 4. Vibratory versus non-vibratory compaction measurement The three preceding definitions do not distinguish between vibratory and non-vibratory compaction measurement methods. Most of the European technologies use vibratory methods similar to the methods used in this study, Caterpillar has developed a non-vibratory technology Description Intelligent vibratory compaction machines typically include the following: 1. Sensors to measure vibration of the drum 2. Onboard electronics to record and process sensor output, and record the stiffness 3. Linkages to the machine controls to adjust compaction effort according to the measured stiffness 4. Systems to record machine location 5. Either local storage or wireless communications systems for data transfer Process control is achieved in real time as the compaction process proceeds. The stiffness of the material is measured continuously as the compactor moves along. If the material stiffness is below the target value, the compactor applies compactive effort to the soil. If the material stiffness is at or above the target value, the compactor changes drum vibration from vertical to horizontal and does not further compact the material. 3
11 1.3 CCC Direct Benefits Continuous compaction control potentially provides substantial quality and cost benefits. Among these are: 1. Improved quality, especially in terms of uniform compaction. The process control capabilities mean that no material is either overcompacted or undercompacted. IC-equipped compactors sense that the material has reached the target stiffness and do not apply additional compactive effort. 2. Reduced compaction costs, both short- and long-term. Costs are reduced in the short term because compactive effort is applied only where necessary, and thicker lifts may be compacted. Long-term costs are reduced because of reduced wear and tear on the compactor. 3. Reduced life cycle cost. European experience with IC clearly demonstrates that greater compaction uniformity increases the useable life of the pavement system. 4. Integration of design, construction, and performance. Intelligent compaction, which provides comprehensive data on the stiffness of all materials compacted, links design, construction, and pavement performance. The data record produced by the compactor, which covers all areas and all lifts, is essential to the pavement management process. Long-term performance may be correlated with the properties produced during construction. Similarly, evaluating subgrade and pavement materials mechanical properties during compaction relates directly to the mechanistic properties used to design the pavement. This data can be correlated to Geogauge readings, dynamic cone penetrometer (DCP) test results, falling weight deflectometer (FWD) test results and other measures of structural strength. 1.4 CCC in the Context of FHWA and Mn/DOT Initiatives The Mn/DOT and the Federal Highway Administration (FHWA) both have formal and informal initiatives to evaluate continuous compaction control. Other state DOTs also are, or are planning to evaluate continuous compaction control. Mn/DOT interest in continuous compaction control originates from several factors: 1. Most Mn/DOT Districts are experiencing difficulty in performing the currently required quality assurance spot testing due to reduced personnel and tighter budgets. As a result, several Mn/DOT Districts have expressed interest in facilitating demonstrations of IC to evaluate the potential benefits of this technology. 2. The direct benefits outlined in Section 1.3 above. 3. Mn/DOT s Strategic Plan 23 includes strategic directions of "Make Mn/DOT Work Better" and "Make our Transportation Network Operate Better." These directions have led Mn/DOT to aggressively investigate machine control technology. Continuous compaction control is a logical partner technology of machine control. See ( 4. Implementation of mechanistic-empirical design methods for pavements requires modulus values during design, and also benefits from construction-time confirmation of the design values. Continuous compaction control provides the construction-time confirmation of both unbound materials and hot mix asphalt (HMA). 5. Design-build is one of several innovative contracting methods that Mn/DOT is using to help deliver projects faster and more efficiently. Contractors responding to design-build requests for proposals (RFPs) have additional flexibility to propose innovative construction techniques like continuous compaction control. 6. Finally, continuous compaction control requires the technology to measure, record, transfer and display modulus information. This technology is now available in several brands of compactors, for incremental costs approximately the same as adding a cab and air conditioning. 4
12 As a result, Mn/DOT is partnering with the North Carolina, Wisconsin, and Louisiana Department of Transportations (DOTs) to initiate a National Pooled Fund project that would build on European IC experience and develop IC specifications for the US construction industry. The FHWA has recently released draft FHWA Intelligent Compaction Strategic Plan (December 24). The following is excerpted from that document: 7. FHWA s Vision Through the use of creative use of computers, modeling, and innovative software, intelligent soil and asphalt compaction equipment will improve operations, result in more uniform pavement density, reduce inspector requirements, and provide a long-term quality record that can be related to pavement performance. 8. FHWA s Mission This strategic plan will establish a systematic process to encourage industry and DOTs to develop intelligent compaction capabilities in the US. The encouragement will come through a series of demonstration efforts, long and short term research, and innovative construction specifications. 9. Objectives of FHWA s Strategic Plan The objectives are: a. To accelerate the development of intelligent compaction technology (equipment, software and specifications) b. To encourage awareness and acceptance of the technology (education, equipment demonstrations and side-by-side comparisons with conventional compaction techniques on real projects) c. To conduct needed research to clarify the advantages and appropriate uses of the technology d. To provide organizational support for the process of developing intelligent compaction technologies e. Ultimately, by adapting and improving existing intelligent compaction equipment and techniques, US utilization of the technology will be advanced to be the best in the world 1.5 Focus on Soil Modulus This report focuses on soil Young s modulus as the soil parameter of interest. This focus is warranted, because Young s modulus is a critical input parameter in mechanistic-empirical design techniques. Continuous compaction control compactors report results as a modulus (or as a similar parameter). Many companion tests are available for demonstration purposes, or for quality assurance testing. Companion test results obtained during this demonstration were converted, where possible, to modulus values. However, there are technical obstacles to address when using soil modulus. For example, Briaud (21) points out that: The modulus of a soil is one of the most difficult soil parameters to estimate because it depends on so many factors. Therefore when one says for example: The modulus of this soil is 1, kpa, one should immediately ask: What are the conditions associated with this number? Some of the factors upon which soil modulus depends, and which are pertinent for this demonstration, are: 1. Soil moisture content 2. Soil stress level 3. Stress history 4. Soil age These dependencies mean that a soil modulus value measured by one method with characteristic size, stress level and depth of measurement may be different than the value measured by another method. Refer to Sections through for an assessment of these dependencies for this demonstration project. 5
13 2 Demonstration Protocol 2.1 Site Description Site Location The continuous compaction control demonstration occurred at Mn/DOT s MnROAD facility. This facility: is the world's largest and most comprehensive outdoor pavement laboratory, distinctive for its electronic sensor network embedded within six miles of test pavements. Located 4 miles northwest of Minneapolis/St. Paul, its design incorporates 4,572 electronic sensors. The sensor network and extensive data collection system provide opportunities to study how heavy commercial truck traffic and the annual freeze/thaw cycle affect pavement materials and designs. (See The demonstration site at MnROAD was on the low volume road test loop, adjacent to test section 53, as illustrated in Figure 1. The test section was available for the CCC demonstration due to a planned reconstruction after a culvert pipe test, shown in Figure 2. Approximately 2 feet of the test loop was excavated about 7 or 8 feet deep and 25 feet wide, shown in Figure Materials Four soils, shown in Figure 4, were used to construct the foundation of the road. A Mn/DOT classified loamy sand (Proctors 1 and 3), which was cut from the excavation and stockpiled onsite, was used for the lower fill material. Pockets of SP sand (Proctor 2) were sparsely scattered throughout the onsite material. Three inch minus railroad ballast (no Proctor) was used on top of this in an attempt to stiffen the fill. More loamy sand (Proctor 4) was brought in from offsite and placed over the railroad ballast. Then crushed granite (Proctor 5) was used for the aggregate base. The crushed granite met Mn/DOT class 6 gradation requirements. Material description is as follows: Table 1 Material Description Summary Proctor ASTM Soil Classification Mn/DOT Soil Classification Max. Dry Density Optimum Moisture Content 1 SM SL pcf 9.3% 2 SP S 13.2 pcf 8.% 3 SM SL pcf 11.% 4 SM SL pcf 9.9% 5 GW-GM Class pcf 1.7% See Appendix C for sieve analysis and Proctor test details Construction Sequence After the pavement and existing test pipes were removed, the soil was excavated to a depth of roughly 7 to 8 feet. The bottom of the excavation was relatively wet due to a high water table and heavy rains the week before the demonstration. The first lift was placed and compacted with difficulty due to saturated material. This material was removed and replaced with dryer onsite material. Lifts 1, 3, 4 and 6 consisted of loamy sand. Lifts 3 and 5 consisted of railroad ballast, placed in an attempt to stiffen the lower fill material. Lifts 1 through 6 were placed with a dozer and compacted with the BOMAG on automatic mode with an E vib target value of 45 MPa. However, the target value was not achieved because of the high moisture content of the loamy sand. Lifts 7 through 1 consisted of Mn/DOT class 6 and were compacted in automatic mode with an E vib target value of 1 MPa. The target value was achieved on all but portions of lifts 7 and Continuous Compaction Control Machine Technology Description Continuous compaction control technology is based on measuring the stiffness of the compacted soil. Initiatives in both the U.S. and Europe, started more than 1 years ago, have demonstrated the 6
14 technical viability of measuring in situ soil stiffness. Selected literature references are included later in this report. Throughout this section, the term soil stiffness is used generically to represent the deformational properties of the soil, whether stiffness or modulus. Continuous compaction control machines typically include the following: 1. Sensors to measure vibration of the drum 2. Onboard electronics to record and process sensor output, and record the stiffness 3. Linkages to the machine controls to adjust compaction effort according to the measured stiffness 4. Systems to record machine location 5. Either local storage or wireless communications systems for data transfer Process control is achieved in real time as the compaction process proceeds. The stiffness of the material is measured continuously as the compactor moves along. If the material stiffness is below the target value, the compactor applies compactive effort to the soil. If the material stiffness is at or above the target value, the compactor changes drum vibration from vertical to horizontal and does not further compact the material. Figure 5 illustrates the concept of compactor-based stiffness measurement BOMAG Compactor The machine used for the demonstration was a BOMAG Model BW 213 DH-3 BVC, shown in Figure 6. Pertinent data about this model is in Table 2 BOMAG Machine Characteristics. Table 2 BOMAG Machine Characteristics Item Value Operating weight 14,66 kg Axle load, drum 9,7 kg Axle load, wheels 5,59 kg Static linear load 42.6 kg/cm Working drum width 2,13 mm Track radius, inner 3,494 mm Speeds -3,5 km/h -6,3 km/h -12, km/h Performance ISO 346 Tire size Variocontrol Frequency Amplitude directed (hor./vert.) Centrifugal force 153 hp 23.1/18-26/12 PR standard 28 Hz 2,4 mm kn Figure 7 illustrates BOMAG Variocontrol technology for continuous compaction control CCC Process and Documentation CCC technology has the following stages (refer to Figure 8): 1. Establish target modulus values for each soil material 2. Define the project on the desktop PC software 3. Transfer the project definition via PCMCIA memory card to the BCM device on the BOMAG compactor 4. During compaction, use the BCM device on the BOMAG compactor to control the compaction process and capture the measured soil stiffness. 5. Conduct companion QA tests 7
15 6. At the end of each day, transfer the project definition and measured soil stiffness values back to the desktop PC via the PCMCIA memory card. 7. Produce the surface covering stiffness documentation (in paper and electronic form) 8. Identify locations for QA testing 9. Perform QA testing at the rates specified in Schedule of Materials Control 2.3 Field Measurements General Description The subgrade and base were constructed using the materials described in Section 2.1.2, and the sequence described in Section After each lift was delivered and spread, the BOMAG machine was used to compact the soil, using an E vib target value of 45 MPa for the first six lifts and 1 MPa for the remaining four lifts. Because of poor site drainage and excessive rainfall, the target value was never achieved during recompaction of the natural soils and lower base layers. After the appropriate number of passes in each lane, the BOMAG was moved to adjacent lanes and companion measurements were done CCC Machine Data The BOMAG compactor records stiffness measurements as it compacts. These measurements can be printed to paper in the cab of the compactor or saved to a PCMCIA card using the BOMAG Compaction Management (BCM) system. Only one pass is printed at a time with onboard printer and measurements are not saved unless the BCM is used. The BCM is a system which logs the measurements every 1 cm and then allows the user to create reports of the data showing surface coverage and measured values. This data can be exported to a Microsoft Excel Data Interchange Format (*.DIF) file. All measurements from the demonstration are found in Appendix A Dynamic Cone Penetrometer Dynamic Cone Penetrometer (DCP) measurements were performed according to ASTM D The DCP, shown in Figure 9, is a device that measures soil shear strength. It functions by striking a cone tipped rod with a freefalling weight, thereby driving the cone into the soil. The distance the cone penetrates is measured and the process is repeated until the desired depth is achieved. The recorded data is most commonly plotted as the number of blows divided by the penetration of the cone. This value is referred to as the DCP Penetration Index (DPI). The following correlation is used to determine the soil modulus from a DCP measurement: Log (E DCP ) = (log (DPI)), (DeBeer, 1991) where E DCP is the effective elastic modulus GeoGauge GeoGauge measurements were performed according to ASTM D The Humboldt GeoGauge, shown in Figure 9, was used to conduct companion tests. The 22-lb device directly measures the stiffness of a 4.5-inch outside diameter by 3.5-inch inside diameter plate (foot) resting on the soil surface. The stiffness is measured dynamically in the frequency range from 1 Hz to 2 Hz, and the average stiffness across the frequency range is reported to the user. Measurements may be taken about every 75 seconds if the device is not moved, and every few minutes if the device is moved to a new location nearby. The Young s modulus of the soil may be calculated from the foot geometry and an assumed Poisson s ratio. Seating of the GeoGauge involves setting it on the test location and giving a slight twist. Twisting the GeoGauge is performed to ensure a minimum of 8% contact between the foot and the soil. Humboldt recommends using a small layer of sand when the 8% contact cannot be achieved. The field engineer determined that contact between the foot and soil was sufficient for all tests without the use of sand Loadman The Loadman, shown in Figure 9, is a portable Light Weight Deflectometer (LWD), which can be used to measure in-situ material stiffness. The device consists of a closed aluminum tube with dimension 8
16 approximately 5 x6 x47. A mass freely falls from a known height inside the tube and impacts a plate at the lower end of the tube. Then the impact load and displacement are displayed. The LWD weighs about 4 lbs with approximately half of its weight being in the falling mass (22 lbs). The following is the testing procedure: 1. Locate a relatively smooth and level spot for the test. 2. Remove the LWD from its case and turn it on. 3. Place the LWD on the testing location, then rotate it slightly to smooth out the contact surface. 4. A spoon or screwdriver may be used to mark the ground around the foot of the LWD to ensure the same spot for sequential tests. 5. Pick up the LWD and tip gently to allow the mass to slide slowly from the bottom of the tube to the top where it connects with a click to the magnet. 6. Place the LWD back on the marked circle from step Press the reset button. 8. Press the drop button to drop the mass. There is a few second delay from when the drop button is pressed to when the mass is released. 9. Record the load and displacement displayed. 1. Repeat steps 5 through 9 until five tests have been performed. 11. Turn the LWD off and place it back in the case. The difference between the results from drops 3, 4 and 5 is quite small compared to the first two drops. The reason is that the LWD impacts the ground with a large force. This force compacts the loose soil near the surface and causes the deflection to decrease and load to increase from drop to drop. Normally, the deflection of the second drop was significantly less than that of the first. Therefore, the first two drops are considered seating drops similar to standard FWD procedure. During the testing, the LWD must be held steady and vertical. The operator should ensure that surface is even and smooth. The experience showed that, if the LWD was tipped during testing, the readings were not correct. In summary, the LWD is a simple device. See Nuclear Density Gauge Nuclear density testing was performed using Troxler 343 nuclear density gauge, shown in Figure 9, according to ASTM D Four nuclear density tests were conducted at each test location. Testing proceeded as follows: 1. The first test was conducted. 2. Using the same hole from the first test, the gauge was rotated 9 and the second test was conducted. 3. This was repeated until four tests were conducted at a test location Plate Load Test The small-scale plate load test used in this and other projects was developed by CNA Consulting Engineers to provide an alternative means to measure soil modulus. Using modern sensors and data acquisition equipment, CNA has been able to conduct meaningful plate load tests using readily portable equipment at force levels up to 5 lbs. As many in the past have found, measuring plate deflection at small loads is the most difficult aspect of field plate load tests. The test apparatus is able to resolve vertical deflections of about.1 inch. The plate load test field apparatus is illustrated in Figure 9. Either a plate foot or a ring foot (like the GeoGauge) may be used in contact with the soil. All testing for this demonstration project was performed using the ring foot identical to the GeoGauge. The concrete masonry units provide the reaction force, a wood 2x4 is the lever arm, a simple three-point frame provides a deformation 9
17 reference, and the user provides the load while simultaneously monitoring the test on the laptop screen. Several load-unload cycles are applied: typically load to 1 lbs, unload to 5 lbs, reload to 2 lbs, unload to about 1 lbs, etc., up to 5 lbs. Figure 1 illustrates a typical load-deflection curve obtained. As shown, the load is applied in several increments, separated by unload-reload cycles. Some hysteresis occurs during each unload-reload cycle. Several distinct stiffness values are apparent in the graph: 1. The initial loading stiffness This stiffness occurs whenever the soil is subject to loads greater than previous values. In Figure 1, the initial loading stiffness does not significantly change with increasing load. For some soils and compactive efforts, the initial loading stiffness increases with increasing load, and in other cases it decreases. 2. Because there is hysteresis in the unload-reload cycles, there are many alternative stiffness values that may be defined. 3. The unloading stiffness This stiffness occurs when the load is reduced. In Figure 1, the unloading stiffness was determined from the minimum load portion of the unloading curve. 4. The reloading stiffness This stiffness occurs when the load is reapplied. In Figure 1, the loading stiffness was determined from the majority of the reloading curve. Note that the unload or reload stiffness is typically 3 to 2 times greater than the initial loading stiffness Sand Cone Density Sand cone density testing was conducted using standard equipment, according to ASTM D Falling Weight Deflectometer Falling Weight Deflectometer testing was conducted according to ASTM D Laboratory Measurements Appendix C lists results from all laboratory measurements conducted on the fill material. Measurements conducted are as follows: 1. Proctor tests were conducted according to ASTM D Procedure A Standard. 2. Sieve analyses, were conducted according to ASTM D Field Measurements and Analysis 3.1 Test Locations Figures 11 and 12 illustrate the lane widths, number of lifts and lift thicknesses and materials used in constructing the demonstration embankment. The pertinent information includes: 1. The test section was approximately four compactor lanes wide at the bottom, and six lanes wide at the top. The transition from four to six lane widths occurred by overlapping compactor passes. 2. Nine lifts were placed, varying in uncompacted thickness from six inches to twelve inches. 3. The relationship between lifts and materials are illustrated in Figure CCC Machine Data Documentation Surface-covering documentation was collected for all lifts using the BOMAG compactor. For most lanes and lifts, surface-covering documentation was captured electronically via the PCMCIA card. However, selected lifts and lanes were captured only on paper strips from the compactor. Appendix A contains scanned images of all paper records. Figure A.1 (see Appendix A) is an index to the paper and digital records, with cross-references to the soil type, Proctor test number and test location. 1
18 All lifts were compacted in continuous compaction control mode (identified as automatic mode on the paper records) through the initial passes. When the target values were achieved, or because the soils were too moist to compact further, the machine was typically switched to manual mode for a final measurement pass. For technical reasons that are not fully documented, the BOMAG compactor produces different values depending upon whether in the automatic or manual mode. The likely cause is variations in the vibration amplitude and frequency between the two modes. Understanding these variations is one of the principal recommendations of this report (see Section 5.1). Figure 13 shows typical output from the BOMAG companion software BcmWin V This software is used to define the project site prior to construction, and to display and analyze surface-covering data during and after construction. Figure 14 shows exported data, which is easily plotted using the BcmWin software Target Values Two target values were used for the demonstration, depending upon material type. The Class 6 material used for the base course was compacted to a target value of 1 MPa. All other soils were compacted using a target value of 45 MPa. Because of the excessive moisture content of many of the soils used in the demonstration, the target values were generally not achieved. 3.3 Companion Test Summary Companion tests were conducted at 23 locations within the test area (refer to Figures 11,12 and 15). In general, the principal companion tests (DCP, GeoGauge, LWD, sand cone and nuclear density) were performed at all locations. Plate load tests were performed at only two locations. Table 3 summarizes the location and soil type for each companion test location. Table 3 Companion Test Summary Unique Location ID Plan Location Elevation Lane Lift Proctor Test ID ASTM Soil Class Mn/DOT Soil Class SM SL SM SL SM SL SM SL SM SL SP S SM SL SM SL SM SL SM SL SM SL SM SL SM SL SM SL SM SL SM SL GW-GM Class GW-GM Class GW-GM Class GW-GM Class GW-GM Class GW-GM Class GW-GM Class 6 Table 4 summarizes the testing by soil type and test method. Most testing was performed on lifts classified as Mn/DOT SL (ASTM SM). 11
19 Test Table 4 Summary of Testing by Soil Type ASTM SM (SL) P1 ASTM SP (S) P2 ASTM SM (SL) P3 Soil Type ASTM SM (SL) P4 ASTM GW-GM (Class 6) P5 BOMAG-paper BOMAG-electronic Loadman (LWD) Prima (LWD) 4 4 GeoGauge Plate Load 2 2 DCP Nuclear Density Sand Cone Density Proctor Sieve Analysis Total 3.4 Dynamic Cone Penetrometer DCP Data Summary Table 5 summarizes the Dynamic Cone Penetrometer (DCP) testing done during the demonstration. One DCP test was conducted at each of the 23 test locations. Drive depths ranges from about.3 feet to 1.4 feet variations depended upon the materials and the DCP Penetration Index (DPI). Data reduction followed the procedures described in Section Statistical summaries of the DCP data, and comparisons with other companion tests, are in Section 3.9 Comparisons and Correlations. Location DPI top 4 in DPI top 5 in Table 5 Summary of Dynamic Cone Penetrometer Testing DPI top 6 in DPI GG Weight Func E dcp 4 E dcp 5 E dcp 6 E dcp GG W Func DPI E dcp DCP First Layer DCP Second Layer na na 9 15 na na DCP Wtd Ave. Figure 16 illustrates the variation in soil modulus, computed using the DCP, as a function of soil type and depth. Like most DCP data from stress dependent unbound materials, the results from this demonstration show strength increase with depth. Modulus values at 1 foot below surface are typically two to four times the values from the first, near-surface blow. The data seems to naturally divide into three groups: below, between and above two heavy lines shown in Figure 16. Below the lower line, 12
20 modulus values are generally less than 5 MPa and the soils are SM (SL) from Proctor tests 1 and 3. Between the heavy lines, modulus values are between 25 and 75 MPa at the surface and increase to 1 to 2 MPa. These soils are generally SP (S), SM (SL), and Class 6 (Proctor tests 2, 4 and 5 respectively). Above the top heavy line is a single DCP on Class 6, that was about 1 MPa near the surface DCP Modulus Values as a Function of Depth Limit The DCP is the sole device used in the demonstration that provides a modulus profile with depth. (Of course, the portable devices may be used to obtain a profile by excavating down and testing of the new surface.) Measuring the modulus profile is a benefit of the DCP, but makes comparison with other methods more difficult. The difficulty of comparing DCP results to other methods is compounded by the depth (i.e. stress) dependence of modulus (see the preceding section). The methods that measure soil modulus from surface contact (BOMAG, LWD, GeoGauge, Plate load) produce a composite modulus that is a complex function of the loading geometry and soil properties. In this analysis, several methods were used to calculate a single DCP modulus from the measured profile: 1. Weighted average (of drive length) with a cutoff at depth limits of 4, 5 and 6 inches 2. Weighted average corresponding to the approximate weighting of the GeoGauge 3. Weighted average based on soil layers. None of the methods substantially improved the correlations with other types of measurements. Figure 17 illustrates the influence of depth limit on DCP modulus values. The results presented below and the comparison sections are for a weighted average to a depth limit of 6 inches. This column is bold in Table GeoGauge Two, 3 or 4 Geogauge measurements were taken at each companion test location. The number of GeoGauge measurements depended upon the repeatability of the data. Additional measurements were taken if initial readings were variable. Table 6 summarizes the individual and average test results. Statistical summaries of the GeoGauge data, and comparisons with other companion tests, are in Section 3.9 Comparisons and Correlations. Table 6 Summary of GeoGauge Modulus Data Location E Geo 1 E Geo 2 E Geo 3 E Geo 4 E Geo Avg (Mpa)
21 Tests from location 4, test 1 and location 5, test 2 were excluded from the average due to a perceived influence on the GeoGauge measurement from pounding the nuclear density gauge rod into the ground while conducting the measurement. 3.6 Light Weight Deflectometer Table 7 summarizes the LWD modulus data collected during the demonstration test. Refer to Section for a description of the methodology used to calibrate the Loadman and calculate the modulus value for each test. Statistical summaries of the Loadman data, and comparisons with other companion tests, are in Section 3.9 Comparisons and Correlations. Table 7 Summary of Loadman (LWD) Modulus Data Location E LWD (Mpa) Location E LWD (Mpa) Nuclear Density and Sand Cone Density A nuclear density gauge was used to measure dry density and moisture content at all test locations. Sand cone equipment was used to measure the same parameters at selected locations. Table 8 summarized the dry density measurements and Table 9 summarizes moisture content results. Location Table 8 Summary of Dry Densities Measured at Test Locations Dry Density Nuclear (North) (pcf) Dry Density Nuclear (East) (pcf) Dry Density Nuclear (South) (pcf) Dry Density Nuclear (West) (pcf) Dry Density Nuclear Avg (pcf) Dry Density Sand Cone (pcf)
22 Figure 18 compares sand cone and nuclear density test results. For densities above about 135 pcf, the sand cone values are significantly less than the nuclear densities. While evaluating this difference in beyond the scope of this study, the cause is likely the presence of large rock fragments in the soil. 3.8 Plate Load Tests Table 9 Summary of Moisture Content Measurements at Test Locations Location Moisture Content Nuclear (North) (%) Moisture Content Nuclear (East) (%) Moisture Content Nuclear (South) (%) Moisture Content Nuclear (West) (%) Moisture Content Sand Cone (%) Plate load tests were conducted at test locations 22 and 23 the results are shown in Table 1. As explained in Section 2.3.7, the plate load tests include several unload-reload cycles up to a total load of about 5 lbs. Hence, each test produces several modulus values. For this report, the modulus values reported in the tables and graphs are for the reload portion of each unload-reload cycle. Figure 19 illustrates the distribution of modulus values for each test location, and includes the equivalent normal distribution curve. Table 1 Plate Load Modulus Data for All Reload Cycles Location Test Load- Unload Curve Average Load (N) Modulus (MPa) Location Average Modulus (MPa) Average Stress (kpa) 22 A A A A A B B B B C C A A A B B B C C C
23 3.9 Comparisons and Correlations Modulus Data for the Four Principal Test Methods Table 11 provides the average, standard deviation, coefficient of variation, minimum value, maximum value and number of measurements for the four principal test methods. The BOMAG, LWD and GeoGauge data sets had 23 modulus values, and DCP data set had 22 modulus values. The table groups all soil types and compactive efforts. Table 11 Statistical Measures for the Four Principal Test Methods (Normal Distribution) Method Average (MPa) Standard Deviation (MPa) Coefficient of Variation Minimum (MPa) Maximum (MPa) BOMAG Compactor % LWD % GeoGauge % DCP (top 6 inches) % Count Figure 2 compares the histograms for the four test methods. The plots include the equivalent normal distribution for comparison with the actual histograms. Although no statistical tests were conducted, a normal distribution seems to fit the LWD and GeoGauge data fairly well. In contrast, the BOMAG and DCP data seem to be truncated on the left or low modulus side, and skewed to the right or high modulus side. Hence, the statistical values listed in Table 11 may not fairly represent the data for the BOMAG and DCP tests. Table 12 Statistical Measures for the Four Principal Methods (Lognormal Distribution) Method Average (MPa) Standard Deviation (MPa) Coefficient of Variation BOMAG Compactor % LWD % GeoGauge % DCP (top 6 inches) % Table 12 lists the statistical measures for lognormal distributions, and Figure 21 shows the histograms and lognormal distributions. The lognormal distributions seem to match all data fairly well. The histograms and statistical measures all indicate that the modulus values from the four methods are different. The BOMAG data has a wider range and is clustered toward lower values. GeoGauge data tends to be larger than the other methods, while the LWD and DCP data is intermediate between the BOMAG and GeoGauge Correlations Between BOMAG Data and Companion Tests Figure 22 illustrates the relationships between BOMAG data and the other tests on a point by point basis. The upper left graphs shows all data, and the other three are BOMAG vs. LWD, BOMAG vs. GeoGauge and BOMAG vs. DCP, respectively. The graphs show little correlation between the BOMAG data and the other test methods. There are several reasons for this result: 1. The depth and stress dependency of soil modulus. Depth and stress dependency is addressed in Section The heterogeneity of the soils used precludes correlations. Soil heterogeneity may affect correlations because the BOMAG senses the properties of a large volume of soil, while the companion tests are clustered near the surface in a small area in the middle of the drum Correlations Between Companion Tests Correlations between companion tests were also investigated. Figure 23 shows correlations between the GeoGauge, and BOMAG, LWD and DCP. The correlation coefficients are small, except for the GeoGauge-DCP plot in the lower right of the figure. In this graph, two outliers (high DCP for GeoGauge 16
24 values of about 7 MPa) have been removed. There are technical justifications for removing these outliers. 1. The first outlier is on a thin layer of soil over compacted railroad ballast. 2. The second outlier is on a small pocket of SP soil under about 4 inches of SM soil. In the later test, the overlying SM soil was removed prior to testing. After removal of the outliers, there is a moderate correlation between the GeoGauge and DCP. Figure 24 shows correlations between the DCP, and the BOMAG, LWD and GeoGauge. The correlation coefficients are small for the BOMAG and GeoGauge (with outliers, lower left). There is moderate correlation for the LWD and GeoGauge (without outliers, lower right) Influence of Stress on Soil Modulus Soil modulus is commonly recognized to be dependent upon the mean stress level and the deviator stress. Because soil stresses increase with depth, soil modulus also increases with depth. This depth dependence influences the relationships between different test methods used in this demonstration project. Because the plate load test is conducted at varying load levels, the stress dependence of the soil modulus may be inferred from the test results. Figure 25 shows the load-displacement data for one of the plate load tests conducted at location 22. The figure clearly shows that the slope of the unloadreload load-displacement data increases with increasing load. The data for all plate load tests is in Table 1. Figures 26 and 27 show the data from Table 1, plotted as a function of the vertical stress. The graph distinguishes between the three separate plate load tests conducted at each location. For both location 22 and location 23, there is a good correlation between stress and modulus for the plate load tests. The slopes are about 325 kpa / kpa and 41 kpa / kpa, for locations 22 and 23 respectively. The graphs also include single data points for the GeoGauge and LWD tests, a range for the BOMAG compactor, and data points for the FWD tests, which were conducted after compaction of the top lift was complete. The range of stress levels for the BOMAG is necessary because of the variable contact area of the compactor drum. Contact widths of 6 inches to 18 inches, and a drum axle static weight of 15,3 lbs were used to calculate the range of average stresses. The peak stress from the LWD and FWD analysis was used. Data from the GeoGauge, LWD and BOMAG methods are consistent with the modulus-stress correlation from the plate load test. Note that the GeoGauge imparts the lowest stress, and that the LWD and BOMAG have stresses equivalent to the lower unload-reload cycles of the plate load test Influence of Moisture Content Figure 28 compares inplace moisture content to the optimum moisture content. Five Proctor tests were performed on the soils compacted during the demonstration (refer to Section Materials). Optimum moisture contents ranged from about 9 percent to 11 percent. Three soils comprising 8 of 23 test locations were placed, compacted and tested at moisture contents from 2 percent to 5 percent greater than optimum. Seven of eight of the test locations were in SM soils. Most of the remaining test locations were SP (one Proctor) and Class 6 (one Proctor). These granular materials were generally 2 percent to 7 percent dry of optimum moisture content. Despite the high moisture contents in the SM soils, the relative compaction results generally meet minimum compaction requirements of 95% standard Proctor, as shown in Figure 29. However, this is no guarantee for adequate stiffness. Figure 3 shows the modulus values measured by the four principal methods, as a function of difference between actual and optimum moisture content. The different soil types are indicated by different symbols. Note that the compactive effort may be different for each test location. Nevertheless, the GeoGauge and DCP modulus values show the trend of moisture content dependence expected for unbound materials. This dependence is similar in form to Proctor curves, with greater values occurring near optimum, and smaller values for moisture contents both wet and dry of optimum. 17
25 3.9.6 Other Factors Influencing Modulus Measurements Figure 31 is a composite section of test results at plan location 6, tests 5, 6, 8, 13 and 19. Different soils in the section are indicated by different colors in the chart background, and a horizontal white bar indicates the top of each lift. A vertical bar drawn from the top of the lift to the approximate depth of measurement represents E vib, GeoGauge, LWD tests. DCP results are drawn at the center of the depth interval of each blow. The graph clearly shows the depth dependence of the test methods. Table 13 compares the sensing depth, soil volume and stress level of the five test methods. Each of these test characteristics influences the soil modulus measured by the test methods: 1. Sensing depth Test methods that sense deeper will be influenced by the (likely) greater compaction and higher stress level of deeper soils. Hence, BOMAG compactors should in general measure greater modulus than the other methods. However, a soft layer underlying a stiffer layer would lower the overall stiffness measured by the BOMAG. In that case the other test methods would show higher stiffness measurements. 2. Soil heterogeneity Soil properties are heterogeneous at the scale of the volumes sensed by the test methods. These heterogeneities present within the volume sensed by a particular method are averaged out. However, there is a 5-fold variation in the volume sensed. Hence, methods that sense a smaller volume should be more variable than methods that sense a greater volume. 3. Vertical stress level There is a three to ten fold variation in vertical stress level between methods. Based on the data described in Section 3.9.6, there should be a two to three fold effect on soil modulus. Test Table 13 Approximate Characteristics of the Testing Methods Approximate Sensing Depth Approximate Sensing Area Approximate Soil Volume Sensed Approximate Vertical Stress Level BOMAG compactor 2-4 ft 5 15 sq in 2 cu ft 7-21 kpa LWD.5-1 ft 5.3 sq in.1 cu ft 1 kpa GeoGauge.5-1 ft 6.28 sq in.1 cu ft 25 kpa Dynamic cone penetrometer Up to 2 ft.49 sq in.4 cu ft na Plate load test.5-1 ft 6.28 sq in.1 cu ft 1-5 kpa Identification of Potential Problem Areas The surface-covering documentation provided by the BOMAG compactor used for the demonstration is effective in identifying the location of potential compaction problem areas. The extensive documentation of the nature of the subgrade provided by CCC technology is in stark contrast to standard earthwork QC/QA practice, where sampling and testing rates may be only 1:1, to 1:1,, on a volume basis (see White, et al, 25). The effective sampling rate for surface covering documentation is 1:1. Figure A.3 (see Appendix A) is a good example. This figure is for lanes 2 through 5 for lift 1B. The third strip from the left, for lane 3, shows two zones (5 meters and 2 meters from the start of the trace) where is less than 25 MPa. In comparison, most of the center of the strip, more than 1 meters long, has a modulus of greater than 1 MPa. Note that at 22 of 23 test locations the compacted density was greater than 95 percent standard Proctor density. In the absence of surface-covering documentation and companion tests, the subgrade and base would have been accepted. Because of the additional documentation and testing, the real, observed non-uniform nature of the compacted materials was revealed. CCC provides a far superior quantitative measure of uniformity compared to existing standard QC/QA practice that utilizes point tests. 3.1 Other Experience The BOMAG compactor used in this demonstration was in Minnesota for several months, and was used to conduct other demonstrations. These other demonstrations were conducted without the constraints of specific calendar dates, and the soils were compacted under more desirable moisture conditions. 18
26 The soils were generally more granular than used in this demonstration. While the data from these other demonstrations is proprietary, the general nature of the results is not. It was found that the machine: 1. Was affective at compacting soils up to the target value, without overcompaction 2. Produced surface-covering documentation using solely the paper strips (although the digital data is preferred) 3. Identified and recompacted a trench cut without overcompacting adjacent undisturbed soils 4 Conclusions 4.1 Conclusions Related to the Site, Materials and Procedures 1. The MNROAD facility provides substantial resources that facilitate demonstration projects. 2. Pre-demonstration weather conditions, specifically heavy rainfall, impacted the demonstration by raising the moisture content of the test soils. 3. The scattered funding sources and limited budget impacted the demonstration in several ways: a. The soils came from several sources and were heterogeneous. b. Soil placement was irregular. c. The schedule was short and fixed, which did not allow time to reduce the moisture content. d. There was no equipment available to work the soil to reduce the moisture content. 4. In order to better achieve the demonstration objectives, the demonstration should have been conducted with under better conditions. The demonstration was conducted under conditions near the limit of normal construction practice. No compaction technology performs well under such conditions. 5. Overall procedures and coordination were excellent, except as noted in the following section. 4.2 Conclusions from Experience with BOMAG Compactor 1. The BOMAG compactor appears to be well made, rugged and easy to operate (both the traditional controls and the Vario controls and data storage). 2. Data transfer between the compactor and the office computer is functional, but could be made more seamless. 3. The BOMAG companion software BcmWin is functional, but better suited to large-scale production projects than smaller-scale demonstration projects. 4. The BOMAG compactor measures and reports different E vib values depending upon the use of automatic (Variocontrol) or manual (fixed compactive effort) modes. 5. The objectives of the demonstration may have been better achieved if BOMAG modulus data had been retained for every pass. In particular, few of the data sets from automatic (Variocontrol) mode were saved. 4.3 Conclusions from Companion Testing 1. As expected from existing research and experience, different measurement tools produce different modulus values 2. Relatively good correlations were obtained between E dcp and E gg 3. A strong relationship between modulus and average contact stress was found for all devices that load the soil surface 19
27 4. Moisture content was found to affect both the compaction process and the measurement of soil modulus 5. Moisture content versus soil modulus relationships similar to those commonly observed for moisture content versus density were observed. 4.4 Conclusions from Observation of Continuous Compaction Control 1. Continuous compaction control is an effective QC mechanism for soil compaction. 2. Surface-covering documentation adds value. 5 Recommendations 5.1 Recommendations Specific to the Demonstration 1. Research and implementation activities for continuous compaction control should be continued 2. Future research and construction projects should initially be done with more uniform soils and moisture contents 3. Demonstrations on actual trunk highway construction projects should be performed 5.2 Recommendations Regarding Geotechnical Data Management The information collected by a CCC compactor is an invaluable resource, which may be used throughout the life cycle of the roadway. 1. Develop an initiative that involves the related aspects of machine control (including global positioning), pavement management and pavement design. a. Encourage machine manufacturers to implement GPS-based location documentation b. Encourage companion test equipment manufacturers to also implement GPS-based location documentation c. Develop and implement geotechnical data management standards and practices, so the valuable field data may be maintained and used throughout Mn/DOT. See for example the papers presented in the Geotechnical Database Management System session at TRB 25. d. Integrate CCC documentation into the pavement management and pavement design processes 5.3 Recommendations Regarding Implementation of Continuous Compaction Control General 1. Maintain flexibility regarding specific equipment for compaction and companion testing 2. Modify current compaction control, QC and QA practice when surface covering documentation is used Develop an Integrated Research and Implementation Program The research and implementation program should evaluate continuous compaction control as a means for compaction of unbound materials in Minnesota roadway construction. The following key questions should addressed: 1. Do compactors equipped with CCC reliably measure the modulus (or a related parameter) of the unbound materials? 2. Are the measured values independent of machine model and manufacturer, or at least correlated? 3. Is CCC an acceptable Quality Control procedure? 2
28 4. What Quality Assurance procedures are necessary or appropriate when CCC is used? 5. Do the unbound materials commonly used in Minnesota roadway construction represent any special problems in the application of CCC? 6. How should target values be established and confirmed? 7. What Special Provisions or Standard Specifications are necessary for CCC? Top Research and Implementation Priorities 1. Reliability of establishing target values, achieving the target values via CCC and confirming the results with QA tests 2. Benefits of CCC in uniformity 3. Identify any special cases or problems with commonly used Minnesota materials (difficult to compact, poor relationships between CCC and companion tests, materials that achieve modulus but not density, flat or decreasing modulus with additional passes) 4. Develop draft specifications 5. Investigate the modulus density moisture compactive effort relationships Strawman Research and Implementation Plan 1. Determine five (consider if this number is appropriate) most commonly used types of unbound materials used for Minnesota roadway construction a. Possible types include: one or two kinds of Select Granular Borrow, one or two kinds of base (e.g. Class 5 or Class 6), one or two kinds of natural soil, maybe more cohesive b. Establish target modulus values based on current Mn/DOT ME design procedures, and past history of modulus testing the lab and field c. Identify projects/locations/sources in the state for these commonly used materials d. At least one of the projects or locations will be in a controlled environment (e.g. an aggregate pit or similar) not subject to the limitation of construction schedules and similar factors 2. Conduct side-by-side field tests of two CCC equipped compactors, and a traditional compactor (without CCC) a. Describe here the protocol for these field tests, probably taken from the MnROAD demo description b. Include the relative size of each field test (cubic yards, number of companion tests, etc.) 3. At the same two sites, instrument the CCC machines to (write an objective) 4. At two sites, instrument the subsurface layers to determine the effects of CCC 5. Establish the relationship, if any, for the five unbound materials, between laboratory properties, design modulus, CCC modulus and modulus from companion tests a. Document the relationships b. Document the uniformity, compare and contrast the uniformity differences between CCC-equipped and traditional compactors 6. If CCC continues to be suitable for use on Minnesota roadway projects, prepare draft protocols and specifications: a. For establishing target values b. Conducting CCC and its acceptance for Quality Control c. Submittal of CCC records d. The Quality Assurance testing appropriate for verifying the CCC 21
29 7. Document the findings: a. Selection of the most commonly used types of unbound materials used for Minnesota roadway construction b. Establishment of target modulus values c. Results of side-by-side field tests d. Results from instrumentation of the subsurface layers and the CCC machines e. The relationships determined for the five unbound materials, between laboratory properties, design modulus, CCC modulus and modulus from companion tests f. Draft protocols and specifications for CCC Critical Research and Implementation Issues 1. Establish funding versus priority relationships 2. Establish how many sites and materials to test, and whether under controlled or uncontrolled conditions. 3. Identify and mobilize funding sources and industry partners a. FHWA Experimental Features Initiative b. Other state DOTs via a pooled fund study c. Individual local contractors d. Associated General Contractors e. Compactor manufacturer(s) 4. Integrate this program with local and national research and implementation initiatives 22
30 References Adam, D. Flächendeckende Dynamische Verdichtungskontrolle mit Vibrationswalzen. Ph.D. thesis. University of Vienna. Vienna, Austria, Anderegg, R. ACE Ammann Compaction Expert-Automatic Control of the Compaction. In Le Compactage des Sols et des Materiaux granulaires. Proc., Presses de l'ecole Nationale des Ponts et des Chaussees. Paris, 2, pp Anderegg, R. Automatic Compaction and Compaction Control on Asphalt and Earthwork. In Strassen und Tiefbau Nr. 1/2. Giesel Verlag. Isernhagen, Germany, 2, pp Anderegg, R. Nichtlineare Schwingungen bei dynamischen Boden verdichtern. VDI Fortschrittberichte, Reihe 4: Bauingenieurwesen Nr VDI Verlag GmbH, Düsseldorf, Germany, Anderegg, R., and K. Kaufmann. Automatically Controlled Single Drum Rollers and the Continuous Compaction Control [in German]. In Sonderdruck aus Strassen und Tiefbau Nr. 7-8 and 9/22. Giesel Verlag, Isernhagen, Germany, 22, pp Briaud J.-L., 21, Introduction to Soil Moduli, Geotechnical News, June 21, BiTech Publishers Ltd, Richmond, B.C., Canada DeBeer, M. 1991, Use of the Dynamic Cone Penetrometer (DCP) in the Design of Road Structures. Proceedings of the tenth regional conference for Africa on Soil Mechanics & Foundation Engineering and the third International Conference on Tropical & Residual Soils. Maseru September Dobry, R., and G. Gazetas. Dynamic Response of Arbitrarily Shaped Foundations. Journal of Geotechnical Engineering, Vol. 12, No.2, 1986, pp Huang, Y. H. Pavement Analysis and Design. Prentice Hall, Upper Saddle River, N.J., Lundberg, G. Elastische Berührung Zweier Halbräume. In Forschung auf dem Gebiete dem Ingenieurwesens, VDI-Zeitschrift Band 1, Nr. 5. Berlin, 1939, pp Moon, F. C. Chaotic and Fractal Dynamics. John Wiley and Sons, New York, Odemark, N. Investigations as to the Elastic Properties of Soils and Design of Pavements according to the Theory of Elasticity. Ph.D. thesis. Statens Väginstitut, Mitteilung No. 77. Stockholm, Sweden, Ping, W. V., Z. Yang, and Z. Gao. Field and Laboratory Determination of Subgrade Moduli. Journal of 'Performance of Constructed Facilities, Vol. 16, No.4, 22, pp Richart, F. E., J. R. Hall, and R. D. Woods. Vibrations of Soils and Foundations. Prentice Hall, Englewood Cliffs, N.J., 197. Soils Manual, 5th ed. Asphalt Institute Manual Series No. 1 (MS-I). Asphalt Institute, Lexington, Ky., 1997, pp Thompson, J. M. T., and H. B. Stewart. Nonlinear Dynamics and Chaos. John Wiley and Sons, New York, 22. Wehrli, C., and R. Anderegg. Nonlinear Oscillations at Compacting Machines [in German]. Geotechnik Nr. 1/1998, Deutsche Gesellschaft für Geotechnik. Verlag Glückauf GmbH, Essen, Germany, 1998, pp White, D.J, E.J. Jaselskis, V.R. Schaefer, and E.T. Cackler. Real-Time Compaction Monitoring in Cohesive Soils from Machine Response, Transportation Research Board, 84rd Annual Meeting, January, 25, Washington, D.C. Wolf, J. P. Foundation Vibration Analysis Using Simple Physical Models. PTR Prentice Hall, Englewood Cliffs, N.J., Yoo, T.-S., and E. T. Selig. Dynamics of Vibratory-Roller Compaction. Journal of the Geotechnical Engineering Division, Vol. GT 1,1979, pp
31 MnDOT CCC Demonstration Figures

32 Figure 1 Demonstration Test Location at the MnROAD Site

33 Figure 2 Test Section Prior to Excavation

34 Figure 3 Partially Excavated Test Section


35 Railroad Ballast Offsite Loamy Sand over Railroad Ballast Onsite Loamy Sand Mn/DOT Class 6 Figure 4 Four Soils Used in the Demonstration

36 Figure 5 Concept of Stiffness and Modulus Determination from a Compactor Drum Vibration

37 Figure 6 BOMAG Compactor Used in the Demonstration

38 Figure 7 Schematic of BOMAG Variocontrol Technology for Continuous Compaction Control
39 Start Establish Target Establish Values Target Values Produce Surface Produce Covering Surface Documentation Covering Documentation Define Project Define on Project PC on PC Identify Locations Identify for Locations QC/QA for Tests QC/QA Tests Transfer to BOMAG Transfer to Compactor BOMAG Compactor Conduct QC/QA Conduct Tests QC/QA Tests Conduct Compaction Conduct & Companion Compaction & Companion Tests Tests Transfer to Transfer MnDOT to MnDOT Transfer to Transfer PC to PC End Figure 8 Possible Sequence of Collecting Surface-Covering Compaction Documentation


40 Dynamic Cone Penetrometer Humboldt Geogauge Troxler 343 Nuclear Density Gauge Plate Load Test Equipment Loadman Figure 9 Photos of Companion Testing Devices
41 Figure 1 Typical Plate Load Test Load-Deflection Data

42 Figure 11 Demonstration Site Cross Section
43 Figure 12 Demonstration Site Plan View

44 Figure 13 Example of Surface-Covering Compaction Documentation
45 Modulus (MPa) Track Length (m) Figure 14 Example of Exported Data From BCMWin, with Companion Test Points Highlighted
46 Figure 15 Demonstration Site Isometric View
47 Figure 16 DCP Modulus for All Tests
48 Modulus (MPa) Depth Limit (inches) Figure 17 DCP Modulus Values as a Function of Depth Limit
49 Dry Density Determined by Nuclear Gauge (pcf) Dry Density Determined by Sand Cone (pcf) Figure 18 Companion Density Tests
50 Location 22 Location Frequency Frequency Plate Load Modulus (MPa) Plate Load Modulus (MPa) Figure 19 Plate Load Test Values for All Reload Cycles
51 BOMAG Compactor Loadman Evib Normal Distribution Elwd Normal Distribution GeoGauge Dynamic Cone Penetrometer Egg Normal Distribution Edcp Normal Distribution Figure 2 Distribution of Young s Modulus for Four Principal Test Methods
52 BOMAG Compactor Loadman Evib Lognormal Distribution Elwd Lognormal Distribution GeoGauge Dynamic Cone Penetrometer Egg Lognormal Distribution Edcp Lognormal Distribution Figure 21 Distribution of Young s Modulus for Four Principal Test Methods (compared to lognormal distribution)
53 Modulus (MPa) All Data Evib (MPa) LWD GeoGauge DCP Plate Load Modulus (MPa) Loadman Evib (MPa) LWD Modulus (MPa) GeoGauge Evib (MPa) Modulus (MPa) Dynamic Cone Penetrometer Evib (MPa) GeoGauge Figure 22 DCP Comparisons Between the BOMAG Data and Other Methods
54 Evib (MPa) y = -.66x R 2 = Loadman Modulus (MPa) y = -.18x R 2 = GeoGauge Modulus (MPa) GeoGauge Modulus (MPa) All Soils All Soils DCP Modulus (MPa) y =.42x R 2 =.18 DCP Modulus (MPa) y =.39x R 2 = GeoGauge Modulus (MPa) GeoGauge Modulus (MPa) All Soils All Soils Figure 23 GeoGauge Test Comparison
55 Evib (MPa) y =.1492x R 2 = Loadman Modulus (MPa) y =.6587x R 2 = DCP Modulus (MPa) DCP Modulus (MPa) All Soils All Soils GeoGauge Modulus (MPa) y =.4279x R 2 = DCP Modulus (MPa) All Soils GeoGauge Modulus (MPa) y =.9281x R 2 = DCP Modulus (MPa) All Soils Figure 24 DCP Test Comparison
56 6 5 4 Load (lb) Displacement (inches) Figure 25 Load-Displacement Data for Plate Load Test, Location 22a
57 Compactor Modulus (MPa) " to 18" y =.3254x R 2 = Stress (kpa) Test#1 Test#2 Test#3 GeoGauge LWD Bomag FWD Figure 26 Stress Dependency of Modulus Measurements, Location 22
58 Compactor Modulus (MPa) " to 18" y =.475x R 2 = Stress (kpa) Test#1 Test#2 Test#3 GeoGauge LWD Bomag FWD Figure 27 Stress Dependency of Modulus Measurements, Location 23
59 Moisture Content (%) Test Number Sand Cone MC Nuclear MC OMC-P#1 (SM/SL) OMC-P#2 (SP/S) OMC-P#3 (SM/SL) OMC-P#4 (SM/SL) OMC-P#5 (Class 6) Figure 28 Comparison of Optimum to As-Compacted Moisture Content
60 11% 15% Percent Compaction 1% 95% 9% Test Number Figure 29 Percent Compaction by Location
61 Evib Modulus (MPa) Difference in Measure d Moisture Content from Optim um (%) Loadman Modulus (MPa) Difference in Measure d Moisture Content from Optim um (%) SM/SL SP/S Class 6 SM/SL SP/S Class 6 GeoGauge Modulus (MPa) Difference in Measure d Moisture Content from Optim um (%) DCP Modulus (MPa) Difference in Measure d Moisture Content from Optim um (%) SM/SL SP/S Class 6 SM/SL SP/S Class 6 Figure 3 Comparison of In-Place to Optimum Moisture Content
62 Figure 31 As-Built Section with Selected Modulus Data
63 MnDOT CCC Demonstration Appendix A
64 Lane# Lane1 Lane2 Lane3 Lane4 Lane5 Lane6 9/27/24 9/27/24 9/27/24 9/27/24 9/27/24 9/28/24 9/28/24 9/29/24 9/29/24 9/29/24 9/3/24 Lift 1A Lift 1B Lift 2 Lift 3 Lift 4 Lift 5 Lift 6 Lift 7 Lift 8 Lift 9 Lift 1 SM, SL, 1 RB 1 SM, SL, 4 -, CL6 2, 5 -, CL6 2, 5 -, CL6 2, 5 -, CL6 2, 5 14,15,16 Yes Yes Yes Yes Yes SM, SL, 1 SM, SL, 1 RB 1 SM, SL, 1 SM, SL, 1 RB 1 SM, SL, 4 -, CL6 2, 5 -, CL6 2, 5 -, CL6 2, 5 -, CL6 2, 5 1,2 9,1 2,21,22,23 Yes Yes Yes Yes Yes Yes Yes Yes Yes Yes Yes Yes SM, SL, 1 RB 1 SM, SL, 1 SM, SL, 1 RB 1 SM, SL, 4 -, CL6 2, 5 -, CL6 2, 5 -, CL6 2, 5 -, CL6 2, 5 Yes Yes Yes Yes Yes Yes Yes Yes Yes Yes Yes SM, SL, 1 SM, SL, 1 SM, SL, 1 RB 1 SM, SL, 4 -, CL6 2, 5 -, CL6 2, 5 -, CL6 2, 5 -, CL6 2, 5 Yes Yes Yes Yes Yes Yes Yes Yes Yes SM, SL, 1 SM, SL, 3/1 SM, SL, 1 RB 1 SM, SL, 4 -, CL6 2, 5 -, CL6 2, 5 -, CL6 2, 5 -, CL6 2, 5 3,4,5,6 7,8 11,12,13 Yes Yes Yes Yes Yes Yes Yes Yes -, CL6 2, 5 -, CL6 2, 5 -, CL6 2, 5 17,18,19 Yes Legend Date Lift # ASTM Soil Type, MnDOT Soil Type, Proctor Number Test Numbers Paper Record of Bomag Data Electronic Record of Bomag Data Note: Shading indicates that soil was placed in the coresponding Lane and Lift 1. RB = Railroad Ballast 2. CL6 = Class 6 Figure A.1 Guide
65 Lane 5 Figure A.2 BOMAG Paper Strips Lift 1A Lane 5
66 Lane 5 Lane 4 Lane 3 Lane 2 Figure A.3 BOMAG Paper Strips Lift 1B Lane 2-5
67 Lane 5 Lane 4 Figure A.4 BOMAG Paper Strips Lift 2 Lane 4-5
68 Lane 5 Lane 4 Lane 3 Lane 2 Figure A.5 BOMAG Paper Strips Lift 3 Lane 2-5
69 Lane 5 Lane 4 Lane 3 Lane 2 Figure A.6 BOMAG Paper Strips Lift 4 Lane 2-5
70 Lane 6 Lane 5 Lane 4 Lane 3 Lane 2 Figure A.7 BOMAG Paper Strips Lift 5 Lane 2-6
71 Lane 6 Lane 5 Lane 4 Lane 3 Lane 2 Figure A.8 BOMAG Paper Strips Lift 6 Lane 2-6
72 Lane 6 Lane 5 Lane 4 Lane 3 Lane 2 Lane 1 Figure A.9 BOMAG Paper Strips Lift 8 Lane 1-6
73 Figure A.1 BOMAG Electronic Record Lift 1B Lane 2
74 Figure A.11 BOMAG Electronic Record Lift 1B Lane 3
75 Figure A.12 BOMAG Electronic Record Lift 1B Lane 4
76 Figure A.13 BOMAG Electronic Record Lift 1B Lane 5
77 Figure A.14 BOMAG Electronic Record Lift 2 Lane 4
78 Figure A.15 BOMAG Electronic Record Lift 2 Lane 5
79 Figure A.16 BOMAG Electronic Record Lift 3 Lane 2
80 Figure A.17 BOMAG Electronic Record Lift 3 Lane 3
81 Figure A.18 BOMAG Electronic Record Lift 3 Lane 4
82 Figure A.19 BOMAG Electronic Record Lift 3 Lane 5
83 Figure A.2 BOMAG Electronic Record Lift 4 Lane 2
84 Figure A.21 BOMAG Electronic Record Lift 4 Lane 3
85 Figure A.22 BOMAG Electronic Record Lift 4 Lane 4
86 Figure A.23 BOMAG Electronic Record Lift 4 Lane 5
87 Figure A.24 BOMAG Electronic Record Lift 4 Lane 6

88 Figure A.25 BOMAG Electronic Record Lift 5 Lane 3
89 Figure A.26 BOMAG Electronic Record Lift 5 Lane 4
90 Figure A.27 BOMAG Electronic Record Lift 5 Lane 5
91 Figure A.28 BOMAG Electronic Record Lift 5 Lane 6
92 MnDOT CCC Demonstration Appendix B
93 Test Location 1 Depth (in) Modulus (MPa) Depth (mm) DCP EVIB(paper) EVIB(elec) GeoGauge Figure B.1 DCP at Test Location 1
94 Test Location 2 Depth (in) Modulus (MPa) Depth (mm) DCP EVIB(paper) EVIB(elec) GeoGauge Figure B.2 DCP at Test Location 2
95 Test Location 3 Depth (in) Modulus (MPa) Depth (mm) DCP EVIB(paper) EVIB(elec) GeoGauge Figure B.3 DCP at Test Location 3
96 Test Location 4 Depth (in) Modulus (MPa) Depth (mm) DCP EVIB(paper) EVIB(elec) GeoGauge Figure B.4 DCP at Test Location 4
97 Test Location 5 Depth (in) Modulus (MPa) Depth (mm) DCP EVIB(paper) EVIB(elec) GeoGauge Figure B.5 DCP at Test Location 5
98 Test Location 6 Depth (in) Modulus (MPa) Depth (mm) DCP EVIB(paper) EVIB(elec) GeoGauge Figure B.6 DCP at Test Location 6
99 Test Location 7 Depth (in) Modulus (MPa) ` Depth (mm) DCP EVIB(paper) EVIB(elec) GeoGauge Figure B.7 DCP at Test Location 7
100 Test Location 8 Depth (in) Modulus (MPa) Depth (mm) DCP EVIB(paper) EVIB(elec) GeoGauge Figure B.8 DCP at Test Location 8
101 Test Location 9 Depth (in) Modulus (MPa) Depth (mm) DCP EVIB(paper) EVIB(elec) GeoGauge Figure B.9 DCP at Test Location 9
102 Te st Location 1 Depth (in) Modulus (MPa) Depth (mm) DCP EVIB(paper) EVIB(elec) GeoGauge Figure B.1 DCP at Test Location 1
103 Test Location 11 Modulus (MPa) Depth (in) Depth (mm) DCP EVIB(paper) Figure EVIB(elec) B.11 GeoGauge DCP at Test Location 11
104 Test Location 12 Modulus (MPa) Depth (in) Depth (mm) DCP EVIB( paper) Figure EVIB(ele B.12 c) GeoGauge DCP at Test Location 12
105 Test Location 13 Modulus (MPa) Depth (in) Depth (mm) DCP EVIB( paper) Figure EVIB(ele B.13 c) GeoGauge DCP at Test Location 13
106 Test Location 14 Modulus (MPa) Depth (in) Depth (mm) DCP EVIB( paper) Figure EVIB(ele B.14 c) GeoGauge DCP at Test Location 14
107 Test Location 15 Modulus (MPa) Depth (in) Depth (mm) DCP EVIB( paper) Figure EVIB(ele B.15 c) GeoGauge DCP at Test Location 15
108 Test Location 16 Modulus (MPa) Depth (in) DCP EVIB( paper) Figure EVIB(ele B.16 c) DCP at Test Location 16 GeoGauge Depth (mm)
109 Te st Location 17 Depth (in) Modulus (MPa) Depth (mm) DCP EVIB(paper) EVIB(elec) GeoGauge Figure B.17 DCP at Test Location 17
110 Test Location 18 Modulus (MPa) Depth (in) Depth (mm) DCP EVIB( paper) EVIB(ele c) GeoGauge Figure B.18 DCP at Test Location 18
111 Test Location 19 Modulus (MPa) Depth (in) Depth (mm) DCP EVIB( paper) EVIB(ele c) GeoGauge Figure B.19 DCP at Test Location 19
112 Test Location 2 Modulus (MPa) Depth (in) Depth (mm) DCP EVIB( paper) EVIB(ele c) GeoGauge Figure B.2 DCP at Test Location 2
113 Test Location 21 Modulus (MPa) Depth (in) Depth (mm) DCP EVIB( paper) EVIB(ele c) GeoGauge Figure B.21 DCP at Test Location 21
114 Test Location 22 Modulus (MPa) Depth (in) Depth (mm) DCP EVIB( paper) Figure EVIB(ele B.22 c) GeoGauge DCP at Test Location 22
115 Test Location 23 Modulus (MPa) Depth (in) Depth (mm) DCP EVIB( paper) Figure EVIB(ele B.23 c) GeoGauge DCP at Test Location 23
116 MnDOT CCC Demonstration Appendix C

117
118
119
120
121
122
123
124
125
126
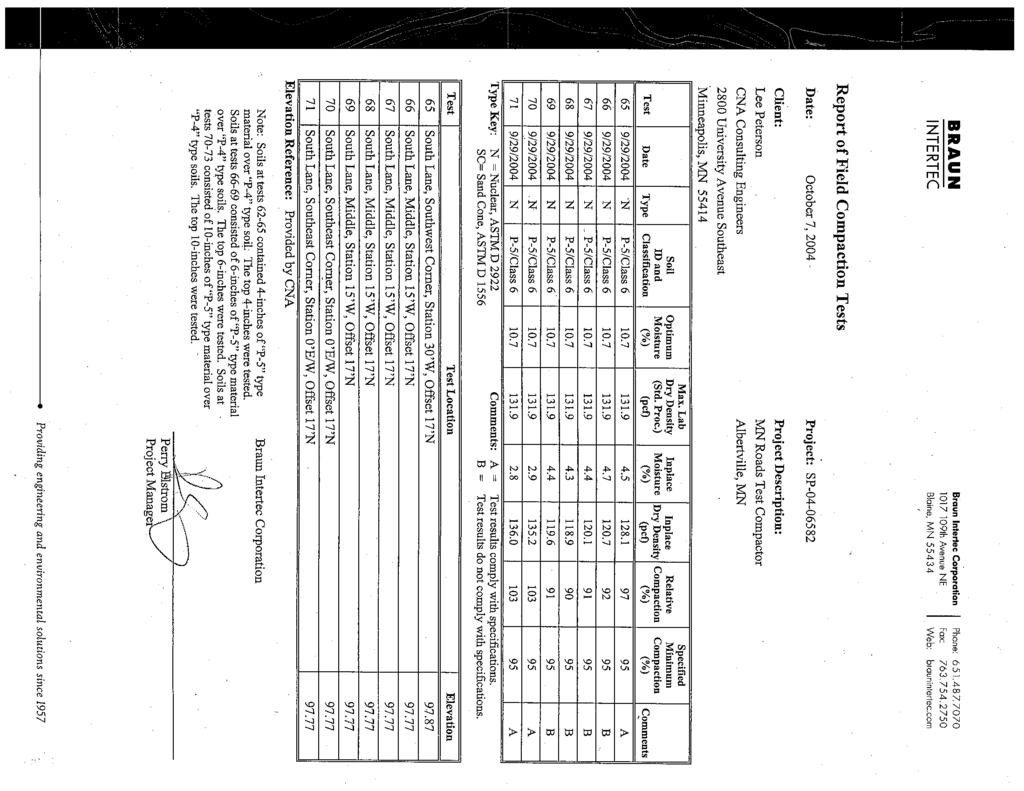
127
128

129
Arizona Pavements and Materials Conference Phoenix, Arizona. November 15-16, John Siekmeier P.E. M.ASCE
 Arizona Pavements and Materials Conference Phoenix, Arizona November 15-16, 2017 John Siekmeier P.E. M.ASCE Minnesota DOT Districts and Local Agencies Other State DOTs, FHWA and NCHRP Contractors and Manufacturers
2012 Road School Light Weight Deflectometer (LWD)
") 2012 Road School Light Weight Deflectometer (LWD) Nayyar Siddiki, M.S., P.E. Office of Geotechnical Services Outline Testing for Compaction NO 53 and chemically modified soils (Special Prov.) Changing
2012 Road School Light Weight Deflectometer (LWD) Nayyar Siddiki, M.S., P.E. Office of Geotechnical Services Outline Testing for Compaction NO 53 and chemically modified soils (Special Prov.) Changing
EVALUATION OF DYNAMIC METHODS FOR EARTHWORK ASSESSMENT
 Vol. 11, Issue 1/, 38-44 DOI:./cee--000 EVALUATION OF DYNAMIC METHODS FOR EARTHWORK ASSESSMENT Jozef VLČEK 1,*, Dominika ĎUREKOVÁ 2, Katarína ZGÚTOVÁ 2 1 Department of Geotechnics, Faculty of Civil Engineering,
TRB Webinar: Estimating Stiffness of Subgrade and Unbound Materials for Pavement Design
 TRB Webinar: Estimating Stiffness of Subgrade and Unbound Materials for Pavement Design Today s Presenters and Moderator Nancy Whiting, Purdue University, whiting@purdue.edu Richard Boudreau, Boudreau
Evaluating Structural Performance of Base/Subbase Materials at the Louisiana Accelerated Pavement Research Facility
 Evaluating Structural Performance of Base/Subbase Materials at the Louisiana Accelerated Pavement Research Facility Zhong Wu, Ph.D., P.E. Zhongjie Zhang, Bill King Louay Mohammad Outline Background Objectives
1 MPa = 150 psi 10 kn = 1 ton 25 mm = 1 inch
 INTELLIGENT COMPACTION: AN OVERVIEW Developed by Jean-Louis Briaud Department of Civil Engineering Texas A&M University Presented to the 5 th Idaho Asphalt Conference, October 27, 5 By Fouad Bayomy Department
Impact of Water on the Structural Performance of Pavements
 Impact of Water on the Structural Performance of Pavements S. Erlingsson Highway Engineering, VTI The Swedish National Road and Transport Research Institute, Linköping, Sweden & Faculty of Civil and Environmental
Flexible Pavement Design
 Flexible Pavement Design The Mechanistic-Empirical Way Presented by: Keith D. Herbold, P.E. 1 Presentation Outline What s new in flexible design Example of new design Differences Capabilities Tests and
METHODS FOR EVALUATING RESILIENT MODULI OF PAVING MATERIALS
 Project Number ST 2019-7 Summary Report METHODS FOR EVALUATING RESILIENT MODULI OF PAVING MATERIALS sponsored by The State of Alabama Highway Department Montgomery, Alabama Frazier Parker, Jr. David J.
Falling Weight Deflectometer vs Laboratory Determined Resilient Modulus (Slab Curling Study)
") FWD-RU6701 Falling Weight Deflectometer vs Laboratory Determined Resilient Modulus (Slab Curling Study) FINAL REPORT December 2005 Submitted by Dr. Sameh Zaghloul, P.E., P.Eng.* Managing Senior Principal
FWD-RU6701 Falling Weight Deflectometer vs Laboratory Determined Resilient Modulus (Slab Curling Study) FINAL REPORT December 2005 Submitted by Dr. Sameh Zaghloul, P.E., P.Eng.* Managing Senior Principal
FDOT No: C-7984 UF No: Research Team:
 Draft Final Report April 2005 EVALUATING THICK LIFT LIMEROCK-BASE COURSE SR-826 MIAMI FLORIDA FDOT No: C-7984 UF No: 00030917 Research Team: Dr.Sastry Putcha, Project Manager, State Construction Office
15. Supplementary Notes Conducted in Cooperation with the U.S. Department of Transportation, Federal Highway Administration
 FHWA/LA/406 4. Title and Subtitle Development of Models to Estimate the Subgrade and Subbase Layers Resilient Modulus from In situ Devices Test Results for Construction Control 7. Author(s) Louay N. Mohammad,
Revised Test Plan for Seasonal Monitoring Program using HWD Testing
 April 2005 Revised Test Plan for Seasonal Monitoring Program using HWD Testing Partnered Pavement Research Prepared for: California Department of Transportation Prepared by: University of California Berkeley
Unbound Pavement Applications of Excess Foundry System Sands: Subbase/Base Material
 Unbound Pavement Applications of Excess Foundry System Sands: Subbase/Base Material Tuncer B. Edil University of Wisconsin-Madison Recycled Materials Resource Center RMRC Participant Job Description Which
Evaluation of In-Situ Resilient Modulus Testing Techniques
 Evaluation of In-Situ Resilient Modulus Testing Techniques Dar-Hao Chen, 1 Wei Wu, 1 Rong He, 2 John Bilyeu 2 and Mike Arrelano 2 Abstract A series of field experiments has been conducted to evaluate various
SECTION AGGREGATE OR GRANULAR SUBBASE
 SECTION 02230 AGGREGATE OR GRANULAR SUBBASE PART 1 GENERAL 1.01 SECTION INCLUDES A. Aggregate or granular subbase as shown on the drawings. 1.02 RELATED SECTIONS A. Section 01400 Quality Requirements.
Implementation of Intelligent Compaction Performance Based Specifications in Minnesota
 29-14 Implementation of Intelligent Compaction Performance Based Specifications in Minnesota Take the steps... Research...Knowledge...Innovative Solutions! Transportation Research Technical Report Documentation
Development and Validation of Mechanistic-Empirical Design Method for Permeable Interlocking Concrete Pavement
 Development and Validation of Mechanistic-Empirical Design Method for Permeable Interlocking Concrete Pavement Hui Li, David Jones, Rongzong Wu, and John Harvey University of California Pavement Research
2015 North Dakota Asphalt Conference
 2015 North Dakota Asphalt Conference NDDOT Implementation of AASHTO Flexible Pavement Design Part I ADT & ESALs Nickie Reis, P&AM Part II Structural Numbers Tom Bold, M&R March 31 - April 1, 2015 Part
ACCELERATED IMPLEMENTATION OF INTELLIGENT COMPACTION TECHNOLOGY
 ACCELERATED IMPLEMENTATION OF INTELLIGENT COMPACTION TECHNOLOGY FOR EMBANKMENT SUBGRADE SOILS, AGGREGATE BASE, AND ASPHALT PAVEMENT MATERIALS Draft Final Report Texas DOT FM6 Field Project July 2 to, 28
Modulus of Rubblized Concrete from Surface Wave Testing
 from Surface Wave Testing Nenad Gucunski Center for Advanced Infrastructure and Transportation (CAIT) Infrastructure Condition Monitoring Program (ICMP) 84 th Annual NESMEA Conference October 8, 2008 Route
MECHANISTIC-EMPIRICAL LOAD EQUIVALENCIES USING WEIGH IN MOTION
 MECHANISTIC-EMPIRICAL LOAD EQUIVALENCIES USING WEIGH IN MOTION Prepared By: Curtis Berthelot Ph.D., P.Eng. Dept. of Civil Engineering University of Saskatchewan Tanya Loewen Dept. of Civil Engineering
Mechanistic Investigation of Granular Base and Subbase Materials A Saskatchewan Case Study
 Mechanistic Investigation of Granular Base and Subbase Materials A Saskatchewan Case Study Curtis Berthelot, P. Eng. Department of Civil and Geological Engineering University of Saskatchewan 57 Campus
CHARACTERIZATION OF A TWO-LAYER SOIL SYSTEM USING A LIGHTWEIGHT DEFLECTOMETER WITH RADIAL SENSORS Paper #
 1 2 3 4 5 6 7 8 9 10 11 12 13 14 15 16 17 18 19 20 21 22 23 24 25 26 27 28 29 30 31 32 33 34 35 36 37 38 39 40 41 42 43 44 45 CHARACTERIZATION OF A TWO-LAYER SOIL SYSTEM USING A LIGHTWEIGHT DEFLECTOMETER
Track stiffness assessment. Abstract
 Track stiffness assessment Alain Robinet, Engineering Department, SNCF, France Email: alain.robinet@sncf.fr Mohsen Hosseingholian, Civil Engineering Department, University of Caen, France Email: mhosseingholian@yahoo.com
Laboratory evaluation of in-situ tests as potential quality control/quality assurance tools
 Louisiana State University LSU Digital Commons LSU Master's Theses Graduate School 2003 Laboratory evaluation of in-situ tests as potential quality control/quality assurance tools Ekrem Seyman Louisiana
Field & Laboratory Evaluation of the Portable Falling Weight Deflectometer (PFWD) NETC Project No. 00-4
 NETC Project No. 00-4") Field & Laboratory Evaluation of the Portable Falling Weight Deflectometer (PFWD) NETC Project No. 00-4 Principal Investigators: Dana N. Humphrey, Ph.D., P.E. Professor & Chairperson, Department of Civil
Field & Laboratory Evaluation of the Portable Falling Weight Deflectometer (PFWD) NETC Project No. 00-4 Principal Investigators: Dana N. Humphrey, Ph.D., P.E. Professor & Chairperson, Department of Civil
Evaluating Structural Performance of Base/Subbase Materials at the Louisiana Accelerated Pavement Research Facility
 Evaluating Structural Performance of Base/Subbase Materials at the Louisiana Accelerated Pavement Research Facility Zhong Wu, Ph.D., P.E. Louisiana Transportation Research Center 2007 Transportation Engineering
Mechanistic-Empirical Pavement Design Guide: A User s Perspective. Brian D. Prowell, Ph.D., P.E.
 Mechanistic-Empirical Pavement Design Guide: A User s Perspective Brian D. Prowell, Ph.D., P.E. Empirical Approach Based on results of experiments or experience Scientific basis not established AASHTO
SYSTEMATIC EVALUATION OF RUN OFF ROAD CRASH LOCATIONS IN WISCONSIN FINAL REPORT
 SYSTEMATIC EVALUATION OF RUN OFF ROAD CRASH LOCATIONS IN WISCONSIN FINAL REPORT DECEMBER 2004 DISCLAIMER This research was funded by the Wisconsin Department of Transportation. The contents of this report
Development of resilient modulus prediction models for base and subgrade pavement layers from in situ devices test results
 Louisiana State University LSU Digital Commons LSU Master's Theses Graduate School 2004 Development of resilient modulus prediction models for base and subgrade pavement layers from in situ devices test
Developing an Economical and Reliable Test for Measuring the Resilient Modulus and Poisson s Ratio of Subgrade
 Ohio Transportation Consortium Project Report Developing an Economical and Reliable Test for Measuring the Resilient Modulus and Poisson s Ratio of Subgrade Rulan Hu, Graduate Student, and David Zeng,
Statewide Statistical Subgrade Characterization
 MN DEPT l RAlJSP TA Numbe Report9516 95" ý10 3 0314 00023 6942 DISTRICT: 4 HIGHWAY: 210 Numberof datai rtm Period 8/ 7/84 to 9/2918 M.an ModuOs 203/204 WIt Sfdard Deviation 112/123 MP S48 MRN& a 25 percntle
GEOSYNTHETICS ENGINEERING: IN THEORY AND PRACTICE
 GEOSYNTHETICS ENGINEERING: IN THEORY AND PRACTICE Prof. J. N. Mandal Department of civil engineering, IIT Bombay, Powai, Mumbai 400076, India. Tel.022-25767328 email: cejnm@civil.iitb.ac.in Module-5 LECTURE-
Mechanical Response of a Composite Steel, Concrete- Filled Pile
 Mechanical Response of a Composite Steel, Concrete- Filled Pile Joseph Labuz, Principal Investigator Department of Civil, Environmental, and Geo- Engineering University of Minnesota June 2018 Research
Evaluation of mechanistic-based compaction measurements for earthwork QC/QA
 Graduate Theses and Dissertations Graduate College 21 Evaluation of mechanistic-based compaction measurements for earthwork QC/QA Jiake Zhang Iowa State University Follow this and additional works at:
REAL-TIME DENSITY MEASUREMENT USING COMPACTOR VIBRATORY RESPONSES
 REAL-TIME DENSITY MEASUREMENT USING COMPACTOR VIBRATORY RESPONSES by R. Edward Minchin Jr., PE Instructor, The Pennsylvania State University H. Randolph Thomas Jr., PhD, PE Professor, The Pennsylvania
UTC ETT160. Incorporation of Hands-on Experiments in an Introductory Structural Analysis Course
 Incorporation of Hands-on Experiments in an Introductory Structural Analysis Course By John J. Myers, Ph.D., P.E. Trevor Hrynyk Ashraf Ayoub, Ph.D., P.E. Abdeldjelil Belarbi, Ph.D., P.E. William Schonberg,
NJDOT RESEARCH PROJECT MANAGER: Mr. Anthony Chmiel
 Project Title: RFP NUMBER: CAIT NJDOT Bureau of Research QUARTERLY PROGRESS REPORT Evaluation of Poisson s Ratio NJDOT RESEARCH PROJECT MANAGER: Mr. Anthony Chmiel TASK ORDER NUMBER/Study Number: Task
Effect of tire type on strains occurring in asphalt concrete layers
 Effect of tire type on strains occurring in asphalt concrete layers Grellet D., Doré G., & Bilodeau J.-P. Department of Civil Engineering, Laval University, Québec, Canada ABSTRACT: The three main causes
NEW DOWN-HOLE PENETROMETER (DHP-CIGMAT) FOR CONSTRUCTION APPLICATIONS
 FOR CONSTRUCTION APPLICATIONS") NEW DOWN-HOLE PENETROMETER (DHP-CIGMAT) FOR CONSTRUCTION APPLICATIONS 1 2 C. Vipulanandan 1, Ph.D., M. ASCE and Omer F. Usluogullari 2 Chairman, Professor, Director of Center for Innovative Grouting Materials
NEW DOWN-HOLE PENETROMETER (DHP-CIGMAT) FOR CONSTRUCTION APPLICATIONS 1 2 C. Vipulanandan 1, Ph.D., M. ASCE and Omer F. Usluogullari 2 Chairman, Professor, Director of Center for Innovative Grouting Materials
Application of DCP in Prediction of Resilient Modulus of Subgrade Soils
 Application of DCP in Prediction of Resilient Modulus of Subgrade Soils Louay Mohammad, Ph.D. Louisiana Transportation Research Center Louisiana State University 2006 Pavement Performance Seminar April
Numerical Simulation of Intelligent Compaction Technology for Construction Quality Control
 CAIT-UTC-029 Numerical Simulation of Intelligent Compaction Technology for Construction Quality Control Final Report December 2014 Cesar Carrasco Professor and Department Chair of Civil Engineering University
The Development of a Performance Specification for Granular Base and Subbase Material
 FHWA-NJ-2005-003 The Development of a Performance Specification for Granular Base and Subbase Material FINAL REPORT Mr. Thomas Bennert* Research Engineer Submitted by Dr. Ali Maher* Professor and Chairman
SENSITIVITY ANALYSIS OF THE VESYS PROGRAM TO PREDICT CRITICAL PAVEMENT RESPONSES FOR RUTTING AND FATIGUE PERFORMANCES OF PAVEMENT INFRASTRUCTURES
 SENSITIVITY ANALYSIS OF THE VESYS PROGRAM TO PREDICT CRITICAL PAVEMENT RESPONSES FOR RUTTING AND FATIGUE PERFORMANCES OF PAVEMENT INFRASTRUCTURES Ghazi G. Al-Khateeb 1, Raghu Satyanarayana 2, and Katherine
Performance Specification for Geogrid Reinforced Aggregate Base
 Performance Specification for Geogrid Reinforced Aggregate Base John Siekmeier, Principal Investigator Office of Materials and Road Research Minnesota Department of Transportation October 2018 Research
Development of a Quick Reliability Method for Mechanistic-Empirical Asphalt Pavement Design
 Tanquist 1 Development of a Quick Reliability Method for Mechanistic-Empirical Asphalt Pavement Design Submission date: August 1, 2001 Word Count: 4654 Bruce A. Tanquist Research Project Engineer Minnesota
 www.novotechsoftware.com The standard penetration test (SPT) is an in-situ dynamic penetration test designed to provide information on the geotechnical engineering properties of soil. The test procedure
Prediction and Prevention of Tripped Rollovers
 Prediction and Prevention of Tripped Rollovers Final Report Prepared by: Gridsada Phanomchoeng Rajesh Rajamani Department of Mechanical Engineering University of Minnesota CTS 12-33 Technical Report Documentation
Accelerated Loading Evaluation of Base & Sub-base Layers
 Accelerated Loading Evaluation of Base & Sub-base Layers Zhong Wu, Ph.D., P.E. Louisiana Transportation Research Center (LTRC) April 2006 What is Accelerated Loading? Accelerated loading refers to Accelerated
Determination of Resilient Modulus Model for Road-Base Material
 JOURNAL OF APPLIED SCIENCES RESEARCH ISSN: 1819-544X Published BY AENSI Publication EISSN: 1816-157X http://www.aensiweb.com/jasr 2017 January; 13(1): pages 10-16 Open Access Journal Determination of Resilient
Computational Simulation of Dynamic Response of Vehicle Tatra T815 and the Ground
 IOP Conference Series: Earth and Environmental Science PAPER OPEN ACCESS Computational Simulation of Dynamic Response of Vehicle Tatra T815 and the Ground To cite this article: Jozef Vlek and Veronika
Nondestructive Evaluation of Thickness and Bearing Capacity of Roadway Pavement Structure
 Technical Paper ISSN 1997-1400 Int. J. Pavement Res. Technol. 3(6):326-335 Copyright @ Chinese Society of Pavement Engineering Nondestructive Evaluation of Thickness and Bearing Capacity of Roadway Pavement
DEVELOPMENT OF DROP WEIGHT IMPACT TEST MACHINE
 CHAPTER-8 DEVELOPMENT OF DROP WEIGHT IMPACT TEST MACHINE 8.1 Introduction The behavior of materials is different when they are subjected to dynamic loading [9]. The testing of materials under dynamic conditions
Performance and Control of the Agilent Nano Indenter DCM
 Performance and Control of the Agilent Nano Indenter DCM Application Note Introduction With new materials and material applications come new test challenges. As these new challenges emerge in materials
MAPPING THE RAINFALL EVENT FOR STORMWATER QUALITY CONTROL
 Report No. K-TRAN: KU-03-1 FINAL REPORT MAPPING THE RAINFALL EVENT FOR STORMWATER QUALITY CONTROL C. Bryan Young The University of Kansas Lawrence, Kansas JULY 2006 K-TRAN A COOPERATIVE TRANSPORTATION
Mechanistic Modeling of Unbound Granular Materials
 2009-21 Mechanistic Modeling of Unbound Granular Materials Take the steps... Research...Knowledge...Innovative Solutions! Transportation Research Technical Report Documentation Page 1. Report No. 2. 3.
What is on the Horizon in HMA. John D AngeloD Federal Highway Administration
 What is on the Horizon in HMA John D AngeloD Federal Highway Administration Are they all the same? Internal Angle of Gyration Internal Angle of Gyration Development of the Dynamic Angle Validator (DAV)
Of course the importance of these three problematics is affected by the local environmental conditions.
 SHRP METHOD/SUPERPAVE SYSTEM The Strategic Highway Research Program (SHRP) of the U.S. National Research Centre deals with, amongst other things, road construction and between 1987 and 1993 new classification
PILE-SUPPORTED RAFT FOUNDATION SYSTEM
 PILE-SUPPORTED RAFT FOUNDATION SYSTEM Emre Biringen, Bechtel Power Corporation, Frederick, Maryland, USA Mohab Sabry, Bechtel Power Corporation, Frederick, Maryland, USA Over the past decades, there has
Modulus-Based Construction Specification for Compaction of Earthwork and Unbound Aggregate: Appendices DRAFT FINAL REPORT.
 Modulus-Based Construction Specification for Compaction of Earthwork and Unbound Aggregate: Appendices DRAFT FINAL REPORT Prepared for National Cooperative Highway Research Program NCHRP Project 1-84 Transportation
Mechanistic Pavement Design
 Seminar on Pavement Design System and Pavement Performance Models Reykjavik, 22. 23. March, 2007 Mechanistic Pavement Design A Road to Enhanced Understanding of Pavement Performance Sigurdur Erlingsson
COMPARISON BETWEEN LABORATORY AND FIELD MEASURED RESILIENT MODULUS FOR FLEXIBLE PAVEMENT
 International Journal of Civil Engineering and Technology (IJCIET) Volume 9, Issue 10, October 2018, pp. 558 568, Article ID: IJCIET_09_10_057 Available online at http://www.iaeme.com/ijciet/issues.asp?jtype=ijciet&vtype=9&itype=10
Date: April 2, 2014 Project No.: Prepared For: Mr. Adam Kates CLASSIC COMMUNITIES 1068 E. Meadow Circle Palo Alto, California 94303
 City of Newark - 36120 Ruschin Drive Project Draft Initial Study/Mitigated Negative Declaration Appendix C: Geologic Information FirstCarbon Solutions H:\Client (PN-JN)\4554\45540001\ISMND\45540001 36120
ROAD DUST SUPPRESSSANTS RESEARCH RESULTS
 ROAD DUST SUPPRESSSANTS RESEARCH RESULTS Thomas G. Sanders 1 and Jonathan Q. Addo 2 1 Department of Civil and Environmental Engineering, Colorado State University, Fort Collins, CO 80525. 2 Project Engineer,
DRAFT. Evaluation of Joint Sealant Materials, US-36, Doniphan County, Kansas. Report No. FHWA-KS-08-2
 Report No. FHWA-KS-08-2 final REPORT Evaluation of Joint Sealant Materials, US-36, Doniphan County, Kansas Rodney A. Montney, P.E. Robert F. Heinen John Wojakowski, P.E. Kansas Department of Transportation
BioMechanics and BioMaterials Lab (BME 541) Experiment #5 Mechanical Prosperities of Biomaterials Tensile Test
 Experiment #5 Mechanical Prosperities of Biomaterials Tensile Test") BioMechanics and BioMaterials Lab (BME 541) Experiment #5 Mechanical Prosperities of Biomaterials Tensile Test Objectives 1. To be familiar with the material testing machine(810le4) and provide a practical
BioMechanics and BioMaterials Lab (BME 541) Experiment #5 Mechanical Prosperities of Biomaterials Tensile Test Objectives 1. To be familiar with the material testing machine(810le4) and provide a practical
ASPHALTIC CONCRETE EVALUATION FOR MECHANISTIC PAVEMENT DESIGN
 International Journal of Civil Engineering and Technology (IJCIET) Volume 9, Issue 8, August 2018, pp. 513 521, Article ID: IJCIET_09_08_049 Available online at http://www.iaeme.com/ijciet/issues.asp?jtype=ijciet&vtype=9&itype=8
VMS-GeoMil. Background
 Background When using a drilling rig for cone penetration testing, a mechanical clamp can be mounted to the drilling head (by means of a special transition piece). The depth than can be achieved depends
ALACPA-ICAO Seminar on PMS. Lima Peru, November 2003
 ALACPA-ICAO Seminar on PMS Lima Peru, 19-22 November 2003 Airport Pavements FWD/HWD Testing and Evaluation By: Frank B. Holt Vice President Dynatest International A/S Dynamic Testing The method of FWD/HWD
2002 Design Guide Preparing for Implementation
 2002 Preparing for Implementation By Monte Symons 2003 NCUAPG Annual Meeting Excerpts from the 2002 Guide Implementation Package 2002 Presentation Overview Need for NCHRP 1-37A - Status Guide Basics Asphalt
Quantifying Moisture Effects in DCP and LWD Tests Using Unsaturated Mechanics
 Quantifying Moisture Effects in DCP and LWD Tests Using Unsaturated Mechanics Kimberly Hill, Principal Investigator Department of Civil Engineering University of Minnesota February 2014 Research Project
Cone Penetration Test Design Guide for State Geotechnical Engineers
 Cone Penetration Test Design Guide for State Geotechnical Engineers Author: David Saftner Report Number: 2018-32 Date Published: November 2018 Minnesota Department of Transportation Research Services &
Mn/DOT Flexible Pavement Design Mechanistic-Empirical Method
 Mn/DOT Flexible Pavement Design Mechanistic-Empirical Method Pavement Design Systems and Pavement Performance Models March 22-23, 2007 - Reykjavik, Iceland Bruce Chadbourn Assistant Pavement Design Engineer
Experimental Device for Measuring Sandy Soil Sinkage Parameters
 Bull. Fac. Agr., Saga Univ. No Experimental Device for Measuring Sandy Soil Sinkage Parameters Nang Nguyen Van, Takaaki MATSUO, Tatsuya KOUMOTO * and Shigeki INABA ** (Laboratory of Agricultural Machinery,
Field Rutting Performance of Various Base/Subbase Materials under Two Types of Loading
 Field Rutting Performance of Various Base/Subbase Materials under Two Types of Loading Qiming Chen, Ph.D., P.E. (presenter) Murad Abu-Farsakh, Ph.D., P.E. Louisiana Transportation Research Center Apr.
9 Sampling. Safety. Sample References. Size of Original Samples. Sample Types
 9 Sampling Safety Sample References Size of Original Samples Sample Types Method of Sampling Production Sampling Load-Out Sampling Sampling Directly from Trucks, Rail Cars, or Barges Reducing a Sample
Nevels, et al 1 KAY COUNTY SHALE SUBGRADE STABILIZATION REVISITED
 Nevels, et al 1 Title: KAY COUNTY SHALE SUBGRADE STABILIZATION REVISITED Submitted: 15 November 2012 (revised) Word Count: 3581 + 7 figures = 5331 Name: Affiliation: Email: Joakim G. Laguros, Ph.D., P.E.
Inverted Pendulum System
 Introduction Inverted Pendulum System This lab experiment consists of two experimental procedures, each with sub parts. Experiment 1 is used to determine the system parameters needed to implement a controller.
Should you have any questions regarding this clarification, please contact the undersigned at or (925)
") October 8, 2015 Revised October 13, 2015 Contra Costa Community College District 500 Court Street Martinez, CA 94553 Attention: Ron Johnson Subject: Clarification of Grading Requirements Diablo Valley
October 8, 2015 Revised October 13, 2015 Contra Costa Community College District 500 Court Street Martinez, CA 94553 Attention: Ron Johnson Subject: Clarification of Grading Requirements Diablo Valley
Texas Transportation Institute The Texas A&M University System College Station, Texas
 1. Report No. FHWA/TX-03/4150-1 4. Title and Subtitle ANALYSIS OF TXDOT THICKNESS MEASUREMENT PROCEDURES FOR THERMOPLASTIC PAVEMENT MARKINGS Technical Report Documentation Page 2. Government Accession
Lecture 3: Stresses in Rigid Pavements
 Lecture 3: Stresses in Rigid Pavements Nature of Responses under Flexible and Rigid Plates Flexible plate: Uniform Contact Pressure Variable Deflection Profile Flexible Plate Rigid Plate plate: Non-Uniform
ATTACHMENT A PRELIMINARY GEOTECHNICAL SUMMARY
 ATTACHMENT A PRELIMINARY GEOTECHNICAL SUMMARY Kevin M. Martin, P.E. KMM Geotechnical Consultants, LLC 7 Marshall Road Hampstead, NH 0384 603-489-6 (p)/ 603-489-8 (f)/78-78-4084(m) kevinmartinpe@aol.com
B-1 BORE LOCATION PLAN. EXHIBIT Drawn By: 115G BROOKS VETERINARY CLINIC CITY BASE LANDING AND GOLIAD ROAD SAN ANTONIO, TEXAS.
 N B-1 SYMBOLS: Exploratory Boring Location Project Mngr: BORE LOCATION PLAN Project No. GK EXHIBIT Drawn By: 115G1063.02 GK Scale: Checked By: 1045 Central Parkway North, Suite 103 San Antonio, Texas 78232
In Association With. Introduces. TPT Contractor
 In Association With Introduces TPT Contractor Software for Contractors with TENSIONMETERS Table of Contents Capabilities 4 Setup and Use 7 The Dashboard 12 Tower Setup Form 18 Field Calibration Verification
Field evaluation of in-situ test technology for QC/ QA during construction of pavement layers and embankments
 Louisiana State University LSU Digital Commons LSU Master's Theses Graduate School 2003 Field evaluation of in-situ test technology for QC/ QA during construction of pavement layers and embankments Munir
product manual H-3220A Benkelman Beam
 05.12 product manual H-3220A Benkelman Beam General The H-3220A Benkelman Beam Apparatus is a convenient and accurate device used for measuring the deflection of flexible pavements under moving wheel
APPENDIX F CORRELATION EQUATIONS. F 1 In-Situ Tests
 APPENDIX F 1 APPENDIX F CORRELATION EQUATIONS F 1 In-Situ Tests 1. SPT (1) Sand (Hatanaka and Uchida, 1996), = effective vertical stress = effective friction angle = atmosphere pressure (Shmertmann, 1975)
Flexible Pavement Analysis Considering Temperature Profile and Anisotropy Behavior in Hot Mix Ashalt Layer
 Open Journal of Civil ngineering, 2011, 1, 7-12 doi:10.4236/ojce.2011.12002 Published Online December 2011 (http://www.scirp.org/journal/ojce) Flexible Pavement Analysis Considering Temperature Profile
ACCELERATED IMPLEMENTATION OF INTELLIGENT COMPACTION TECHNOLOGY
 ACCELERATED IMPLEMENTATION OF INTELLIGENT COMPACTION TECHNOLOGY FOR EMBANKMENT SUBGRADE SOILS, AGGREGATE BASE, AND ASPHALT PAVEMENT MATERIALS: SR-25 WEST LAFAYETTE, INDIANA Final Report SR-25, IN Field
17 th Annual Snow & Ice Symposium Columbus, OH. Snow & Ice Management Association Copyright 2014 SALT BRINE & SNOW AND ICE CONTROL.
 SALT BRINE & SNOW AND ICE CONTROL Agenda Goals and Objectives Storm Management Surface Temperatures How Materials Work Liquids in S&I Control Brine Production Pre wetting Anti icing Building Blocks Clearly
Lesson 25. Static Pile Load Testing, O-cell, and Statnamic. Reference Manual Chapter 18
 Lesson 25 Static Pile Load Testing, O-cell, and Statnamic Reference Manual Chapter 18 STATIC LOAD TESTING Most accurate method to determine static pile capacity Perform at design or construction stage
Evaluation of Rutting Depth in Flexible Pavements by Using Finite Element Analysis and Local Empirical Model
 American Journal of Engineering and Applied Sciences, 2012, 5 (2), 163-169 ISSN: 1941-7020 2014 Abed and Al-Azzawi, This open access article is distributed under a Creative Commons Attribution (CC-BY)
20. Security Classif.(of this page) Unclassified
 Unclassified") 1. Report No. FHWA/TX-01/1863-2 4. Title and Subtitle USER S GUIDE FOR THE MODULUS TEMPERATURE CORRECTION PROGRAM (MTCP) Technical Report Documentation Page 2. Government Accession No. 3. Recipient's Catalog
1. Report No. FHWA/TX-01/1863-2 4. Title and Subtitle USER S GUIDE FOR THE MODULUS TEMPERATURE CORRECTION PROGRAM (MTCP) Technical Report Documentation Page 2. Government Accession No. 3. Recipient's Catalog
TARGET AND TOLERANCE STUDY FOR THE ANGLE OF GYRATION USED IN THE SUPERPAVE GYRATORY COMPACTOR (SGC) By
 By") TARGET AND TOLERANCE STUDY FOR THE ANGLE OF GYRATION USED IN THE SUPERPAVE GYRATORY COMPACTOR (SGC) By Ghazi Al-Khateeb Senior Research Engineer Asphalt Pavement Team Federal Highway Administration Turner-Fairbank
TARGET AND TOLERANCE STUDY FOR THE ANGLE OF GYRATION USED IN THE SUPERPAVE GYRATORY COMPACTOR (SGC) By Ghazi Al-Khateeb Senior Research Engineer Asphalt Pavement Team Federal Highway Administration Turner-Fairbank
Resilient modulus and segregation potential estimation from simplified laboratory procedure
 Resilient modulus and segregation potential estimation from simplified laboratory procedure Jean-Pascal Bilodeau, ing., Ph.D. Research engineer, department of civil engineering, Laval University Guy Doré,
7. Nondestructive measurement techniques and analysis tools
 7. Nondestructive measurement techniques and analysis tools Advanced Characterisation of Pavement and Soil Engineering Materials Loizos, Scarpas & Al-Qadi (eds) 2007 Taylor & Francis Group, London, ISBN
INCREASE IN PILE CAPACITY WITH TIME IN MISSOURI RIVER ALLUVIUM
 INCREASE IN PILE CAPACITY WITH TIME IN MISSOURI RIVER ALLUVIUM Paul J. Axtell Jacob W. Owen Scott D. Vollink U.S. Army Corps of Engineers U.S. Army Corps of Engineers U.S. Army Corps of Engineers Kansas
TECHNICAL PAPER INVESTIGATION INTO THE VALIDATION OF THE SHELL FATIGUE TRANSFER FUNCTION
 Authors: TECHNICAL PAPER INVESTIGATION INTO THE VALIDATION OF THE SHELL FATIGUE TRANSFER FUNCTION Anthony Stubbs (Presenter), BE(Hons), Masters student, University of Canterbury. aps49@student.canterbury.ac.nz.