Practical Rheology Section 3
|
|
|
- Iris Hampton
- 5 years ago
- Views:
Transcription
1 Practical Rheology Section 3 Calculating Flow Data Measurement of Extrudate Swell Applications of Rheological Data Solving Production Problems Through Understanding Flow Behavior Systems of Units
 5.")
2 CALCULATING FLOW DATA Some important assumptions are made in the analysis of flow in a capillary rheometer. Of these the most important are: 1. The flow is isothermal. 2. There is no slip at the capillary wall. 3. The melt is incompressible. 4. The flow pattern is constant through the die. ( Fully developed flow.) 5. Dissipation of energy at the die entrance, or due to chain uncoiling, is negligible. (See the next chapter.) 13.1 Basic Equations. The most common type of flow occurring in the processing of polymer melts is shear flow. In this type of flow, one may visualize that one layer of melt flows over another on application of a shearing force. The process is described by the relationship between two variables, the shear rate and the shear stress. The shear rate is usually designated by - 2 -
 required to cause one layer to flow over another at the required rate.")
3 the Greek letter gamma with a dot above the letter, that is, gamma dot or. Shear rate is given in reciprocal seconds (that is, in 1/sec or sec γ -1). The larger the number quoted the faster the material is being sheared or forced to flow. The shear stress, which is usually designated by the Greek letter τ, is the stress (i.e. the force per unit area) required to cause one layer to flow over another at the required rate. If the assumptions made above are considered to be valid then it may be shown that: τ = The Shear Stress at the Wall of the Die = PRc/2Lc, γ a,w = The Shear Rate = [4Q (3n*+1)] / [ πr3 c ( 4n*)] Where: n* = Δlog(RcP/2Lc) / Δlog(4Q/ΒR3 c) γ w = the shear rate at the wall of the die. τ = the shear stress. Q = the volumetric flow rate. P = the measured pressure. Rc = the die radius. Rb = the barrel radius Lc = the die length. Flow Curves. The expression for the shear rate at the wall of the die is rather cumbersome, so in practice it is just as useful to use the expression - 3 -
4 γ a,w = 4Q / πr3 c where, γ a,w is known as the apparent shear rate at the wall. It may be shown that, as with the true shear rate, there is a unique relationship (i.e. just one relationship) between shear stress and γ a,w and this simplified expression may be used for scale up work. Hence the flow curves provided by most laboratories are generally obtained by plotting τ or η (viscosity) against γ a,w. The wall of the tube is, however, simply a place at which the shear stress and shear rate may be calculated from knowledge of flow rates and pressures. The relationship between τ and γ a,w will, however, be independent of the position in the flow system and equally applicable to flow in other geometries such as slits. For this reason it is quite correct to plot τ against γ a,w without printing the subscripts. Occasionally shear rate is denoted by γ without the dot above it. This should not be encouraged since this symbol is widely used to indicate elastic shear strain. By plotting shear stress (Pa) against shear rate (1/sec) flow curves may be obtained. Viscosity (Pa-sec) is obtained by dividing shear stress by shear rate. Measuring γ A,W and τ Let the ram speed = S (measured in mm/s) and the barrel diameter = D (measured in mm). Then the volumetric flow rate Q = S (πd2 b/4) (Equation1). This is the same in both the barrel and the capillary. Now the apparent shear rate at wall is γ a,w = 4Q/ πr³c (Equation 2 ). Where Rc is the radius of the capillary in mm. Substituting equation 1 into equation 2 and simplifying we obtain: γ a,w = S D2 b / R³c = 4 S (R2 b / R3 c) The barrel diameter for the Kayeness capillary rheometer is 0.375, i.e mm. In this case the formula becomes: γ a,w = S / R³c when the capillary radius is in mm and the ram speed is in mm/s
5 Since the shear stress at the wall is given by τ = P Rc / 2Lc (Equation 4). Then, for a 20:1 L/D die, τ = P/80 (where P is the pressure at the entrance to the capillary.) Apparent Viscosity. By plotting shear stress (Pa) against shear rate (1/sec) flow curves may be obtained. Viscosity (Pa-sec) is obtained by dividing shear stress by shear rate. Dividing τ (the shear stress) by γ a,w (the apparent wall shear rate) then, a viscosity at a particular shear rate may be obtained from the Dynisco Polymer Test LCR7000 capillary rheometer from the expression: ηa = (τ / γ a,w) = [(P Rc / 2Lc)] / [ (S / R3 c)] = [P R4 c ] / [182.4 S Lc ] This is an apparent viscosity. In practice the word apparent is often omitted and the symbol η is used. As flow testing is performed over a range of conditions (temperatures and/or piston speeds), the variation of viscosity with temperature and rate of flow can be easily obtained by simple calculations. With the Dynisco Polymer Test rheometers, these calculations are performed automatically by a built-in microprocessor or connected computer and displayed in tabular or graphical form. Mold Filling Data. Shear flow data obtained from the capillary rheometer are available in material databases such as those maintained by Moldflow Ltd. The data is used in software designed predict how an injection mold will fill. For this purpose the effect of changing temperature at a constant shear rate is needed, together with values that show the effect of changing shear rate at a constant temperature. Tabulated Results. The figures in the following table were obtained when samples of nylon 6 (PA 6), produced by Akzo, - 5 -
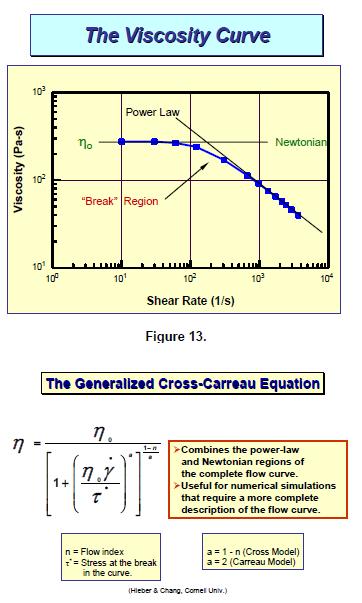
6 were tested. (Such results are typically obtained using a die with high L/D ratio, for example, 20:1) These figures clearly show that the three, injection-molding grades tested, have very different viscosities, with the first grade having the lowest, that is, it is the easiest flowing grade. It would be used where mold filling is difficult, or where long flow lengths are involved. The viscosities of all three materials fall as the shear rate is increased. Thus mold filling becomes easier at higher rates. Raising the melt temperature, while keeping the shear rate constant, reduces the viscosity and thus the amount of injection pressure required to maintain a certain rate of flow. The Power Law Equation In practice the slope of the log-log flow curve is not a straight line, as n* varies slightly with shear rate. However, for many purposes it may be assumed to be linear and is equated with a single value of n, the flow behavior index, or the flow index. Using this assumption the Power Law equations for flow are developed: τ = K γ n or η = K γ n-1 (Where n = n*) This equation works very well with PVC and is often used to describe its flow behavior
.) have developed and equations that fit many experimental viscosity curves very well.")
7 The Cross/Carreau Equation By combining the Newtonian and Power Law Equations with a function to describe the break in the viscosity curve (See Figure 13.) Cross and Carreau (Chiang, H., Hieber, C., and Wang, K., SPE ANTEC Technical Papers, Vol. XXXIV, pp (1988).) have developed and equations that fit many experimental viscosity curves very well. A combined form of these equations is shown in Figure 14. In this equation ηo is the zero shear rate or Newtonian viscosity for the particular polymer, n is its Power Law exponent, and τ is the shear stress at the break. These equations along with the Power Law and several others are resident in the LabKARS Rheology Software used with the Dynisco Polymer Test LCR Series of capillary rheometers Effect Of Temperature As can be seen in the data shown above and Figure 13 temperature significantly affects the viscosity of polymers. In general, viscosity decreases as the temperature is increased. Behavior contrary to this observation can usually be attributed to further reaction or cross-linking taking place in the material. The Ahhrenius Equation η = k e (E/RT) where: η = shear viscosity k = constant E = viscous energy of activation for the polymer (Kj / mole) T = the absolute temperature (in ok) R = gas constant ( J / ok mole) - 7 -
8 - 8 -
9 is usually used to describe the temperature dependency of polymers at temperatures in excess of 100 oc above their glass transition temperatures (Tg). For most polymers a plot of ln η vs. 1/T yields a straight line over a temperature range of oc. Thus if the viscosity of a polymer is known at temperature T2 and we can calculate its viscosity at a temperature T2 from the equation ln [η(t1) / η(t2)] = (E/R) [1/T1 1/T2] using the activation energies shown in the table below. EFFECT OF TEMPERATURE Activation Polymer Energy (Kj/mol) % Change in η/oc at Temp (oc) PET HDPE LDPE Nylon PP PC PMMA PVC The table above also shows the percentage of change in the viscosity that occurs when the temperature, which is close to the temperature shown to the right, is increased by 1 oc. In general, the linear form of a polymer has the lower activation energy. As one increases the side chain lengths the activation energies tend to rise. (Note that PVC is very sensitive to temperature.) The calculations shown above assume a constant shear rate. There are different activation energies if the measurements are made at constant shear stress. The relationship between the activation energies at constant rate and constant stress can be shown to be Eτ / Eγ = 1 - γ (Δη Δτ)T Where: Eτ = shear stress dependent energy of activation Eγ = shear rate dependent energy of activation
10 The table below shows a comparison of the activation energies at constant shear rate and constant shear stress for a low-density polyethylene material in the range of oc. Shear Rate (y ) Shear Stress (τ) (sec-1) Eγ (Kj/mole) (Pa) Eτ (Kj/mole) Effect Of Pressure Sometimes it is assumed that molten polymers are non-compressible fluids. It has been shown, however, that due to their molecular structures, they all have a certain amount of free volume. Under pressure this free volume is reduced resulting in a compression of the fluid, which causes an increase in the viscosity. It has been shown that the viscosity increases exponentially with increasing pressure and can be represented by the expression: η (P) = η (P=0) e βp Where P is the pressure and β is the pressure dependence coefficient, which is characteristic of the polymer. Studies with polystyrene show that its viscosity doubles at a pressure of 10,000 psi (69 MPa). Some data for polyethylene are shown below - 10-
 is the most important.")
11 13.4 Effect Of Molecular Weight And Molecular Weight Distribution Of all of the parameters that affect the melt rheology of a particular polymer, the molecular weight (which reflects the size of the molecules) is the most important. Below a critical molecular weight (MC), where molecular entanglements begin to occur, there is a direct relationship between the melt viscosity and the weight average molecular weight (MW). Above MC the zero shear rate melt viscosity (where the viscosity becomes Newtonian) for a linear polymer depends on weight average molecular to the 3.4 power. (See Figure 16.) Above the Newtonian region the viscosity is still related to MW, however, the exponent decreases with increasing shear rate. For branched resins a relationship between viscosity and MW exists that includes a constant branching parameter g and an exponent of 6.6 to 6.8. Thus as the average molecular weight increases we see an increase in the melt viscosity of a polymeric material. (See Figure 17.) It is interesting to note that while the shear sensitivity of most commercial polymers increases with increasing molecular weight, the temperature sensitivity and flow activation energy are not affected
 polymers, fillers, lubricants, or plasticizers.")
12 Effect of Various Factors on the Viscocity Curve Although we have discussed the effect of temperature, pressure, molecular weight and molecular weight distribution on the viscosity curve, there are many other factors that may change its behavior. Some these factors include the presence of other (compatable or incompatable) polymers, fillers, lubricants, or plasticizers. Since most plastics are composed of a blend of a polymer and one or more of these additives, their effect is important to the properties of the molten plastic. The specific effects of these additives can be found in many of the included references in the For Further Reading Section. Figure 19 provides a general guide to the effects of some additives, along with temperature, - 12-

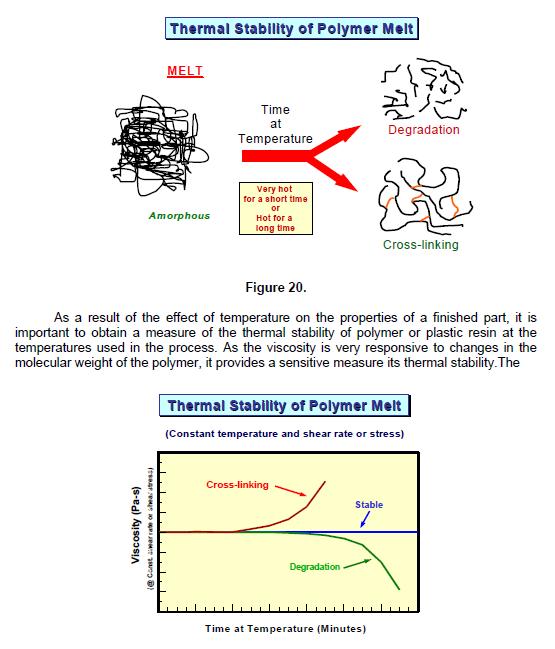
13 pressure and molecular weight, on the viscosity curve. Thermal Stability All of the discussions above have assumed that the polymer or plastic resin remains unchanged by the thermal conditions present in the test or process. As most polymers are organic (carbon based) compounds they are generally unstable towards exposure to the high temperatures they experience in conversion processes. For this reason the processes are generally designed to expose the polymer to the minimum time (residence time) possible. When a polymer is exposed to an olysulfone high temperature for a short period of time or just a hot temperature for a long time it can be affected in one of two ways. Chemical bonds in the molecules can be broken to produce smaller molecules or the polymer can continue to react with other molecules or may crosslink to form larger molecules. (See Figure 20.) The former behavior can be seen in polymers such as PET, the nylons, and PMMA, while PVC provides a good example of the latter. In either case the melt viscosity will be affected. As shown in the earlier section, the molecular weight of a polymer has a very string effect on its melt viscosity. Thus degradation of the polymer chain will be seen as a decrease in the viscosity, while continued polymerization or crosslinking will be reflected in an increase. (See Figure 21.) In addition to affecting the melt viscosity of the resin, these processes invariably degrade the final mechanical properties of the finished part
14 - 14-
 In this test, sometimes called a time sweep, the rheometer is set up to perform measurements at one shear rate (or stress) at the set temperature.")
15 rate at which degradation or crosslinking occurs in a polymer or plastic, at a given temperature, can easily be measured on a capillary rheometer. (See Figure 21.) In this test, sometimes called a time sweep, the rheometer is set up to perform measurements at one shear rate (or stress) at the set temperature. (It is best to use a moderately low shear rate to obtain the highest sensitivity.) When the test is initiated a first measurement of viscosity is acquired. The rheometer is then stopped for a pre-set period of time, after which another measurement is made. This procedure, which is usually controlled by a computer, is repeated until a pre-set total test time is reached. This test can then be repeated at a series of different temperatures. When the viscosity verses time data are fit to a line, one can obtain a measure of the rate of degradation or cross-linking. As an example of the data obtained from this test, Figure 22. shows the results from a series of time sweeps for Nylon 6/6 at a series of different temperatures. These data can then be used to set a processing window for this resin. (A similar test can be carried out using the MFR Tester See the segment on MFR Testing in the Applications Section.) Bagley, Rabinowitsch And Head Corrections The flow curve that is most commonly produced from capillary rheometry data is one in which the shear stress at the capillary wall (τw) is plotted against the apparent shear rate at the capillary wall ( γ a,w). These two material properties are obtained using the formulae: - 15-
16 τw = ΔPRc / 2Lc and γ a,w = 4Q/πR³c It is also common practice to define apparent viscosity (ηa) by the equation ηa = τw/ γ a,w (The symbol μa is sometimes used instead of ηa.) The Rabinowitsch Correction The Rabinowitsch Correction is a correction applied to viscosities, obtained from a capillary rheometer, to rectify the data for the non-newtonian character of that fluid. For Newtonian fluids the apparent shear rate at the wall is equal to the true shear rate ( γ w). However, for non-newtonian fluids, such as polymer melts, the two are not equal but are related by the equation w γ = [(3n*+1)/4n*] γ a,w Where n* = [Δlog(RΔP/2L)]/[Δ log(4q/πr)³] This equation is referred to as the Rabinowitsch Equation and the term in square brackets is known as the Rabinowitsch Correction. While in theory the magnitude of the correction could range from 1 to, the maximum error in the viscosity at any shear rate has been shown to be 15% when n* is Generally, it is less than 15% when dies of L/D of 20:1, or greater, are used. Approximate Method (Macosko, pp 242-4) When one compares the true shear rate at the wall and the apparent shear rate, it can be shown that they are equal near the wall. (See Figure 15) It has been determined that this occurs at a point that is 83% of the capillary radius. Thus an approximate value of the shear rate at the wall can be found from the relationship γ w = (0.83) γ a,w It has been shown that this approximation produces an error of less than 2% for a range of n values from 0.2 to 1.3. The main danger in using this approximation is when the fluid is very strongly shear thinning (n 0.1), where significant error occurs. Correction: Use and Application. It should be borne in mind that: 1. For comparative purposes applying the correction will not alter the comparability of the data. 2. For a tubular die the relationship between shear stress at wall and the apparent shear rate at wall is unique and does not depend on the size of the tube or capillary. 3. The apparent flow curve ( γ a,w vs. τ) can be used for calculating data for flow through slits with a maximum error of as little as 3%, which is within the accuracy of most measurements. For these reasons, the only occasion where it is necessary to use the correction is for research or for design purposes, where it is required that the true shear rate be known. For practical scale up purposes it is not important. A knowledge of n* is useful, however, as a measure of the degree of non-newtonian behavior of the melt. The lower the value of n*, the more non-newtonian the melt - 16-

17 The Bagley Correction The Bagley Correction, also known as The Bagley Entrance Correction, is possibly of greater practical importance than the Rabinowitsch correction. There is an incorrect assumption in the basic analysis for flow through a tube that all of the energy involved in forcing the material through a tube is absorbed over the length of the tube. In reality, some energy is used in funneling molten polymer molecules from the barrel or reservoir into the die. Much of this energy absorption is due to that involved in deforming the polymer molecules as they are suddenly subjected to an increase in elongation just above the die. This required extra energy input appears as equivalent to an increase in the effective length of the die
18 Bagley measured the pressure drop (ΔP) against γ w,a using a series of dies with the same diameter, but different L/D ratios. The subsequently derived plots of ΔP against L/D at constant shear rate showed an effective increase (eo) in length/diameter ratio, which can be obtained by reading off the negative intercept of the ΔP-vs.- γ w,a plot. In this case the true shear stress is given by τtrue = ΔP/[2(L/R) + eo] Some measure of the error involved in not considering the Bagley correction may be gauged by considering a tube with a L/R ratio of 10/1 and a polymer melt with a Bagley correction factor (eo) of 5. Ignoring the correction would give a wall shear stress of ΔP/20 whereas using the correction will give a value of ΔP/30, a 50% error! Alternatively, one can determine the value of ΔP at each shear rate when the line in the ΔP-vs.- γ w,a plot reaches L/R = 0. This value, designated as ΔPo, represents the pressure drop for a zero length die. Since the die has zero length we can assume that no shearing takes place and the entire pressure drop is due to the extension of the polymer molecules. (Cogswell has used this assumption to develop a method and equations for the measurement of extensional viscosities with the capillary rheometer. If one uses a zero length or very low L/D die it is possible to easily obtain relative values of the extensional viscosities of different polymers.) Thus if we subtract this pressure from the total measured pressure, we can calculate the true shear stress

19 Yet another method of correcting for the entrance effect, similar to that discussed above, is that known as the Couette-Hagenbach method. This is a difference method in which two dies of different lengths L1 and L2 are used and for each of which the output Q for a series of pressure drops ΔP are obtained. Since for each die at a given shear rate the entrance effect is the same, the pressure drop and length of the shorter die can be subtracted from those of the longer die to give an estimate of the pressure drop ΔP1-ΔP2 for a hypothetical die of length L1 L2. From this, the true shear stress at wall may thus be obtained from the formula τw = (ΔP1-ΔP2) / 2(L1-L2) While this approach does correct for the entrance effects, it gives no idea of the magnitude of the error, which may be of interest in scale-up. Head Corrections. In some rheometers, and particularly those used for measuring flow rate (MFR or MFI), the force used to push melt through the die is measured above the melt in the reservoir (usually by measuring the weight or force put onto the melt.) There will be some error in the flow curve calculation if pressure losses in the reservoir are ignored. It may be shown that when the length of melt in a reservoir of radius Rb is Lb and the length and radius of the capillary are Lc and Rc, respectively, the ratio of the pressure drop in the reservoir or barrel (ΔPb) to the pressure drop in the capillary or die (ΔPc), for a true power law fluid, is given by: - 19-
20 Wall Slip. Flow analysis generally assumes that there is no slip of the melt at the wall of the capillary. However, this assumption is not necessarily true (particularly at high shear rates.). If such slip exists, then a form of plug flow is superimposed on the normal laminar flow pattern. It has been shown [Lupton and Regester, Polymer Engineering & Science (1965)] that if the wall slip velocity is Va, Q is the volumetric flow rate, and Rc is the capillary radius, then: 4Q/πR³c = 4Va (1/Rc) + X ) where X is a function of the shear stress. To obtain a correction for this a series of flow curves is produced using a set of dies of varying radius Rc. Then, using measuring 4Q/πR³ at a given value of shear stress, a plot may then be obtained of 4Q/πR³cvs-1/Rc. The slip velocity will then be one quarter of the slope of this plot. This may then be repeated at other shear stresses and this will enable a plot of slip velocity against shear stress to be developed. MEASUREMENT OF EXTRUDATE SWELL Die swell is also known as die swell, swelling ratio or puff-up ratio and is defined as the ratio of the diameter of the extrudate to the diameter of the die. Errors due to drawing down. Accurate measurement, and interpretation of extrudate swell requires care. When it is measured on samples extruded downwards from a capillary rheometer the weight of the extrudate may to cause drawing down (stretching). Drawing down can be avoided by extruding into a bath, containing a liquid of the same density as the polymer, located immediately below the die. The effect of draw down, however, may be more conveniently minimized in other ways. Minimization of errors. Draw down may be minimized graphically. Measurements of extrudate diameter are made at several points away from the leading end of the extrudate (obtained when cutting the extruded sample at the die outlet). By means of a graph, the theoretical die swell at this leading edge may be found by extrapolation. There is little loss in accuracy if the experimenter always makes the measurements at the same distance from the leading edge. The distance chosen is that at which the extrudate swell is approximately a maximum. Circular cross-section. To ensure that a circular cross-section is obtained from the die or capillary, the extrudate must be given time to freeze while suspended since it can distort if allowed to lie on a surface before it has hardened. This distortion may be a problem when extruding unvulcanized rubber compounds, as extrudates made from such soft materials may distort under their own weight even when cold. Diameter Determination. Providing the extrudate is smooth and circular, the measurements of diameter may be made using a projection microscope. If a laser micrometer is available, very accurate measurements (of the extrudate and of the die) can be made relatively easily. Such data may be logged into the computer of interfaced to the rheometer. (This is the method used with the Dynisco Polymer Test LCR 7001.) If the sample is - 20-
, the extrudate diameter (D) can be calculated from the equation: D² = 4M/πρL Since it is usually required to know the ratio of the product")
21 not round and smooth or if the extrusion exhibits sharkskin or melt fracture the best procedure is to weigh (M) a known length (L) of the extrudate. From these data and knowledge of the density (ρ), the extrudate diameter (D) can be calculated from the equation: D² = 4M/πρL Since it is usually required to know the ratio of the product diameter/die diameter, it is satisfactory to use the density of the solid polymer. In the case of crystalline polymers, however, the density will depend on the rate of cooling from the die. For accurate measurement the density should be obtained from the extruded sample. Errors due to molecular factors. For semi-crystalline thermoplastics, estimates for the extrudate swell of large diameter slow cooling industrial extrudates, obtained from fast cooling small laboratory samples, may show some error. A source of this error may arise from the freezing of the extrudate before the polymer molecules have had a chance to recoil or relax after emergence from the die. This is a greater problem with small diameter extrudates and thus a source of scale up error. Error in the laboratory samples may be reduced by allowing them to anneal at a temperature 50-60ºC, above the glass transition temperature. On occasion it may be desired to know the ratio of the melt diameter/die diameter. In this case the melt density must be used in the formula above. When projection microscopy is used, the measured value of the diameter of the solid extrudate should be multiplied by the ratio solid density/melt density
22 APPLICATIONS OF RHEOLOGICAL DATA Novel Applications Of The MFR Tester The ability of the standard MFR instrument to characterize polymers is considered by some to be rather limited. However, the capabilities of this instrument for polymer testing go well beyond those achievable strictly by the standard tests. Several of these applications are discussed below. Shear Thinning of the Melt The MFR test is sometimes criticized for being a single point test. Because of their nature, the flow properties of polymers usually vary with the force or rate at which they are deformed. As a result of the orientation of the polymer molecules, their flow rate often increases faster than expected as the deformation rate or force is increased. Therefore, a function rather than a point will best describe their flow behavior. This behavior can be gauged with the MFR tester by measuring the melt flow rates generated using a series of two or more different weights. The slope of the curve obtained by plotting the weight verses the MFR will give a measure of this shear thinning function [See Yoo, H.J., et. al., SPE ANTEC, Technical Papers, Vol. XXXIX, pp (1993)]. For some polymers this slope can be roughly related to its molecular weight distribution. (See Figure 25.) Note in the figure that resins PE-2 and PE-5 have the same MFR in the standard low load (2.16 Kg) test, but are very different at the higher loads. Thus, whereas the standard MFR test would indicate that the resins are the same, they are not

23 Extrudate Swell When polymer melt emerges from a die the extrudate may swell so that its cross-section, after it leaves the die, is significantly greater than that of the die orifice. This source of this swelling is from the extension or, orientation, of polymer molecules as they pass through a die. On exiting the die the molecules tend to re-coil back to their original configuration, which causes the extrudate to expand perpendicular to the flow. The extrudate swell is defined as the ratio of the extrudate diameter to that of the die. This value is very important to anyone extruding a profile, where dimensions are critical. The melt index test itself will not give a measure of extrudate swell. However, a semi-quantitative measure of the relative swell values for a product can be obtained from measurement of the length the polymer strands produced during equal extrusion times. The shorter the strand the greater will be the extrudate swell. All other things being equal, a material that swells more is more elastic and will show less sag in thermoforming operations
24 Thermal stability The stability of a polymer product at processing temperatures will often determine if a material can be successfully formed into useful products that don t fail in service. While the melt indexer is often used to determine if a material has degraded, after the fact, it can also be used to determine if a virgin material has the stability required to stand up to a process. To do this one need only set up the MFR test by the standard procedures. Then a separate timer should be started once the barrel is filled and the piston inserted. Next conduct a standard Method A or B test noting the MFR and the completion time from the timer. While supporting the weight and piston, pause for a period of time, say five or ten minutes and then, run another test and record the MFR and time. This procedure can be repeated several times. The results, plotted as MFR verses time at temperature, will then reflect any changes taking place in the resin and the rate at which they occur. An increase in MFR will indicate that the polymers are degrading, while a decrease will indicate the possibility of cross-linking taking place (See Figure 26.). This test can be repeated at other temperatures to establish the processing window of a material. Intrinsic or Relative Viscosities Intrinsic or relative solution viscosity measurements have traditionally been used to estimate the molecular weights of polymers. They are extensively used in the manufacture of PET, nylons, and other polymers. These tests, however, are time consuming, require laboratory facilities, and necessitate the disposal of the frequently unfriendly solvents used. The melt viscosity, and therefore the MFR of a polymer, is also directly related to its molecular weight. (In fact, it is five times more sensitive than the solution viscosities.) Thus a relationship exists between the two methods and MFR measurements can be used to determine solution viscosities. Figure 27 shows that a semi-log plot of the MFR of several intrinsic viscosity standards produces a straight line. Thus once this relationship is established the IV can be determined from MFR in a short time and without the use of unfriendly solvents. [See Reilly, J.F. and Limbach, SPE ANTEC, Proceedings Vol. XXXVIII, pp (1992 )]
 Match the shear stress achieved in the melt indexer on shear stress verses shear rate curve. 2.) Determine the shear rate achieved at this shear stress. 3.")
25 Correlation Of Polymer Melt Rheology To MFR A correlation of the shear flow based melt rheology to melt flow index (MFR, g/10min) or melt volume index (MVR, cc/10min) is made by the following procedure: 1.) Match the shear stress achieved in the melt indexer on shear stress verses shear rate curve. 2.) Determine the shear rate achieved at this shear stress. 3.) Calculate the volumetric flow rate from the shear rate and die geometry. Method The MFI test is performed under a condition of constant stress. The stress exerted upon a molten polymer in the melt flow indexer is calculated from the weight of the piston and standard weight, piston face area, and the die geometry. A table of these stress values for the ASTM D-1238 test specification is shown below. (Similar values can be calculated for the ISO 1133 test.) A laboratory capillary rheometer can be used to obtain a measure of the MFI by a determining of the volumetric melt flow rate from a curve of shear stress verses shear rate, at constant temperature. Such a curve is shown below. As shown in Figure 28 below, a horizontal line at the shear stress in the MFI test is extended to the curve. The corresponding shear rate is determined from a vertical line dropped to the shear rate axis. A second order polynomial fit of the rheometer data is used in the LabKARS Software to interpolate these values. (A Rabinowitsch Correction is performed on the data prior to interpolation.) The resultant shear rate is used in the volume flow rate equation, with the dimensions of the melt flow indexer die, to determine the flow rate in the indexer at that shear rate
26 Where MFI die radius in cm ( /2) and the constant 600 converts from units of 1/seconds to 1/ 10 minutes. (From the above it can be seen that to a first approximation the volumetric flow rate is about one half the shear rate at the melt flow indexer stress level.) The above equation produces the melt volume index (MVI) in cc/10 minutes. The melt flow index (MFI) in g/10 minutes is obtained when the MVI is multiplied by the polymer melt density at the test temperature. Note: Flow in the short (L/D=3.818) melt flow indexer die is not all shear flow. When extensional effects produce a significant fraction of the pressure drop, the predicted MFI will tend to be higher, since extensional effects are ignored in the calculation. If, however, two rheometer dies are used the entrance effect can be estimated and a more accurate MFI produced. Applications In Extrusion Pressure Drop In A Die Pressure is required to force a liquid, such as a polymer melt, through an extrusion die. In the case of extrusion dies this pressure is usually produced by an extruder screw that pumps material to the die face where pressure is built up by the restricting effect of the die. Simple Die Characteristics In the case of a simple extrusion die of any shape, where the cross-section of the channel is constant from its inlet to exit: - 26-
27 1. The pressure is greatest at the die entry. 2. The pressure is virtually zero at the die exit (and for most purposes may be equated with zero). 3. The pressure drop from the inlet to the exit is linear. 4. When the inlet pressure is denoted by ΔP and the length of the die is L, ΔP/L is constant along the whole length of the tube. Calculation Of Pressure Drop In A Capillary Die The pressure drop in a constant cross-section die (which is fed from a reservoir of material at the die head) is related to the output rate, the die dimensions, and the melt viscosity. For a simple rod die, the pressure drop is calculated by the following procedure: 1. Determine the apparent wall shear rate from the formula γ w,a = 4Q/πR³. 2. Read off the wall shear stress (τw) corresponding to this shear rate value from the flow curve for the appropriate polymer at the extrusion temperature. 3. Calculate the pressure drop (i.e., the pressure developed at the back of the die parallel) from the shear stress by the formula P = 2L (τw) / R where L is the length and R the radius of the parallel portion of the die. Calculation Of Pressure Drop In A Slit. For a slit die the shear rate is given by γ a,w = 6Q/Wh² where w is the width of the slit and H its thickness (or depth). The flow curve, even though it may have been prepared from capillary data, may then be used to read off the corresponding shear stress. In turn the pressure drop is obtained from the expression P = 2L τw / H Calculation Of Pressure Drop In A Tapered Capillary Die In the case of a tapered die, the radius at the inlet is called R1 and at the outlet R2. As with the capillary die, the shear rate is first determined applying the capillary formula using the inlet radius. The shear stress at that shear rate is determined from the flow curve. The pressure drop is then given by: P = [2 τ1 / 3tanθ] / [R1 / R2 )³-1]
28 Sizing Of Die Components The cross-section of an extrudate will not always be the same as the outlet crosssection of the die from which it has been extruded. There are three reasons for this: 1. Shrinkage of the extrudate on cooling. 2. Extrudate or die swell. 3. Draw down (stretching of the extrudate on emergence from the die). During rheology testing, die swell measurements can be made relatively easily. A common use of such measurements is to size die components. The magnitude of the shrinkage is usually quite small and since die swell measurements are usually based on cold extrudates this factor is usually built into any die swell assessment. Whereas die swell increases the cross section, drawing down reduces it. Correction Factors. The relationship between the cross-section dimension of an extrudate E and the cross-sectional dimension of a die D, is: E = sdd. In this equation, s is the die swell ratio at the wall shear rate occurring during extrusion. D is the draw down factor defined by (Ld Lu ). Ld is the length of material produced in a unit of time in the process in which draw down has taken place and Lu is the length of material naturally extruded in unit time without any drawing down having occurred. (The square root term arises since it is the cross-sectional area rather than a single dimension e.g. diameter that decreases inversely with the extent of draw-down.) Sizing Pipes. A further complication arises in pipe manufacture, where it is common practice to inflate the tube to the inner diameter of a sizing die. In this case, if the outer diameter of the extrusion die annulus is do and that of the inner diameter of the sizing die annulus is ds, then the thickness of the pipe T will be related to the annular gap of the die, A, by the relationship: T = s (Ld /Lu ) (ds / do )A Estimation of Pressure Drops in Extrusion Dies The relationships between pressure drop (P), output rate (the flow rate Q), and viscosity for various flow cross-sections may all be arranged to take the form P = η x R x Q. Where R is called the die resistance. Die Resistance. Die resistance is a measure of the resistance of a flow channel to the passage of the polymer melt. For regular channels of simple shape it is easily calculated from their dimensions. For regular extrudate sections include rod (cylinder), sheet (rectangle), and pipe (annulus), the formulae for calculating the die resistance are: - 28-
29 1. Rod or Cylindrical Channel. Length = L; Radius = r; Diameter = d. Die resistance = R = 8 (L) / π r4 = 128 (L) / π d4 2. Rectangular Channel. Length = L; Width = w; Thickness = t. When the width is more than 10 times thickness Die resistance = R = 121 / w t³ b.) Where width is less than 10 times thickness Die resistance = R = 121S / w t³ S = Shape factor and is given in Figure Pipe or Annular Channel. Length = 1; inner diameter =di, outer diameter = do, Gap thickness, t = 1/2(do-di) Average diameter, d = 1/2(do + di) Die resistance = R = 121 / π d t³ Calculating Die Resistance (Example For Pipe Die Land.) Consider a land of length 50 mm, with an internal diameter of 100 mm, and external diameter of 104 mm. The average diameter is 102 mm and the gap thickness is 2 mm. Using the formula given above: Die resistance = R = / π (102.2)³ = mm-³. Flow Rate When calculating pressure losses, flow rates must be expressed as volume flow per unit time. If the mass flow rate, for a melt of density D at the processing temperature, is known as M (kg/h) then the volume flow rate (Q) in mm³/s is: Q = 278,000 (M / D). If a melt flow rate tester that can do a method B test is available the melt density (D) may be measured directly. Correction Method For Plastic Melts The fact that molten plastics are non-newtonian introduces two complications in calculating pressure losses. First, the viscosity of molten plastic is not constant and second, the flow pattern in a channel is different from that of a simple Newtonian fluid. (The viscosity of a simple, or Newtonian fluid is a constant, which depends only upon the temperature.) These problems can be overcome by using apparent viscosities and representative values. Apparent Viscosity. If the shear stress at a particular shear rate is known for a plastic melt, then the ratio shear stress/shear rate is called the apparent viscosity. The apparent viscosity generally decreases as shear rate increases. To calculate pressure losses in a process it is necessary to have a graph of apparent viscosity against shear - 29-
30 rate for the material at a particular temperature of the melt. These flow curves can be obtained from material suppliers, measured in the laboratory (see Figures 10 and 11 and the section on Rheology Equipment and Testing ), or it may be calculated approximately from the MFR of the plastics material. Figure 15 shows a flow curve that will be used as an example here. Representative Values. At a given overall output rate, the flow pattern of a molten polymer in a channel will differ from that of a simple Newtonian fluid. Figure 31 shows flow patterns through a 20mm diameter tube for a Newtonian and for a non-newtonian fluid (polymer melt). The polymer melt is assumed to have a melt flow index (MFR) value of 0.3. Both materials have zero flow velocity at the walls of the tube and maximum flow velocity in the center of the tube. For the same output rate (and hence the same average flow velocity) the polymer melt has a lower maximum velocity and more of a plug like flow. The flow velocity is nearly constant across the middle of the tube and decreases rapidly near the walls. As a result, the shear rate, which controls the localized rate at which layers flow over each other, is greater near the walls in the case of the polymer melt than for a Newtonian. Near the walls of the flow channel there can be a large difference in shear rates as shown in Figure 30. There is a fairly complex way of relating Newtonian and non-newtonian shear rates at the wall called the Rabinowitsch correction. However, it is simpler to consider the situation where the two lines in Figure 31 intersect. Here Newtonian and non-newtonian shear rates are equal. The value of shear rate at this point is called the representative value. By using this value it is possible to calculate pressure drops using a method similar to that used for Newtonian fluids (see W. Michaeli in his book Extrusion Dies ). Representative Shear Rate It has been found that the position of the representative shear rate in a flow channel is nearly constant for plastic melts. For a tube, it is at 83% of the distance from center to walls. The formulae for calculating the representative shear rates are as follows: - 30-
31 - 31-
32 Representative Viscosity Once the representative shear rate is determined, the flow curve for the plastic melt is used to find the apparent viscosity of the melt at this shear rate. This apparent viscosity is called the representative viscosity (ηr ) and if substituted in the equation P = ηr x R x T, it may be used to calculate pressure drops Pressure Drop Calculation Using Representative Viscosity Suppose the pipe die whose die resistance was calculated above, extrudes plastic melt at 180 kg/h, the melt has a density of 800 kg/m³, and its flow properties are as shown in Figure 15. Flow rate: Q = 278,000 x 180/800 = 62,550 mm³/s. Representative shear rate: * = 1.46 x / γ 102 x 2² = 224 s-1 From the flow curve, the representative is viscosity (@ 230 oc in Fig. 19 ) is 940 Pa-s (N s / m²). Pressure drop: P = ηr x R x Q = 940 x x = N/m² = MN/m² or 2005 psi. Flow Resistance Of Complete Dies Most dies may be considered as a number of connecting sections. The die resistance depends most on the smallest dimension of the channel cross-section (for example, the thickness of a slot die or on the gap thickness of a pipe die). Thus flow resistance is usually greatest across the die land and one should first calculate the die resistance and pressure drop of this section of the die. Only when this is satisfactory is it then necessary to calculate pressure drops for the other die sections. The total pressure drop will then be the sum of the pressure drops for each section Applications In Injection Molding. Pressure Drop in a Runner and Runner Sizing A runner is the channel that connects an injection mold cavity to the sprue bush where the polymer melt is first introduced to the mold. Runner sizing is very important, but often the decision regarding its size is made at the mold design stage, without actually molding the component. Melt flow data obtained in the laboratory, however, can be used to calculate the optimum runner size. A great deal of energy is often wasted in this important process. This is because it is necessary to apply considerable pressure to the polymer melt in order to fill an injection mold quickly. The molds used are often designed without using flow data and as a consequence, runners (the flow channels), are frequently made too large. This means that the high injection molding pressures used are transmitted into the cavity requiring excessive clamping pressures to hold the two mold halves together. If these pressures are reduced, the process will be simpler, cheaper, and more energy efficient to operate. One way of doing this is to size the runners so they are as small as possible, consistent with mold filling and packing. As the runner is often the thickest part of the molding, any reduction in runner cross-section will also reduce the cooling cycle and speed up production. In addition, smaller runners will result in less material wasted or required to be reworked, thus reducing costs
33 Runners. These melt flow channels (the runners) are often of circular cross-section, although trapezoidal sections are common because of their ease of manufacture. The crosssections of these channels are generally constant from the inlet to the exit. Normally polymer melt fills a mold extremely quickly (in less than one second.) and the amount of heat transfer to the mold is relatively small. From a rheological point of view, flow through the runner may be assumed to be the same as that through a circular die and the pressure drop can be calculated. (For a trapezoidal runner, it is assumed that the pressure drop is the same as that for the largest circular runner that fits neatly within the trapezoidal crosssection.) Injection Pressure. Most injection molding machines have available approximately 20,000 psi (140 MN²) of injection pressure. Of this about 10,000 psi may be lost in the runner system and still leave enough to pack the injection mold. To size a runner we first select a runner that seems to be representative and calculate the pressure drop through one of that crosssection. If the pressure drop obtained is too large or too small, then the calculation is repeated, using slightly different runner sizes, until the correct amount of pressure drop is obtained. If the inlet pressure is denoted by ΔP and the length of the runner is L then, as the pressure drops linearly from the inlet to the exit, ΔP/L is constant along the whole length of the runner. Information Required. For a runner feeding only one cavity the information required is: The thermoplastic material to be used for the component. The weight of each component. The density of the thermoplastic material. A flow curve for the material at the melt temperature being used in the process. In order to calculate the runner size it is necessary to convert the gravimetric values into volumetric values (i.e. g/s into m³/s). To calculate Q, the volumetric flow rate, it is necessary to know the density of the material at the injection molding temperature. This is relatively easy to obtain if an MFR machine, which is capable of doing a method B determination, is available. If not, the advice of the material supplier may be sought. (Generally, the density of a plastic material at molding temperatures may be considered to be roughly 0.75 times that of the room temperature value.) Ideally, the flow properties of the plastic material should be measured over a range of shear rates, using a high shear rate rheometer, to construct a flow curve. It may, however, be possible to obtain such a flow curve from the material manufacturer. Calculation Of Pressure Drop (ΔP) The pressure drop in a constant cross-section runner (fed from a reservoir of material in the nozzle or sprue bush) is related to the flow rate, the die dimensions, and the melt viscosity. For a circular cross-section runner it may be calculated by a relatively simple procedure
34 Method 1 A. Select a runner diameter. (For example, 6mm/0.25in.) B. Calculate the runner volume. C. Calculate the volume of the molding. D. Calculate the working volume (V) (mold volume + runner volume). E. Calculate the volumetric flow rate (Q). (Assuming that the mold filling time is 1 second if the value is not known from experience.) If the mold filling time is t seconds then Q = V/t. If a 1 second fill time is used, Q will be numerically equal to V but will have different units. F. Calculate the apparent wall shear rate ( γ w,a) from the formula γ w,a = 4Q/πR³. G. Read off the wall shear stress (τw) corresponding to this shear rate value from the flow curve appropriate to the material. H. Calculate the pressure drop (ΔP i.e. the pressure developed at the beginning of the runner) from the shear stress by the formula P = 2Lτw / R (where L is the length and R the radius of the runner). I. If the pressure drop is less than 10,000 psi (70 MNm²) then one should make the runner smaller and if greater than 10,000 psi (70MNm²), then one should make the runner larger. That is, re-size the runner as appropriate. (Since the designer will normally wish to keep the runner as short as possible the main variable here will be the runner diameter.) Method 2. This is the same as above except for stage E. E. Calculate the volumetric flow rate (Q) from the barrel diameter (of the injection molding machine that is to be used) and of the ram speed (linear screw speed) during mold filling. If the cylinder diameter is D and the ram speed is S, then the rate of volumetric displacement by the ram, (which will be the same as that in the mold cavity) Q will be: Q = πd²s/4. If it is not known what machine is to be used then it is possible to estimate the required machine size by assuming that the amount of displacement required in the injection barrel (Vi) is about 10% more than V as defined above i.e. Vi = 1.1V. This volume will be the ram area times the stroke of the ram. In practice this is usually about 3D so that the volume will be (πd²/4)3d or 3πD³/4. Thus 1.1V = 3πD³/4, or D³ = 0.467V from which the ram diameter D may be immediately found. Optimizing Runner Sizes We have shown that the use of flow curves, in association with standard rheological (flow) equations, enables us to determine the pressure loss that occurs when a molten thermoplastic material flows down a channel. We must, however, decide how much pressure can afford to be lost in the runner system that feeds the several cavities. Since an injection-molding machine has normal working pressures of MN m² (30,000psi), a pressure drop of 69MN m² (10,000psi) may reasonably be lost in the runner system
Viscosity and Polymer Melt Flow. Rheology-Processing / Chapter 2 1
 Viscosity and Polymer Melt Flow Rheology-Processing / Chapter 2 1 Viscosity: a fluid property resistance to flow (a more technical definition resistance to shearing) Remember that: τ μ du dy shear stress
Corrections to flow data in polymer melts
 Corrections to flow data in polymer melts Narongrit Sombatsompop Polymer PROcessing and Flow (P-PROF) Materials Technology, School of Energy & Materials King Mongkut s University of Technology Thonburi
Rheological Properties of ABS at Low Shear Rates: Effects of Phase Heterogeneity
 Malaysian Polymer Journal, Vol 4, No, p9-36, 9 Available online at wwwfkkksautmmy/mpj Rheological Properties of ABS at Low Shear Rates: Effects of Phase Heterogeneity Asif Ali Qaiser *, Yasir Qayyum and
Mechanical Properties of Polymers. Scope. MSE 383, Unit 3-1. Joshua U. Otaigbe Iowa State University Materials Science & Engineering Dept.
 Mechanical Properties of Polymers Scope MSE 383, Unit 3-1 Joshua U. Otaigbe Iowa State University Materials Science & Engineering Dept. Structure - mechanical properties relations Time-dependent mechanical
An Adjustable Gap In-Line Rheometer
 An Adjustable Gap In-Line Rheometer By D. M. Kalyon, H. Gokturk and I. Boz Highly Filled Materials Institute Hoboken, NJ 07030 Introduction The rheological behavior of polymer melts, and structured fluids
Measuring the rheology of thermoplastic polymer melts
 Measuring the rheology of thermoplastic polymer melts Using rotational and capillary rheometry to characterize polymer melts RHEOLOGY AND VISCOSITY Introduction Rheology is the science of studying the
STUDY OF RHEOLOGICAL BEHAVIOR OF REPROCESSING HIGH IMPACT POLYSTYRENE
 STUDY OF RHEOLOGICAL BEHAVIOR OF REPROCESSING HIGH IMPACT POLYSTYRENE Peydró M.A. 1, Juárez D., Selles M.A., Sánchez-Caballero S., Pla-Ferrando R. 1 Instituto de Tecnología de Materiales, Universidad Politécnica
Polymer Engineering (MM3POE)
") Polymer Engineering (MM3POE) MELT RHEOLOGY & PROCESSING http://www.nottingham.ac.uk/~eazacl/mm3poe Melt Rheology & Processing 1 Contents Introduction to polymer processing Basic principles Common manufacturing
Polymer Engineering (MM3POE) MELT RHEOLOGY & PROCESSING http://www.nottingham.ac.uk/~eazacl/mm3poe Melt Rheology & Processing 1 Contents Introduction to polymer processing Basic principles Common manufacturing
Injection Molding. Figure 1: Principles of injection molding. Injection molding cycle: part solidifies. Open Mold Eject Part Close Mold
 Injection Molding Figure 1: Principles of injection molding. Injection molding cycle: Extruder Pressure Extrude Mold Inject Pack Solidify Open Mold Eject Part Close Mold gate solidifies part solidifies
ANALYSIS ON PLANAR ENTRY CONVERGING FLOW OF POLYMER MELTS
 Journal of Materials Science and Engineering with Advanced Technology Volume 2, Number 2, 2010, Pages 217-233 ANALYSIS ON PLANAR ENTRY CONVERGING FLOW OF POLYMER MELTS College of Industrial Equipment and
RHEOLOGY Principles, Measurements, and Applications. Christopher W. Macosko
 RHEOLOGY Principles, Measurements, and Applications I -56081-5'79~5 1994 VCH Publishers. Inc. New York Part I. CONSTITUTIVE RELATIONS 1 1 l Elastic Solid 5 1.1 Introduction 5 1.2 The Stress Tensor 8 1.2.1
AN ANALYSIS OF THE EFFECT OF ELONGATIONAL VISCOSITY ONTHEFLOWINAFLATDIE
 AN ANALYSIS OF THE EFFECT OF ELONGATIONAL VISCOSITY ONTHEFLOWINAFLATDIE Y. Sun and M. Gupta Mechanical Engineering-Engineering Mechanics Department Michigan Technological University Houghton, MI 49931
CENG 501 Examination Problem: Estimation of Viscosity with a Falling - Cylinder Viscometer
 CENG 501 Examination Problem: Estimation of Viscosity with a Falling - Cylinder Viscometer You are assigned to design a fallingcylinder viscometer to measure the viscosity of Newtonian liquids. A schematic
CHAPTER 3. CONVENTIONAL RHEOMETRY: STATE-OF-THE-ART. briefly introduces conventional rheometers. In sections 3.2 and 3.
 30 CHAPTER 3. CONVENTIONAL RHEOMETRY: STATE-OF-THE-ART This chapter reviews literature on conventional rheometries. Section 3.1 briefly introduces conventional rheometers. In sections 3.2 and 3.3, viscometers
Modeling of Anisotropic Polymers during Extrusion
 Modeling of Anisotropic Polymers during Extrusion Modified on Friday, 01 May 2015 10:38 PM by mpieler Categorized as: Paper of the Month Modeling of Anisotropic Polymers during Extrusion Arash Ahmadzadegan,
Shear rheology of polymer melts
 Shear rheology of polymer melts Dino Ferri dino.ferri@versalis.eni.com Politecnico Alessandria di Milano, 14/06/2002 22 nd October 2014 Outline - Review of some basic rheological concepts (simple shear,
THE 3D VISCOELASTIC SIMULATION OF MULTI-LAYER FLOW INSIDE FILM AND SHEET EXTRUSION DIES
 THE 3D VISCOELASTIC SIMULATION OF MULTI-LAYER FLOW INSIDE FILM AND SHEET EXTRUSION DIES Kazuya Yokomizo 1, Makoto Iwamura 2 and Hideki Tomiyama 1 1 The Japan Steel Works, LTD., Hiroshima Research Laboratory,
Pharmaceutical compounding I Colloidal and Surface-Chemical Aspects of Dosage Forms Dr. rer. nat. Rebaz H. Ali
 University of Sulaimani School of Pharmacy Dept. of Pharmaceutics Pharmaceutical Compounding Pharmaceutical compounding I Colloidal and Surface-Chemical Aspects of Dosage Forms Dr. rer. nat. Rebaz H. Ali
CONTRIBUTION TO EXTRUDATE SWELL FROM THE VELOCITY FACTOR IN NON- ISOTHERMAL EXTRUSION
 Second International Conference on CFD in the Minerals and Process Industries CSIRO, Melbourne, Australia 6-8 December 1999 CONTRIBUTION TO EXTRUDATE SWELL FROM THE VELOCITY FACTOR IN NON- ISOTHERMAL EXTRUSION
H. W. Müllner (Sp), J. Eberhardsteiner, Technische Universität Wien (A); W. Fidi, Semperit Technische Produkte Ges.m.b.H. & Co. KG, Wimpassing (A)
, J. Eberhardsteiner, Technische Universität Wien (A); W. Fidi, Semperit Technische Produkte Ges.m.b.H. & Co. KG, Wimpassing (A)") Dienstag, 4. Juli 2006 Tuesday, July 4, 2006, 9.30 10.00 h Section A Rheologische Charakterisierung der Strangaufweitung von Kautschukmischungen mittels numerischer Simulationen Rheological Characterisation
Dienstag, 4. Juli 2006 Tuesday, July 4, 2006, 9.30 10.00 h Section A Rheologische Charakterisierung der Strangaufweitung von Kautschukmischungen mittels numerischer Simulationen Rheological Characterisation
The effect of melt compressibility on the mold filling of thin-walled parts
 The effect of melt compressibility on the mold filling of thin-walled parts Andy Rose, Lucien Douven, DSM Ahead BV Autodesk Moldfow, Benelux user meeting Eindhoven May 2 nd, 2017 Agenda Introduction Background
Non Newtonian Fluid Dynamics
 PDHonline Course M417 (3 PDH) Non Newtonian Fluid Dynamics Instructor: Paul G. Conley, PE 2012 PDH Online PDH Center 5272 Meadow Estates Drive Fairfax, VA 22030-6658 Phone & Fax: 703-988-0088 www.pdhonline.org
TWO-DIMENSIONAL SIMULATIONS OF THE EFFECT OF THE RESERVOIR REGION ON THE PRESSURE OSCILLATIONS OBSERVED IN THE STICK-SLIP INSTABILITY REGIME
 1 TWO-DIMENSIONAL SIMULATIONS OF THE EFFECT OF THE RESERVOIR REGION ON THE PRESSURE OSCILLATIONS OBSERVED IN THE STICK-SLIP INSTABILITY REGIME Eleni Taliadorou and Georgios Georgiou * Department of Mathematics
Polymer Reaction Engineering
 Polymer Reaction Engineering Polymerization Techniques Bulk Solution Suspension Emulsion Interfacial Polymerization Solid-State Gas-Phase Plasma Polymerization in Supercritical Fluids Bulk Polymerization
Effect of Molecular Weight on Viscosity of Polypropylene Melt by Capillary Rheometry
 RESEARCH ARTICLE Effect of Molecular Weight on Viscosity of Polypropylene Melt by Capillary Rheometry Daniel N. Njoroge Department of Mechanical and Manufacturing Engineering Aalborg University Fibigerstraede
Simulation of pressure drop for combined tapered and nontapered die for polypropylene using ansys Polyflow
 IOSR Journal of Polymer and Textile Engineering (IOSR-JPTE) e-issn: 2348-019X, p-issn: 2348-0181, Volume 1, Issue 3 (May-Jun. 2014), PP 22-29 Simulation of pressure drop for combined tapered and nontapered
Final Polymer Processing
 030319 Final Polymer Processing I) Blow molding is used to produce plastic bottles and a blow molding machine was seen during the Equistar tour. In blow molding a tubular parison is produced by extrusion
Material Testing Overview (THERMOPLASTICS)
") Material Testing Overview (THERMOPLASTICS) Table of Contents Thermal Conductivity... 3 Specific Heat... 4 Transition Temperature and Ejection Temperature... 5 Shear Viscosity... 7 Pressure-Volume-Temperature
Material Testing Overview (THERMOPLASTICS) Table of Contents Thermal Conductivity... 3 Specific Heat... 4 Transition Temperature and Ejection Temperature... 5 Shear Viscosity... 7 Pressure-Volume-Temperature
Determining the Processability of Multilayer Coextruded Structures
 Determining the Processability of Multilayer Coextruded Structures Joseph Dooley The Dow Chemical Company, Midland, MI ABSTRACT Multilayer coextrusion is a process in which two or more polymers are extruded
Lecture No. (1) Introduction of Polymers
 Introduction of Polymers") Lecture No. (1) Introduction of Polymers Polymer Structure Polymers are found in nature as proteins, cellulose, silk or synthesized like polyethylene, polystyrene and nylon. Some natural polymers can also
Lecture No. (1) Introduction of Polymers Polymer Structure Polymers are found in nature as proteins, cellulose, silk or synthesized like polyethylene, polystyrene and nylon. Some natural polymers can also
EFFECT OF TYPICAL MELT TEMPERATURE NON-UNIFORMITY ON FLOW DISTRIBUTION IN FLAT DIES
 EFFEC OF YPICAL MEL EMPERAURE NON-UNIFORMIY ON FLOW DISRIBUION IN FLA DIES Olivier Catherine, Cloeren Incorporated, Orange, X Abstract In this study, the influence of non-uniform incoming melt temperature
Exercise sheet 5 (Pipe flow)
") Exercise sheet 5 (Pipe flow) last edited June 4, 2018 These lecture notes are based on textbooks by White [13], Çengel & al.[16], and Munson & al.[18]. Except otherwise indicated, we assume that fluids
Exercise sheet 5 (Pipe flow) last edited June 4, 2018 These lecture notes are based on textbooks by White [13], Çengel & al.[16], and Munson & al.[18]. Except otherwise indicated, we assume that fluids
2009 Best Paper Understanding and Quantification of Die Drool Phenomenon During Polypropylene Extrusion Process
 2009 Best Paper Understanding and Quantification of Die Drool Phenomenon During Polypropylene Extrusion Process Print (10)» 2010 Best Paper An Engineering Approach to the Correction of Rotational Flow
Mechanical properties of polymers: an overview. Suryasarathi Bose Dept. of Materials Engineering, IISc, Bangalore
 Mechanical properties of polymers: an overview Suryasarathi Bose Dept. of Materials Engineering, IISc, Bangalore UGC-NRCM Summer School on Mechanical Property Characterization- June 2012 Overview of polymer
MATERIALS AND METHODS
 Monitoring of Rheological Indicators of LDPE Per-Åke Clevenhag and Claes Oveby Tetra Pak Carton Ambient AB ABSTRACT LDPE,s from high-pressure autoclave reactors for extrusion coating with Melt Flow Rates
Rheological evaluation of melt blown polymer melt
 Rheological evaluation of melt blown polymer melt Jiri rabek and Martin Zatloukal Citation: AIP Conf. Proc. 1526, 237 (2013); doi: 10.1063/1.4802618 View online: http://dx.doi.org/10.1063/1.4802618 View
Moldflow Report Beaumont Logo. Performed by: Beaumont Technologies Requested by: Customer
 Moldflow Report Beaumont Logo Performed by: Beaumont Technologies Requested by: Customer Objective To analyze the BTI Logo part in order to determine an optimal gate location. To thoroughly evaluate the
Investigation of Polymer Long Chain Branching on Film Blowing Process Stability by using Variational Principle
 Investigation of Polymer Long Chain Branching on Film Blowing Process Stability by using Variational Principle ROMAN KOLARIK a,b and MARTIN ZATLOUKAL a,b a Centre of Polymer Systems, University Institute
Analysis of Melt Spinning Master-Curves of Low Density Polyethylene
 Analysis of Melt Spinning Master-Curves of Low Density Polyethylene Ji-Zhao Liang, 1 Lei Zhong, 1 Kejian Wang 2 1 Research Division of Green Function Materials and Equipment, School of Mechanical and Automotive
FE Exam Fluids Review October 23, Important Concepts
 FE Exam Fluids Review October 3, 013 mportant Concepts Density, specific volume, specific weight, specific gravity (Water 1000 kg/m^3, Air 1. kg/m^3) Meaning & Symbols? Stress, Pressure, Viscosity; Meaning
Chapter 6 Molten State
 Chapter 6 Molten State Rheology ( 流變學 ) study of flow and deformation of (liquid) fluids constitutive (stress-strain) relation of fluids shear flow shear rate ~ dγ/dt ~ velocity gradient dv 1 = dx 1 /dt
Lecture 7: Rheology and milli microfluidic
 1 and milli microfluidic Introduction In this chapter, we come back to the notion of viscosity, introduced in its simplest form in the chapter 2. We saw that the deformation of a Newtonian fluid under
Surface tension and elastic forces also influence leveling. Indexes for these properties are presented as well as useful values for the process.
 New Rheology Testing Solves Operating Problems Abstract All coatings processes have an abrupt short duration shear region that controls the application process. Measurements of the force required to make
Novel method for on-line rheology measurement in manufacturing of non- Newtonian liquids
 Novel method for on-line rheology measurement in manufacturing of non- Newtonian liquids Fridolin Okkels, Anders L. Østergård, Mohammad Amin Mohammadifar 2 Fluidan ApS, Kgs. Lyngby, Denmark 2 National
Contraction flow measurements of extensional properties
 Contraction flow measurements of extensional properties Mats Stading ) and Leif Bohlin ) Chalmers University of Technology and SIK, The Swedish Institute for Food and Biotechnology, PO Box 54, S-4 9 Göteborg,
Multilayer Rheology Effects in Coextruded Structure Design
 2008 Best Paper Multilayer Rheology Effects in Coextruded Structure Design Print (10)» Best Papers» 2009 Best Paper Understanding and Quantification of Die Drool Phenomenon During Polypropylene Extrusion
Viscosity Measurements
 Viscosity Measurements Modified on Monday, 27 April 2015 08:35 PM by mpieler Categorized as: Paper of the Month EMMOUNT Technologies, LLC 4329 Emerald Hill Circle Canandaigua, NY 14450 Fairport, NY 14450
Shell Balances in Fluid Mechanics
 Shell Balances in Fluid Mechanics R. Shankar Subramanian Department of Chemical and Biomolecular Engineering Clarkson University When fluid flow occurs in a single direction everywhere in a system, shell
Fluid Mechanics. du dy
 FLUID MECHANICS Technical English - I 1 th week Fluid Mechanics FLUID STATICS FLUID DYNAMICS Fluid Statics or Hydrostatics is the study of fluids at rest. The main equation required for this is Newton's
Rheology of cellulose solutions. Puu Cellulose Chemistry Michael Hummel
 Rheology of cellulose solutions Puu-23.6080 - Cellulose Chemistry Michael Hummel Contents Steady shear tests Viscous flow behavior and viscosity Newton s law Shear thinning (and critical concentration)
10 minutes reading time is allowed for this paper.
 EGT1 ENGINEERING TRIPOS PART IB Tuesday 31 May 2016 2 to 4 Paper 4 THERMOFLUID MECHANICS Answer not more than four questions. Answer not more than two questions from each section. All questions carry the
A B C November 29 Exam 3 Physics 105. σ = W m 2 K 4 L v = J/kg R = J/(K mol) c w = 4186 J/(kg K) N A = 6.
 c w = 4186 J/(kg K) N A = 6.") L 2012 November 29 Exam 3 Physics 105 Physical Constants Properties of H 2 O σ = 5.6704 10 8 W m 2 K 4 L v = 2.26 10 6 J/kg R = 8.3145 J/(K mol) c w = 4186 J/(kg K) N A = 6.0221 10 23 L f = 3.33 10 5 J/kg
L 2012 November 29 Exam 3 Physics 105 Physical Constants Properties of H 2 O σ = 5.6704 10 8 W m 2 K 4 L v = 2.26 10 6 J/kg R = 8.3145 J/(K mol) c w = 4186 J/(kg K) N A = 6.0221 10 23 L f = 3.33 10 5 J/kg
Supplemental Material for Monolithic Multilayer Microfluidics via Sacrificial Molding of 3D- Printed Isomalt. M. K. Gelber and R.
 Electronic Supplementary Material (ESI) for Lab on a Chip. This journal is The Royal Society of Chemistry 2015 Supplemental Material for Monolithic Multilayer Microfluidics via Sacrificial Molding of 3D-
2 Navier-Stokes Equations
 1 Integral analysis 1. Water enters a pipe bend horizontally with a uniform velocity, u 1 = 5 m/s. The pipe is bended at 90 so that the water leaves it vertically downwards. The input diameter d 1 = 0.1
Rheology Of Reinforced Polypropylene Melt Flow
 Rheology Of Reinforced Polypropylene Melt Flow Dr. Sadek Rejeibi, Dr.Abdelati Elalem, Dr.Omer Algydi Department of Chemical Engineering, Faculty of Engineering -Tripoli University Abstract: Different techniques
NORMAL STRESS. The simplest form of stress is normal stress/direct stress, which is the stress perpendicular to the surface on which it acts.
 NORMAL STRESS The simplest form of stress is normal stress/direct stress, which is the stress perpendicular to the surface on which it acts. σ = force/area = P/A where σ = the normal stress P = the centric
Effect of cooling channels position on the shrinkage of plastic material during injection molding
 Effect of cooling channels position on the shrinkage of plastic material during injection molding Hamdy HASSAN, Nicolas REGNIER, Eric ARQUIS, Guy DEFAYE Laboratoire TREFLE-Bordeaux1-UMR 8508, site ENSCPB,
RH7-D & RH10-D CAPILLARY RHEOMETERS
 RH7-D & RH10-D CAPILLARY RHEOMETERS RH7-D and RH10-D Advanced, pow suitable for rese Since its launch, the Rosand RH7 has set new standards in research level capillary rheometry. Today, the Rosand RH7
All rights reserved, 2011, Century Extrusion. Why simulation? Limited availability and cost of API s
 Evonik Industries 4 th International Symposium on Pharmaceutical Melt Extrusion Understanding Melt Extrusion Processes by Simulation Presented by Adam Dreiblatt Director, Process Technology All rights
Improved Approximations in Thermal Properties for Single Screw Extrusion
 Improved Approximations in Thermal Properties for Single Screw Extrusion Modified on Friday, 01 May 2015 11:49 PM by mpieler Categorized as: Paper of the Month Improved Approximations in Thermal Properties
On Relationship between PVT and Rheological Measurements of Polymer Melts
 ANNUAL TRANSACTIONS OF THE NORDIC RHEOLOGY SOCIETY, VOL. 3, 2005 On Relationship between PVT and Rheological Measurements of Polymer Melts Tomas Sedlacek, Peter Filip 2, Peter Saha Polymer Centre, Faculty
Numerical and Experimental Studies on Thermoforming Process. Sogang University
 Numerical and Experimental Studies on Thermoforming Process Thermoforming Process Hot plate Atmosphere Seal Mold Air on Air on Vacuum or atmosphere Introduction Thermoforming Process Advantage Low forming
Principles of Convection
 Principles of Convection Point Conduction & convection are similar both require the presence of a material medium. But convection requires the presence of fluid motion. Heat transfer through the: Solid
Flow Induced Molecular Weight Fractionation during Capillary Flow of Linear Polymer Melt
 Flow Induced Molecular Weight Fractionation during Capillary Flow of Linear Polymer Melt JAN MUSIL a,b and MARTIN ZATLOUKAL a,b a Centre of Polymer Systems, University Institute Tomas Bata University in
Fluid Mechanics II Viscosity and shear stresses
 Fluid Mechanics II Viscosity and shear stresses Shear stresses in a Newtonian fluid A fluid at rest can not resist shearing forces. Under the action of such forces it deforms continuously, however small
Piping Systems and Flow Analysis (Chapter 3)
") Piping Systems and Flow Analysis (Chapter 3) 2 Learning Outcomes (Chapter 3) Losses in Piping Systems Major losses Minor losses Pipe Networks Pipes in series Pipes in parallel Manifolds and Distribution
Piping Systems and Flow Analysis (Chapter 3) 2 Learning Outcomes (Chapter 3) Losses in Piping Systems Major losses Minor losses Pipe Networks Pipes in series Pipes in parallel Manifolds and Distribution
Physics 202 Exam 1. May 1, 2013
 Name: Physics 202 Exam 1 May 1, 2013 Word Problems Show all your work and circle your final answer. (Ten points each.) 1. If 2.4 m 3 of a gas initially at STP is compressed to 1.6 m 3 and its temperature
Physics 3 Summer 1990 Lab 7 - Hydrodynamics
 Physics 3 Summer 1990 Lab 7 - Hydrodynamics Theory Consider an ideal liquid, one which is incompressible and which has no internal friction, flowing through pipe of varying cross section as shown in figure
Rheometry. II.1 Introduction
 II Rheometry II.1 Introduction Structured materials are generally composed of microstructures dispersed in a homogeneous phase [30]. These materials usually have a yield stress, i.e. a threshold stress
States of matter. Density high > high >> low (pressure dependent)
") Fluids States of matter Solids Fluids crystalline amorphous liquids gasses Inter-atomic forces strong > strong >> very weak Density high > high >> low (pressure dependent) Density is an important material
Fluids States of matter Solids Fluids crystalline amorphous liquids gasses Inter-atomic forces strong > strong >> very weak Density high > high >> low (pressure dependent) Density is an important material
Hydraulic Fundamentals Hydraulics Definition Advent of Oil Hydraulics Pascal s Law Pressure
 Fluidsys Training Centre, Bangalore offers an extensive range of skill-based and industry-relevant courses in the field of Pneumatics and Hydraulics. For more details, please visit the website: https://fluidsys.org
Rheology and Viscoelasticity
 Rheology and Viscoelasticity Key learning outcomes Viscoelasticity, elastic and viscous materials Storage (E ) modulus curve Basic concepts of viscosity and deformation Stress-strain curve Newtonian, dilatant,
MECHANICAL PROPERTIES
 MECHANICAL PROPERTIES Rheology S.C. BAYNE, 1 J.Y. Thompson 2 1 University of Michigan School of Dentistry, Ann Arbor, MI 48109-1078 sbayne@umich.edu 2 Nova Southeastern College of Dental Medicine, Ft.
(Refer Slide Time: 00:58)
") Nature and Properties of Materials Professor Bishak Bhattacharya Department of Mechanical Engineering Indian Institute of Technology Kanpur Lecture 18 Effect and Glass Transition Temperature In the last
Nature and Properties of Materials Professor Bishak Bhattacharya Department of Mechanical Engineering Indian Institute of Technology Kanpur Lecture 18 Effect and Glass Transition Temperature In the last
Particle resuspension
 86 Chapter 6 Particle resuspension 6.1 Motivation In previous chapters, the relative effective viscosity of a flow with particles denser than the interstitial liquid was discussed. Such results show that
150A Review Session 2/13/2014 Fluid Statics. Pressure acts in all directions, normal to the surrounding surfaces
 Fluid Statics Pressure acts in all directions, normal to the surrounding surfaces or Whenever a pressure difference is the driving force, use gauge pressure o Bernoulli equation o Momentum balance with
Wall-Slip of Highly Filled Powder Injection Molding Compounds: Effect of Flow Channel Geometry and Roughness
 Wall-Slip of Highly Filled Powder Injection Molding Compounds: Effect of Flow Channel Geometry and Roughness Berenika Hausnerovaa,b, Daniel Sanetrnika,b, Gordana Paravanovab a Dept. of Production Engineering,
GENERAL PHYSICS (3) LABORATORY PHYS 203 LAB STUDENT MANUAL
 LABORATORY PHYS 203 LAB STUDENT MANUAL") Haifaa altoumah& Rabab Alfaraj By Haifaa altoumah& Rabab Alfaraj GENERAL PHYSICS (3) LABORATORY PHYS 203 LAB STUDENT MANUAL Name:-. ID# KING ABDULAZIZ UNIVERSITY PHYSICS DEPARMENT 1st semester 1430H Contents
Haifaa altoumah& Rabab Alfaraj By Haifaa altoumah& Rabab Alfaraj GENERAL PHYSICS (3) LABORATORY PHYS 203 LAB STUDENT MANUAL Name:-. ID# KING ABDULAZIZ UNIVERSITY PHYSICS DEPARMENT 1st semester 1430H Contents
Polymer rheology at high shear rate for microinjection moulding
 Polymer rheology at high shear rate for microinjection moulding Cheima Mnekbi, Michel Vincent, Jean-François Agassant To cite this version: Cheima Mnekbi, Michel Vincent, Jean-François Agassant. Polymer
DIFFERENCE IN THERMOFORMING PROCESSABILITY OBSERVED FOR THREE HIGH IMPACT POLYSTYRENES
 Page 1 of 5 DIFFERENCE IN THERMOFORMING PROCESSABILITY OBSERVED FOR THREE HIGH IMPACT POLYSTYRENES Caroline Woelfle, Kurt Koppi, Stephane Costeux, Todd Hogan, Joe Dooley, Ronald Van Daele, Alexander De
ME 309 Fluid Mechanics Fall 2010 Exam 2 1A. 1B.
 Fall 010 Exam 1A. 1B. Fall 010 Exam 1C. Water is flowing through a 180º bend. The inner and outer radii of the bend are 0.75 and 1.5 m, respectively. The velocity profile is approximated as C/r where C
Title: Cesa-extend a User Friendly Technology to Enhance Reprocessing and Recycling of Condensation Plastics
 GPEC 24 Paper Abstract #52: Title: Cesa-extend a User Friendly Technology to Enhance Reprocessing and Recycling of Condensation Plastics Author(s): V. Karayan, Clariant Masterbatches, and M. Villalobos,
Rheology. A Tool for Characterization of Materials and Optimization of Polymer Processing
 Rheology A Tool for Characterization of Materials and Optimization of Polymer Processing Rheology of Polymer Materials LINEAR AND NONLINEAR FLOW PROPERTIES Polymer Engineering stands for scientific and
RESEARCH PAPERS FACULTY OF MATERIALS SCIENCE AND TECHNOLOGY IN TRNAVA, SLOVAK UNIVERSITY OF TECHNOLOGY IN BRATISLAVA, 2016 Volume 24, Number 38
 RESEARCH PAPERS FACULTY OF MATERIALS SCIENCE AND TECHNOLOGY IN TRNAVA SLOVAK UNIVERSITY OF TECHNOLOGY IN BRATISLAVA 2016 Volume 24, Number 38 IMPACT OF VISCOSITY ON FILLING THE INJECTION MOULD CAVITY Lukáš
Heat Transfer in Polymers
 Industrial Advisory Group Heat Transfer in Polymers Chris Brown Date: October 16 th 2003 Introduction: why heat transfer in polymers? To help enhance productivity Faster heat transfer means better equipment
Rheology/Viscometry. Viscometry
 Viscometry Capillary viscometry is considered as the most accurate method for the determination of the viscosity of Newtonian liquids. By this technique the time is measured a certain volume needs to flow
How to measure the shear viscosity properly?
 testxpo Fachmesse für Prüftechnik 10.-13.10.2016 How to measure the shear viscosity properly? M p v Rotation Capillary Torsten Remmler, Malvern Instruments Outline How is the Shear Viscosity defined? Principle
CHANGES OF RHEOLOGICAL PARAMETERS OF POLYPROPYLENE AND POLYETHYLENE AFTER EXPOSURE IN ALIPHATIC n-hexane
 This copy of the article was downloaded from http://www.mateng.sk, online version of Materials Engineering - Materiálové inžinierstvo (MEMI) journal, ISSN 1335-0803 (print version), ISSN 1338-6174 (online
22 Which of the following correctly defines the terms stress, strain and Young modulus? stress strain Young modulus
 PhysicsndMathsTutor.com Which of the following correctly defines the terms stress, strain and Young modulus? 97/1/M/J/ stress strain Young modulus () x (area) (extension) x (original length) (stress) /
CHAPTER 1 Fluids and their Properties
 FLUID MECHANICS Gaza CHAPTER 1 Fluids and their Properties Dr. Khalil Mahmoud ALASTAL Objectives of this Chapter: Define the nature of a fluid. Show where fluid mechanics concepts are common with those
Lecture 7. Rheology. Hamid Alghurabi. Assistant Lecturer in Pharmaceutics
 Physical Pharmacy Lecture 7 Rheology Assistant Lecturer in Pharmaceutics Overview Types of flow Newtonian systems Non-Newtonian systems Thixotropy Definition Applications in formulations Determination
HIGH PRESSURE CAPILLARY RHEOMETRY ON WOOD PLASTIC COMPOSITES WITH VARIATION OF WOOD CONTENT AND MATRIX POLYMER ABSTRACT
 URN (Paper): urn:nbn:de:gbv:ilm1-2014iwk-170:9 58 th ILMENAU SCIENTIFIC COLLOQUIUM Technische Universität Ilmenau, 08 12 September 2014 URN: urn:nbn:de:gbv:ilm1-2014iwk:3 HIGH PRESSURE CAPILLARY RHEOMETRY
On the Computation of Viscosity-Shear Rate Temperature Master Curves for Polymeric Liquids
 Morehead Electronic Journal of Applicable Mathematics Issue 1 CHEM-2000-01 Copyright c 2001 On the Computation of Viscosity-Shear Rate Temperature Master Curves for Polymeric Liquids G. T. Helleloid University
2.810 Homework # 1 Revised Sept 6, 2013
 1.1: Understanding Engineering Drawings/Process Plans a) Please explain the feature control frames in the engineering drawing for the connecting link, Fig. 1.1 (attached at back). b) Sketch (hand sketch
ANALYSIS OF EXTRUSION PROBLEMS WITH FLOW SIMULATION
 Compuplast International Inc. 2010 ANALYSIS OF EXTRUSION PROBLEMS WITH FLOW SIMULATION Vijay Kudchadkar Compuplast International Inc. Objectives Demonstrate the application of CAE/CFD/Simulation towards
Notes about this lecture:
 Notes about this lecture: There is a lot of stuff on the following slides!!! Make sure you can explain what the following mean: Viscous material and elastic material; viscoelastic Flow curve Newtonian
Polymer engineering syllabus (BSc)
") Polymer engineering syllabus (BSc) First semester Math 1 Physics 1 Physics 1 lab General chemistry General chemistry lab workshop Second semester Math 2 Physics 2 Organic chemistry 1 Organic chemistry
Polymer engineering syllabus (BSc) First semester Math 1 Physics 1 Physics 1 lab General chemistry General chemistry lab workshop Second semester Math 2 Physics 2 Organic chemistry 1 Organic chemistry
MP10: Process Modelling
 MP10: Process Modelling MPhil Materials Modelling Dr James Elliott 0.1 MP10 overview 6 lectures on process modelling of metals and polymers First three lectures by JAE Introduction to polymer rheology
Dynamic Mechanical Analysis of Solid Polymers and Polymer Melts
 Polymer Physics 2015 Matilda Larsson Dynamic Mechanical Analysis of Solid Polymers and Polymer Melts Polymer & Materials Chemistry Introduction Two common instruments for dynamic mechanical thermal analysis
Rheological Characterization of Medical Thermoplastic Polyurethanes
 Rheological Characterization of Medical Thermoplastic Polyurethanes Ian Pierson, Emily Chen, Ajay D Padsalgikar Abbott, Rogers, MN Abstract The use of thermoplastic polyurethanes (TPUs) in the medical