Analytics Software. Beyond deterministic chain ladder reserves. Neil Covington Director of Solutions Management GI
|
|
|
- Abel Greene
- 6 years ago
- Views:
Transcription


1 Analytics Software Beyond deterministic chain ladder reserves Neil Covington Director of Solutions Management GI
2 Objectives 2
3 Contents 01 Background 02 Formulaic Stochastic Reserving Methods 03 Bootstrapping The Theory 04 Bootstrapping The Practice 05 Generalised Linear Models GLM 3
4 01 Background
5 Questions Do you currently calculate non-deterministic chain ladder style reserves e.g. stochastic, GLM etc.? Do you think you will calculate non-deterministic chain ladder reserves in the next 1 to 2 years? 5
6 Definition Deterministic A deterministic system is a system in which no randomness is involved in the development of future states of the system A deterministic model will thus always produce the same output from a given starting condition or initial state 6

7 Example Deterministic Basic Chain Ladder Same answer every time Run 1 Run 2 Run 3 Run 4 Run 5.. Development pattern is fixed Fixed proportional development Fixed timing Fixed tail development 7


8 Definition Stochastic Events or systems that are unpredictable due to the influence of a random variable Pertaining to chance Randomly determined Having a random probability distribution or pattern that may be analysed statistically but may not be predicted precisely 8


9 Example Stochastic Basic Chain Ladder Development pattern is is variable fixed Variable Fixed Variable Fixed tail proportional tail Variable Fixed timing development development Basic chain ladder assumes averages User often provides expert judgement in the process Sometimes curve fitting But then still just one view of the development pattern The only guarantee is that this will be wrong! 9
10 Stochastic Measure of variability Standard deviation Mean squared error Full distribution 10
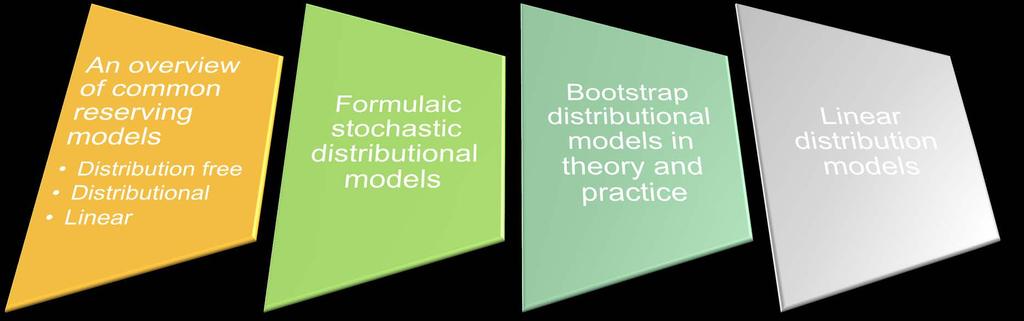
11 Reserve Models Distributional Free Models Consider incremental claim models CC ii,jj = αα ii. ββ jj No explicit distribution specified Estimators use method of moments Effectively pure deterministic methods E.g. typical chain ladder method
12 Reserve Models Distributional Models Consider incremental claim models CC ii,jj = αα ii. ββ jj Distributional Models Overdispersed Poisson Negative-binomial Log-normal Gamma Tweedie MLE s typically used to estimate parameters Can then associate stochastic variance measures, usually variance and/or mean squared error
13 Reserve Models Linear Models General linear models Not generalised linear models Special case of the generalised linear model with identity link and responses normally distributed Generalised linear models Flexible generalisation of ordinary linear regression Response variables can have error distribution models other than a normal distribution Linear model can be related to the response variable via a link function Magnitude of the variance of each measurement can be a function of its predicted value Linear regression techniques typically used to estimate
14 02 Formulaic Stochastic Reserving Methods
15 Non-Bootstrap Methods Mack Thomas Mack et al Single measure of ultimate variability, no distribution Formulaic, no simulation needed Builds on the standard ODP basic chain ladder model Well documented method 15
16 Non-Bootstrap Methods Mack Mean squared error of reserve R by origin period i: mmmmmm( 2 RR ii ) = CC ii,ii II 1 kk=ii+1 ii I represents the maximum origin, and development, period σσ kk 2 dd kk 2 1 CC ii,kk + 1 II kk jj=1 CC jj,kk Measures the average of the squares of the errors, the difference between the estimator and what is estimated, actual versus expected Similar formula for mean squared error of total reserves by origin period including a covariance adjustment Extensions, e.g. Mack with Tail 16


17 Non-Bootstrap Methods Mack Simple formulaic calculation, no need for simulations Useful non-complicating measure Only a single point value, no distribution or other values No specific defined percentile measure for the mean squared error 17
18 Non-Bootstrap Methods Merz and Wuthrich Michael Merz and Mario V. Wuthrich Builds on the work of Mack et al Mean squared error of reserve over: One development period, e.g. a year Ultimate Measure of variability, no distribution Formulaic, no simulation needed By origin period and in total Process variance and estimation variance by origin period Aggregate with covariance adjustment to get total One year measure used for Solvency II reserve risk calibration and is the prescribed USP calculation 18


19 Non-Bootstrap Methods Merz and Wuthrich Simple formulaic calculation, no need for simulations Useful non-complicating measure Single development period and ultimate measures Only a point value, no distribution No specific defined percentile measure for the mean squared error 19
20 03 Bootstrapping The Theory

21 Bootstrapping Bootstrapping usually refers to a self-starting process that is supposed to proceed without external input In computers, shortened to booting, refers to the process of loading the basic software which will then take care of loading other software as needed. Originally from putting on a boot with the help of the boot itself A bootstrap 21
22 The Theory Bootstrapping can refer to any test or metric that relies on random sampling, with replacement. Bootstrapping allows assigning measures of accuracy (defined in terms of bias, variance, confidence intervals, prediction error or some other such measure) to sample estimates. This technique allows estimation of the sampling distribution of almost any statistic using random sampling methods. Generally, it falls in the broader class of resampling methods. 22
23 The Theory Bootstrapping is the practice of estimating properties of an estimator (such as its variance) by measuring those properties when sampling from an approximating distribution. One standard choice for an approximating distribution is the empirical distribution function of the observed data. In the case where a set of observations can be assumed to be from an independent and identically distributed population, this can be implemented by constructing a number of resamples with replacement, of the observed dataset 23

24 The Challenge 24
25 Common Bootstrap ODP Model An incremental loss type model Incremental losses CC ii,jj by origin period i and development period j are independent Incremental losses CC ii,jj are related: CC ii,jj = αα ii. ββ jj There is a constant variance to mean ratio, σσ 2 Note: Poisson distribution mean = variance Overdispersed Poisson distribution mean variance with the ratio being the dispersion parameter 25
26 Common Bootstrap ODP Model For the basic chain ladder, cumulative claims DD ii,jj : DD ii,jj = DD ii,kkii. dd jj To date amount times cumulative development factor dd jj = jj aaaa mm mm=kk ii +1 Cumulative development factor is the product of age to age, link ratio, factors aaaa mm Hence incremental claims CC ii,jj = DD ii,jj DD ii,jj 1 = DD ii,kkii. dd jj dd jj 1 = αα ii. ββ jj αα ii = DD ii,kkii ββ jj = dd jj dd jj 1 26
27 Common Bootstrap ODP Model So CC ii,jj = αα ii. ββ jj as required EE CC ii,jj = DD ii,kkii. dd jj dd jj 1 VVVVVV CC ii,jj = σσ 2. EE CC ii,jj αα ii = DD ii,kkii and ββ jj = dd jj dd jj 1 are estimated straight from the basic chain ladder calculations Variance proportional to the mean defines an ODP distribution, σσ 2 being the dispersion parameter 27


28 Types of Bootstrap Non-Parametric Empirical residuals distribution Does not require a distributional assumption Just uses the data itself Works best for larger samples Parametric Theoretical residuals distribution e.g., ODP or Normal distributions are common Mean and variance parameters selected based on the original data 28
29 Residuals Typical unscaled residual is based on Pearson s Residual εε ii,jj = CC ii,jj CC ii,jj CC ii,jj Actual less expected as a proportion of the square root of expected The set of residuals εε ii,jj then forms the sample distribution: Used directly as the residuals distribution, an empirical distribution Fitted to an appropriate standard distribution, e.g. ODP or normal, using the sample mean and variance 29
30 Residuals Bias Correction Residuals can further be scaled to correct for bias εε aaaaaa ii,jj = εε ii,jj. nn nn pp Where: n is the number of observations, the size of the residuals triangle p the number of parameters estimated, the number of origin and development periods 30
31 Residuals Process Variance Process variance can be estimated as: Where: n is the number of observations p the number of parameters estimated σσ 2 = 1 nn pp. ii,jj 2 εε ii,jj 31

32 Residuals Selections Residuals can be selected, in turn adjusting the residual distribution Individual residuals can be ignored, for example, the maximum and minimum Residuals can be grouped for sampling, for example, use the tail group residuals for the tail only Group 1 Group 2 32
33 04 Bootstrapping The Practice
34 Bootstrapping Process Cumulative Claims Start with the cumulative claims triangle Cumulative Claims
35 Bootstrapping Process Development Pattern Calculate the usual development pattern Include any adjustments as usual Example here is a simple average of all values Development Factors Average
36 Bootstrapping Process Developed Claims Calculate developed claims in the usual way and hence the usual BCL reserves Developed Claims Actual Reserve
37 Bootstrapping Process Expected Cumulative Claims Calculate expected past cumulative claims using the development pattern Start with the latest, to date, value and apply the development pattern in reverse What previous claim would have given rise to this one For example 130 = 132 / Expected Cumulative Claims Development Factors Average
38 Bootstrapping Process Incremental Claims Convert cumulative actual and expected claims to incremental claims Actual Incremental Claims Expected Incremental Claims
39 Bootstrapping Process Unscaled Pearson Residual Calculate unscaled Pearson residual εε ii,jj = CC ii,jj CC ii,jj CC ii,jj Actual less expected divided by the square root of expected Pearsons Unscaled Residual
40 Bootstrapping Process Empirical Residual Distribution These 10 residuals then form our empirical distribution Note you would usually look to have a fuller sample, e.g. 100 or more Empirical Residual Distribution
41 Bootstrapping Process Simulated Residual Triangle Through sampling from the residual distribution, with replacement, randomly populate a new simulated residual triangle Empirical Residual Distribution Simulated Residuals

42 Bootstrapping Process Simulated Incremental Claims Using the same expected claims, reverse the residual calculation to generate simulated actual claims CC ii,jj = CC ii,jj + εε ii,jj. CC ii,jj Simulated actual claims equals expected claims plus the residual times the square root of the expected claims Simulated Incremental Claims
43 Bootstrapping Process Simulated Cumulative Claims Calculate cumulative simulated claims from the incremental claims Simulated Cumulative Claims
44 Bootstrapping Process Simulated Development Pattern Calculate a usual development pattern Adjustments not typically included further Example is again a simple average Development Factors
45 Bootstrapping Process Developed Simulated Claims Calculate developed simulated claims in the usual way and hence the usual BCL reserves Developed Claims Simulated Reserve


46 Bootstrapping Process We now have two results for claim reserves One from actual claims One from simulated claims Actual Reserve Simulated Reserve Now repeat from the simulating residual triangle step to produce another simulated claim reserve, and another, and another. 46
47 Bootstrapping Process So what? 47
48 Bootstrapping Process Using Results Examples Mean 94.6 Coefficient of variance 8.7% 75 th percentile th percentile th to 75 th percentile confidence interval 88.8 to or -6.1% to +5.9% of the mean 48

49 Bootstrapping Process So what? 49
50 Bootstrapping Process Using Results Examples The Science Mean 94.6 Coefficient of variance 8.7%, approx. 83 rd percentile The English Best estimate, expected value 75 th percentile 100.1, +5.9% of mean Prudent estimate 1 in 4 year level Average difference to mean measure How stable is the estimate? 99.5 th percentile 116.5, +23.2% mean Extreme, 1 in 200 year, estimate How bad could it get? 25 th to 75 th percentile confidence interval 88.8 to 100.1, -6.1% to +5.9% of the mean A likely range 50% chance it will be in this range Use them as a tool to inform and assist with your work 50
51 Bootstrapping Process Common Misuses There are no guarantees, these are simulations only Don t be fooled into a false sense of security Use them as an informative tool only, an extra piece of information to help you The statistics, e.g. coefficient of variation, only apply to this data set A common mis-use is to run a simulation on one dataset and then use the statistics, e.g. coefficient of variation, on another data set 51
52 05 Generalised Linear Models GLM
53 GLM in Reserving Not a new concept Papers going back to early 2000 s Not a new concept Different ways to use it.
54 What is a GLM? Standard definition The GLM consists of three elements: A probability distribution from the exponential family, error distribution A linear predictor η = Xβ, dependent variable A link function g such that E(Y) = μ = g 1(η) 54
55 GLM Link Function A standard linear model has an additive form: response = constant + f factor 1 + f factor f factor n (f factor i is a function whose value depends on the level of factor i, e.g. you might have f sex = 0.00 if sex=male and if sex=female.) Generalised linear models allow you to apply a 'link function' to change the structure of the model you are analysing. Typical link functions include: log function inverse function square root function logistic function Taking the simple example of the log link function, if you have a response which you want to model according to a multiplicative model, i.e. : response = constant f factor 1 f factor 2... f factor n By taking logs, you end up with: log(response) = log(constant f factor 1 f factor 2... f factor n ) = log(constant) + log(f factor 1 ) + log(f factor 2 ) log(f factor n ) Hence a linear model again 55
56 GLM Error Distribution Going hand-in-hand with the choice of link function is the choice of error distribution. Common link functions and error distribution combinations include: Error Distribution Link Function Common Usage Normal Identity Standard additive linear model, the general linear model Poisson Log Model the number of times something happens using a multiplicative structure Gamma Log Model amounts (>0) using a multiplicative structure Binomial Logistic Model a probability (constrained to be between 0 and 1) 56
57 GLM Dependent Variable The dependent variable, or response, is the variable you are trying to model, i.e. the variable which depends on the values of the analysis factors, e.g. a reserve. This factor is usually one of the following: a 0/1 flag or a probability, in which case use the binomial-logistic model structure a number of events, in which case use the poisson-log model structure a (positive) amount, in which case use the gamma-log model structure 57
58 GLM Just another distribution? Basically yes Linear model compared to a statistical distribution But reduces the number of parameters, effectively the dimensions of the random vector Typical multiplicative model CC ii,jj = αα ii. ββ jj (I+1).(J+1) unknown parameters C i,j GLM additive form model I+J+1 unknown parameters α i and β j [(I+1)+(J+1) with typical normalisation constraint α 0 =1 hence log(α 0 )=0] MLE s for GLM model can be shown to be the same as usual distributional models This time solve the system of equations for α i and β j using GLM software and techniques 58

59 GLM Extension Operational Time Remember the usual incremental claim assumptions Independent origin period and development period effects What about operational time? Development Origin
60 Operational Times Solutions Inflation adjustments Berquist Sherman adjustment rate Cape Cod decay factor Chain ladder Adjusted for operational time has form CC ii,jj = αα ii. ββ jj CC ii,jj = αα ii. ββ jj. γγ ii+jj 60
61 Operational Times Solutions GLM model can easily incorporate and solve for operational time factor CC ii,jj = αα ii. ββ jj. γγ ii+jj Other factors. Integrate other risk factors too? 61

62 06 Summary
63 Use reserve models to help supplement your experience and knowledge You should always know your business better than any model can
64 64
Claims Reserving under Solvency II
 Claims Reserving under Solvency II Mario V. Wüthrich RiskLab, ETH Zurich Swiss Finance Institute Professor joint work with Michael Merz (University of Hamburg) April 21, 2016 European Congress of Actuaries,
Bootstrapping the triangles
 Bootstrapping the triangles Prečo, kedy a ako (NE)bootstrapovat v trojuholníkoch? Michal Pešta Charles University in Prague Faculty of Mathematics and Physics Actuarial Seminar, Prague 19 October 01 Overview
DELTA METHOD and RESERVING
 XXXVI th ASTIN COLLOQUIUM Zurich, 4 6 September 2005 DELTA METHOD and RESERVING C.PARTRAT, Lyon 1 university (ISFA) N.PEY, AXA Canada J.SCHILLING, GIE AXA Introduction Presentation of methods based on
Prediction Uncertainty in the Bornhuetter-Ferguson Claims Reserving Method: Revisited
 Prediction Uncertainty in the Bornhuetter-Ferguson Claims Reserving Method: Revisited Daniel H. Alai 1 Michael Merz 2 Mario V. Wüthrich 3 Department of Mathematics, ETH Zurich, 8092 Zurich, Switzerland
Statistics Boot Camp. Dr. Stephanie Lane Institute for Defense Analyses DATAWorks 2018
 Statistics Boot Camp Dr. Stephanie Lane Institute for Defense Analyses DATAWorks 2018 March 21, 2018 Outline of boot camp Summarizing and simplifying data Point and interval estimation Foundations of statistical
GARY G. VENTER 1. CHAIN LADDER VARIANCE FORMULA
 DISCUSSION OF THE MEAN SQUARE ERROR OF PREDICTION IN THE CHAIN LADDER RESERVING METHOD BY GARY G. VENTER 1. CHAIN LADDER VARIANCE FORMULA For a dozen or so years the chain ladder models of Murphy and Mack
Calendar Year Dependence Modeling in Run-Off Triangles
 Calendar Year Dependence Modeling in Run-Off Triangles Mario V. Wüthrich RiskLab, ETH Zurich May 21-24, 2013 ASTIN Colloquium The Hague www.math.ethz.ch/ wueth Claims reserves at time I = 2010 accident
On the Importance of Dispersion Modeling for Claims Reserving: Application of the Double GLM Theory
 On the Importance of Dispersion Modeling for Claims Reserving: Application of the Double GLM Theory Danaïl Davidov under the supervision of Jean-Philippe Boucher Département de mathématiques Université
Semiparametric Generalized Linear Models
 Semiparametric Generalized Linear Models North American Stata Users Group Meeting Chicago, Illinois Paul Rathouz Department of Health Studies University of Chicago prathouz@uchicago.edu Liping Gao MS Student
New Statistical Methods That Improve on MLE and GLM Including for Reserve Modeling GARY G VENTER
 New Statistical Methods That Improve on MLE and GLM Including for Reserve Modeling GARY G VENTER MLE Going the Way of the Buggy Whip Used to be gold standard of statistical estimation Minimum variance
Chain ladder with random effects
 Greg Fry Consulting Actuaries Sydney Australia Astin Colloquium, The Hague 21-24 May 2013 Overview Fixed effects models Families of chain ladder models Maximum likelihood estimators Random effects models
ONE-YEAR AND TOTAL RUN-OFF RESERVE RISK ESTIMATORS BASED ON HISTORICAL ULTIMATE ESTIMATES
 FILIPPO SIEGENTHALER / filippo78@bluewin.ch 1 ONE-YEAR AND TOTAL RUN-OFF RESERVE RISK ESTIMATORS BASED ON HISTORICAL ULTIMATE ESTIMATES ABSTRACT In this contribution we present closed-form formulas in
Parametric Modelling of Over-dispersed Count Data. Part III / MMath (Applied Statistics) 1
 1") Parametric Modelling of Over-dispersed Count Data Part III / MMath (Applied Statistics) 1 Introduction Poisson regression is the de facto approach for handling count data What happens then when Poisson
Parametric Modelling of Over-dispersed Count Data Part III / MMath (Applied Statistics) 1 Introduction Poisson regression is the de facto approach for handling count data What happens then when Poisson
Lecture 3. STAT161/261 Introduction to Pattern Recognition and Machine Learning Spring 2018 Prof. Allie Fletcher
 Lecture 3 STAT161/261 Introduction to Pattern Recognition and Machine Learning Spring 2018 Prof. Allie Fletcher Previous lectures What is machine learning? Objectives of machine learning Supervised and
Multiple Regression Analysis: Inference ECONOMETRICS (ECON 360) BEN VAN KAMMEN, PHD
 BEN VAN KAMMEN, PHD") Multiple Regression Analysis: Inference ECONOMETRICS (ECON 360) BEN VAN KAMMEN, PHD Introduction When you perform statistical inference, you are primarily doing one of two things: Estimating the boundaries
Multiple Regression Analysis: Inference ECONOMETRICS (ECON 360) BEN VAN KAMMEN, PHD Introduction When you perform statistical inference, you are primarily doing one of two things: Estimating the boundaries
Greg Taylor. Taylor Fry Consulting Actuaries University of Melbourne University of New South Wales. CAS Spring meeting Phoenix Arizona May 2012
 Chain ladder correlations Greg Taylor Taylor Fry Consulting Actuaries University of Melbourne University of New South Wales CAS Spring meeting Phoenix Arizona 0-3 May 0 Overview The chain ladder produces
A Loss Reserving Method for Incomplete Claim Data
 A Loss Reserving Method for Incomplete Claim Data René Dahms Bâloise, Aeschengraben 21, CH-4002 Basel renedahms@baloisech June 11, 2008 Abstract A stochastic model of an additive loss reserving method
Subject CS1 Actuarial Statistics 1 Core Principles
 Institute of Actuaries of India Subject CS1 Actuarial Statistics 1 Core Principles For 2019 Examinations Aim The aim of the Actuarial Statistics 1 subject is to provide a grounding in mathematical and
Variations. ECE 6540, Lecture 02 Multivariate Random Variables & Linear Algebra
 Variations ECE 6540, Lecture 02 Multivariate Random Variables & Linear Algebra Last Time Probability Density Functions Normal Distribution Expectation / Expectation of a function Independence Uncorrelated
A strategy for modelling count data which may have extra zeros
 A strategy for modelling count data which may have extra zeros Alan Welsh Centre for Mathematics and its Applications Australian National University The Data Response is the number of Leadbeater s possum
Heteroskedasticity ECONOMETRICS (ECON 360) BEN VAN KAMMEN, PHD
 BEN VAN KAMMEN, PHD") Heteroskedasticity ECONOMETRICS (ECON 360) BEN VAN KAMMEN, PHD Introduction For pedagogical reasons, OLS is presented initially under strong simplifying assumptions. One of these is homoskedastic errors,
Heteroskedasticity ECONOMETRICS (ECON 360) BEN VAN KAMMEN, PHD Introduction For pedagogical reasons, OLS is presented initially under strong simplifying assumptions. One of these is homoskedastic errors,
Lattice Data. Tonglin Zhang. Spatial Statistics for Point and Lattice Data (Part III)
") Title: Spatial Statistics for Point Processes and Lattice Data (Part III) Lattice Data Tonglin Zhang Outline Description Research Problems Global Clustering and Local Clusters Permutation Test Spatial
Title: Spatial Statistics for Point Processes and Lattice Data (Part III) Lattice Data Tonglin Zhang Outline Description Research Problems Global Clustering and Local Clusters Permutation Test Spatial
Exam Applied Statistical Regression. Good Luck!
 Dr. M. Dettling Summer 2011 Exam Applied Statistical Regression Approved: Tables: Note: Any written material, calculator (without communication facility). Attached. All tests have to be done at the 5%-level.
Mohammed. Research in Pharmacoepidemiology National School of Pharmacy, University of Otago
 Mohammed Research in Pharmacoepidemiology (RIPE) @ National School of Pharmacy, University of Otago What is zero inflation? Suppose you want to study hippos and the effect of habitat variables on their
Stat 5101 Lecture Notes
 Stat 5101 Lecture Notes Charles J. Geyer Copyright 1998, 1999, 2000, 2001 by Charles J. Geyer May 7, 2001 ii Stat 5101 (Geyer) Course Notes Contents 1 Random Variables and Change of Variables 1 1.1 Random
PL-2 The Matrix Inverted: A Primer in GLM Theory
 PL-2 The Matrix Inverted: A Primer in GLM Theory 2005 CAS Seminar on Ratemaking Claudine Modlin, FCAS Watson Wyatt Insurance & Financial Services, Inc W W W. W A T S O N W Y A T T. C O M / I N S U R A
Introduction to General and Generalized Linear Models
 Introduction to General and Generalized Linear Models Generalized Linear Models - part II Henrik Madsen Poul Thyregod Informatics and Mathematical Modelling Technical University of Denmark DK-2800 Kgs.
Conditional Least Squares and Copulae in Claims Reserving for a Single Line of Business
 Conditional Least Squares and Copulae in Claims Reserving for a Single Line of Business Michal Pešta Charles University in Prague Faculty of Mathematics and Physics Ostap Okhrin Dresden University of Technology
Now consider the case where E(Y) = µ = Xβ and V (Y) = σ 2 G, where G is diagonal, but unknown.
 = µ = Xβ and V (Y) = σ 2 G, where G is diagonal, but unknown.") Weighting We have seen that if E(Y) = Xβ and V (Y) = σ 2 G, where G is known, the model can be rewritten as a linear model. This is known as generalized least squares or, if G is diagonal, with trace(g)
Weighting We have seen that if E(Y) = Xβ and V (Y) = σ 2 G, where G is known, the model can be rewritten as a linear model. This is known as generalized least squares or, if G is diagonal, with trace(g)
STATS216v Introduction to Statistical Learning Stanford University, Summer Midterm Exam (Solutions) Duration: 1 hours
 Duration: 1 hours") Instructions: STATS216v Introduction to Statistical Learning Stanford University, Summer 2017 Remember the university honor code. Midterm Exam (Solutions) Duration: 1 hours Write your name and SUNet ID
Instructions: STATS216v Introduction to Statistical Learning Stanford University, Summer 2017 Remember the university honor code. Midterm Exam (Solutions) Duration: 1 hours Write your name and SUNet ID
A Practitioner s Guide to Generalized Linear Models
 A Practitioners Guide to Generalized Linear Models Background The classical linear models and most of the minimum bias procedures are special cases of generalized linear models (GLMs). GLMs are more technically
Generalized Linear Models (GLZ)
") Generalized Linear Models (GLZ) Generalized Linear Models (GLZ) are an extension of the linear modeling process that allows models to be fit to data that follow probability distributions other than the
Generalized Linear Models (GLZ) Generalized Linear Models (GLZ) are an extension of the linear modeling process that allows models to be fit to data that follow probability distributions other than the
Linear Methods for Prediction
 Chapter 5 Linear Methods for Prediction 5.1 Introduction We now revisit the classification problem and focus on linear methods. Since our prediction Ĝ(x) will always take values in the discrete set G we
Generalized Linear Models Introduction
 Generalized Linear Models Introduction Statistics 135 Autumn 2005 Copyright c 2005 by Mark E. Irwin Generalized Linear Models For many problems, standard linear regression approaches don t work. Sometimes,
appstats27.notebook April 06, 2017
 Chapter 27 Objective Students will conduct inference on regression and analyze data to write a conclusion. Inferences for Regression An Example: Body Fat and Waist Size pg 634 Our chapter example revolves
STAT5044: Regression and Anova
 STAT5044: Regression and Anova Inyoung Kim 1 / 18 Outline 1 Logistic regression for Binary data 2 Poisson regression for Count data 2 / 18 GLM Let Y denote a binary response variable. Each observation
Chapter 27 Summary Inferences for Regression
 Chapter 7 Summary Inferences for Regression What have we learned? We have now applied inference to regression models. Like in all inference situations, there are conditions that we must check. We can test
Review. Timothy Hanson. Department of Statistics, University of South Carolina. Stat 770: Categorical Data Analysis
 Review Timothy Hanson Department of Statistics, University of South Carolina Stat 770: Categorical Data Analysis 1 / 22 Chapter 1: background Nominal, ordinal, interval data. Distributions: Poisson, binomial,
Non-Life Insurance: Mathematics and Statistics
 Exercise sheet 1 Exercise 1.1 Discrete Distribution Suppose the random variable N follows a geometric distribution with parameter p œ (0, 1), i.e. ; (1 p) P[N = k] = k 1 p if k œ N \{0}, 0 else. (a) Show
STA216: Generalized Linear Models. Lecture 1. Review and Introduction
 STA216: Generalized Linear Models Lecture 1. Review and Introduction Let y 1,..., y n denote n independent observations on a response Treat y i as a realization of a random variable Y i In the general
Lecture 3: Autoregressive Moving Average (ARMA) Models and their Practical Applications
 Models and their Practical Applications") Lecture 3: Autoregressive Moving Average (ARMA) Models and their Practical Applications Prof. Massimo Guidolin 20192 Financial Econometrics Winter/Spring 2018 Overview Moving average processes Autoregressive
Lecture 3: Autoregressive Moving Average (ARMA) Models and their Practical Applications Prof. Massimo Guidolin 20192 Financial Econometrics Winter/Spring 2018 Overview Moving average processes Autoregressive
Stat/F&W Ecol/Hort 572 Review Points Ané, Spring 2010
 1 Linear models Y = Xβ + ɛ with ɛ N (0, σ 2 e) or Y N (Xβ, σ 2 e) where the model matrix X contains the information on predictors and β includes all coefficients (intercept, slope(s) etc.). 1. Number of
MA 575 Linear Models: Cedric E. Ginestet, Boston University Non-parametric Inference, Polynomial Regression Week 9, Lecture 2
 MA 575 Linear Models: Cedric E. Ginestet, Boston University Non-parametric Inference, Polynomial Regression Week 9, Lecture 2 1 Bootstrapped Bias and CIs Given a multiple regression model with mean and
Prediction Intervals for Functional Data
 Montclair State University Montclair State University Digital Commons Theses, Dissertations and Culminating Projects 1-2018 Prediction Intervals for Functional Data Nicholas Rios Montclair State University
STA 4504/5503 Sample Exam 1 Spring 2011 Categorical Data Analysis. 1. Indicate whether each of the following is true (T) or false (F).
 or false (F).") STA 4504/5503 Sample Exam 1 Spring 2011 Categorical Data Analysis 1. Indicate whether each of the following is true (T) or false (F). (a) T In 2 2 tables, statistical independence is equivalent to a population
STA 4504/5503 Sample Exam 1 Spring 2011 Categorical Data Analysis 1. Indicate whether each of the following is true (T) or false (F). (a) T In 2 2 tables, statistical independence is equivalent to a population
Proportional hazards regression
 Proportional hazards regression Patrick Breheny October 8 Patrick Breheny Survival Data Analysis (BIOS 7210) 1/28 Introduction The model Solving for the MLE Inference Today we will begin discussing regression
CS145: INTRODUCTION TO DATA MINING
 CS145: INTRODUCTION TO DATA MINING 2: Vector Data: Prediction Instructor: Yizhou Sun yzsun@cs.ucla.edu October 8, 2018 TA Office Hour Time Change Junheng Hao: Tuesday 1-3pm Yunsheng Bai: Thursday 1-3pm
Fisheries, Population Dynamics, And Modelling p. 1 The Formulation Of Fish Population Dynamics p. 1 Equilibrium vs. Non-Equilibrium p.
 Fisheries, Population Dynamics, And Modelling p. 1 The Formulation Of Fish Population Dynamics p. 1 Equilibrium vs. Non-Equilibrium p. 4 Characteristics Of Mathematical Models p. 6 General Properties p.
Lecture 16 Solving GLMs via IRWLS
 Lecture 16 Solving GLMs via IRWLS 09 November 2015 Taylor B. Arnold Yale Statistics STAT 312/612 Notes problem set 5 posted; due next class problem set 6, November 18th Goals for today fixed PCA example
General Linear Models. with General Linear Hypothesis Tests and Likelihood Ratio Tests
 General Linear Models with General Linear Hypothesis Tests and Likelihood Ratio Tests 1 Background Linear combinations of Normals are Normal XX nn ~ NN μμ, ΣΣ AAAA ~ NN AAμμ, AAAAAA A sum of squared, standardized
Statistics: A review. Why statistics?
 Statistics: A review Why statistics? What statistical concepts should we know? Why statistics? To summarize, to explore, to look for relations, to predict What kinds of data exist? Nominal, Ordinal, Interval
SPRINT Multi-Objective Model Racing
 SPRINT Multi-Objective Model Racing Tiantian Zhang, Michael Georgiopoulos, Georgios C. Anagnostopoulos Machine Learning Lab University of Central Florida Overview Racing Algorithms Multi-objective Model
Reserving for multiple excess layers
 Reserving for multiple excess layers Ben Zehnwirth and Glen Barnett Abstract Patterns and changing trends among several excess-type layers on the same business tend to be closely related. The changes in
Poisson regression: Further topics
 Poisson regression: Further topics April 21 Overdispersion One of the defining characteristics of Poisson regression is its lack of a scale parameter: E(Y ) = Var(Y ), and no parameter is available to
Statistical Methods III Statistics 212. Problem Set 2 - Answer Key
 Statistical Methods III Statistics 212 Problem Set 2 - Answer Key 1. (Analysis to be turned in and discussed on Tuesday, April 24th) The data for this problem are taken from long-term followup of 1423
Reparametrization of COM-Poisson Regression Models with Applications in the Analysis of Experimental Count Data
 Reparametrization of COM-Poisson Regression Models with Applications in the Analysis of Experimental Count Data Eduardo Elias Ribeiro Junior 1 2 Walmes Marques Zeviani 1 Wagner Hugo Bonat 1 Clarice Garcia
Tests for the Odds Ratio of Two Proportions in a 2x2 Cross-Over Design
 Chapter 170 Tests for the Odds Ratio of Two Proportions in a 2x2 Cross-Over Design Introduction Senn (2002) defines a cross-over design as one in which each subject receives all treatments and the objective
UNIVERSITY OF TORONTO Faculty of Arts and Science
 UNIVERSITY OF TORONTO Faculty of Arts and Science December 2013 Final Examination STA442H1F/2101HF Methods of Applied Statistics Jerry Brunner Duration - 3 hours Aids: Calculator Model(s): Any calculator
Various Extensions Based on Munich Chain Ladder Method
 Various Extensions Based on Munich Chain Ladder Method etr Jedlička Charles University, Department of Statistics 20th June 2007, 50th Anniversary ASTIN Colloquium etr Jedlička (UK MFF) Various Extensions
12 Generalized linear models
 12 Generalized linear models In this chapter, we combine regression models with other parametric probability models like the binomial and Poisson distributions. Binary responses In many situations, we
Generalized Linear. Mixed Models. Methods and Applications. Modern Concepts, Walter W. Stroup. Texts in Statistical Science.
 Texts in Statistical Science Generalized Linear Mixed Models Modern Concepts, Methods and Applications Walter W. Stroup CRC Press Taylor & Francis Croup Boca Raton London New York CRC Press is an imprint
Modeling Longitudinal Count Data with Excess Zeros and Time-Dependent Covariates: Application to Drug Use
 Modeling Longitudinal Count Data with Excess Zeros and : Application to Drug Use University of Northern Colorado November 17, 2014 Presentation Outline I and Data Issues II Correlated Count Regression
Prediction of Bike Rental using Model Reuse Strategy
 Prediction of Bike Rental using Model Reuse Strategy Arun Bala Subramaniyan and Rong Pan School of Computing, Informatics, Decision Systems Engineering, Arizona State University, Tempe, USA. {bsarun, rong.pan}@asu.edu
Generalized Linear Models. Kurt Hornik
 Generalized Linear Models Kurt Hornik Motivation Assuming normality, the linear model y = Xβ + e has y = β + ε, ε N(0, σ 2 ) such that y N(μ, σ 2 ), E(y ) = μ = β. Various generalizations, including general
SC705: Advanced Statistics Instructor: Natasha Sarkisian Class notes: Introduction to Structural Equation Modeling (SEM)
") SC705: Advanced Statistics Instructor: Natasha Sarkisian Class notes: Introduction to Structural Equation Modeling (SEM) SEM is a family of statistical techniques which builds upon multiple regression,
SC705: Advanced Statistics Instructor: Natasha Sarkisian Class notes: Introduction to Structural Equation Modeling (SEM) SEM is a family of statistical techniques which builds upon multiple regression,
Multinomial Logistic Regression Model for Predicting Tornado Intensity Based on Path Length and Width
 World Environment 2014, 4(2): 61-66 DOI: 10.5923/j.env.20140402.02 Multinomial Logistic Regression Model for Predicting Caleb Michael Akers, Nathaniel John Smith, Naima Shifa * DePauw University, Greencastle,
Achilles: Now I know how powerful computers are going to become!
 A Sigmoid Dialogue By Anders Sandberg Achilles: Now I know how powerful computers are going to become! Tortoise: How? Achilles: I did curve fitting to Moore s law. I know you are going to object that technological
STAT 135 Lab 5 Bootstrapping and Hypothesis Testing
 STAT 135 Lab 5 Bootstrapping and Hypothesis Testing Rebecca Barter March 2, 2015 The Bootstrap Bootstrap Suppose that we are interested in estimating a parameter θ from some population with members x 1,...,
Generalised linear models. Response variable can take a number of different formats
 Generalised linear models Response variable can take a number of different formats Structure Limitations of linear models and GLM theory GLM for count data GLM for presence \ absence data GLM for proportion
Generalized linear mixed models (GLMMs) for dependent compound risk models
 for dependent compound risk models") Generalized linear mixed models (GLMMs) for dependent compound risk models Emiliano A. Valdez joint work with H. Jeong, J. Ahn and S. Park University of Connecticut 52nd Actuarial Research Conference Georgia
Generalized linear mixed models (GLMMs) for dependent compound risk models Emiliano A. Valdez joint work with H. Jeong, J. Ahn and S. Park University of Connecticut 52nd Actuarial Research Conference Georgia
Passing-Bablok Regression for Method Comparison
 Chapter 313 Passing-Bablok Regression for Method Comparison Introduction Passing-Bablok regression for method comparison is a robust, nonparametric method for fitting a straight line to two-dimensional
General Regression Model
 Scott S. Emerson, M.D., Ph.D. Department of Biostatistics, University of Washington, Seattle, WA 98195, USA January 5, 2015 Abstract Regression analysis can be viewed as an extension of two sample statistical
Varieties of Count Data
 CHAPTER 1 Varieties of Count Data SOME POINTS OF DISCUSSION What are counts? What are count data? What is a linear statistical model? What is the relationship between a probability distribution function
Class Notes: Week 8. Probit versus Logit Link Functions and Count Data
 Ronald Heck Class Notes: Week 8 1 Class Notes: Week 8 Probit versus Logit Link Functions and Count Data This week we ll take up a couple of issues. The first is working with a probit link function. While
STA 4504/5503 Sample Exam 1 Spring 2011 Categorical Data Analysis. 1. Indicate whether each of the following is true (T) or false (F).
 or false (F).") STA 4504/5503 Sample Exam 1 Spring 2011 Categorical Data Analysis 1. Indicate whether each of the following is true (T) or false (F). (a) (b) (c) (d) (e) In 2 2 tables, statistical independence is equivalent
STA 4504/5503 Sample Exam 1 Spring 2011 Categorical Data Analysis 1. Indicate whether each of the following is true (T) or false (F). (a) (b) (c) (d) (e) In 2 2 tables, statistical independence is equivalent
CS 361: Probability & Statistics
 March 14, 2018 CS 361: Probability & Statistics Inference The prior From Bayes rule, we know that we can express our function of interest as Likelihood Prior Posterior The right hand side contains the
Outline of GLMs. Definitions
 Outline of GLMs Definitions This is a short outline of GLM details, adapted from the book Nonparametric Regression and Generalized Linear Models, by Green and Silverman. The responses Y i have density
Comparing Different Estimators of Reliability Function for Proposed Probability Distribution
 American Journal of Mathematics and Statistics 21, (2): 84-94 DOI: 192/j.ajms.212. Comparing Different Estimators of Reliability Function for Proposed Probability Distribution Dhwyia S. Hassun 1, Nathie
Generalized linear mixed models for dependent compound risk models
 Generalized linear mixed models for dependent compound risk models Emiliano A. Valdez joint work with H. Jeong, J. Ahn and S. Park University of Connecticut ASTIN/AFIR Colloquium 2017 Panama City, Panama
Generalized Linear Models. Last time: Background & motivation for moving beyond linear
 Generalized Linear Models Last time: Background & motivation for moving beyond linear regression - non-normal/non-linear cases, binary, categorical data Today s class: 1. Examples of count and ordered
11. Generalized Linear Models: An Introduction
 Sociology 740 John Fox Lecture Notes 11. Generalized Linear Models: An Introduction Copyright 2014 by John Fox Generalized Linear Models: An Introduction 1 1. Introduction I A synthesis due to Nelder and
Analysis of Survival Data Using Cox Model (Continuous Type)
") Australian Journal of Basic and Alied Sciences, 7(0): 60-607, 03 ISSN 99-878 Analysis of Survival Data Using Cox Model (Continuous Type) Khawla Mustafa Sadiq Department of Mathematics, Education College,
Australian Journal of Basic and Alied Sciences, 7(0): 60-607, 03 ISSN 99-878 Analysis of Survival Data Using Cox Model (Continuous Type) Khawla Mustafa Sadiq Department of Mathematics, Education College,
A HOMOTOPY CLASS OF SEMI-RECURSIVE CHAIN LADDER MODELS
 A HOMOTOPY CLASS OF SEMI-RECURSIVE CHAIN LADDER MODELS Greg Taylor Taylor Fry Consulting Actuaries Level, 55 Clarence Street Sydney NSW 2000 Australia Professorial Associate Centre for Actuarial Studies
Stochastic Incremental Approach for Modelling the Claims Reserves
 International Mathematical Forum, Vol. 8, 2013, no. 17, 807-828 HIKARI Ltd, www.m-hikari.com Stochastic Incremental Approach for Modelling the Claims Reserves Ilyes Chorfi Department of Mathematics University
CSE 417T: Introduction to Machine Learning. Final Review. Henry Chai 12/4/18
 CSE 417T: Introduction to Machine Learning Final Review Henry Chai 12/4/18 Overfitting Overfitting is fitting the training data more than is warranted Fitting noise rather than signal 2 Estimating! "#$
Generalized Linear Models for Non-Normal Data
 Generalized Linear Models for Non-Normal Data Today s Class: 3 parts of a generalized model Models for binary outcomes Complications for generalized multivariate or multilevel models SPLH 861: Lecture
Linear Methods for Prediction
 This work is licensed under a Creative Commons Attribution-NonCommercial-ShareAlike License. Your use of this material constitutes acceptance of that license and the conditions of use of materials on this
High-Throughput Sequencing Course
 High-Throughput Sequencing Course DESeq Model for RNA-Seq Biostatistics and Bioinformatics Summer 2017 Outline Review: Standard linear regression model (e.g., to model gene expression as function of an
Generalized Linear Models 1
 Generalized Linear Models 1 STA 2101/442: Fall 2012 1 See last slide for copyright information. 1 / 24 Suggested Reading: Davison s Statistical models Exponential families of distributions Sec. 5.2 Chapter
SPRING 2007 EXAM C SOLUTIONS
 SPRING 007 EXAM C SOLUTIONS Question #1 The data are already shifted (have had the policy limit and the deductible of 50 applied). The two 350 payments are censored. Thus the likelihood function is L =
Linear Mixed Models. One-way layout REML. Likelihood. Another perspective. Relationship to classical ideas. Drawbacks.
 Linear Mixed Models One-way layout Y = Xβ + Zb + ɛ where X and Z are specified design matrices, β is a vector of fixed effect coefficients, b and ɛ are random, mean zero, Gaussian if needed. Usually think
Individual reserving a survey. R in Insurance, Paris 08-June-2017 Alexandre Boumezoued, joint work with Laurent Devineau
 Individual reserving a survey R in Insurance, Paris 08-June-2017 Alexandre Boumezoued, joint work with Laurent Devineau Agenda 1 Context 2 Model 3 Results 4 Practical illustration 2 Context From aggregate
The Derivative. Leibniz notation: Prime notation: Limit Definition of the Derivative: (Used to directly compute derivative)
") Topic 2: The Derivative 1 The Derivative The derivative of a function represents its instantaneous rate of change at any point along its domain. There are several ways which we can represent a derivative,
Topic 2: The Derivative 1 The Derivative The derivative of a function represents its instantaneous rate of change at any point along its domain. There are several ways which we can represent a derivative,
VBM683 Machine Learning
 VBM683 Machine Learning Pinar Duygulu Slides are adapted from Dhruv Batra Bias is the algorithm's tendency to consistently learn the wrong thing by not taking into account all the information in the data
Confidence Intervals. CAS Antitrust Notice. Bayesian Computation. General differences between Bayesian and Frequntist statistics 10/16/2014
 CAS Antitrust Notice Bayesian Computation CAS Centennial Celebration and Annual Meeting New York, NY November 10, 2014 Brian M. Hartman, PhD ASA Assistant Professor of Actuarial Science University of Connecticut
Dynamic Panel of Count Data with Initial Conditions and Correlated Random Effects. : Application for Health Data. Sungjoo Yoon
 Dynamic Panel of Count Data with Initial Conditions and Correlated Random Effects : Application for Health Data Sungjoo Yoon Department of Economics, Indiana University April, 2009 Key words: dynamic panel
Exercise 5.4 Solution
 Exercise 5.4 Solution Niels Richard Hansen University of Copenhagen May 7, 2010 1 5.4(a) > leukemia
Multiple Regression Analysis: Estimation ECONOMETRICS (ECON 360) BEN VAN KAMMEN, PHD
 BEN VAN KAMMEN, PHD") Multiple Regression Analysis: Estimation ECONOMETRICS (ECON 360) BEN VAN KAMMEN, PHD Outline Motivation. Mechanics and Interpretation. Expected Values and Variances of the Estimators. Motivation for multiple
Multiple Regression Analysis: Estimation ECONOMETRICS (ECON 360) BEN VAN KAMMEN, PHD Outline Motivation. Mechanics and Interpretation. Expected Values and Variances of the Estimators. Motivation for multiple
Lecture Outline. Biost 518 Applied Biostatistics II. Choice of Model for Analysis. Choice of Model. Choice of Model. Lecture 10: Multiple Regression:
 Biost 518 Applied Biostatistics II Scott S. Emerson, M.D., Ph.D. Professor of Biostatistics University of Washington Lecture utline Choice of Model Alternative Models Effect of data driven selection of
Glossary. The ISI glossary of statistical terms provides definitions in a number of different languages:
 Glossary The ISI glossary of statistical terms provides definitions in a number of different languages: http://isi.cbs.nl/glossary/index.htm Adjusted r 2 Adjusted R squared measures the proportion of the