Testing Ambiguity Models through the Measurement of Probabilities for Gains and Losses
|
|
|
- Rudolph Peters
- 6 years ago
- Views:
Transcription
1 Testing Ambiguity Models through the Measurement of Probabilities for Gains and Losses Aurélien Baillon and Han Bleichrodt Erasmus School of Economics Erasmus University Rotterdam P.O. Box 1738, Rotterdam, 3000 DR, the Netherlands 03 April 2014 Abstract: This paper reports on two experiments that test the descriptive validity of ambiguity models using a natural source of uncertainty (the evolution of stock indices) and both gains and losses. We observed violations of probabilistic sophistication, violations that imply a fourfold pattern of ambiguity attitudes: ambiguity aversion for likely gains and unlikely losses and ambiguity seeking for unlikely gains and likely losses. Our data are most consistent with prospect theory and, to a lesser extent, -maxmin expected utility and Choquet expected utility. Models with uniform ambiguity attitudes are inconsistent with most of the observed behavioral patterns. Keywords: Decision under uncertainty, probabilistic sophistication, ambiguity, experiments. Acknowledgments: We are grateful to Yoram Halevy, Olivier L Haridon, Peter P. Wakker, the editor Robert Porter, and two anonymous reviewers for helpful comments and to Kirsten I.M. Rohde, Uyanga Turmunkh and Tong Wang for their help in collecting the data. The research of Han Bleichrodt and Aurélien Baillon was made possible through grants from the Netherlands Organization for Scientific Research (NWO). 1/40
2 1. Introduction Many real-life decisions involve uncertainty, where objective probabilities are unavailable. Examples include a physician making a diagnosis, an entrepreneur contemplating whether to introduce a new product, and a politician determining the date of a future election. To analyze such decisions, we must measure people s beliefs about the likelihood of uncertain events. Under subjective expected utility (Savage 1954), the classical model of decision under uncertainty, and the more general model of probabilistic sophistication (Machina and Schmeidler, 1992), beliefs can be measured through the elicitation of matching probabilities (e.g., Raiffa 1968 section 5.3, Spetzler and Staël von Holstein 1975, Holt 2007 section 30.5). A probability p is a matching probability of an event E, if a decision maker is indifferent between receiving x if E occurs and x with probability p. If matching probabilities measure beliefs, they must be additive and independent of the outcome x used to elicit them. In particular, they must be independent of the sign of x, and they must be the same for gains and losses. Probabilistic sophistication is often regarded as a normative requirement (Machina and Schmeidler 1995). Descriptively, probabilistic sophistication was challenged by the Ellsberg paradox (Ellsberg 1961), which showed that people are averse to ambiguity associated with betting on uncertain events, casting doubt on the existence of subjective probabilities. In response to Ellsberg s paradox, new models have been proposed to explain ambiguity aversion. Important examples are maxmin expected utility (Gilboa and Schmeidler 1989) and its generalizations, -maxmin expected utility (Ghirardato, Maccheroni and Marinacci 2004) and the variational model (Maccheroni et al. 2006), Choquet expected utility (Gilboa 1987, Schmeidler 1989) and its generalization in the form of prospect theory (Tversky and Kahneman 1992, Wakker 2010), the smooth ambiguity model (Klibanoff et al. 2005), and vector expected utility (Siniscalchi 2009). It is generally believed that tests of these ambiguity models are difficult because they employ 2/40
3 concepts that are difficult to observe empirically. Previous tests (Halevy 2007, Machina 2009, Lo 2008, L Haridon and Placido 2010, Hey, Lotito, Maffioletti 2010, Baillon, L Haridon, and Placido 2011) have used complex choices with several non-zero outcomes and artificial Ellsberg-like uncertainties (urns and balls). In this paper, we use elicited matching probabilities to shed light on patterns of violations of probabilistic sophistication and the descriptive validity of some widely used ambiguity models. Our design uses elementary choices involving just one non-zero money amount and naturally occurring ambiguous events based on the performances of stock markets. In two experiments, we found clear violations of probabilistic sophistication: matching probabilities were not additive and differed between gains and losses, and the violations of additivity were sign-dependent. The observed violations suggest that descriptive ambiguity models should allow for less sensitivity to changes in likelihood under ambiguity than under risk and for different ambiguity attitudes for gains and losses. Together, these results imply a fourfold pattern of ambiguity attitudes: ambiguity aversion for likely gains and unlikely losses and ambiguity seeking for unlikely gains and likely losses. Models that can account for this pattern include prospect theory and - maxmin expected utility. Models that assume uniform ambiguity aversion or ambiguity seeking, by contrast, are incompatible with most of the patterns that we observed. 2. Matching probabilities and their properties 2.1. Notation and definitions We consider a decision maker who must make a choice in the face of uncertainty. Uncertainty is modeled using a state space S. The decision maker knows that exactly one state will obtain, but he does not know which one. Subsets E of S are called events, and E c denotes the complement of E. In our experiments, we used a partition of S into three events: E 1, E 2, and E 3, where 3/40
4 the unions of these events are denoted E 12, E 23, and E 13. Outcomes are money amounts, and more money is preferred to less money. The set of outcomes is equal to R. Positive amounts are gains, and negative amounts are losses. Acts are functions from the state space S to the outcome set R. We only consider binary acts, called bets. An example of a bet is x E 0, paying x if event E occurs and nothing otherwise. We also consider objective probabilities, denoting by x p 0 a bet that pays x with probability p and nothing otherwise. Let denote the decision maker s preference relation over bets. Strict preference ( ) and indifference (~) are defined as usual. For any event E, we can elicit its matching probability p such that x E 0 ~ x p 0. Let m(e,x) denote the matching probability of event E elicited by outcome x. This notation implies that matching probabilities may depend on x and therefore may differ between gains and losses. As shown below, the properties of matching probabilities depend on the assumed ambiguity model. As a benchmark, we assume probabilistic sophistication, under which matching probabilities are additive and sign-independent Benchmark: probabilistic sophistication Subjective expected utility holds if a bet x E 0 is evaluated by P(E)U(x), where U is a strictly increasing utility function 1, and P(E) is the subjective probability of event E. Probabilistic sophistication holds if there exists a probability measure P over S such that, for each bet x E 0, preference is determined entirely by the resulting probability distribution x p 0, where p = P(E). Probabilistic sophistication is more general than subjective expected utility: it keeps the probability measure P from expected utility but allows for different evaluations of probability distributions. 1 Throughout the paper, we set U(0) = 0. This is permitted by the uniqueness properties of U in all the theories that we consider. 4/40
5 Under probabilistic sophistication, m(e,x) = P(E) for all x, i.e., matching probabilities are independent of the outcome used, are unique for each event, and satisfy additivity (because P does). Additivity was challenged by Ellsberg s (1961) paradox. Ellsberg argued that, when faced with a known urn containing 50 red and 50 black balls and an unknown urn containing 100 balls in an unknown mixture of red and black, people would prefer to bet on the known urn than on the unknown urn, regardless of the winning color. This implies that the matching probabilities of red and black from the unknown urn are both less than 0.5. Their sum is therefore less than 1, violating additivity and, hence, probabilistic sophistication. Ellsberg s paradox, confirmed in many experiments (Camerer and Weber 1992), suggests that people prefer decision situations with known probabilities to decision situations in which probabilities are unknown. The absence of known probabilities is often called ambiguity, and dislike (like) of ambiguity is often called ambiguity aversion (seeking). In response to Ellsberg s paradox, new models have been proposed to explain ambiguity aversion. We describe several of these ambiguity models in the next section. To test for additivity, we define five indices, which are all equal to zero under probabilistic sophistication. The indices are independent: if any four of them are not equal to zero, the remaining one can still be zero (see the online appendix for a proof). The additivity indices provide insight into patterns of deviations from probabilistic sophistication. These patterns, in turn, provide information about the descriptive validity of ambiguity models. As we will show in the next section, the ambiguity models allow for specific deviations of the indices from zero. The first additivity index tests binary complementarity: for any event E, the probability of an event and that of its complement should sum to 1. We compute the indices BC s (E i ) = 1 m(e i,x) m(e c i,x), where s is the sign of x, and i = 1,2,3. Our experiments use only one gain (x = + 10) and one loss (x= 10), and the indices BC s (E i ) are therefore unique. Binary complementarity 5/40
6 is satisfied when these indices equal 0. Positive values correspond to ambiguity aversion for gains (as in the Ellsberg paradox) and to ambiguity seeking for losses. The next two indices are based on Tversky and Wakker (1995). We define a lower additivity index LA s (E i, E j ) as m(e i,x) + m(e j,x) m(e ij,x), where s is the sign of x, i,j {1,2,3}, and i j. That is, for any disjoint pair of events, we compute the difference between the sum of their matching probabilities and the matching probability of their union. Lower subadditivity [lower superadditivity] (Tversky and Wakker 1995) holds if the LA indices are positive [negative]. While the LA index measures the difference between adding an event to the empty event and adding it to a nonempty event, the upper additivity index measures the difference between removing an event from the universal event and removing it from a proper subset of the universal event: UA s (E i ) = [1 m(e ik,x)] [m(e ij,x) m(e i,x)], where s is the sign of x, i,j,k {1,2,3}, and i, j, and k differ. Because UA s (E i ) = [1 m(e ij,x)] [m(e ik,x) m(e i,x)], the upper additivity indices are unique for a given threefold partition of S. 2 Upper subadditivity [upper superadditivity] holds if the UA index is positive [negative]. If additivity holds, the matching probabilities m(e 1,x), m(e 2,x), and m(e 3,x) should sum to one. The fourth additivity index is based on this property and is defined as TA s = m(e 1,x) + m(e 2,x) + m(e 3,x) 1, where s is the sign of x. Because it involves a three event partition of the state space, we will refer to this index as ternary additivity. If additivity holds, then it should also be true that m(e 12,x) + m(e 13,x) + m(e 23,x) = 2*(m(E 1,x) + m(e 2,x) + m(e 3,x)) = 2. That is, the probability of 2 The notation is perhaps counterintuitive, as the reader may be inclined to call the first index, where event j is removed, UA s (E j ), and the second index, where event k is removed, UA s (E k ). However, this definition would make the indices nonunique. 6/40
7 the complements of E 1, E 2, and E 3 should sum to 2. We call this property indirect ternary additivity and construct the corresponding index as ITA s = 2 (m(e 12,x) + m(e 13,x) + m(e 23,x)). BC LA UA TA & ITA BC (E) = BC + (E) = 0 LA (Ei,Ej) = LA + (Ei,Ej) = 0 UA (E) = UA + (E) = 0 TA + = TA = ITA = ITA + = 0 Table 1: Predictions of expected utility and probabilistic sophistication 3. Ambiguity models and their predictions 3.1. Maxmin expected utility, -maxmin, and the variational model In maxmin expected utility and -maxmin, ambiguity is captured through a convex set C of priors. The set C is a subset of the set of all possible probability measures P on the state space S. For any event E, let I E denote the interval of probabilities for event E that the decision maker considers possible: I E = {P(E): P C}. For decision under risk, I E consists of a single point, the objective probability of the event. For any given bet f, let EU P (f) denote its expected utility (EU) when probability measure P is used. Maxmin EU (Gilboa and Schmeidler 1989) evaluates a bet f as inf P C EU P (f), the minimum of the expected utilities with respect to the probability measures included in C. Maxmin EU can account for differing matching probabilities for gains and losses if the set C is not a singleton. The indifference x E 0 ~ x p 0 implies that p = m(e,x) = inf(i E ) for gains and that p = m(e,x) = sup(i E ) for losses. The matching probability of the complementary event E c is 1 sup(i E ) for gains and 1 inf(i E ) for losses. Consequently, binary complementarity will be violated both for gains and losses, and m(e,x) + m(e c,x) 0 m(e, x) + m(e c, x) for all events E and gains x. Hence, BC (E) 0 BC + (E). Moreover, BC + (E) = BC (E). Table 2 shows the properties that can be derived for each of the five indices under maxmin EU. Proofs of all results presented in this Section are in the online appendix. We also show in the online appendix that the opposite model, 7/40
8 maxmax EU, which evaluates an act f as sup P C EU P (f), predicts all reversed inequalities. BC LA UA TA & ITA BC (E) 0 BC + (E) = BC (E) LA (E i,e j ) 0 LA + (E i,e j ) UA (E) 0 UA + (E) TA + = ITA 0 TA = ITA + Table 2: Predictions of maxmin EU A maxmin EU maximizer is extremely pessimistic in the sense that his choices are based on the minimum expected utilities with respect to the probability measures included in C. A less pessimistic model is -maxmin EU, in which the value of a bet is equal to the weighted average of the minimum and the maximum expected utility with respect to the probability measures in C (Ghirardato et al. 2004). Formally, -maxmin EU evaluates a bet f as inf P C EU P (f) + (1 )sup P C EU P (f). Under maxmin EU, the indifference x E 0 ~ x p 0 reveals that p = m(e,x) = inf(i E ) + (1 )sup(i E ) when x is a gain and p = m(e,x) = sup(i E ) + (1 )inf(i E ) when x is a loss. As in maxmin EU, the matching probabilities are sign-dependent; however, unlike maxmin EU, the inequality, m(e,x) + m(e c,x) m(e, x) + m(e c, x), x > 0, need no longer hold. Table 3 shows that the properties of our additivity indices under - maxmin EU depend on. Although it only adds one extra parameter to maxmin EU, -maxmin EU permits much richer preference patterns. For instance, it does not require that LA + (E i,e j ) and LA (E i,e j ) have opposite signs. The reason for this is that under -maxmin, the decision maker can be ambiguity-seeking for some events and ambiguity-averse for others. Maxmin EU, by contrast, only permits ambiguity aversion, and maxmax EU only permits ambiguity seeking. 8/40
9 BC LA UA TA & ITA α ⅓ TA = ITA + 0 ITA = TA +. BC (E) 0 BC + (E) α ½ BC (E) 0 BC + (E) α ½. LA + (E i,e j ) LA (E i,e j ) α ½ LA + (E i,e j ) LA (E i,e j ) α ½. UA + (E) UA (E) α ½ UA + (E) UA (E) α ½. ⅓ α ½ TA = ITA + ITA = TA +. ½ α ⅔ TA + = ITA ITA + = TA. BC (E) = BC + (E) α ⅔ TA + = ITA 0 ITA + = TA. Table 3: Predictions of -maxmin EU (with 0< <1) A limitation of both maxmin EU and -maxmin is their dichotomous nature: probability measures are either fully included or fully excluded from the set of priors C. A more realistic case is modeled by the variational model (Maccheroni et al. 2006), in which the degree to which probability measures are included is continuous. Let be the set of all probability measures on the state space S. The variational model evaluates the indifference x E 0 ~ x p 0 as min P (P(E)U(x)+c(P)) = pu(x) = m(e,x)u(x), where c: [0, ] is a convex function with infimum zero that reflects the decision maker s ambiguity aversion. Lower values of c indicate greater ambiguity aversion. Hansen and Sargent s (2001) multiplier preferences, axiomatized by Strzalecki (2011), are a special case of the variational model. The variational model is general and, as Table 4 shows, imposes no constraints on lower and upper additivity. It also relaxes the constraints on ternary additivity and indirect ternary additivity that maxmin and -maxmin impose. The variational model still requires that the BC, TA, and ITA indices have opposite signs for gains and losses, which makes it possible to test the model. 9/40
10 BC LA UA TA & ITA BC (E) 0 BC + (E) - - TA +, ITA 0 TA, ITA + Table 4: Predictions of the variational model 3.2. Choquet expected utility and prospect theory Under Choquet EU (Gilboa 1987, Schmeidler 1989), a bet x E 0 is evaluated as U(x), where is a decision weight that is equal to W(E) if x is a gain and to 1 W(E c ) if x is a loss. U is a strictly increasing utility function, and W is a weighting function that assigns a number between 0 and 1 to each event E, such that W( ) = 0, W(S) = 1, and E F implies W(E) W(F). The decision maker s attitude toward ambiguity is captured through the nonadditivity of W. Subjective expected utility is equal to Choquet EU if W is additive. For decision under risk, where probabilities of events are known, the weighting function W is replaced by a strictly increasing probability weighting function w, which satisfies w(0) = 0 and w(1) = 1. Under Choquet EU, the indifference x E 0 ~ x p 0 implies W(E) = w(p) = w(m(e,x)), if x is a gain, and W(E c ) = w(1 p) = w(1 m(e,x)), if x is a loss. Hence, the matching probabilities will generally be different for gains and losses. Table 5 presents the predictions of Choquet EU for our five additivity indices. The italicized conditions follow from the increasingness of w and W and impose only weak constraints. Unlike the other ambiguity models, Choquet EU predicts that violations of binary complementarity are the same for gains and losses. BC LA UA TA & ITA BC (E) = BC + (E). LA + (E i,e j ) + LA (E i,e j ) 1 Table 5: Predictions of Choquet EU UA + (E) + UA (E) 1 TA + = ITA TA = ITA + and TA + + ITA /40
11 Prospect theory is more general than Choquet EU and allows for different weighting functions W and probability weighting functions w for gains (W +, w + ) and losses (W, w ). Under prospect theory, the indifference x E 0 ~ x p 0 implies that W + (E) = w + (p) if x is a gain and that W (E) = w (p) if x is a loss. Prospect theory imposes few restrictions on the matching probabilities, which can be very general, non-additive, and sign-dependent, and all types of sign-dependent violations are allowed. To test prospect theory, we added the restriction that decision makers are less sensitive to changes in likelihood under ambiguity than under risk (Wakker 2010, Abdellaoui et al., 2011). Formally, a decision maker exhibits ambiguity-generated insensitivity if, for any disjoint events E and F and for s = +,, (i) W s (E) = w s (p) and W s (F) = w s (q) imply that W s (E F) w s (p+q), provided that w s (p+q) is bounded away from 1, and (ii) W s (S E) = w s (1 p) and W s (S F) = w s (1 q) imply that W s ((E F) c ) w s (1 (p+q)), provided that W s (S (E F)) is bounded away from 0 (Tversky and Wakker, 1995). Ambiguity-generated insensitivity, which has been empirically observed (Abdellaoui et al. 2011, Maafi 2011, Baillon et al. 2012), is often associated with prospect theory. As Table 6 shows, it yields clear predictions of the directions in which four of the five additivity conditions are violated. The exception is binary complementarity, for which no testable implications can be derived. BC LA UA TA & ITA - LA + (Ei,Ej) 0 and LA (E i,e j ) 0 UA + (E) 0 and UA (E) 0 0 TA + + ITA + 1 and 0 ITA + TA 1 Table 6: Predictions of prospect theory with ambiguity-generated insensitivity 3.3. The smooth ambiguity model Klibanoff, Marinacci, and Mukerji s (2005) smooth ambiguity model evaluates the indifference x E 0 ~ x p 0 as (P(E)U(x))d = (pu(x)) = 11/40
12 (m(e,x)u(x)), where is the decision maker s subjective probability over the set of probability measures P on the state space S. The function captures the decision maker s attitudes toward ambiguity, with concavity [convexity] of corresponding to ambiguity aversion [seeking]. The intuition behind the smooth model is that ambiguity, reflected by, is evaluated separately from ambiguity aversion, reflected by. Table 7 shows that if is concave, the smooth model makes the same predictions as the variational model for our additivity indices. If is convex, these predictions are reversed. BC LA UA TA & ITA concave BC (E) 0 BC + (E) convex BC + (E) 0 BC (E) - - Table 7: Predictions of the smooth model concave TA +, ITA 0 TA, ITA + convex TA, ITA + 0 TA +, ITA 3.4. Vector expected utility Siniscalchi s (2009) vector EU model also separates ambiguity and ambiguity aversion. The model resembles Tversky and Kahneman s (1974) anchoring and adjustment heuristic (see Hogarth and Einhorn (1990) for a similar idea). The anchor is expected utility P(E)U(x), which the decision maker adjusts to account for his perception of ambiguity, using adjustment factors ζ i. Ambiguity aversion is captured through a negative and symmetric adjustment function A. Vector EU evaluates x E 0 ~ x p 0 as P(E)U(x) + A((ζ i (E) P(E)U(x)) 0 i<n ) = pu(x) = m(e,x)u(x). Table 8 shows that vector EU, with A negative (positive), makes the same predictions as the smooth model with concave (convex) for our additivity indices. 12/40
13 BC LA UA TA & ITA A negative BC (E) 0 BC + (E) A positive BC + (E) 0 BC (E) - - Table 8: Predictions of vector EU A negative TA +, ITA 0 TA, ITA + A positive TA, ITA + 0 TA +, ITA 4. Experiments We performed two experiments to test probabilistic sophistication and explore whether the predicted patterns of Tables 2-8 were indeed observed. We first present the designs and results of the two experiments and then, in Section 5, turn to their implications for the ambiguity models. 4.1 First experiment Subjects and procedures Thirty-seven economics students (13 female) at Erasmus University Rotterdam took part in the experiment. Subjects received a flat-fee of 15 at the start of the experiment. In addition, each subject played out one choice for real. The experiment was computer-run, lasted approximately one hour, including instructions and payment, and was conducted in three group sessions. Subjects, seated in cubicles, were required to switch off their phones, and interaction was forbidden. Two interviewers were present during the group sessions. To prevent the second and third groups from having more information and facing less ambiguity than the first group, we made communication between the subject groups impossible: the first group of subjects was debriefed, while the second group participated in the experiment, and the third group entered the lab to receive instructions. We could not run more than 3 groups and prevent subjects from different groups speaking to each other 13/40
14 about the experiment. This and our desire to keep the group sizes manageable restricted the number of subjects in the experiment. As events, we used variations of two stock indices, the Dutch AEX index and the Indian SENSEX index, during the 30 minutes following the start of the experiment. We chose a more familiar source of uncertainty (the AEX index) and a more unfamiliar source (the SENSEX index) 3 because previous studies have shown that ambiguity attitudes can depend on the source of uncertainty (Fox and Tversky 1998, Kilka and Weber 2001, Abdellaoui et al. 2011). We defined the events as E 1 = [ 100%, 0.5%), in which the stock index falls by more than 0.5%, E 2 = [ 0.5%, 0.5%], in which the stock index varies by at most 0.5%, E 3 = (0.5%, + ), in which the stock index rises by more than 0.5%, and their complements E 23 = [ 0.5%, + ), E 13 = [ 100%, 0.5%) (0.5%, + ), and E 12 = [ 100%, 0.5%]. Subjects had to choose between two options, an uncertain bet on one of the six events, with either a gain or a loss of 10 if the event occurred, and a risky bet that produced this outcome (a gain or a loss of 10) with a given probability. Matching probabilities were measured in three steps. A first screen asked subjects to choose between the uncertain bet and the risky bet, where the risky bet involved probabilities of 0%, 10%, 20%,..., 90%, and 100% of winning or losing 10. The software enforced monotonicity. If, for example, a 70% probability of winning 10 was preferred to winning 10 if event E occurred, then a preference for the risky bet was automatically selected for probabilities of 80%, 90%, and 100%. If a subject s choice switched from the uncertain bet to the risky bet between probabilities q% and (q+10)%, a second screen then displayed choices between the two bets for probabilities q%, (q+1)%, (q+2)%,, and (q+10)%. Subjects chose between the two bets for each probability, with 3 None of our subjects was Indian, 20 were Dutch. 14/40
15 monotonicity enforced. If a subject s preference switched between probabilities q% and (q+1)%, we took (q+0.5)% as the matching probability for event E. For gains [losses], the third screen asked subjects to confirm that they indeed preferred the uncertain bet for all probabilities below [above] the elicited matching probability and the risky bet for all probabilities above [below] the elicited matching probability. The aim of this confirmation question was to reduce the impact of response errors. If subjects did not confirm their preferences, measurement of the matching probability was started anew. Examples of the three screens are presented in Figure 1. 15/40

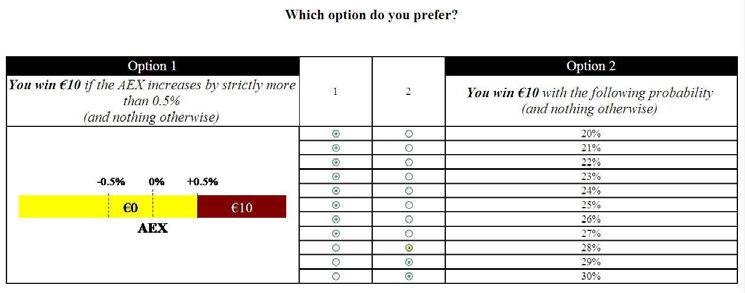
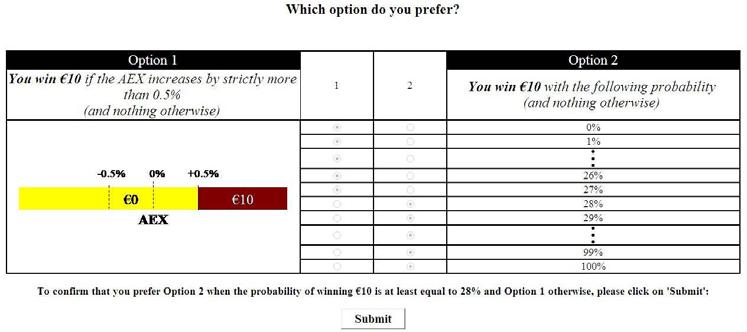
16 Figure 1: Screenshots of the experiment 16/40
17 We elicited matching probabilities for the 6 events, E 1, E 2, E 3, E c 1 = E 23, E c 2 = E 13, and E c 3 = E 12, for both sources (AEX and SENSEX) and for a gain and a loss of 10. The order in which these 24 matching probabilities were elicited was random and differed between subjects. At the end of the experiment, we repeated the measurements of m(e 2, 10) and m(e 13, 10) for the SENSEX index to test for consistency. These measurements were the most difficult, involving both an unfamiliar index and losses, and, consequently, were most likely to lead to inconsistencies. To incentivize the experiment, each subject played out one choice for real. We used three boxes with numbered tickets to implement payments. The first box contained 26 tickets numbered 1 to 26 and was used to select one of the matching probability measurements. The second box contained 101 tickets numbered 0 to 100 and was used to select the probability of a gain or a loss in the risky bet. If the subject had chosen the uncertain bet for this probability, we used the actual variation of the stock index to determine the payoff. Otherwise, the subject randomly drew a number from a third box containing 100 tickets numbered 1 to 100 to play out the risky bet. 4 A random incentive system, in which a subset of the experimental questions is played out for real, is widely used in experimental economics. It assumes that subjects isolate each choice and do not view the experiment as a whole. The available evidence generally supports this assumption (see Bardsley et al. 2010, p.269). If subjects were to view the experiment as a whole, then they would face a mixture of bets. Following Schmeidler (1989), this would reduce their exposure to ambiguity, moving them in the direction of 4 To illustrate the procedure, suppose that the first box selected event E 1 for gains and the AEX. Suppose that 10 E1 0 ~ , i.e., the matching probability for event E 1 for gains and the AEX was 47%, and that the subject drew number 60 from the second box. Because the subject preferred to and hence to 10 E1 0, he was asked to draw a number from the third box. If this number was 60 or less, the subject received 10; otherwise, he received nothing. 17/40
18 probabilistic sophistication and expected utility. Our tests of probabilistic sophistication would then be conservative. We could not influence payments because the performances of the two stock indices were, of course, beyond our control. Hence, the common criticism of experiments on ambiguity, that subjects might think experimenters manipulate the experimental protocol to minimize payments, does not apply to our study. To exclude the possibility that subjects thought that we had assigned gains to unlikely events and losses to likely events, we explicitly told them that for every bet on an event, there would also be a bet on its complement. Differences between matching probabilities were tested using analysis of variance (with the Greenhouse-Geisser correction for repeated measures) and paired t-tests Consistency The consistency results were mixed. The two measurements of m(e 2, 10) for the SENSEX index did not differ significantly (p = 0.13), but the repeated measurement of m(e 13, 10) for the SENSEX index was lower than the original measurement (p = 0.04). 5 In contrast, the correlation between the original and the repeated measurement of m(e 13, 10) for the SENSEX index was substantial (0.74) Aggregate results Figure 2 shows the 24 matching probabilities that we measured. Matching probabilities were sign-dependent (p = 0.001) and were higher for gains than for losses, particularly for more likely events. The matching 5 The difference may be due to an order effect, as the consistency tests were always performed at the end of the experiments and were not randomized, unlike the original measurements. 18/40
19 probabilities were similar for the AEX index and for the unfamiliar SENSEX index (p = 0.26). Figure 2: Mean matching probabilities A: AEX B: SENSEX Mean matching probability 60% Gain Loss Mean matching probability 60% Gain Loss 40% 40% 20% 20% 0% 0% E 1 E 2 E 3 E 12 E 13 E 23 E 1 E 2 E 3 E 12 E 13 E 23 Event Event We will now move to the analysis of the five additivity indices. Figure 3 shows that binary complementarity held for gains but not for losses. For gains, the sum of the probability of an event and the probability of its complement was close to 100% for all events and for both sources, and no significant differences were observed (all p > 0.10). For losses, the probability of an event and the probability of its complement summed to less than 100% for all three events and for both stock indices. For the AEX, there was binary superadditivity for losses for all events (all p < 0.01, one-tailed t-tests). For the SENSEX, there was binary superadditivity for losses for events E 2 (p = 0.03) and E 3 (p = 0.015), but the effect was only marginal for event E 1 (p = 0.06). Previous studies that used judged probabilities and found support for binary complementarity used only gains (Tversky and Koehler 1994, Tversky and Fox 1995, Wu and Gonzalez 1999). Our results confirm binary complementarity for gains but also show that binary complementarity is significantly violated for losses. 19/40
20 Binary complementarity is consistent with ambiguity neutrality for gains. This does not mean that subjects were always ambiguity neutral for gains. As we discuss below, the ITA indices showed ambiguity aversion for gains. In the Discussion Section, we return to the observed ambiguity neutrality for gains in the tests of binary complementarity and explain why this finding is consistent with a fourfold pattern of attitudes toward ambiguity. The binary complementarity index was lower for losses than for gains (p < 0.05 in all one-tail paired t-tests), but we could not reject the null that BC + = BC (which is predicted by maxmin EU and -maxmin EU). The difference between BC + and BC was marginally significant for event E 3 and the AEX (p = 0.06) and insignificant in all other tests (all p > 0.11). Figure 3: Binary complementarity A: AEX B: SENSEX Mean matching probability 100% P(E) gain P(E c ) gain P(E) loss P(E c ) loss Mean matching probability 100% P(E) gain P(E c ) gain P(E) loss P(E c ) loss 80% 80% 60% 60% 40% 40% 20% 20% 0% E 1 E 2 E 3 0% Event E 1 E 2 E 3 Event Figure 4 clearly shows that lower additivity was violated (all p < 0.01). The sums of the matching probabilities (the solid bars) exceeded the matching probabilities of their unions (the striped bars) in all tests, and all LA-indices were positive, which is consistent with lower subadditivity. The violations of lower additivity were similar for gains and losses. 20/40
21 Figure 4: Lower subadditivity A: AEX B: SENSEX Mean matching probability Sum gains Union gains Sum losses Union losses Mean matching probability Sum gains Union gains Sum losses Union losses 100% 100% 80% 80% 60% 60% 40% 40% 20% 20% 0% E 12 E 13 E 23 E 12 E 13 E 23 0% Gains Losses E 12 E 13 E 23 E 12 E 13 E 23 Gains Losses Upper additivity was also violated (see Figure 5), and all UA indices were positive, consistent with upper subadditivity (all p < 0.01). Upper subadditivity was stronger for losses than for gains (all p < 0.05). The combination of lower and upper subadditivity suggests that unlikely events are overweighted, that likely events are underweighted and that the underweighting of likely events is stronger for losses. A: AEX Figure 5: Upper subadditivity B: SENSEX Value Gain Loss Value Gain Loss 50% 50% 40% 40% 30% 30% 20% 20% 10% 10% 0% UA(E 1 ) UA(E 2 ) UA(E 3 ) 0% UA(E 1 ) UA(E 2 ) UA(E 3 ) 21/40
22 Finally, Figure 6 shows that the TA and ITA indices also indicated violations of additivity (all p < 0.01). The TA indices were all positive, which is consistent with ambiguity seeking for unlikely gains and ambiguity aversion for unlikely losses. They were similar for gains and losses, both for the AEX and the SENSEX. The ITA indices were lower for gains than for losses (all p < 0.01). This can be explained by more underweighting of likely events for losses than for gains and agrees with our finding in the analysis of the upper additivity indices. The positive values of the ITA-indices indicate ambiguity aversion for gains and ambiguity seeking for losses. For the AEX, the ITA index was also higher than the TA + and TA indices (both p < 0.05), which we will use to test the ambiguity models. Value 60% Figure 6: Violations of additivity in three-fold partitions A: AEX Value 60% B: SENSEX 50% 50% 40% 40% 30% 30% 20% 20% 10% 10% 0% TA TA ITA ITA Additivity index 0% TA TA ITA ITA Additivity index Individual results The individual results confirmed the aggregate results. Table 9 lists the proportions of subjects who satisfied additivity, according to each of our five additivity indices. To account for response error, we classified subjects as satisfying additivity according to one of our indices if the absolute value of 22/40
23 that index was less than 0.10, the median of the absolute differences in the repeated measurements. Because we repeated the most complex questions, this error bound may be too wide, in which case, our tests are conservative and favor additivity. The proportion of subjects who satisfy additivity was small in most tests. Additivity was satisfied by about half of the subjects in the tests of binary complementarity and approximately 25% of the subjects in the other tests. Only one subject satisfied all five additivity conditions. AEX SENSEX BC + =BC =0 E 1 : 49% E 2 : 46% E 3 : 32% E 1 : 49% E 2 : 43% E 3 : 41% LA + =LA =0 E 12 : 27% E 2 : 24% E 3 : 24% E 1 : 24% E 2 : 24% E 3 : 22% UA + =UA =0 E 12 : 22% E 2 : 22% E 3 : 27% E 1 : 27% E 2 : 22% E 3 : 27% TA + =TA =0 16% 16% ITA + =ITA =0 19% 27% Table 9: Proportions of subjects satisfying additivity for each test and both for the AEX and the SENSEX 4.2. Second experiment Subjects and procedures The second experiment tested the robustness of the results of the first experiment, using a larger sample. Ninety-eight students of Erasmus University Rotterdam participated. To obtain more subjects than in the first experiment, we ran 5 sessions and therefore could not fully avoid the possibility of communication among subjects about the experiment, although this was unlikely. The second experiment was largely similar to the first experiment, and we will only list the differences. We replaced the SENSEX index by the South African TOP40 index because the Indian stock market was closed during part of the experiment. Because we observed quotations with a 15-minutes delay, subjects bet on variations of the stock indices between 15 minutes before and 23/40
24 15 minutes after the beginnings of the sessions they attended. We used E 1 = [ 100%, 0.2%), E 2 = [ 0.2%, 0.2%], and E 3 = (0.2%, + ) to reduce the likelihood of E 2. 6 Unlike in the first experiment, the two questions that were repeated did not come at the end of the experiment; rather, the order of the questions was fully random. The instructions appeared on the computer screen (they were read aloud in the first experiment), and we added three practice questions and understanding checks. Subjects could only start the experiment if they had correctly answered these checks Consistency Consistency was good and better than in the first experiment. The original and repeated measurements of m(e 2, 10) and m(e 13, 10) for the TOP40 index did not differ significantly (both p > 0.11) and were substantially correlated (both > 0.57, p < 0.01) Aggregate results The results of the second experiment were similar to those of the first. Figure 7 shows that the elicited matching probabilities were sign-dependent (all p < 0.01) and higher for gains than for losses, particularly for more likely events. This result is consistent with greater ambiguity-generated insensitivity for losses. As in the first experiment, we found no evidence of sourcedependence: the matching probabilities were similar for the AEX and the TOP40 (all p > 0.69). 6 In the first experiment, event E 2 was objectively very likely. For instance, between March 5 and April 1, 2014, it occurred 94.6% and 96.5% of the time for the AEX and SENSEX, respectively (based on the variations of the indices between 9 a.m. and 10 a.m., 10 a.m. and 11 a.m until 4 p.m. and 5 p.m.). In the second experiment, we reduced the likelihood of E 2. E 1, E 2, and E 3, as defined in the second experiment, occurred 9.1%, 81.2%, and 9.7% of the time, respectively, between March 5 and April 1, 2014 for the AEX (for the TOP40 these data were not accessible). 24/40
25 Mean matching probability 60% Gain Loss Figure 7: Mean matching probabilities A: AEX Mean matching probability 60% B: TOP40 Gain Loss 40% 40% 20% 20% 0% E 1 E 2 E 3 E 12 E 13 E 23 Event 0% E 1 E 2 E 3 E 12 E 13 E 23 Event Figure 8 shows the results for binary complementarity. In contrast with the first experiment, binary complementarity did not hold for gains, but we found binary superadditivity. The sum of the probability of an event and that of its complement exceeded 100% for all events for both stock indices (all p < 0.05, except for E 2 in the TOP40, where p = 0.06). For losses, we found binary subadditivity for all three events for both stock indices (all p < 0.01), as in the first experiment. These findings are consistent with ambiguity seeking for both gains and losses. The binary complementarity index for losses exceeded the index for gains (all p < 0.01). We could not reject the null hypothesis that the absolute values of the binary complementarity indices for gains and losses were equal (all p > 0.25). 25/40
26 Figure 8: Binary complementarity A: AEX B: TOP40 Mean matching probability 100% P(Event) gain P(Complement) gain P(Event) loss P(Complement) loss Mean matching probability 100% P(Event) gain P(Complement) gain P(Event) loss P(Complement) loss 80% 80% 60% 60% 40% 40% 20% 20% 0% E 1 E 2 E 3 0% Event E 1 E 2 E 3 Event Figures 9 and 10 confirm lower and upper subadditivity (all p < 0.01) for both gains and losses, consistent with ambiguity-generated insensitivity. As in the first experiment, the LA indices did not differ between gains and losses, but the UA indices did (all p < 0.01). This suggests more ambiguitygenerated insensitivity for losses than for gains. Figure 9: Lower subadditivity A: AEX B: TOP40 Mean matching probability 100% Sum gains Union gains Sum losses Union losses Mean matching probability 100% Sum gains Union gains Sum losses Union losses 80% 80% 60% 60% 40% 40% 20% 20% 0% E 12 E 13 E 23 E 12 E 13 E 23 Gains Losses 0% E 12 E 13 E 23 E 12 E 13 E 23 Gains Losses 26/40
27 Figure 10: Upper subadditivity A: AEX B: TOP40 Value 50% Gain Loss Value 50% Gain Loss 40% 40% 30% 30% 20% 20% 10% 10% 0% UA(E 1 ) UA(E 2 ) UA(E 3 ) 0% UA(E 1 ) UA(E 2 ) UA(E 3 ) Figure 11 shows that both direct and indirect ternary additivity were violated (all p < 0.01). For both the AEX and the TOP40, the TA index was lower than the TA + and the ITA indices (all p < 0.01). The ITA + index was lower than the ITA index for both sources (both p < 0.01) and lower than the TA + index for the TOP40 only (p < 0.05). The positive values of the ITAindices are consistent with ambiguity aversion for gains and ambiguity seeking for losses. Figure 11: Violations of additivity in three-fold partitions Value 60% A: AEX Value 60% B: TOP40 50% 50% 40% 40% 30% 30% 20% 20% 10% 10% 0% TA TA ITA ITA Additivity index 0% TA TA ITA ITA Additivity index 27/40
28 Individual results AEX TOP40 BC + =BC =0 E 1 : 52% E 2 : 45% E 3 : 53% E 1 : 45% E 2 : 37% E 3 : 54% LA + =LA =0 E 12 : 26% E 2 : 22% E 3 : 29% E 1 : 30% E 2 : 28% E 3 : 28% UA + =UA =0 E 12 : 27% E 2 : 21% E 3 : 29% E 1 : 26% E 2 : 30% E 3 : 26% TA + =TA =0 21% 23% ITA + =ITA =0 30% 18% Table 10: Proportions of subjects satisfying additivity for each test and for both the AEX and SENSEX. Second experiment. Table 10 shows the proportions of subjects who satisfied additivity, according to each of the five indices. These proportions were almost identical to those in the first experiment. Few subjects satisfied additivity, although we allowed for a (wide) margin of error of plus or minus We used 0.10 to have the same error margin as in the first experiment, even though the median absolute difference between the original and repeated measurement was only 0.07 in the second experiment. Despite this, only 3 subjects satisfied additivity in all five tests (allowing for response error). 5. Predictions of the ambiguity models. Next, we turn to predictions of the ambiguity models. The deviations from additivity show that subjects tended to overweight unlikely events, underweight likely events, and display differing ambiguity attitudes for gains and losses. Taken together, these findings lead to a fourfold pattern of ambiguity attitudes: ambiguity seeking for unlikely gains and likely losses and ambiguity aversion for likely gains and unlikely losses. This result suggests that ambiguity models that permit such a rich pattern of ambiguity attitudes are probably more consistent with our data than more restrictive models. Models that predict uniform ambiguity attitudes indeed performed poorly. Aggregate behavior violated the predictions of maxmin expected utility for BC, BC +, UA, LA +, ITA, and TA +. It also violated the predictions of maxmax EU for UA +, LA, ITA +, and TA and those of the variational 28/40
29 model for BC, BC +, ITA, and TA +. The signs of BC, ITA, and TA + violate the smooth model with concave, and the smooth model with convex is inconsistent with the signs of ITA + and TA. Allowing to switch from convex (ambiguity seeking) for losses to concave (ambiguity averse) for gains cannot accommodate the signs of the TA indices. Vector EU suffers from the same problems. Choquet EU and -maxmin EU (with between ⅓ and ½) allow for the overweighting of unlikely events and the underweighting of likely events and can explain most of the data. However, these models cannot explain the difference between ITA and TA +. Additionally, Choquet EU wrongly predicts BC (E) = BC + (E). An explanation of the difference between ITA and TA + requires sign-dependent ambiguity attitudes. Prospect theory can explain all the aggregate data and correctly predicts that all the UA, LA, TA, and ITA indices should be positive. If we allow in -maxmin to differ for gains and losses, then -maxmin can also explain all data patterns. Table B.1 in the online appendix shows how many subjects behaved according to each of the predictions of the various ambiguity models. In constructing this table, we again used an error margin of 10% to account for response error. Table 11 shows, for each ambiguity model, how many subjects satisfied all of its predictions. 29/40
30 Model # Conditions Proportion of subjects Experiment 1 probabilistic sophistication 4 3% 3% maxmin EU 4 3% 3% maxmax EU 4 5% 5% variational model 2 14% 8% α-maxmin EU ⅔ α < 1 4 5% 6% ½ α ⅔ 4 11% 18% ⅓ α ½ 4 8% 20% 0 < α ⅓ 4 5% 10% all cases 4 14% 28% Experiment 2 vector EU & A negative / 2 14% 8% smooth model concave A positive / 2 16% 22% convex Both 2 27% 27% Choquet EU 4 22% 41% prospect theory with ambiguitygenerated insensitivity 3 70% 92% Table 11: Proportion of subjects satisfying all predictions of each model Table 11 confirms that few subjects behaved according to models with uniform ambiguity attitudes. Models that permit both ambiguity aversion and ambiguity seeking performed better, even though they can explain the behavior of only a minority of subjects. The only theory that can explain the choices of most subjects is prospect theory: 70% in the first experiment and 92% in the second experiment behaved according to prospect theory with ambiguity-generated insensitivity. The superior performance of prospect theory illustrates the importance of allowing for sign-dependence in modeling ambiguity attitudes. 30/40
31 6. Discussion Our subjects violated probabilistic sophistication. Matching probabilities were sign-dependent, additivity did not hold, and violations of additivity differed for gains and losses. Unlikely events were overweighted, and likely events were underweighted. The underweighting of likely events was stronger for losses, indicating greater ambiguity-generated insensitivity for losses. Our findings suggest a fourfold pattern of attitudes toward ambiguity: ambiguity seeking for unlikely gains and likely losses and ambiguity aversion for likely gains and unlikely losses. Attitudes toward ambiguity are richer than uniform ambiguity aversion, which is often assumed in the literature, suggests. As early as 1962, Ellsberg remarked that ambiguity seeking might prevail for unlikely events (Ellsberg, 2001, p.203). Our results corroborate Ellberg s conjecture. The fourfold pattern of ambiguity attitudes can explain why we observed no evidence of ambiguity aversion in tests of binary complementarity for gains. The tests of binary complementarity combined a less likely event with its more likely complement. If the overweighting of the less likely event is approximately offset by the underweighting of the more likely (complementary) event then, on balance, the data will indicate ambiguity neutrality. Because likely events were underweighted more for losses, this argument can also explain why we found binary subadditivity (ambiguity seeking) for losses. In the ITA tests, which employed three likely events, we found, consistent with the underweighting of likely events, clear evidence of ambiguity aversion for gains (and ambiguity seeking for losses). There is a rich and still growing literature on modeling ambiguity attitudes. Unfortunately, empirical evidence on the relative performance of the different ambiguity models is scarce. Our data show that models that predict uniform ambiguity aversion and do not distinguish between gains and losses do not describe ambiguity attitudes well. Models that perform well are 31/40
32 Choquet EU, -maxmin and, in particular, prospect theory. At the individual level, prospect theory clearly outperforms the other models. Our findings are largely consistent with other tests of ambiguity models. Kothiyal, Spinu, and Wakker (2013) found support for prospect theory over Choquet EU and the multiple priors models in a re-analysis of the data of Hey, Lotito, and Maffioletti (2010). Chew, Miao, and Zhong (2013) report data that are consistent with Choquet EU (and with prospect theory, as they only consider gains) but not with the multiple priors models, the smooth ambiguity model, and vector EU. Their study, however, did not directly test predictions of Choquet EU and prospect theory. Yang and Yao (2012) obtained evidence against the multiple priors models and the smooth ambiguity model. Hayashi and Wada (2011) found evidence against maxmin EU and -maxmin. On the other hand, Cubitt et al. (2013) found support for the smooth model over -maxmin. Finally, Machina (2009) presented several Ellsberg-like examples that were confirmed experimentally by l Haridon and Placido (2010). Baillon, l Haridon, and Placido (2011) showed that these examples violate the maxmin EU, the variational model, Choquet EU, and the smooth model but not vector EU. Our analysis differs from these studies in that we test more models, test precise predictions of each of these models, consider both gains and losses, employ simple choices, and use a natural source of ambiguity. Our analysis includes many but not all ambiguity models. Some recent ambiguity models are too general to generate predictions for our data (e.g., Cerreia-Vioglio et al. 2011, Ergin and Gul 2009). Gajdos et al. (2008) proposed a model in which decision makers receive imprecise information. To apply their model, it is crucial to know the received information set. As the latter was unclear in our experiment, we could not test their model. Other models that were not included in our analysis are those of Neilson (2010) and Chateauneuf and Faro (2009). 32/40
Recursive Ambiguity and Machina s Examples
 Recursive Ambiguity and Machina s Examples David Dillenberger Uzi Segal January 9, 204 Abstract Machina (2009, 202) lists a number of situations where Choquet expected utility, as well as other known models
Recursive Ambiguity and Machina s Examples
 Recursive Ambiguity and Machina s Examples David Dillenberger Uzi Segal May 0, 0 Abstract Machina (009, 0) lists a number of situations where standard models of ambiguity aversion are unable to capture
Uniform Sources of Uncertainty for Subjective Probabilities and
 Uniform Sources of Uncertainty for Subjective Probabilities and Ambiguity Mohammed Abdellaoui (joint with Aurélien Baillon and Peter Wakker) 1 Informal Central in this work will be the recent finding of
RECURSIVE AMBIGUITY AND MACHINA S EXAMPLES 1. INTRODUCTION
 INTERNATIONAL ECONOMIC REVIEW Vol. 56, No., February 05 RECURSIVE AMBIGUITY AND MACHINA S EXAMPLES BY DAVID DILLENBERGER AND UZI SEGAL University of Pennsylvania, U.S.A.; Boston College, U.S.A., and Warwick
Second-Order Expected Utility
 Second-Order Expected Utility Simon Grant Ben Polak Tomasz Strzalecki Preliminary version: November 2009 Abstract We present two axiomatizations of the Second-Order Expected Utility model in the context
Measurable Ambiguity. with Wolfgang Pesendorfer. August 2009
 Measurable Ambiguity with Wolfgang Pesendorfer August 2009 A Few Definitions A Lottery is a (cumulative) probability distribution over monetary prizes. It is a probabilistic description of the DMs uncertain
Ambiguity Models and the Machina Paradoxes
 Ambiguity Models and the Machina Paradoxes Aurélien Baillon, Olivier L Haridon, and Laetitia Placido forthcoming, American Economic Review Abstract Machina (2009) introduced two examples that falsify Choquet
Are Probabilities Used in Markets? 1
 Journal of Economic Theory 91, 8690 (2000) doi:10.1006jeth.1999.2590, available online at http:www.idealibrary.com on NOTES, COMMENTS, AND LETTERS TO THE EDITOR Are Probabilities Used in Markets? 1 Larry
An Axiomatic Model of Reference Dependence under Uncertainty. Yosuke Hashidate
 An Axiomatic Model of Reference Dependence under Uncertainty Yosuke Hashidate Abstract This paper presents a behavioral characteization of a reference-dependent choice under uncertainty in the Anscombe-Aumann
MEASURING AMBIGUITY ATTITUDES FOR ALL (NATURAL) EVENTS
 EVENTS") MEASURING AMBIGUITY ATTITUDES FOR ALL (NATURAL) EVENTS AURÉLIEN BAILLON a, ZHENXING HUANG b, ASLI SELIM a, & PETER P. WAKKER a a: Erasmus School of Economics, Erasmus University Rotterdam, Rotterdam, the
MEASURING AMBIGUITY ATTITUDES FOR ALL (NATURAL) EVENTS AURÉLIEN BAILLON a, ZHENXING HUANG b, ASLI SELIM a, & PETER P. WAKKER a a: Erasmus School of Economics, Erasmus University Rotterdam, Rotterdam, the
Bayesian consistent prior selection
 Bayesian consistent prior selection Christopher P. Chambers and Takashi Hayashi August 2005 Abstract A subjective expected utility agent is given information about the state of the world in the form of
Partial Ambiguity. CHEW Soo Hong, MIAO Bin, and ZHONG Songfa. November 2016
 Partial Ambiguity CHEW Soo Hong, MIAO Bin, and ZHONG Songfa November 2016 Abstract We extend Ellsberg s two-urn paradox and propose three symmetric forms of partial ambiguity by limiting the possible compositions
Comparing uncertainty aversion towards different sources
 Theory Dec. DOI 10.1007/s18-016-9584-6 Comparing uncertainty aversion towards different sources Aurélien Baillon 1 Ning Liu 2 Dennie van Dolder 3 The Author(s) 2016. This article is published with open
Allais, Ellsberg, and Preferences for Hedging
 Allais, Ellsberg, and Preferences for Hedging Mark Dean and Pietro Ortoleva Abstract Two of the most well-known regularities observed in preferences under risk and uncertainty are ambiguity aversion and
Ellsberg Paradox: Ambiguity and Complexity Aversions Compared
 Ellsberg Paradox: Ambiguity and Complexity Aversions Compared Jaromír Kovářík Dan Levin Tao Wang January 16, 2016 Abstract We present a simple model where preferences with complexity aversion, rather than
AMBIGUITY AVERSION WITH THREE OR MORE OUTCOMES
 AMBIGUITY AVERSION WITH THREE OR MORE OUTCOMES By MARK J. MACHINA * March 15, 2012 Ambiguous choice problems which involve three or more outcome values can reveal aspects of ambiguity aversion which cannot
Allais Paradox. The set of prizes is X = {$0, $1, 000, 000, $5, 000, 000}.
 1 Allais Paradox The set of prizes is X = {$0, $1, 000, 000, $5, 000, 000}. Which probability do you prefer: p 1 = (0.00, 1.00, 0.00) or p 2 = (0.01, 0.89, 0.10)? Which probability do you prefer: p 3 =
Temporal Resolution of Uncertainty and Recursive Models of Ambiguity Aversion. Tomasz Strzalecki Harvard University
 Temporal Resolution of Uncertainty and Recursive Models of Ambiguity Aversion Tomasz Strzalecki Harvard University Preference for Earlier Resolution of Uncertainty instrumental value of information Spence
Completing the State Space with Subjective States 1
 Journal of Economic Theory 105, 531539 (2002) doi:10.1006jeth.2001.2824 Completing the State Space with Subjective States 1 Emre Ozdenoren Department of Economics, University of Michigan, Ann Arbor, Michigan
The Ellsberg paradox: A challenge to quantum decision theory?*
 Department of Economics The Ellsberg paradox: A challenge to quantum decision theory?* Ali al-nowaihi, University of Leicester Sanjit Dhami, University of Leicester Working Paper No. 6/08 The Ellsberg
Skewed Noise. David Dillenberger 1 Uzi Segal 2. 1 University of Pennsylvania 2 Boston College and WBS
 Skewed Noise David Dillenberger 1 Uzi Segal 2 1 University of Pennsylvania 2 Boston College and WBS Introduction Compound lotteries (lotteries over lotteries over outcomes): 1 1 4 3 4 1 2 1 2 1 2 1 2 1
Vector Expected Utility and Attitudes toward Variation
 Vector Expected Utility and Attitudes toward Variation Marciano Siniscalchi December 16, 2008 Abstract This paper proposes a model of decision under ambiguity deemed vector expected utility, or VEU. In
Consideration Sets. Mark Dean. Behavioral Economics G6943 Fall 2015
 Consideration Sets Mark Dean Behavioral Economics G6943 Fall 2015 What is Bounded Rationality? Start with a standard economic model e.g. utility maximization C (A) = max x A u(x) If the model is wrong
Sealed Bid Auctions with Ambiguity: Theory and Experiments
 Sealed Bid Auctions with Ambiguity: Theory and Experiments Yan Chen Peter Katuscak Emre Ozdenoren July 8, Abstract This study presents a theoretical model and laboratory experiment of the first and second
We consider choice over uncertain, monetary payoffs and study a general class of preferences. These preferences
 Published online ahead of print June 15, 212 MANAGEMENT SCIENCE Articles in Advance, pp. 1 19 ISSN 25-199 (print) ISSN 1526-551 (online) http://dx.doi.org/1.1287/mnsc.112.1537 212 INFORMS Aspirational
Quantum Decision Theory
 Quantum Decision Theory V.I. Yukalov and D. Sornette Department of Management, Technology and Economics\ ETH Zürich Plan 1. Classical Decision Theory 1.1. Notations and definitions 1.2. Typical paradoxes
Skewed Noise. David Dillenberger Uzi Segal. November 25, 2013
 Skewed Noise David Dillenberger Uzi Segal November 5, 013 Experimental evidence suggests that individuals who face an asymmetric distribution over the likelihood of a specific event might actually prefer
The willingness to pay for health improvements under comorbidity ambiguity 1
 The willingness to pay for health improvements under comorbidity ambiguity 1 Yoichiro Fujii, Osaka Sangyo University Yusuke Osaki 2, Osaka Sangyo University Abstract Accumulated medical information is
Endogenizing Prospect Theory s Reference Point. by Ulrich Schmidt and Horst Zank
 Endogenizing Prospect Theory s Reference Point by Ulrich Schmidt and Horst Zank No. 1611 March 2010 Kiel Institute for the World Economy, Hindenburgufer 66, 24105 Kiel, Germany Kiel Working Paper No. 1611
Sealed bid auctions with ambiguity: Theory and experiments
 Journal of Economic Theory 36 (7) 53 535 www.elsevier.com/locate/jet Sealed bid auctions with ambiguity: Theory and experiments Yan Chen a,, Peter Katuščák b, Emre Ozdenoren c a School of Information,
Rationality and Uncertainty
 Rationality and Uncertainty Based on papers by Itzhak Gilboa, Massimo Marinacci, Andy Postlewaite, and David Schmeidler Warwick Aug 23, 2013 Risk and Uncertainty Dual use of probability: empirical frequencies
Discussion Papers in Economics
 Discussion Papers in Economics No. No. 2000/62 2007/12 Dynamics of Output Growth, Choquet Consumption OK? and Physical Capital in Two-Sector Models of Endogenous Growth By by John D Hey, Gianna Lotito
September 2007, France
 LIKELIHOOD CONSISTENCY M h dabd ll i (& P t P W kk ) Mohammed Abdellaoui (& Peter P. Wakker) September 2007, France A new method is presented for measuring beliefs/likelihoods under uncertainty. It will
A Truth-Serum for Non-Bayesians: Correcting Proper Scoring Rules for Risk Attitudes 1
 A Truth-Serum for Non-Bayesians: Correcting Proper Scoring Rules for Risk Attitudes 1 Theo Offerman a, Joep Sonnemans a, Gijs van de Kuilen a, & Peter P. Wakker b a: CREED, Dept. of Economics, University
Essays on Decision Making: Intertemporal Choice and. Uncertainty
 Essays on Decision Making: Intertemporal Choice and Uncertainty ISBN 978 90 3610 476 0 Cover design: Crasborn Graphic Designers bno, Valkenburg a.d. Geul This book is no. 685 of the Tinbergen Institute
Cautious Expected Utility and the Certainty Effect
 Cautious Expected Utility and the Certainty Effect Simone Cerreia-Vioglio David Dillenberger Pietro Ortoleva May 2013 Abstract One of the most prominently observed behavioral patterns in decision making
Common ratio using delay
 Theory Dec. (2010) 68:149 158 DOI 10.1007/s18-008-9130-2 Common ratio using delay Manel Baucells Franz H. Heukamp Published online: 4 January 2009 Springer Science+Business Media, LLC. 2009 Abstract We
Is it Possible to Define Subjective Probabilities in Purely Behavioral Terms? A Comment on Epstein-Zhang (2001)
") Is it Possible to Define Subjective Probabilities in Purely Behavioral Terms? A Comment on Epstein-Zhang (2001) Klaus Nehring University of California, Davis April 2006 Abstract It is shown that well-behaved
Is it Possible to Define Subjective Probabilities in Purely Behavioral Terms? A Comment on Epstein-Zhang (2001) Klaus Nehring University of California, Davis April 2006 Abstract It is shown that well-behaved
Agrowing body of qualitative evidence shows that loss aversion, a phenomenon formalized in prospect
 MANAGEMENT SCIENCE Vol. 53, No. 10, October 2007, pp. 1659 1674 issn 0025-1909 eissn 1526-5501 07 5310 1659 informs doi 10.1287/mnsc.1070.0711 2007 INFORMS Loss Aversion Under Prospect Theory: A Parameter-Free
Pre-probabilistic sophistication. Osamu Kada. July, 2009
 Pre-probabilistic sophistication Osamu Kada Faculty of Engineering, Yokohama National University 79-5 Tokiwadai, Hodogaya, Yokohama 240-850, Japan (E-mail: smkada@ynu.ac.jp) July, 2009 We consider pre-probabilistic
Bayesian consistent prior selection
 Bayesian consistent prior selection Christopher P. Chambers and Takashi Hayashi yzx August 2005 Abstract A subjective expected utility agent is given information about the state of the world in the form
OPTIMISM AND PESSIMISM IN GAMES
 OPTIMISM AND PESSIMISM IN GAMES Jürgen Eichberger Alfred Weber Institut, Universität Heidelberg, Germany. David Kelsey Department of Economics, University of Exeter, England. 22nd October 2010 Abstract
Ambiguity Framed. Mark Schneider, Jonathan Leland, and Nathaniel T. Wilcox
 Ambiguity Framed Mark Schneider, Jonathan Leland, and Nathaniel T. Wilcox In his exposition of subjective expected utility theory, Savage (1954) proposed that the Allais paradox could be reduced if it
Ambiguity Aversion: An Axiomatic Approach Using Second Order Probabilities
 Ambiguity Aversion: An Axiomatic Approach Using Second Order Probabilities William S. Neilson Department of Economics University of Tennessee Knoxville, TN 37996-0550 wneilson@utk.edu April 1993 Abstract
Making the Anscombe-Aumann Approach to Ambiguity Suited for Descriptive Applications
 Making the Anscombe-Aumann Approach to Ambiguity Suited for Descriptive Applications Stefan Trautmann a & Peter P. Wakker b a Dept. of Economics, Tilburg University, P.O. Box 90153, 5000 LE, the Netherlands,
Event-Separability in the Ellsberg urn
 Econ Theory (2011) 48:425 436 DOI 10.1007/s00199-011-0652-4 SYMPOSIUM Event-Separability in the Ellsberg urn Mark J. Machina Received: 5 April 2011 / Accepted: 9 June 2011 / Published online: 16 July 2011
Risk Sharing in the Small and in the Large
 Risk Sharing in the Small and in the Large Paolo Ghirardato Marciano Siniscalchi This version February 3, 2016 First version May 2014 Abstract This paper analyzes risk sharing in economies with no aggregate
Indifference Pricing with. Uncertainty Averse Preferences
 Indifference Pricing with Uncertainty Averse Preferences Flavia Giammarino A thesis submitted to the Department of Statistics of the London School of Economics and Political Science for the degree of Doctor
Risk Sharing in the Small and in the Large
 Risk Sharing in the Small and in the Large Paolo Ghirardato Marciano Siniscalchi This version March 1, 2018 First version May 2014 Abstract This paper analyzes risk sharing in economies with no aggregate
An Ambiguity Aversion Model for Decision Making under Ambiguity
 Proceedings of the Thirty-First AAAI Conference on Artificial Intelligence (AAAI-17) An Ambiguity Aversion Model for Decision Making under Ambiguity Wenjun Ma, 1 Xudong Luo, 2 Yuncheng Jiang 1 1 School
A Tailor-Made Test of Intransitive Choice
 A Tailor-Made Test of Intransitive Choice AURÉLIEN BAILLON Erasmus School of Economics, Rotterdam, the Netherlands HAN BLEICHRODT Erasmus School of Economics, Rotterdam, the Netherlands ALESSANDRA CILLO
Great Expectations. Part I: On the Customizability of Generalized Expected Utility*
 Great Expectations. Part I: On the Customizability of Generalized Expected Utility* Francis C. Chu and Joseph Y. Halpern Department of Computer Science Cornell University Ithaca, NY 14853, U.S.A. Email:
When does aggregation reduce risk aversion?
 When does aggregation reduce risk aversion? Christopher P. Chambers and Federico Echenique April 22, 2009 Abstract We study the problem of risk sharing within a household facing subjective uncertainty.
Cautious Expected Utility and the Certainty Effect
 Cautious Expected Utility and the Certainty Effect Simone Cerreia-Vioglio David Dillenberger Pietro Ortoleva February 2014 Abstract Many violations of the Independence axiom of Expected Utility can be
Small Worlds: Modeling Attitudes towards Sources of Uncertainty. October Abstract
 Small Worlds: Modeling Attitudes towards Sources of Uncertainty Chew Soo Hong and Jacob S. Sagi October 2003 Abstract In the literature on decision making under uncertainty, Ramsey and de Finetti originated
CER-ETH Center of Economic Research at ETH Zurich
 CER-ETH Center of Economic Research at ETH Zurich A Dual Approach to Ambiguity Aversion A. Bommier Working Paper 14/207 December 2014 Economics Working Paper Series A Dual Approach to Ambiguity Aversion
Bounded Rationality I: Consideration Sets
 Bounded Rationality I: Consideration Sets Mark Dean Behavioral Economics G6943 Fall 2016 Outline 1 Introduction to Bounded Rationality 2 Consideration Sets 3 Satisficing, Sequential Search and Consideration
The nature of utility is controversial. Whereas decision theory commonly assumes that utility is context
 MANAGEMENT SCIENCE Vol. 59, No. 9, September 2013, pp. 2153 2169 ISSN 0025-1909 (print) ISSN 1526-5501 (online) http://dx.doi.org/10.1287/mnsc.1120.1690 2013 INFORMS Is There One Unifying Concept of Utility?
Preference, Choice and Utility
 Preference, Choice and Utility Eric Pacuit January 2, 205 Relations Suppose that X is a non-empty set. The set X X is the cross-product of X with itself. That is, it is the set of all pairs of elements
Prospect Theory: An Analysis of Decision Under Risk
 Prospect Theory: An Analysis of Decision Under Risk Daniel Kahneman and Amos Tversky(1979) Econometrica, 47(2) Presented by Hirofumi Kurokawa(Osaka Univ.) 1 Introduction This paper shows that there are
Sealed Bid Auctions with Ambiguity: Theory and Experiments
 Sealed Bid Auctions with Ambiguity: Theory and Experiments Yan Chen Peter Katuščák Emre Ozdenoren April 4, 26 Abstract This study presents a laboratory experiment of the first and second price sealed bid
A Theory of Subjective Compound Lotteries
 A Theory of Subjective Compound Lotteries Haluk Ergin Washington University in St Louis and Faruk Gul Princeton University September 2008 Abstract We develop a Savage-type model of choice under uncertainty
A Bayesian Approach to Uncertainty Aversion
 Review of Economic Studies (2005) 72, 449 466 0034-6527/05/00190449$02.00 c 2005 The Review of Economic Studies Limited A Bayesian Approach to Uncertainty Aversion YORAM HALEVY University of British Columbia
Questions in Decision Theory
 Questions in Decision Theory Itzhak Gilboa June 15, 2011 Gilboa () Questions in Decision Theory June 15, 2011 1 / 18 History Pascal and Bernoulli Gilboa () Questions in Decision Theory June 15, 2011 2
A powerful Tool for Analyzing Concave/Convex Utility and Weighting Functions
 A powerful Tool for Analyzing Concave/Convex Utility and Weighting Functions Jingni Yang & Peter P. Wakker* Erasmus School of Economics, Erasmus University Rotterdam, Rotterdam, the Netherlands; * corresponding
A Behavioral Characterization of Plausible Priors
 A Behavioral Characterization of Plausible Priors Marciano Siniscalchi Economics Department, Northwestern University, 302 Arthur Andersen Hall, 2001 Sheridan Rd., Evanston, IL 60208. marciano@northwestern.edu
Sealed Bid Auctions with Ambiguity: Theory and Experiments
 Sealed Bid Auctions with Ambiguity: Theory and Experiments Yan Chen Peter Katuscak Emre Ozdenoren July, 23 Abstract This study presents a theoretical model and laboratory experiment of the first and second
A theory of robust experiments for choice under uncertainty
 A theory of robust experiments for choice under uncertainty S. Grant a,, J. Kline b, I. Meneghel a, J. Quiggin b, R. Tourky a a Australian National University b The University of Queensland Abstract Thought
Eliciting Gul s Theory of Disappointment Aversion by the Tradeoff Method 1 HAN BLEICHRODT. March 2007
 Eliciting Gul s Theory of Disappointment Aversion by the Tradeoff Method 1 MOHAMMED ABDELLAOUI Maison de la Recherche de l ESTP, GRID, 30 avenue du Président Wilson, 94230 Cachan, France, abdellaoui@grid.ensam.estp.fr.
Dynamic Consistency and Subjective Beliefs
 Dynamic Consistency and Subjective Beliefs Spyros Galanis June 19, 2014 Abstract Using the notion of subjective beliefs from Rigotti et al. (2008), we provide, for a wide variety of dynamic models with
Incentives in Experiments: Theory and an Experimental Test
 Incentives in Experiments: Theory and an Experimental Test Theory: Yaron Azrieli (OSU), Chris Chambers (UCSD), P.J. Healy (OSU) Experiment: Alex Brown (Texas A&M), P.J. Healy (OSU) March 2015 UC Santa
Axiomatic Foundations of Multiplier Preferences
 Axiomatic Foundations of Multiplier Preferences Tomasz trzalecki Northwestern University Abstract This paper axiomatizes the robust control criterion of multiplier preferences introduced by Hansen and
Comments on prospect theory
 Comments on prospect theory Abstract Ioanid Roşu This note presents a critique of prospect theory, and develops a model for comparison of two simple lotteries, i.e. of the form ( x 1, p1; x 2, p 2 ;...;
Range-Dependent Utility
 Range-Dependent Utility Micha l Lewandowski joint work with Krzysztof Kontek March 23, 207 Outline. Inspired by Parducci (964) we propose range-dependent utility (RDU) as a general framework for decisions
SUBJECTIVE INDEPENDENCE AND CONCAVE EXPECTED UTILITY. February 12, 2014
 SUBJECTIVE INDEPENDENCE AND CONCAVE EXPECTED UTILITY EHUD LEHRER AND ROEE TEPER February 12, 2014 Abstract. When a potential hedge between alternatives does not reduce the exposure to uncertainty, we say
Cautious and Globally Ambiguity Averse
 Ozgur Evren New Economic School August, 2016 Introduction Subject: Segal s (1987) theory of recursive preferences. Ambiguity aversion: Tendency to prefer risk to ambiguity. (Ellsberg paradox) risk objective,
TESTING AND CHARACTERIZING PROPERTIES OF NONADDITIVE MEASURES THROUGH VIOLATIONS OF THE SURE-THING PRINCIPLE
 Ž. Econometrica, Vol. 69, No. 4 July, 2001, 1039 1059 TESTING AND CHARACTERIZING PROPERTIES OF NONADDITIVE MEASURES THROUGH VIOLATIONS OF THE SURE-THING PRINCIPLE BY PETER P. WAKKER 1 In expected utility
Efficient Allocations under Ambiguity
 Efficient Allocations under Ambiguity Tomasz Strzalecki Harvard University Jan Werner University of Minnesota May 2010 Abstract An important implication of the expected utility model under risk aversion
Ambiguity Aversion Without Asymmetric Information
 Ambiguity Aversion Without Asymmetric Information Daniel Chen & Martin Schonger ETH Zurich - Center for Law and Economics www.nber.org/~dlchen www.n.ethz.ch/~scmartin Post_FUR, August 7, 4 Chen/Schonger
Ambiguity Aversion and Trade
 Ambiguity Aversion and Trade Luciano I. de Castro Alain Chateauneuf First Version: March 2008 This version: April 2011 forthcoming, Economic Theory Abstract What is the effect of ambiguity aversion on
Expected Utility Framework
 Expected Utility Framework Preferences We want to examine the behavior of an individual, called a player, who must choose from among a set of outcomes. Let X be the (finite) set of outcomes with common
Relevance and Symmetry
 elevance and Symmetry Peter Klibano y Sujoy Mukerji z Kyoungwon Seo x This Version: February 25, 2011 Abstract We de ne a behavioral concept of relevance in the context of decision making under uncertainty.
Objective Imprecise Probabilistic Information, Second Order Beliefs and Ambiguity Aversion: an Axiomatization. Raphaël Giraud
 Objective Imprecise robabilistic Information, Second Order Beliefs and Ambiguity Aversion: an Axiomatization Raphaël Giraud CRESE - University of Franche-Comté raphael.giraud@univ-fcomte.fr First version:
Rational Expectations and Ambiguity: A Comment on Abel (2002)
") Rational Expectations and Ambiguity: A Comment on Abel (2002) Alexander Ludwig and Alexander Zimper 66-20 mea Mannheimer Forschungsinstitut Ökonomie und Demographischer Wandel Gebäude L 13, 17_D-68131
Rational Expectations and Ambiguity: A Comment on Abel (2002) Alexander Ludwig and Alexander Zimper 66-20 mea Mannheimer Forschungsinstitut Ökonomie und Demographischer Wandel Gebäude L 13, 17_D-68131
Ambiguity under Growing Awareness
 Ambiguity under Growing Awareness Adam Dominiak 1 and Gerelt Tserenjigmid 2 1,2 Department of Economics, Virginia Tech September 10, 2018 Abstract In this paper, we study choice under growing awareness
Decision-making with belief functions
 Decision-making with belief functions Thierry Denœux Université de Technologie de Compiègne, France HEUDIASYC (UMR CNRS 7253) https://www.hds.utc.fr/ tdenoeux Fourth School on Belief Functions and their
Certainty Equivalent Representation of Binary Gambles That Are Decomposed into Risky and Sure Parts
 Review of Economics & Finance Submitted on 28/Nov./2011 Article ID: 1923-7529-2012-02-65-11 Yutaka Matsushita Certainty Equivalent Representation of Binary Gambles That Are Decomposed into Risky and Sure
PIER Working Paper
 Penn Institute for Economic Research Department of Economics University of Pennsylvania 3718 Locust Walk Philadelphia, PA 19104-6297 pier@econ.upenn.edu http://economics.sas.upenn.edu/pier PIER Working
Quantum Decision Theory and the Ellsberg Paradox
 7158 2018 July 2018 Quantum Decision Theory and the Ellsberg Paradox Ali al-waihi, Sanjit Dhami, Mengxing Wei Impressum: CESifo Working Papers ISSN 2364 1428 (electronic version) Publisher and distributor:
Testing for Ambiguity in Coordination Games
 Testing for Ambiguity in Coordination Games David Kelsey Department of Economics, University of Exeter, England Sara LeRoux Department of Economics Oxford Brookes University University of Exeter. September
A Behavioral Characterization of Plausible Priors
 A Behavioral Characterization of Plausible Priors Marciano Siniscalchi Economics Department, Northwestern University, and Economics Department, Princeton University. May 2003 Abstract Recent theories of
Ellsberg re-revisited: An experiment disentangling model uncertainty and risk aversion
 Ellsberg re-revisited: An experiment disentangling model uncertainty and risk aversion Loïc Berger Valentina Bosetti Abstract The results of an experiment extending Ellsberg s setup demonstrate that attitudes
Bounded Rationality I: Consideration Sets
 Bounded Rationality I: Consideration Sets Mark Dean Behavioral Economics G6943 Fall 2017 What is Bounded Rationality? Start with a standard economic model e.g. utility maximization C (A) = max x A u(x)
A SMOOTH MODEL OF DECISION MAKING UNDER AMBIGUITY
 A SMOOTH MODEL OF DECISION MAKING UNDER AMBIGUITY By Peter Klibanoff, Massimo Marinacci, and Sujoy Mukerji 1 forthcoming, Econometrica (This version: May 2005) 1 We thank N. Al-Najjar, E. Dekel, D. Fudenberg,
Choice under uncertainty
 Choice under uncertainty Expected utility theory The agent chooses among a set of risky alternatives (lotteries) Description of risky alternatives (lotteries) a lottery L = a random variable on a set of
DEPARTMENT OF ECONOMICS DISCUSSION PAPER SERIES
 ISSN 1471-0498 DEPARTMENT OF ECONOMICS DISCUSSION PAPER SERIES ORDERING AMBIGUOUS ACTS Ian Jewitt and Sujoy Mukerji Number 553 June 2011 Revised July 2013 Revised January 2014 Manor Road Building, Manor
Parametric weighting functions
 Journal of Economic Theory 144 (2009) 1102 1118 www.elsevier.com/locate/jet Parametric weighting functions Enrico Diecidue a, Ulrich Schmidt b,c, Horst Zank d, a Decision Sciences Area, INSEAD, Fontainebleau,
Bayesian Updating for General Maxmin Expected Utility Preferences
 Bayesian Updating for General Maxmin xpected Utility Preferences Marciano Siniscalchi September 14, 2001 First draft Comments welcome! Abstract A characterization of generalized Bayesian updating in a
Perceived Ambiguity and Relevant Measures
 Perceived Ambiguity and Relevant Measures Peter Klibanoff Sujoy Mukerji Kyoungwon Seo This Version: Revision dated May 17, 2014 Abstract We axiomatize preferences that can be represented by a monotonic
Cautious Expected Utility and the Certainty Effect
 Cautious Expected Utility and the Certainty Effect Simone Cerreia-Vioglio David Dillenberger Pietro Ortoleva August 2014 Abstract Many violations of the Independence axiom of Expected Utility can be traced