STATISTICAL SHAPE MODELS (SSM)
|
|
|
- Justina Weaver
- 5 years ago
- Views:
Transcription
1 STATISTICAL SHAPE MODELS (SSM) Medical Image Analysis Serena Bonaretti ISTB - Institute for Surgical Technology and Biomechanics University of Bern
2 Overview > Introduction Why are we interested in human shapes? > How do we describe shapes and their variability? Shape description From shape representation to shape space Adding shapes to the shape space Variability description From variability description to space reduction Principal Component Analysis New instances creation 2


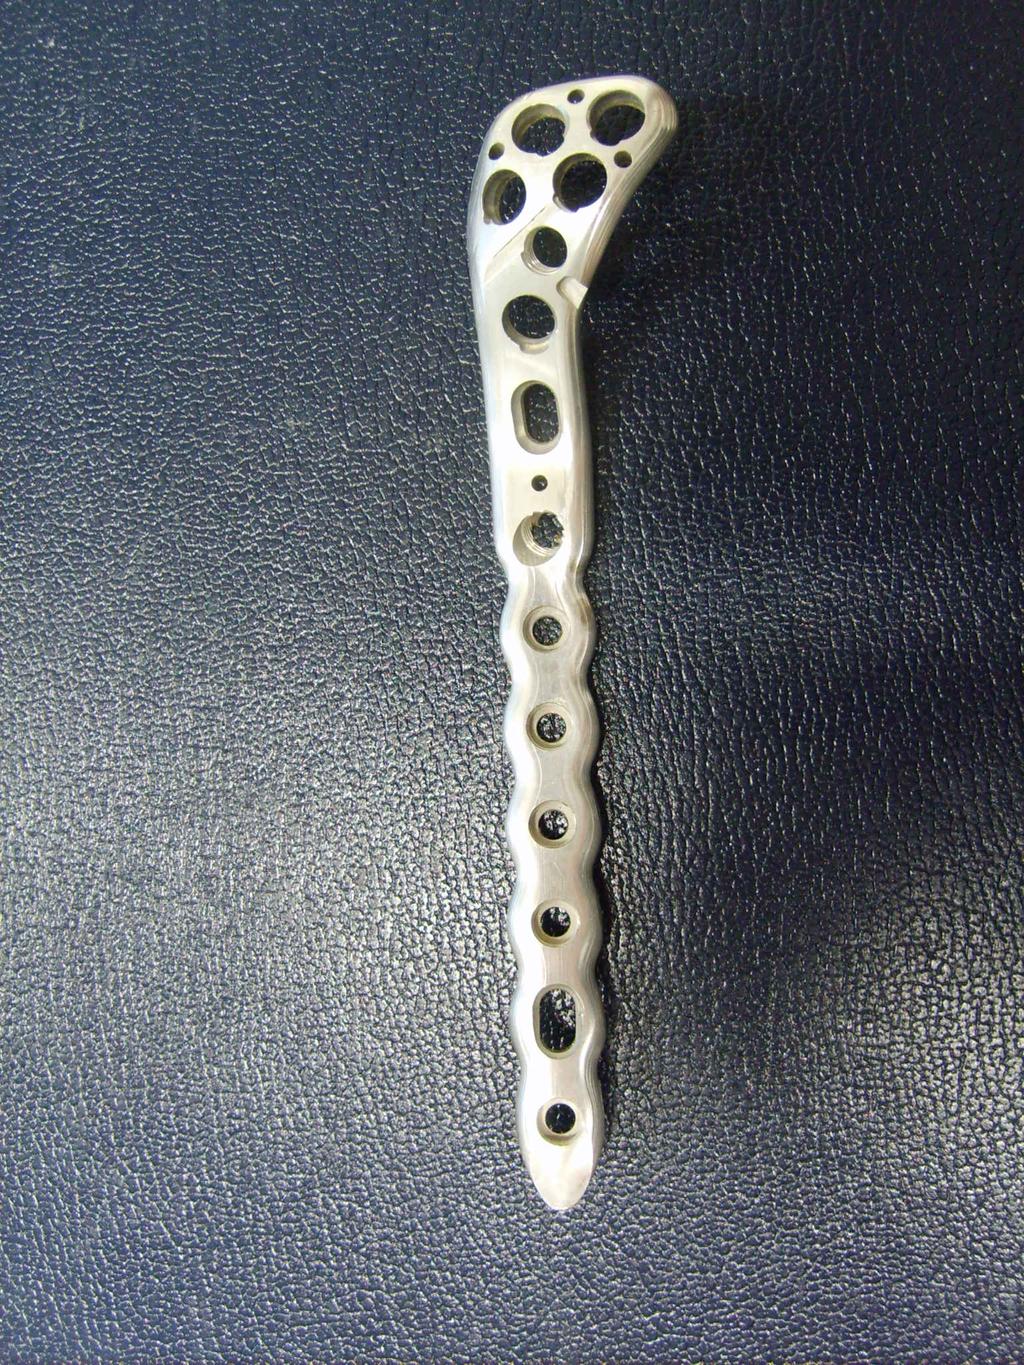
3 Why are we interested in human shapes? > Example 1: bone implant design? 3


4 Why are we interested in human shapes? > Example 2: hearing aid design? Additional problem: Ear canals change shape when people chew Rasmus R. Paulsen - DTU 4


5 Why are we interested in human shapes? > Example 3: anatomy-physiology correlation Corpus Callosum? Cognitive abilities Rasmus R. Paulsen - DTU 5


6 Why are we interested in human shapes? > Large variability among human beings Ethnicity Age Height Weight > We want to find the secrets contained in shapes > We want to describe shapes and their variability 6


7 How do we describe shapes and their variability? > University of Manchester, 1995 Timothy Cootes Chris Taylor 7
 i=987")
8 Shape representation > > Cloud of points (landmarks) Mesh i=987 (x,y,z)=(70,57,1) In any representation each point is characterized by: Id number 1 i n, n = # points 3 coordinates (x, y, z) i=987 (x,y,z)=(70,57,1) 8
9 From shape representation to shape space (x1,y1,z1), (x2,y2,z2),, (xn,yn,zn) i=1 i=2 i=n shape1 = [x1,y1,z1, x2,y2,z2,, xn,yn,zn]t i=1 (x,y,z)=(x1,y1,z1) i=2 (x,y,z)=(x2,y2,z2) i=n (x,y,z)=(xn,yn,zn) > Key concepts: The shape is represented as an array of coordinates (x,y,z) i.e. all the coordinates are put in one vector A vector can be represented as a point in its space 9
10 Shape space Shape1 = [x 1,y 1,z 1, x 2,y 2,z 2, x n,y n,z n ] T dimensional space > The bone is described as a coordinate vector > This vector can be seen as a point in the space > But the space is not 2D, not 3D, not 4D, but nd!!! > So if the shape is described by n points, the dimension of the space is 3xn (in this case: n= , so the space dimension is !)
![Adding shapes to the space Shape1 = [x 1,y 1,z 1, x 2,y 2,z 2, x n,y n,z n ] T Shape3 = [x 1,y 1,z 1, x 2,y 2,z 2, x n,y n,z n ] T Shape2 = [x 1,y 1,z 1, x 2,y 2,z 2, x n,y n,z n ] T 369.](/docs-images/96/128194802/images/11-3.jpg "600-dimensional space > We can add other shapes to our space in order to describe their variability (our initial aim) > Shape characteristics: same number of points points must be aligned in the same")
11 Adding shapes to the space Shape1 = [x 1,y 1,z 1, x 2,y 2,z 2, x n,y n,z n ] T Shape3 = [x 1,y 1,z 1, x 2,y 2,z 2, x n,y n,z n ] T Shape2 = [x 1,y 1,z 1, x 2,y 2,z 2, x n,y n,z n ] T dimensional space > We can add other shapes to our space in order to describe their variability (our initial aim) > Shape characteristics: same number of points points must be aligned in the same coordinate system points must be correspondent (same id for points in the same anatomical position) 11
12 Alignment and correspondence > How to make alignment? Rigid registration > How to make correspondence? Manually (landmarks selection) Automatically (non-rigid registration) 12
13 Let s summarize a bit > We are interested in describing shapes and their variability > Shape description The shape is conceived as points Every point is described by an id and 3 coordinates All the coordinates can be put in one vector This allows us to describe a shape as a point in a space (n-d space) We can add other shapes (with defined characteristics) to the space Shape1 = [xx ] T 1,y 1,z 1, x 2,y 2,z 2, x n,y n,z n Shape3 = [x 1,y 1,z 1, x 2,y 2,z 2, x n,y n,z n ] T Shape2 = [x 1,y 1,z 1, x 2,y 2,z 2, x n,y n,z n ] T dimensional space > Variability description 13
14 From shape description to variability description > Shape description: Shapes as n-d vectors They are in a n-d space Shape1 = [x 1,y 1,z 1, x 2,y 2,z 2, x n,y n,z n ] T > We want to describe the variability of the shapes that are in this space i.e. we want to find the patterns/common characteristics/ secrets that are contained in the shapes Shape3 = [x 1,y 1,z 1, x 2,y 2,z 2, x n,y n,z n ] T Shape2 = [x 1,y 1,z 1, x 2,y 2,z 2, x n,y n,z n ] T dimensional space 14
15 From variability description to space reduction > We want to describe the variability of the shapes that are in the n-d space > But the n-d space is huge and difficult to manage > It would be easier with a smaller space ( D à 7D / 5D / 3D, ) > So we would like to reduce our space to handle it in an easier way > How can we reduce a space? Reducing its dimension Shape1 = [x 1,y 1,z 1, x 2,y 2,z 2, x n,y n,z n ] T Shape3 = [x 1,y 1,z 1, x 2,y 2,z 2, x n,y n,z n ] T Shape2 = [x 1,y 1,z 1, x 2,y 2,z 2, x n,y n,z n ] T dimensional space 15
16 Space reduction > To describe the shape variability we reduce the shape-space dimension > While reducing the space dimension we want to preserve data information > The information that we are mostly interested in is the variability of the shapes > In a bit more formal way the variability can be described using the variance (The variance is a measure of the dispersion of the data around the mean value) Shape1 = [x 1,y 1,z 1, x 2,y 2,z 2, x n,y n,z n ] T Shape3 = [x 1,y 1,z 1, x 2,y 2,z 2, x n,y n,z n ] T Shape2 = [x 1,y 1,z 1, x 2,y 2,z 2, x n,y n,z n ] T dimensional space 16
17 Space reduction technique > We want to reduce the shape space dimension preserving data information in terms of variability > The variability can be expressed as variance > We want to use the variance as a criterion/constraint for the shape space reduction > We want to reduce the space dimension maximizing the variance > The techniques we can use is called Principal Component Analysis (PCA) Shape1 = [x 1,y 1,z 1, x 2,y 2,z 2, x n,y n,z n ] T Shape3 = [x 1,y 1,z 1, x 2,y 2,z 2, x n,y n,z n ] T Shape2 = [x 1,y 1,z 1, x 2,y 2,z 2, x n,y n,z n ] T dimensional space 17


18 Principal Component Analysis (PCA) On Lines and Planes of Closest Fit to Systems of Points in Space. 1901, Phil. Mag. Karl Pearson Analysis of a Complex of Statistical Variables with Principal Components 1933, J of Educational Psychology Harold Hotelling 18
19 Let s simplify for a while > Every bone is described as a coordinate vector: Shape i = [x1,y1,z1, x2,y2,z2, xn,yn,zn]t > Let s consider the same point (i=1) for all bones: bone 1 bone 1 bone 2 bone 2 i=1 (x,y,z)=(x1,y1,z1) bone m bone m x y z > > We have just created a matrix It tells us that: we are in a 3D space (x,y,z of 1 point) we are using 6 observations (m=6) 19
20 Let s simplify for a while > > We have put the coordinates of the point i=1 of some bones in a bone 1 bone 2 bone m matrix: x y z We can plot them in a 3D coordinate system: Point 1 of bone m Point 1 of bone Point 1 of bone
21 Let s simplify for a while > We can also subtract the average to the coordinates bone 1 bone 2 > bone m mean x y z bone 1 bone 2 bone m = and represent them again Point 1 of bone m Point 1 of bone Point 1 of bone ! Average subtraction = translation to the origin 21
22 Let s simplify for a while > We have mean-subtracted coordinates: x y z bone 1 bone 2 bone m > We want to describe their variability > So we can compute their covariance matrix (The covariance matrix describes the degree of linear dependence of two variables) covariance (y,x) cov= 1 m-1 X X T variance (X = mean-subtracted data matrix) covariance (x,y)
23 Let s simplify for a while > And finally we can compute a matrix decomposition > We can decompose our covariance matrix into other matrices = Covariance matrix Γ Λ Γ T (eigenvector matrix) (eigenvalues matrix) (eigenvector matrix) T Spectral decomposition (or Jordan decomposition): Given a symmetric matrix A, we can decompose it as the product of three matrices: A = ΓΛΓ T 23
24 Let s simplify for a while > So we can decompose our covariance matrix: = Covariance matrix Γ Λ Γ T (eigenvector matrix) (eigenvalues matrix) (eigenvector matrix) T = Covariance matrix (eigenvector matrix) (eigenvalues matrix) (eigenvector matrix) T > And we can look at the meaning of the eigenvector and eigenvalue matrices 24
25 Let s simplify for a while > Meaning of the eigenvectors (1/2) They are three columns of numbers Each column is called eigenvector or mode or principal component Each mode has the same dimension of the shape space Each mode can be considered as an axis of a new coordinate system They can be considered as the basis of the new shape space that we are looking for (they are linearly independent) So we can move/rotate/project all our points into it To do that we can consider the eigenvector matrix as a rotating matrix (eigenvector matrix) Eigenvector 3 Eigenvector Eigenvector
26 Let s simplify for a while > Meaning of the eigenvectors (2/2) We can rotate all the points to the new coordinate system It means that we can project all the points to the new coordinate system But if we choose all of them we do not reduce the space dimension Therefore we will use just some of them How do we choose just some of them? à Eigenvalues Eigenvector 3 Eigenvector Eigenvector
27 Let s simplify for a while > Meaning of the eigenvalues (1/2) The number of eigenvalues is the same as the number of eigenvectors They are ordered in a descending way Each eigenvalue corresponds to the eigenvector that has the same position Each eigenvalue represents the amount of variation that we can describe using the correspondent eigenvector So we can describe a percentage of the variations using just some modes (the ones that have a correspondent meaningful eigenvalue) (eigenvalues matrix) (eigenvector matrix) Eigenvalues:
28 Let s simplify for a while > Meaning of the eigenvalues (2/2) Each eigenvalue represents the amount of variation Therefore we can calculate this variation in terms of percentage: variation% = eigenvalues/sum(eigenvalues)x0 And we can calculate the accumulated variation (how much variation the modes describe when they are taken into account together) The percentage of variation that we describe depends on the amount of eigenvectors that we take into account (eigenvalues matrix) Percentage of variation: 66.68% 21.% 12.22% Eigenvalues: Accumulated variation: 66.68% 87.78% 0.00% 28
29 Let s simplify for a while > Let s consider our example: Eigenvalues: Percentage of variation: 66.68% 21.% 12.22% Accumulated variation: 66.68% 87.78% 0.00% Eigenvectors: > If we choose to project our data on 1 st and 2 nd mode of variation, we can describe the 87.78% of the whole variability of our dataset Eigenvector 3 0 Eigenvector Eigenvector Eigenvector Eigenvector 1 Projecting our data on meaningful modes is our way to reduce the space 29
30 Let s summarize a bit > We want to describe shape variability > We can describe the variability reducing the space dimension > We can reduce the space dimension using the PCA > The PCA is a multivariate statistical technique whose steps are: Data alignment Data mean subtraction Covariance matrix calculation Covariance matrix decomposition à eigenvectors and eigenvalues The eigenvectors are the new basis of the space The eigenvalues suggest us how many eigenvectors to take in order to reduce the space keeping a certain amount of variation among our shapes 30
31 Extension to a bigger space Point 1 of bone m Point 1 of bone 2 > D space Shape1 Point 1 of bone 1 > > PC new space The whole procedure is exactly the same as in the 3D case Number of data can be much higher à memory issue The dimension reduction makes the model very compact and this allows us to manage our data in an easier way Shape3 Shape2 31
32 What can we do with shapes in a reduced space? > We can create new instances to fill in the whole space > We can fill in along the direction of a chosen mode > We can fill in combining the modes together > In any case we know the percentage of the space that we are going to represent thanks to the eigenvalues Shape1 PC 3 Shape3 Shape2 new space 32
33 What can we do with shapes in a reduced space? > The formula that we can use to create new instances is: x = x + fb Shape1 PC 3 where: x is the new shape vector x is the average shape Φ is the chosen eigenvector b is a parameter whose value is: - (λ is the corresponding eigenvalue) 3 li b + 3 l i Shape2 Shape3 new space 33
34 What can we do with shapes in a reduced space? > Creation of new instances using the 1 st mode: x = x + f b, l 1 b b = -3 l 1 b = 0 b = +2 l 1 3 l Shape1 PC PC 1 > Comment on the value of b: λ is the variance, so l is the standard deviation in a Gaussian distribution, -3s.d. value +3s.d. represents the 99.7% of the distribution Shape2 Shape3 new space 34
35 What can we do with shapes in a reduced space? > We can create new instances using any mode (mode 1, 2, 3, ) > We can create new instances using a linear combination of modes. For example: x = x + f b + f b..., - l b + 3, l1-3 l b + l PC 1 > Any mode usually represents a variation of some bone characteristics: Mode 1: variation of length Mode 2: variation of the antitorsion angle > To understand this better, have a look at the exercise 35
Covariance to PCA. CS 510 Lecture #8 February 17, 2014
 Covariance to PCA CS 510 Lecture 8 February 17, 2014 Status Update Programming Assignment 2 is due March 7 th Expect questions about your progress at the start of class I still owe you Assignment 1 back
Covariance to PCA. CS 510 Lecture #14 February 23, 2018
 Covariance to PCA CS 510 Lecture 14 February 23, 2018 Overview: Goal Assume you have a gallery (database) of images, and a probe (test) image. The goal is to find the database image that is most similar
Unsupervised Learning: Dimensionality Reduction
 Unsupervised Learning: Dimensionality Reduction CMPSCI 689 Fall 2015 Sridhar Mahadevan Lecture 3 Outline In this lecture, we set about to solve the problem posed in the previous lecture Given a dataset,
Principal Components Analysis (PCA)
") Principal Components Analysis (PCA) Principal Components Analysis (PCA) a technique for finding patterns in data of high dimension Outline:. Eigenvectors and eigenvalues. PCA: a) Getting the data b) Centering
Principal Components Analysis (PCA) Principal Components Analysis (PCA) a technique for finding patterns in data of high dimension Outline:. Eigenvectors and eigenvalues. PCA: a) Getting the data b) Centering
Maximum variance formulation
 12.1. Principal Component Analysis 561 Figure 12.2 Principal component analysis seeks a space of lower dimensionality, known as the principal subspace and denoted by the magenta line, such that the orthogonal
Principal Component Analysis (PCA)
") Principal Component Analysis (PCA) Salvador Dalí, Galatea of the Spheres CSC411/2515: Machine Learning and Data Mining, Winter 2018 Michael Guerzhoy and Lisa Zhang Some slides from Derek Hoiem and Alysha
Principal Component Analysis (PCA) Salvador Dalí, Galatea of the Spheres CSC411/2515: Machine Learning and Data Mining, Winter 2018 Michael Guerzhoy and Lisa Zhang Some slides from Derek Hoiem and Alysha
Lecture 13. Principal Component Analysis. Brett Bernstein. April 25, CDS at NYU. Brett Bernstein (CDS at NYU) Lecture 13 April 25, / 26
 Lecture 13 April 25, / 26") Principal Component Analysis Brett Bernstein CDS at NYU April 25, 2017 Brett Bernstein (CDS at NYU) Lecture 13 April 25, 2017 1 / 26 Initial Question Intro Question Question Let S R n n be symmetric. 1
Principal Component Analysis Brett Bernstein CDS at NYU April 25, 2017 Brett Bernstein (CDS at NYU) Lecture 13 April 25, 2017 1 / 26 Initial Question Intro Question Question Let S R n n be symmetric. 1
Principal Component Analysis -- PCA (also called Karhunen-Loeve transformation)
") Principal Component Analysis -- PCA (also called Karhunen-Loeve transformation) PCA transforms the original input space into a lower dimensional space, by constructing dimensions that are linear combinations
Principal Component Analysis -- PCA (also called Karhunen-Loeve transformation) PCA transforms the original input space into a lower dimensional space, by constructing dimensions that are linear combinations
Announcements (repeat) Principal Components Analysis
 Principal Components Analysis") 4/7/7 Announcements repeat Principal Components Analysis CS 5 Lecture #9 April 4 th, 7 PA4 is due Monday, April 7 th Test # will be Wednesday, April 9 th Test #3 is Monday, May 8 th at 8AM Just hour long
4/7/7 Announcements repeat Principal Components Analysis CS 5 Lecture #9 April 4 th, 7 PA4 is due Monday, April 7 th Test # will be Wednesday, April 9 th Test #3 is Monday, May 8 th at 8AM Just hour long
Karhunen-Loève Transform KLT. JanKees van der Poel D.Sc. Student, Mechanical Engineering
 Karhunen-Loève Transform KLT JanKees van der Poel D.Sc. Student, Mechanical Engineering Karhunen-Loève Transform Has many names cited in literature: Karhunen-Loève Transform (KLT); Karhunen-Loève Decomposition
Quantitative Understanding in Biology Principal Components Analysis
 Quantitative Understanding in Biology Principal Components Analysis Introduction Throughout this course we have seen examples of complex mathematical phenomena being represented as linear combinations
CS4495/6495 Introduction to Computer Vision. 8B-L2 Principle Component Analysis (and its use in Computer Vision)
") CS4495/6495 Introduction to Computer Vision 8B-L2 Principle Component Analysis (and its use in Computer Vision) Wavelength 2 Wavelength 2 Principal Components Principal components are all about the directions
CS4495/6495 Introduction to Computer Vision 8B-L2 Principle Component Analysis (and its use in Computer Vision) Wavelength 2 Wavelength 2 Principal Components Principal components are all about the directions
Principal Component Analysis
 Principal Component Analysis November 24, 2015 From data to operators Given is data set X consisting of N vectors x n R D. Without loss of generality, assume x n = 0 (subtract mean). Let P be D N matrix
CSE 554 Lecture 7: Alignment
 CSE 554 Lecture 7: Alignment Fall 2012 CSE554 Alignment Slide 1 Review Fairing (smoothing) Relocating vertices to achieve a smoother appearance Method: centroid averaging Simplification Reducing vertex
GEOG 4110/5100 Advanced Remote Sensing Lecture 15
 GEOG 4110/5100 Advanced Remote Sensing Lecture 15 Principal Component Analysis Relevant reading: Richards. Chapters 6.3* http://www.ce.yildiz.edu.tr/personal/songul/file/1097/principal_components.pdf *For
Medical Image Analysis
 Medical Image Analysis Instructor: Moo K. Chung mchung@stat.wisc.edu Lecture 3. Deformation-based Morphometry (DBM) January 30, 2007 Deformation based Morphometry (DBM) It uses deformation fields obtained
December 20, MAA704, Multivariate analysis. Christopher Engström. Multivariate. analysis. Principal component analysis
 .. December 20, 2013 Todays lecture. (PCA) (PLS-R) (LDA) . (PCA) is a method often used to reduce the dimension of a large dataset to one of a more manageble size. The new dataset can then be used to make
Basics of Multivariate Modelling and Data Analysis
 Basics of Multivariate Modelling and Data Analysis Kurt-Erik Häggblom 6. Principal component analysis (PCA) 6.1 Overview 6.2 Essentials of PCA 6.3 Numerical calculation of PCs 6.4 Effects of data preprocessing
Principal Components Theory Notes
 Principal Components Theory Notes Charles J. Geyer August 29, 2007 1 Introduction These are class notes for Stat 5601 (nonparametrics) taught at the University of Minnesota, Spring 2006. This not a theory
1 Singular Value Decomposition and Principal Component
 Singular Value Decomposition and Principal Component Analysis In these lectures we discuss the SVD and the PCA, two of the most widely used tools in machine learning. Principal Component Analysis (PCA)
1 Principal Components Analysis
 Lecture 3 and 4 Sept. 18 and Sept.20-2006 Data Visualization STAT 442 / 890, CM 462 Lecture: Ali Ghodsi 1 Principal Components Analysis Principal components analysis (PCA) is a very popular technique for
Principal Component Analysis (PCA) Theory, Practice, and Examples
 Theory, Practice, and Examples") Principal Component Analysis (PCA) Theory, Practice, and Examples Data Reduction summarization of data with many (p) variables by a smaller set of (k) derived (synthetic, composite) variables. p k n A
Principal Component Analysis (PCA) Theory, Practice, and Examples Data Reduction summarization of data with many (p) variables by a smaller set of (k) derived (synthetic, composite) variables. p k n A
Principal Component Analysis-I Geog 210C Introduction to Spatial Data Analysis. Chris Funk. Lecture 17
 Principal Component Analysis-I Geog 210C Introduction to Spatial Data Analysis Chris Funk Lecture 17 Outline Filters and Rotations Generating co-varying random fields Translating co-varying fields into
Multivariate Statistics (I) 2. Principal Component Analysis (PCA)
 2. Principal Component Analysis (PCA)") Multivariate Statistics (I) 2. Principal Component Analysis (PCA) 2.1 Comprehension of PCA 2.2 Concepts of PCs 2.3 Algebraic derivation of PCs 2.4 Selection and goodness-of-fit of PCs 2.5 Algebraic derivation
Multivariate Statistics (I) 2. Principal Component Analysis (PCA) 2.1 Comprehension of PCA 2.2 Concepts of PCs 2.3 Algebraic derivation of PCs 2.4 Selection and goodness-of-fit of PCs 2.5 Algebraic derivation
Random Vectors, Random Matrices, and Matrix Expected Value
 Random Vectors, Random Matrices, and Matrix Expected Value James H. Steiger Department of Psychology and Human Development Vanderbilt University James H. Steiger (Vanderbilt University) 1 / 16 Random Vectors,
Dimensionality Reduction: PCA. Nicholas Ruozzi University of Texas at Dallas
 Dimensionality Reduction: PCA Nicholas Ruozzi University of Texas at Dallas Eigenvalues λ is an eigenvalue of a matrix A R n n if the linear system Ax = λx has at least one non-zero solution If Ax = λx
LECTURE 16: PCA AND SVD
 Instructor: Sael Lee CS549 Computational Biology LECTURE 16: PCA AND SVD Resource: PCA Slide by Iyad Batal Chapter 12 of PRML Shlens, J. (2003). A tutorial on principal component analysis. CONTENT Principal
Computation. For QDA we need to calculate: Lets first consider the case that
 Computation For QDA we need to calculate: δ (x) = 1 2 log( Σ ) 1 2 (x µ ) Σ 1 (x µ ) + log(π ) Lets first consider the case that Σ = I,. This is the case where each distribution is spherical, around the
Singular Value Decomposition
 Chapter 6 Singular Value Decomposition In Chapter 5, we derived a number of algorithms for computing the eigenvalues and eigenvectors of matrices A R n n. Having developed this machinery, we complete our
Structure in Data. A major objective in data analysis is to identify interesting features or structure in the data.
 Structure in Data A major objective in data analysis is to identify interesting features or structure in the data. The graphical methods are very useful in discovering structure. There are basically two
Focus was on solving matrix inversion problems Now we look at other properties of matrices Useful when A represents a transformations.
 Previously Focus was on solving matrix inversion problems Now we look at other properties of matrices Useful when A represents a transformations y = Ax Or A simply represents data Notion of eigenvectors,
Drift Reduction For Metal-Oxide Sensor Arrays Using Canonical Correlation Regression And Partial Least Squares
 Drift Reduction For Metal-Oxide Sensor Arrays Using Canonical Correlation Regression And Partial Least Squares R Gutierrez-Osuna Computer Science Department, Wright State University, Dayton, OH 45435,
Data Preprocessing Tasks
 Data Tasks 1 2 3 Data Reduction 4 We re here. 1 Dimensionality Reduction Dimensionality reduction is a commonly used approach for generating fewer features. Typically used because too many features can
Second-Order Inference for Gaussian Random Curves
 Second-Order Inference for Gaussian Random Curves With Application to DNA Minicircles Victor Panaretos David Kraus John Maddocks Ecole Polytechnique Fédérale de Lausanne Panaretos, Kraus, Maddocks (EPFL)
Signal Modeling Techniques in Speech Recognition. Hassan A. Kingravi
 Signal Modeling Techniques in Speech Recognition Hassan A. Kingravi Outline Introduction Spectral Shaping Spectral Analysis Parameter Transforms Statistical Modeling Discussion Conclusions 1: Introduction
Robot Image Credit: Viktoriya Sukhanova 123RF.com. Dimensionality Reduction
 Robot Image Credit: Viktoriya Sukhanova 13RF.com Dimensionality Reduction Feature Selection vs. Dimensionality Reduction Feature Selection (last time) Select a subset of features. When classifying novel
Point Distribution Models
 Point Distribution Models Jan Kybic winter semester 2007 Point distribution models (Cootes et al., 1992) Shape description techniques A family of shapes = mean + eigenvectors (eigenshapes) Shapes described
CS281 Section 4: Factor Analysis and PCA
 CS81 Section 4: Factor Analysis and PCA Scott Linderman At this point we have seen a variety of machine learning models, with a particular emphasis on models for supervised learning. In particular, we
Data reduction for multivariate analysis
 Data reduction for multivariate analysis Using T 2, m-cusum, m-ewma can help deal with the multivariate detection cases. But when the characteristic vector x of interest is of high dimension, it is difficult
Principal Component Analysis (PCA)
") Principal Component Analysis (PCA) Additional reading can be found from non-assessed exercises (week 8) in this course unit teaching page. Textbooks: Sect. 6.3 in [1] and Ch. 12 in [2] Outline Introduction
Principal Component Analysis (PCA) Additional reading can be found from non-assessed exercises (week 8) in this course unit teaching page. Textbooks: Sect. 6.3 in [1] and Ch. 12 in [2] Outline Introduction
Covariance and Principal Components
 COMP3204/COMP6223: Computer Vision Covariance and Principal Components Jonathon Hare jsh2@ecs.soton.ac.uk Variance and Covariance Random Variables and Expected Values Mathematicians talk variance (and
PCA, Kernel PCA, ICA
 PCA, Kernel PCA, ICA Learning Representations. Dimensionality Reduction. Maria-Florina Balcan 04/08/2015 Big & High-Dimensional Data High-Dimensions = Lot of Features Document classification Features per
Principal Component Analysis. Applied Multivariate Statistics Spring 2012
 Principal Component Analysis Applied Multivariate Statistics Spring 2012 Overview Intuition Four definitions Practical examples Mathematical example Case study 2 PCA: Goals Goal 1: Dimension reduction
Principal Component Analysis
 Principal Component Analysis Yingyu Liang yliang@cs.wisc.edu Computer Sciences Department University of Wisconsin, Madison [based on slides from Nina Balcan] slide 1 Goals for the lecture you should understand
MACHINE LEARNING. Methods for feature extraction and reduction of dimensionality: Probabilistic PCA and kernel PCA
 1 MACHINE LEARNING Methods for feature extraction and reduction of dimensionality: Probabilistic PCA and kernel PCA 2 Practicals Next Week Next Week, Practical Session on Computer Takes Place in Room GR
Principal Component Analysis (PCA) Principal Component Analysis (PCA)
 Principal Component Analysis (PCA)") Recall: Eigenvectors of the Covariance Matrix Covariance matrices are symmetric. Eigenvectors are orthogonal Eigenvectors are ordered by the magnitude of eigenvalues: λ 1 λ 2 λ p {v 1, v 2,..., v n } Recall:
Recall: Eigenvectors of the Covariance Matrix Covariance matrices are symmetric. Eigenvectors are orthogonal Eigenvectors are ordered by the magnitude of eigenvalues: λ 1 λ 2 λ p {v 1, v 2,..., v n } Recall:
Principal Component Analysis!! Lecture 11!
 Principal Component Analysis Lecture 11 1 Eigenvectors and Eigenvalues g Consider this problem of spreading butter on a bread slice 2 Eigenvectors and Eigenvalues g Consider this problem of stretching
Closed-Form Solution Of Absolute Orientation Using Unit Quaternions
 Closed-Form Solution Of Absolute Orientation Using Unit Berthold K. P. Horn Department of Computer and Information Sciences November 11, 2004 Outline 1 Introduction 2 3 The Problem Given: two sets of corresponding
Principle Components Analysis (PCA) Relationship Between a Linear Combination of Variables and Axes Rotation for PCA
 Relationship Between a Linear Combination of Variables and Axes Rotation for PCA") Principle Components Analysis (PCA) Relationship Between a Linear Combination of Variables and Axes Rotation for PCA Principle Components Analysis: Uses one group of variables (we will call this X) In
Principle Components Analysis (PCA) Relationship Between a Linear Combination of Variables and Axes Rotation for PCA Principle Components Analysis: Uses one group of variables (we will call this X) In
Frank C Porter and Ilya Narsky: Statistical Analysis Techniques in Particle Physics Chap. c /9/9 page 147 le-tex
 Frank C Porter and Ilya Narsky: Statistical Analysis Techniques in Particle Physics Chap. c08 2013/9/9 page 147 le-tex 8.3 Principal Component Analysis (PCA) 147 Figure 8.1 Principal and independent components
Chapter 4: Factor Analysis
 Chapter 4: Factor Analysis In many studies, we may not be able to measure directly the variables of interest. We can merely collect data on other variables which may be related to the variables of interest.
PCA & ICA. CE-717: Machine Learning Sharif University of Technology Spring Soleymani
 PCA & ICA CE-717: Machine Learning Sharif University of Technology Spring 2015 Soleymani Dimensionality Reduction: Feature Selection vs. Feature Extraction Feature selection Select a subset of a given
FACTOR ANALYSIS AND MULTIDIMENSIONAL SCALING
 FACTOR ANALYSIS AND MULTIDIMENSIONAL SCALING Vishwanath Mantha Department for Electrical and Computer Engineering Mississippi State University, Mississippi State, MS 39762 mantha@isip.msstate.edu ABSTRACT
FERMENTATION BATCH PROCESS MONITORING BY STEP-BY-STEP ADAPTIVE MPCA. Ning He, Lei Xie, Shu-qing Wang, Jian-ming Zhang
 FERMENTATION BATCH PROCESS MONITORING BY STEP-BY-STEP ADAPTIVE MPCA Ning He Lei Xie Shu-qing Wang ian-ming Zhang National ey Laboratory of Industrial Control Technology Zhejiang University Hangzhou 3007
Principal Component Analysis
 CSci 5525: Machine Learning Dec 3, 2008 The Main Idea Given a dataset X = {x 1,..., x N } The Main Idea Given a dataset X = {x 1,..., x N } Find a low-dimensional linear projection The Main Idea Given
MS-E2112 Multivariate Statistical Analysis (5cr) Lecture 8: Canonical Correlation Analysis
 Lecture 8: Canonical Correlation Analysis") MS-E2112 Multivariate Statistical (5cr) Lecture 8: Contents Canonical correlation analysis involves partition of variables into two vectors x and y. The aim is to find linear combinations α T x and β
MS-E2112 Multivariate Statistical (5cr) Lecture 8: Contents Canonical correlation analysis involves partition of variables into two vectors x and y. The aim is to find linear combinations α T x and β
Principal component analysis
 Principal component analysis Motivation i for PCA came from major-axis regression. Strong assumption: single homogeneous sample. Free of assumptions when used for exploration. Classical tests of significance
Registration using Dynamic Data
 Registration using Dynamic Data -- Data acquisition and analysis of dynamic data journee IRMC de Strasbourg Hyewon Seo - CNRS June15th, 2010 -Univ de Strasbourg http://lsiit.u-strasbg.fr/ Outline 1 2 3
Deriving Principal Component Analysis (PCA)
") -0 Mathematical Foundations for Machine Learning Machine Learning Department School of Computer Science Carnegie Mellon University Deriving Principal Component Analysis (PCA) Matt Gormley Lecture 11 Oct.
-0 Mathematical Foundations for Machine Learning Machine Learning Department School of Computer Science Carnegie Mellon University Deriving Principal Component Analysis (PCA) Matt Gormley Lecture 11 Oct.
Factor Analysis and Kalman Filtering (11/2/04)
") CS281A/Stat241A: Statistical Learning Theory Factor Analysis and Kalman Filtering (11/2/04) Lecturer: Michael I. Jordan Scribes: Byung-Gon Chun and Sunghoon Kim 1 Factor Analysis Factor analysis is used
CS281A/Stat241A: Statistical Learning Theory Factor Analysis and Kalman Filtering (11/2/04) Lecturer: Michael I. Jordan Scribes: Byung-Gon Chun and Sunghoon Kim 1 Factor Analysis Factor analysis is used
Statistical 2D and 3D shape analysis using Non-Euclidean Metrics
 Statistical 2D and 3D shape analysis using Non-Euclidean Metrics Rasmus Larsen, Klaus Baggesen Hilger, and Mark C. Wrobel Informatics and Mathematical Modelling, Technical University of Denmark Richard
Preprocessing & dimensionality reduction
 Introduction to Data Mining Preprocessing & dimensionality reduction CPSC/AMTH 445a/545a Guy Wolf guy.wolf@yale.edu Yale University Fall 2016 CPSC 445 (Guy Wolf) Dimensionality reduction Yale - Fall 2016
LECTURE NOTE #11 PROF. ALAN YUILLE
 LECTURE NOTE #11 PROF. ALAN YUILLE 1. NonLinear Dimension Reduction Spectral Methods. The basic idea is to assume that the data lies on a manifold/surface in D-dimensional space, see figure (1) Perform
Descriptive Statistics
 Descriptive Statistics DS GA 1002 Probability and Statistics for Data Science http://www.cims.nyu.edu/~cfgranda/pages/dsga1002_fall17 Carlos Fernandez-Granda Descriptive statistics Techniques to visualize
Principal Component Analysis for Distributed Data Sets with Updating
 Principal Component Analysis for Distributed Data Sets with Updating Zheng-Jian Bai 1, aymond H Chan 1, and Franklin T Luk 2 1 Department of Mathematics, Chinese University of Hong Kong, Shatin, NT, Hong
Linear Algebra & Geometry why is linear algebra useful in computer vision?
 Linear Algebra & Geometry why is linear algebra useful in computer vision? References: -Any book on linear algebra! -[HZ] chapters 2, 4 Some of the slides in this lecture are courtesy to Prof. Octavia
PRINCIPAL COMPONENTS ANALYSIS
 121 CHAPTER 11 PRINCIPAL COMPONENTS ANALYSIS We now have the tools necessary to discuss one of the most important concepts in mathematical statistics: Principal Components Analysis (PCA). PCA involves
Gaussian random variables inr n
 Gaussian vectors Lecture 5 Gaussian random variables inr n One-dimensional case One-dimensional Gaussian density with mean and standard deviation (called N, ): fx x exp. Proposition If X N,, then ax b
Advanced Machine Learning & Perception
 Advanced Machine Learning & Perception Instructor: Tony Jebara Topic 1 Introduction, researchy course, latest papers Going beyond simple machine learning Perception, strange spaces, images, time, behavior
PRINCIPAL COMPONENT ANALYSIS
 PRINCIPAL COMPONENT ANALYSIS 1 INTRODUCTION One of the main problems inherent in statistics with more than two variables is the issue of visualising or interpreting data. Fortunately, quite often the problem
Lecture 24: Principal Component Analysis. Aykut Erdem May 2016 Hacettepe University
 Lecture 4: Principal Component Analysis Aykut Erdem May 016 Hacettepe University This week Motivation PCA algorithms Applications PCA shortcomings Autoencoders Kernel PCA PCA Applications Data Visualization
Eigenvalues, Eigenvectors, and an Intro to PCA
 Eigenvalues, Eigenvectors, and an Intro to PCA Eigenvalues, Eigenvectors, and an Intro to PCA Changing Basis We ve talked so far about re-writing our data using a new set of variables, or a new basis.
Robust estimation of principal components from depth-based multivariate rank covariance matrix
 Robust estimation of principal components from depth-based multivariate rank covariance matrix Subho Majumdar Snigdhansu Chatterjee University of Minnesota, School of Statistics Table of contents Summary
ISSN: (Online) Volume 3, Issue 5, May 2015 International Journal of Advance Research in Computer Science and Management Studies
 Volume 3, Issue 5, May 2015 International Journal of Advance Research in Computer Science and Management Studies") ISSN: 2321-7782 (Online) Volume 3, Issue 5, May 2015 International Journal of Advance Research in Computer Science and Management Studies Research Article / Survey Paper / Case Study Available online at:
ISSN: 2321-7782 (Online) Volume 3, Issue 5, May 2015 International Journal of Advance Research in Computer Science and Management Studies Research Article / Survey Paper / Case Study Available online at:
Image Registration Lecture 2: Vectors and Matrices
 Image Registration Lecture 2: Vectors and Matrices Prof. Charlene Tsai Lecture Overview Vectors Matrices Basics Orthogonal matrices Singular Value Decomposition (SVD) 2 1 Preliminary Comments Some of this
Advanced Introduction to Machine Learning CMU-10715
 Advanced Introduction to Machine Learning CMU-10715 Principal Component Analysis Barnabás Póczos Contents Motivation PCA algorithms Applications Some of these slides are taken from Karl Booksh Research
Face Detection and Recognition
 Face Detection and Recognition Face Recognition Problem Reading: Chapter 18.10 and, optionally, Face Recognition using Eigenfaces by M. Turk and A. Pentland Queryimage face query database Face Verification
Eigenvalues, Eigenvectors, and an Intro to PCA
 Eigenvalues, Eigenvectors, and an Intro to PCA Eigenvalues, Eigenvectors, and an Intro to PCA Changing Basis We ve talked so far about re-writing our data using a new set of variables, or a new basis.
Linear Algebra for Machine Learning. Sargur N. Srihari
 Linear Algebra for Machine Learning Sargur N. srihari@cedar.buffalo.edu 1 Overview Linear Algebra is based on continuous math rather than discrete math Computer scientists have little experience with it
Intelligent Data Analysis. Principal Component Analysis. School of Computer Science University of Birmingham
 Intelligent Data Analysis Principal Component Analysis Peter Tiňo School of Computer Science University of Birmingham Discovering low-dimensional spatial layout in higher dimensional spaces - 1-D/3-D example
The Mathematics of Facial Recognition
 William Dean Gowin Graduate Student Appalachian State University July 26, 2007 Outline EigenFaces Deconstruct a known face into an N-dimensional facespace where N is the number of faces in our data set.
Recognition Using Class Specific Linear Projection. Magali Segal Stolrasky Nadav Ben Jakov April, 2015
 Recognition Using Class Specific Linear Projection Magali Segal Stolrasky Nadav Ben Jakov April, 2015 Articles Eigenfaces vs. Fisherfaces Recognition Using Class Specific Linear Projection, Peter N. Belhumeur,
Statistical Data Analysis
 DS-GA 0 Lecture notes 8 Fall 016 1 Descriptive statistics Statistical Data Analysis In this section we consider the problem of analyzing a set of data. We describe several techniques for visualizing the
18.S096 Problem Set 7 Fall 2013 Factor Models Due Date: 11/14/2013. [ ] variance: E[X] =, and Cov[X] = Σ = =
![18.S096 Problem Set 7 Fall 2013 Factor Models Due Date: 11/14/2013. [ ] variance: E[X] =, and Cov[X] = Σ = =](/thumbs/82/85647425.jpg "18.S096 Problem Set 7 Fall 2013 Factor Models Due Date: 11/14/2013. [ ] variance: E[X] =, and Cov[X] = Σ = =") 18.S096 Problem Set 7 Fall 2013 Factor Models Due Date: 11/14/2013 1. Consider a bivariate random variable: [ ] X X = 1 X 2 with mean and co [ ] variance: [ ] [ α1 Σ 1,1 Σ 1,2 σ 2 ρσ 1 σ E[X] =, and Cov[X]
18.S096 Problem Set 7 Fall 2013 Factor Models Due Date: 11/14/2013 1. Consider a bivariate random variable: [ ] X X = 1 X 2 with mean and co [ ] variance: [ ] [ α1 Σ 1,1 Σ 1,2 σ 2 ρσ 1 σ E[X] =, and Cov[X]
Principal Component Analysis (PCA) CSC411/2515 Tutorial
 CSC411/2515 Tutorial") Principal Component Analysis (PCA) CSC411/2515 Tutorial Harris Chan Based on previous tutorial slides by Wenjie Luo, Ladislav Rampasek University of Toronto hchan@cs.toronto.edu October 19th, 2017 (UofT)
Principal Component Analysis (PCA) CSC411/2515 Tutorial Harris Chan Based on previous tutorial slides by Wenjie Luo, Ladislav Rampasek University of Toronto hchan@cs.toronto.edu October 19th, 2017 (UofT)
Principal Component Analysis
 Principal Component Analysis Yuanzhen Shao MA 26500 Yuanzhen Shao PCA 1 / 13 Data as points in R n Assume that we have a collection of data in R n. x 11 x 21 x 12 S = {X 1 =., X x 22 2 =.,, X x m2 m =.
Designing Information Devices and Systems II Fall 2015 Note 5
 EE 16B Designing Information Devices and Systems II Fall 01 Note Lecture given by Babak Ayazifar (9/10) Notes by: Ankit Mathur Spectral Leakage Example Compute the length-8 and length-6 DFT for the following
Applied Multivariate Analysis
 Department of Mathematics and Statistics, University of Vaasa, Finland Spring 2017 Dimension reduction Principal Component Analysis (PCA) The problem in exploratory multivariate data analysis usually is
Multivariate Statistical Analysis
 Multivariate Statistical Analysis Fall 2011 C. L. Williams, Ph.D. Lecture 4 for Applied Multivariate Analysis Outline 1 Eigen values and eigen vectors Characteristic equation Some properties of eigendecompositions
Lecture: Face Recognition and Feature Reduction
 Lecture: Face Recognition and Feature Reduction Juan Carlos Niebles and Ranjay Krishna Stanford Vision and Learning Lab Lecture 11-1 Recap - Curse of dimensionality Assume 5000 points uniformly distributed
20 Unsupervised Learning and Principal Components Analysis (PCA)
") 116 Jonathan Richard Shewchuk 20 Unsupervised Learning and Principal Components Analysis (PCA) UNSUPERVISED LEARNING We have sample points, but no labels! No classes, no y-values, nothing to predict. Goal:
116 Jonathan Richard Shewchuk 20 Unsupervised Learning and Principal Components Analysis (PCA) UNSUPERVISED LEARNING We have sample points, but no labels! No classes, no y-values, nothing to predict. Goal:
A Tutorial on Data Reduction. Principal Component Analysis Theoretical Discussion. By Shireen Elhabian and Aly Farag
 A Tutorial on Data Reduction Principal Component Analysis Theoretical Discussion By Shireen Elhabian and Aly Farag University of Louisville, CVIP Lab November 2008 PCA PCA is A backbone of modern data
DATA MINING LECTURE 8. Dimensionality Reduction PCA -- SVD
 DATA MINING LECTURE 8 Dimensionality Reduction PCA -- SVD The curse of dimensionality Real data usually have thousands, or millions of dimensions E.g., web documents, where the dimensionality is the vocabulary
Principal component analysis
 Principal component analysis Angela Montanari 1 Introduction Principal component analysis (PCA) is one of the most popular multivariate statistical methods. It was first introduced by Pearson (1901) and
[POLS 8500] Review of Linear Algebra, Probability and Information Theory
![[POLS 8500] Review of Linear Algebra, Probability and Information Theory](/thumbs/72/67586683.jpg "[POLS 8500] Review of Linear Algebra, Probability and Information Theory") [POLS 8500] Review of Linear Algebra, Probability and Information Theory Professor Jason Anastasopoulos ljanastas@uga.edu January 12, 2017 For today... Basic linear algebra. Basic probability. Programming
[POLS 8500] Review of Linear Algebra, Probability and Information Theory Professor Jason Anastasopoulos ljanastas@uga.edu January 12, 2017 For today... Basic linear algebra. Basic probability. Programming
Eigenfaces. Face Recognition Using Principal Components Analysis
 Eigenfaces Face Recognition Using Principal Components Analysis M. Turk, A. Pentland, "Eigenfaces for Recognition", Journal of Cognitive Neuroscience, 3(1), pp. 71-86, 1991. Slides : George Bebis, UNR
Multidimensional heritability analysis of neuroanatomical shape. Jingwei Li
 Multidimensional heritability analysis of neuroanatomical shape Jingwei Li Brain Imaging Genetics Genetic Variation Behavior Cognition Neuroanatomy Brain Imaging Genetics Genetic Variation Neuroanatomy
Eigenvalues, Eigenvectors, and an Intro to PCA
 Eigenvalues, Eigenvectors, and an Intro to PCA Eigenvalues, Eigenvectors, and an Intro to PCA Changing Basis We ve talked so far about re-writing our data using a new set of variables, or a new basis.
CSC 411 Lecture 12: Principal Component Analysis
 CSC 411 Lecture 12: Principal Component Analysis Roger Grosse, Amir-massoud Farahmand, and Juan Carrasquilla University of Toronto UofT CSC 411: 12-PCA 1 / 23 Overview Today we ll cover the first unsupervised
Principal Component Analysis
 B: Chapter 1 HTF: Chapter 1.5 Principal Component Analysis Barnabás Póczos University of Alberta Nov, 009 Contents Motivation PCA algorithms Applications Face recognition Facial expression recognition