Unit 2, Lesson 1: One of These Things Is Not Like the Others
|
|
|
- Alvin McGee
- 5 years ago
- Views:
Transcription

1 Unit 2, Lesson 1: One of These Things Is Not Like the Others Let s remember what equivalent ratios are. 1.1: Remembering Double Number Lines 1. Complete the double number line diagram with the missing numbers. 2. What could each of the number lines represent? Invent a situation and label the diagram. 3. Make sure your labels include appropriate units of measure. 1.2: Mystery Mixtures Your teacher will show you three mixtures. Two taste the same, and one is different. 1. Which mixture tastes different? Describe how it is different. 1
2 2. Here are the recipes that were used to make the three mixtures: 1 cup of water with teaspoons of powdered drink mix 2 cups of water with teaspoon of powdered drink mix 1 cup of water with teaspoon of powdered drink mix Which of these recipes is for the stronger tasting mixture? Explain how you know. Are you ready for more? Will any of these mixtures taste exactly the same? Mixture A: 2 cups water, 4 teaspoons salt, 0.25 cup sugar Mixture B: 1.5 cups water, 3 teaspoons salt, 0.2 cup sugar Mixture C: 1 cup water, 2 teaspoons salt, cup sugar 2
3 1.3: Crescent Moons m.openup.org/1/ Here are four different crescent moon shapes. 1. What do moons A, B, and C all have in common that moon D doesn t? 2. Use numbers to describe how moons A, B, and C are different from moon D. 3. Use a table or a double number line to show how moons A, B, and C are different from moon D. 3

4 Lesson 1 Summary When two different situations can be described by equivalent ratios, that means they are alike in some important way. An example is a recipe. If two people make something to eat or drink, the taste will only be the same as long as the ratios of the ingredients are equivalent. For example, all of the mixtures of water and drink mix in this table taste the same, because the ratios of cups of water to scoops of drink mix are all equivalent ratios. water (cups) drink mix (scoops) If a mixture were not equivalent to these, for example, if the ratio of cups of water to scoops of drink mix were, then the mixture would taste different. Notice that the ratios of pairs of corresponding side lengths are equivalent in figures A, B, and C. For example, the ratios of the length of the top side to the length of the left side for figures A, B, and C are equivalent ratios. Figures A, B, and C are scaled copies of each other; this is the important way in which they are alike. If a figure has corresponding sides that are not in a ratio equivalent to these, like figure D, then it s not a scaled copy. In this unit, you will study relationships like these that can be described by a set of equivalent ratios. Lesson 1 Glossary Terms equivalent ratios Unit 2: Introducing Proportional Relationships Not Like the Others Lesson 1: One of These Things Is 4 4

5 Unit 2, Lesson 2: Introducing Proportional Relationships with Tables Let s solve problems involving proportional relationships using tables. 2.1: Notice and Wonder: Paper Towels by the Case Here is a table that shows how many rolls of paper towels a store receives when they order different numbers of cases. What do you notice about the table? What do you wonder? 2.2: Feeding a Crowd 1. A recipe says that 2 cups of dry rice will serve 6 people. Complete the table as you answer the questions. Be prepared to explain your reasoning. 5
6 a. How many people will 10 cups of rice serve? cups of rice number of people b. How many cups of rice are needed to serve 45 people?
7 2. A recipe says that 6 spring rolls will serve 3 people. Complete the table. number of spring rolls number of people : Making Bread Dough A bakery uses 8 tablespoons of honey for every 10 cups of flour to make bread dough. Some days they bake bigger batches and some days they bake smaller batches, but they always use the same ratio of honey to flour. Complete the table as you answer the questions. Be prepared to explain your reasoning. 1. How many cups of flour do they use with 20 tablespoons of honey? honey (tbsp) flour (c) 2. How many cups of flour do they use with 13 tablespoons of honey? 3. How many tablespoons of honey do they use with 20 cups of flour? What is the proportional relationship represented by this table? 7
8 2.4: Quarters and Dimes 4 quarters are equal in value to 10 dimes. 1. How many dimes equal the value of 6 quarters? 2. How many dimes equal the value of 14 quarters? number of quarters 1 number of dimes 3. What value belongs next to the 1 in the table? What does it mean in this context? Are you ready for more? Pennies made before 1982 are 95% copper and weigh about 3.11 grams each. (Pennies made after that date are primarily made of zinc). Some people claim that the value of the copper in one of these pennies is greater than the face value of the penny. Find out how much copper is worth right now, and decide if this claim is true. 8
9 Lesson 2 Summary If the ratios between two corresponding quantities are always equivalent, the relationship between the quantities is called a proportional relationship. This table shows different amounts of milk and chocolate syrup. The ingredients in each row, when mixed together, would make a different total amount of chocolate milk, but these mixtures would all taste the same. Notice that each row in the table shows a ratio of tablespoons of chocolate syrup to cups of milk that is equivalent to. tablespoons of cups of chocolate syrup milk About the relationship between these quantities, we could say: relationship. of milk. The relationship between amount of chocolate syrup and amount of milk is proportional. The relationship between the amount of chocolate syrup and the amount of milk is a proportional The table represents a proportional relationship between the amount of chocolate syrup and amount The amount of milk is proportional to the amount of chocolate syrup. We could multiply any value in the chocolate syrup column by to get the value in the milk column. We might call a unit rate, because cups of milk are needed for 1 tablespoon of chocolate syrup. We also say that is the constant of proportionality for this relationship. It tells us how many cups of milk we would need to mix with 1 tablespoon of chocolate syrup. Lesson 2 Glossary Terms proportional relationship constant of proportionality Unit 2: Introducing Proportional Relationships Proportional Relationships with Tables Lesson 2: Introducing 9 5
10 Unit 2, Lesson 3: More about Constant of Proportionality Let s solve more problems involving proportional relationships using tables. 3.1: Equal Measures Use the numbers and units from the list to find as many equivalent measurements as you can. For example, you might write 30 minutes is hour. You can use the numbers and units more than once centimeter meter hour 60 6 feet minute inch 3.2: Centimeters and Millimeters There is a proportional relationship between any length measured in centimeters and the same length measured in millimeters. 10
 9 12.5 50 length (mm) 88.49 2. If you know the length of something in millimeters, you can calculate its length in centimeters. a.")
11 There are two ways of thinking about this proportional relationship. 1. If you know the length of something in centimeters, you can calculate its length in millimeters. a. Complete the table. b. What is the constant of proportionality? length (cm) length (mm) If you know the length of something in millimeters, you can calculate its length in centimeters. a. Complete the table. b. What is the constant of proportionality? length (mm) length (cm) How are these two constants of proportionality related to each other? 11
12 4. Complete each sentence: a. To convert from centimeters to millimeters, you can multiply by. b. To convert from millimeters to centimeters, you can divide by or multiply by. 12

13 Are you ready for more? 1. How many square millimeters are there in a square centimeter? 2. How do you convert square centimeters to square millimeters? How do you convert the other way? 3.3: Pittsburgh to Phoenix On its way from New York to San Diego, a plane flew over Pittsburgh, Saint Louis, Albuquerque, and Phoenix traveling at a constant speed. Complete the table as you answer the questions. Be prepared to explain your reasoning. segment time distance speed Pittsburgh to Saint Louis 1 hour 550 miles Saint Louis to Albuquerque 1 hour 42 minutes Albuquerque to Phoenix 330 miles 1. What is the distance between Saint Louis and Albuquerque? 2. How many minutes did it take to fly between Albuquerque and Phoenix? 3. What is the proportional relationship represented by this table? 4. Diego says the constant or proportionality is 550. Andre says the constant of proportionality is. Do you agree with either of them? Explain your reasoning. 13


14 Lesson 3 Summary When something is traveling at a constant speed, there is a proportional relationship between the time it takes and the distance traveled. The table shows the distance traveled and elapsed time for a bug crawling on a sidewalk. We can multiply any number in the first column by to get the corresponding number in the second column. We can say that the elapsed time is proportional to the distance traveled, and the constant of proportionality is. This means that the bug s pace is seconds per centimeter. This table represents the same situation, except the columns are switched. We can multiply any number in the first column by to get the corresponding number in the second column. We can say that the distanced traveled is proportional to the elapsed time, and the constant of proportionality is. This means that the bug s speed is centimeters per second. Notice that is the reciprocal of. When two quantities are in a proportional relationship, there are two constants of proportionality, and they are always reciprocals of each other. When we represent a proportional relationship with a table, we say the quantity in the second column is proportional to the quantity in the first column, and the corresponding constant of proportionality is the number we multiply values in the first column to get the values in the second. Unit 2: Introducing Proportional Relationships of Proportionality Lesson 3: More about Constant 14 5
15 Unit 2, Lesson 4: Proportional Relationships and Equations Let s write equations describing proportional relationships. 4.1: Number Talk: Division Find each quotient mentally. 4.2: Feeding a Crowd, Revisited 1. A recipe says that 2 cups of dry rice will serve 6 people. Complete the table as you answer the questions. Be prepared to explain your reasoning. a. How many people will 1 cup of rice serve? cups of dry rice number of people b. How many people will 3 cups of rice serve? 12 cups? 43 cups? c. How many people will cups of rice serve?
16 2. A recipe says that 6 spring rolls will serve 3 people. Complete the table as you answer the questions. Be prepared to explain your reasoning. a. How many people will 1 spring roll serve? b. How many people will 10 spring rolls serve? 16 spring rolls? 25 spring rolls? c. How many people will spring rolls serve? number of spring rolls number of people How was completing this table different from the previous table? How was it the same? 16
 distance (miles) speed (miles per hour) 1 1.5 915 2 2.5 2. How far does the plane fly in one hour? 3. How far would the plane fly in hours at this speed? 4.")
17 4.3: Denver to Chicago A plane flew at a constant speed between Denver and Chicago. It took the plane 1.5 hours to fly 915 miles. 1. Complete the table. time (hours) distance (miles) speed (miles per hour) How far does the plane fly in one hour? 3. How far would the plane fly in hours at this speed? 4. If represents the distance that the plane flies at this speed for hours, write an equation that relates and. 5. How far would the plane fly in 3 hours at this speed? in 3.5 hours? Explain or show your reasoning. 17
18 Are you ready for more? A rocky planet orbits Proxima Centauri, a star that is about 1.3 parsecs from Earth. This planet is the closest planet outside of our solar system. 1. How long does it take light from Proxima Centauri to reach the Earth? (A parsec is about 3.26 light years. A light year is the distance light travels in one year.) 2. There are two twins. One twin leaves on a spaceship to explore the planet near Proxima Centauri traveling at 90% of the speed of light, while the other twin stays home on Earth. How much does the twin on Earth age while the other twin travels to Proxima Centauri? (Do you think the answer would be the same for the other twin? Consider researching "The Twin Paradox" to learn more.) 4.4: Revisiting Bread Dough A bakery uses 8 tablespoons of honey for every 10 cups of flour to make bread dough. Some days they bake bigger batches and some days they bake smaller batches, but they always use the same ratio of honey to flour. 1. Complete the table. 2. If is the cups of flour needed for tablespoons of honey, write an equation that relates and. honey (tbsp) 1 flour (c) 3. How much flour is needed for 15 tablespoons of honey? 17 tablespoons? Explain or show your reasoning
19 Lesson 4 Summary The table shows the amount of red paint and blue paint needed to make a certain shade of purple paint, called Venusian Sunset. red paint (parts) blue paint (parts) Note that parts can be any unit for volume. If we mix 3 cups of red with 12 cups of blue, you will get the same shade as if we mix 3 teaspoons of red with 12 teaspoons of blue The last row in the table says that if we know the amount of red paint needed,, we can always multiply it by 4 to find the amount of blue paint needed,, to mix with it to make Venusian Sunset. We can say this more succinctly with the equation. So the amount of blue paint is proportional to the amount of red paint and the constant of proportionality is 4. We can also look at this relationship the other way around. If we know the amount of blue paint needed,, we can always multiply it by to find the amount of red paint needed,, to mix with it to make Venusian Sunset. So. The amount of blue paint is proportional to the amount of red paint and the constant of proportionality. blue paint red paint (parts) (parts) In general, when is proportional to, we can always multiply by the same number the constant of proportionality to get. We can write this much more succinctly with the equation. Unit 2: Introducing Proportional Relationships Relationships and Equations Lesson 4: Proportional 19 5


20 Unit 2, Lesson 5: Two Equations for Each Relationship Let s investigate the equations that represent proportional relationships. 5.1: Missing Figures Here are the second and fourth figures in a pattern. 1. What do you think the first and third figures in the pattern look like? 2. Describe the 10th figure in the pattern. 20
21 5.2: Meters and Centimeters There are 100 centimeters (cm) in every meter (m). length (m) length (cm) length (cm) length (m) Complete each of the tables. 2. For each table, find the constant of proportionality. 3. What is the relationship between these constants of proportionality? 4. For each table, write an equation for the proportional relationship. Let represent a length measured in meters and represent the same length measured in centimeters. Are you ready for more? 1. How many cubic centimeters are there in a cubic meter? 2. How do you convert cubic centimeters to cubic meters? 3. How do you convert the other way? 21
22 5.3: Filling a Water Cooler It took Priya 5 minutes to fill a cooler with 8 gallons of water from a faucet that was flowing at a steady rate. Let be the number of gallons of water in the cooler after minutes. 1. Which of the following equations represent the relationship between and? Select all that apply. A. B. C. D. 2. What does 1.6 tell you about the situation? 3. What does tell you about the situation? 4. Priya changed the rate at which water flowed through the faucet. Write an equation that represents the relationship of and when it takes 3 minutes to fill the cooler with 1 gallon of water. 5. Was the cooler filling faster before or after Priya changed the rate of water flow? Explain how you know. 22

23 5.4: Feeding Shrimp At an aquarium, a shrimp is fed gram of food each feeding and is fed 3 times each day. 1. How much food does a shrimp get fed in one day? 2. Complete the table to show how many grams of food the shrimp is fed over different numbers of days. number of days food in grams What is the constant of proportionality? What does it tell us about the situation? 4. If we switched the columns in the table, what would be the constant of proportionality? Explain your reasoning. 5. Use for number of days and for amount of food in grams that a shrimp eats to write two equations that represent the relationship between and. 6. If a tank has 10 shrimp in it, how much food is added to the tank each day? 7. If the aquarium manager has 300 grams of shrimp food for this tank of 10 shrimp, how many days will it last? Explain or show your reasoning. 23
24 Lesson 5 Summary If Kiran rode his bike at a constant 10 miles per hour, his distance in miles, number of hours,, that he rode. We can write the equation, is proportional to the With this equation, it is easy to find the distance Kiran rode when we know how long it took because we can just multiply the time by 10. We can rewrite the equation: This version of the equation tells us that the amount of time he rode is proportional to the distance he traveled, and the constant of proportionality is. That form is easier to use when we know his distance and want to find how long it took because we can just multiply the distance by. When two quantities and are in a proportional relationship, we can write the equation and say, is proportional to. In this case, the number is the corresponding constant of proportionality. We can also write the equation and say, is proportional to. In this case, the number is the corresponding constant of proportionality. Each one can be useful depending on the information we have and the quantity we are trying to figure out. Unit 2: Introducing Proportional Relationships Each Relationship Lesson 5: Two Equations for 24 5
25 Unit 2, Lesson 6: Using Equations to Solve Problems Let s use equations to solve problems involving proportional relationships. 6.1: Number Talk: Quotients with Decimal Points 1. Without calculating, order the quotients of these expressions from least to greatest. 2. a. Place the decimal point in the appropriate location in the quotient: b. Use this answer to find the quotient of one of the previous expressions. 6.2: Concert Ticket Sales A performer expects to sell 5,000 tickets for an upcoming concert. They want to make a total of $311,000 in sales from these tickets. 1. Assuming that all tickets have the same price, what is the price for one ticket? 2. How much will they make if they sell 7,000 tickets? 25
26 3. How much will they make if they sell 10,000 tickets? 50,000? 120,000? a million? tickets? 4. If they make $379,420, how many tickets have they sold? 5. How many tickets will they have to sell to make $5,000,000? 6.3: Recycling Aluminum cans can be recycled instead of being thrown in the garbage. The weight of 10 aluminum cans is 0.16 kilograms. The aluminum in 10 cans that are recycled has a value of $ If a family threw away 2.4 kg of aluminum in a month, how many cans did they throw away? Explain or show your reasoning. 2. What would be the recycled value of those same cans? Explain or show your reasoning. 26
27 3. Write an equation to represent the number of cans given their weight. 4. Write an equation to represent the recycled value of cans. 5. Write an equation to represent the recycled value of kilograms of aluminum. Are you ready for more? The EPA estimated that in 2013, the average amount of garbage produced in the United States was 4.4 pounds per person per day. At that rate, how long would it take your family to produce a ton of garbage? (A ton is 2,000 pounds.) Lesson 6 Summary Remember that if there is a proportional relationship between two quantities, their relationship can be represented by an equation of the form. Sometimes writing an equation is the easiest way to solve a problem. For example, we know that Denali, the highest mountain peak in North America, is 20,300 feet above sea level. How many miles is that? There are 5,280 feet in 1 mile. This relationship can be represented by the equation where represents a distance measured in feet and represents the same distance measured miles. Since we know Denali is 20,310 feet above sea level, we can write So, which is approximately 3.85 miles. Unit 2: Introducing Proportional Relationships Solve Problems Lesson 6: Using Equations to 27 3
28 Unit 2, Lesson 7: Comparing Relationships with Tables Let s explore how proportional relationships are different from other relationships. 7.1: Adjusting a Recipe A lemonade recipe calls for the juice of 5 lemons, 2 cups of water, and 2 tablespoons of honey. Invent four new versions of this lemonade recipe: 1. One that would make more lemonade but taste the same as the original recipe. 2. One that would make less lemonade but taste the same as the original recipe. 3. One that would have a stronger lemon taste than the original recipe. 4. One that would have a weaker lemon taste than the original recipe. 28
29 7.2: Visiting the State Park Entrance to a state park costs $6 per vehicle, plus $2 per person in the vehicle. 1. How much would it cost for a car with 2 people to enter the park? 4 people? 10 people? Record your answers in the table. number of people in vehicle total entrance cost in dollars For each row in the table, if each person in the vehicle splits the entrance cost equally, how much will each person pay? 3. How might you determine the entrance cost for a bus with 50 people? 4. Is the relationship between the number of people and the total entrance cost a proportional relationship? Explain how you know. Are you ready for more? What equation could you use to find the total entrance cost for a vehicle with any number of people? 29
30 7.3: Running Laps Han and Clare were running laps around the track. The coach recorded their times at the end of laps 2, 4, 6, and 8. Han's run: distance (laps) time (minutes) minutes per lap Clare's run: distance (laps) time (minutes) minutes per lap Is Han running at a constant pace? Is Clare? How do you know? 2. Write an equation for the relationship between distance and time for anyone who is running at a constant pace. 30
31 Lesson 7 Summary Here are the prices for some smoothies at two different smoothie shops: Smoothie Shop A Smoothie Shop B smoothie size (oz) price ($) dollars per ounce smoothie size (oz) price ($) dollars per ounce ?????? For Smoothie Shop A, smoothies cost $0.75 per ounce no matter which size we buy. There could be a proportional relationship between smoothie size and the price of the smoothie. An equation representing this relationship is where represents size in ounces and represents price in dollars. (The relationship could still not be proportional, if there were a different size on the menu that did not have the same price per ounce.) For Smoothie Shop B, the cost per ounce is different for each size. Here the relationship between smoothie size and price is definitely not proportional. In general, two quantities in a proportional relationship will always have the same quotient. When we see some values for two related quantities in a table and we get the same quotient when we divide them, that means they might be in a proportional relationship but if we can't see all of the possible pairs, we can't be completely sure. However, if we know the relationship can be represented by an equation is of the form, then we are sure it is proportional. Unit 2: Introducing Proportional Relationships Relationships with Tables Lesson 7: Comparing 31 4


32 Unit 2, Lesson 8: Comparing Relationships with Equations Let s develop methods for deciding if a relationship is proportional. 8.1: Notice and Wonder: Patterns with Rectangles Do you see a pattern? What predictions can you make about future rectangles in the set if your pattern continues? 32
33 8.2: More Conversions The other day you worked with converting meters, centimeters, and millimeters. Here are some more unit conversions. 1. Use the equation, where represents degrees Fahrenheit and represents degrees Celsius, to complete the table. temperature temperature Use the equation, where represents the length in centimeters and represents the length in inches, to complete the table. length (in) length (cm) Are these proportional relationships? Explain why or why not. 33


34 8.3: Total Edge Length, Surface Area, and Volume Here are some cubes with different side lengths. Complete each table. Be prepared to explain your reasoning. 1. How long is the total edge length of each cube? 2. What is the surface area of each cube? side surface side total length area length edge length
35 3. What is the volume of each cube? 4. Which of these relationships is proportional? Explain how you know. side length volume Write equations for the total edge length, total surface area, and volume of a cube with side length. 35
36 Are you ready for more? 1. A rectangular solid has a square base with side length, height 8, and volume. Is the relationship between and a proportional relationship? 2. A different rectangular solid has length, width 10, height 5, and volume. Is the relationship between and a proportional relationship? 3. Why is the relationship between the side length and the volume proportional in one situation and not the other? 8.4: All Kinds of Equations Here are six different equations. 1. Predict which of these equations represent a proportional relationship. 2. Complete each table using the equation that represents the relationship. 36
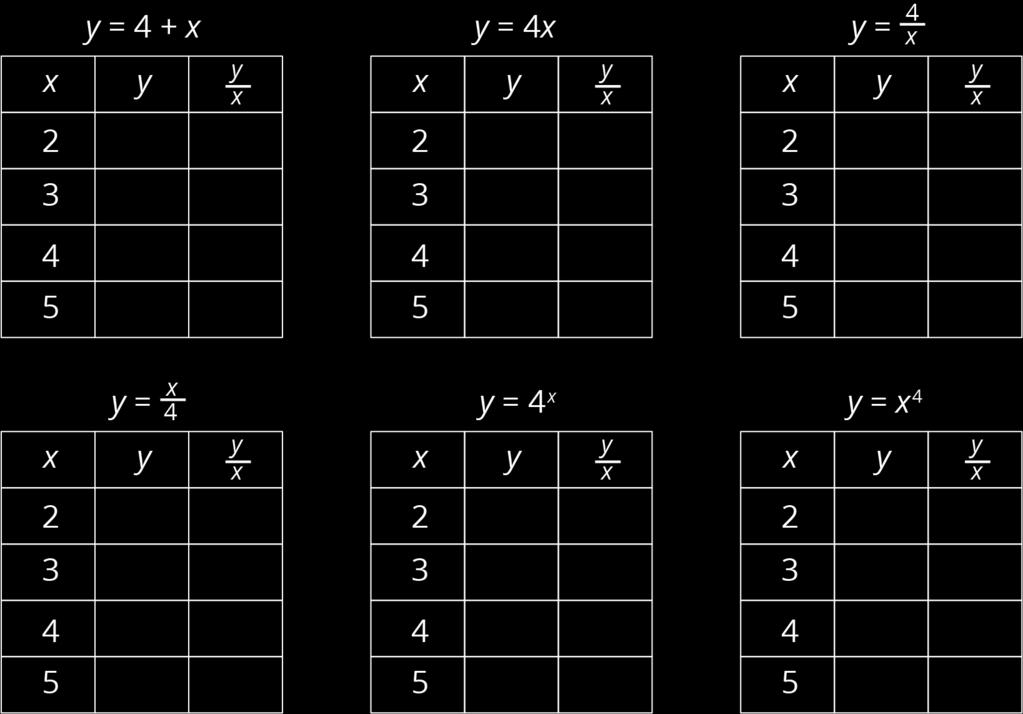
37 37
38 3. Do these results change your answer to the first question? Explain your reasoning. 4. What do the equations of the proportional relationships have in common? Lesson 8 Summary If two quantities are in a proportional relationship, then their quotient is always the same. This table represents different values of and, two quantities that are in a proportional relationship Notice that the quotient of and is always 5. To write this as an equation, we could say. If this is true, then. (This doesn t work if, but it works otherwise.) If quantity is proportional to quantity, we will always see this pattern: will always have the same value. This value is the constant of proportionality, which we often refer to as. We can represent this relationship with the equation (as long as is not 0) or. Note that if an equation cannot be written in this form, then it does not represent a proportional relationship. Unit 2: Introducing Proportional Relationships Relationships with Equations Lesson 8: Comparing 38 7
39 Unit 2, Lesson 9: Solving Problems about Proportional Relationships Let s solve problems about proportional relationships. 9.1: What Do You Want to Know? Consider the problem: A person is running a distance race at a constant rate. What time will they finish the race? What information would you need to be able to solve the problem? 39
40 9.2: Info Gap: Biking and Rain Your teacher will give you either a problem card or a data card. Do not show or read your card to your partner. If your teacher gives you the problem card: If your teacher gives you the data card: 1. Silently read your card and think about what information you need to answer the question. 2. Ask your partner for the specific information that you need. 3. Explain to your partner how you are using the information to solve the problem. 4. Solve the problem and explain your reasoning to your partner. 1. Silently read the information on your card. 2. Ask your partner What specific information do you need? and wait for your partner to ask for information. Only give information that is on your card. (Do not figure out anything for your partner!) 3. Before telling your partner the information, ask Why do you need that information? 4. After your partner solves the problem, ask them to explain their reasoning and listen to their explanation. Pause here so your teacher can review your work. Ask your teacher for a new set of cards and repeat the activity, trading roles with your partner. 40
41 9.3: Moderating Comments A company is hiring people to read through all the comments posted on their website to make sure they are appropriate. Four people applied for the job and were given one day to show how quickly they could check comments. Person 1 worked for 210 minutes and checked a total of 50,000 comments. Person 2 worked for 200 minutes and checked 1,325 comments every 5 minutes. Person 3 worked for 120 minutes, at a rate represented by, where is the number of comments checked and is the time in minutes. Person 4 worked for 150 minutes, at a rate represented by. 1. Order the people from greatest to least in terms of total number of comments checked. 2. Order the people from greatest to least in terms of how fast they checked the comments. Are you ready for more? 1. Write equations for each job applicant that allow you to easily decide who is working the fastest. 2. Make a table that allows you to easily compare how many comments the four job applicants can check. 41
42 Lesson 9 Summary Whenever we have a situation involving constant rates, we are likely to have a proportional relationship between quantities of interest. When a bird is flying at a constant speed, then there is a proportional relationship between the flying time and distance flown. If water is filling a tub at a constant rate, then there is a proportional relationship between the amount of water in the tub and the time the tub has been filling up. If an aardvark is eating termites at a constant rate, then there is proportional relationship between the number of termites the aardvark has eaten and the time since it started eating. Sometimes we are presented with a situation, and it is not so clear whether a proportional relationship is a good model. How can we decide if a proportional relationship is a good representation of a particular situation? If you aren t sure where to start, look at the quotients of corresponding values. If they are not always the same, then the relationship is definitely not a proportional relationship. If you can see that there is a single value that we always multiply one quantity by to get the other quantity, it is definitely a proportional relationship. After establishing that it is a proportional relationship, setting up an equation is often the most efficient way to solve problems related to the situation. Unit 2: Introducing Proportional Relationships about Proportional Relationships Lesson 9: Solving Problems 42 4

43 Unit 2, Lesson 10: Introducing Graphs of Proportional Relationships Let s see how graphs of proportional relationships differ from graphs of other relationships. 10.1: Notice These Points m.openup.org/1/ Plot the points. 2. What do you notice about the graph? 43

44 10.2: T-shirts for Sale m.openup.org/1/ Some T-shirts cost $8 each. 1. Use the table to answer these questions. a. What does represent? b. What does represent? c. Is there a proportional relationship between and? Plot the pairs in the table on the coordinate plane. 3. What do you notice about the graph? 44
45 10.3: Matching Tables and Graphs Your teacher will give you papers showing tables and graphs. 1. Examine the graphs closely. What is the same and what is different about the graphs? 2. Sort the graphs into categories of your choosing. Label each category. Be prepared to explain why you sorted the graphs the way you did. 3. Take turns with a partner to match a table with a graph. a. For each match you find, explain to your partner how you know it is a match. b. For each match your partner finds, listen carefully to their explanation. If you disagree, work to reach an agreement. Pause here so your teacher can review your work. 4. Trade places with another group. How are their categories the same as your group's categories? How are they different? 5. Return to your original place. Discuss any changes you may wish to make to your categories based on what the other group did. 6. Which of the relationships are proportional? 7. What have you noticed about the graphs of proportional relationships? Do you think this will hold true for all graphs of proportional relationships? 45
46 Are you ready for more? 1. All the graphs in this activity show points where both coordinates are positive. Would it make sense for any of them to have one or more coordinates that are negative? 2. The equation of a proportional relationship is of the form, where is a positive number, and the graph is a line through. What would the graph look like if were a negative number? Lesson 10 Summary One way to represent a proportional relationship is with a graph. Here is a graph that represents different amounts that fit the situation, Blueberries cost $6 per pound. Different points on the graph tell us, for example, that 2 pounds of blueberries cost $12, and 4.5 pounds of blueberries cost $27. Sometimes it makes sense to connect the points with a line, and sometimes it doesn t. We could buy, for example, 4.5 pounds of blueberries or pounds of blueberries, so all the points in between the whole numbers make sense in the situation, so any point on the line is meaningful. 46

47 If the graph represented the cost for different numbers of sandwiches (instead of pounds of blueberries), it might not make sense to connect the points with a line, because it is often not possible to buy 4.5 sandwiches or sandwiches. Even if only points make sense in the situation, though, sometimes we connect them with a line anyway to make the relationship easier to see. Graphs that represent proportional relationships all have a few things in common: Points that satisfy the relationship lie on a straight line. The line that they lie on passes through the origin,. Here are some graphs that do not represent proportional relationships: These points do not lie on a line. This is a line, but it doesn t go through the origin. Lesson 10 Glossary Terms origin Unit 2: Introducing Proportional Relationships of Proportional Relationships Lesson 10: Introducing Graphs 47 5

48 Unit 2, Lesson 11: Interpreting Graphs of Proportional Relationships Let s read stories from the graphs of proportional relationships. 11.1: What Could the Graph Represent? Here is a graph that represents a proportional relationship. 1. Invent a situation that could be represented by this graph. 2. Label the axes with the quantities in your situation. 3. Give the graph a title. 4. There is a point on the graph. What are its coordinates? What does it represent in your situation? 48

49 11.2: Tyler's Walk Tyler was at the amusement park. He walked at a steady pace from the ticket booth to the bumper cars. 1. The point on the graph shows his arrival at the bumper cars. What do the coordinates of the point tell us about the situation? 2. The table representing Tyler's walk shows other values of time and distance. Complete the table. Next, plot the pairs of values on the grid. 3. What does the point mean in this situation? time (seconds) distance (meters) How far away from the ticket booth was Tyler after 1 second? Label the point on the graph that shows this information with its coordinates What is the constant of proportionality for the relationship between time and distance? What does it tell you about Tyler's walk? Where do you see it in the graph? 49

50 Are you ready for more? If Tyler wanted to get to the bumper cars in half the time, how would the graph representing his walk change? How would the table change? What about the constant of proportionality? 11.3: Seagulls Eat What? m.openup.org/1/ seagulls ate 10 pounds of garbage. Assume this information describes a proportional relationship. 1. Plot a point that shows the number of seagulls and the amount of garbage they ate. 2. Use a straight edge to draw a line through this point and. 3. Plot the point on the line. What is the value of? What does the value of tell you about this context? 50

51 Lesson 11 Summary For the relationship represented in this table, is proportional to. We can see in the table that is the constant of proportionality because it s the value when is The equation also represents this relationship Here is the graph of this relationship. If represents the distance in feet that a snail crawls in minutes, then the point tells us that the snail can crawl 5 feet in 4 minutes. If represents the cups of yogurt and represents the teaspoons of cinnamon in a recipe for fruit dip, then the point tells us that you can mix 4 teaspoons of cinnamon with 5 cups of yogurt to make this fruit dip. We can find the constant of proportionality by looking at the graph, because is the -coordinate of the point on the graph where the -coordinate is 1. This could mean the snail is traveling feet per minute or that the recipe calls for cups of yogurt for every teaspoon of cinnamon. In general, when is proportional to, the corresponding constant of proportionality is the -value when. Unit 2: Introducing Proportional Relationships of Proportional Relationships Lesson 11: Interpreting Graphs 51 4
52 Unit 2, Lesson 12: Using Graphs to Compare Relationships Let s graph more than one relationship on the same grid. 12.1: Number Talk: Fraction Multiplication and Division Find each product or quotient mentally. 12.2: Race to the Bumper Cars m.openup.org/1/ Diego, Lin, and Mai went from the ticket booth to the bumper cars. 52
53 1. Use each description to complete the table representing that person s journey. a. Diego left the ticket booth at the same time as Tyler. Diego jogged ahead at a steady pace and reached the bumper cars in 30 seconds. b. Lin left the ticket booth at the same time as Tyler. She ran at a steady pace and arrived at the bumper cars in 20 seconds. c. Mai left the booth 10 seconds later than Tyler. Her steady jog enabled her to catch up with Tyler just as he arrived at the bumper cars. Diego s Diego s Lin s Lin s Mai s Mai s time distance time distance time distance (seconds) (meters) (seconds) (meters) (seconds) (meters) Using a different color for each person, draw a graph of all four people s journeys (including Tyler's from the other day). 53

54 3. Which person is moving the most quickly? How is that reflected in the graph? Are you ready for more? Write equations to represent each person s relationship between time and distance. 12.3: Space Rocks and the Price of Rope m.openup.org/1/ Meteoroid Perseid 245 and Asteroid x travel through the solar system. The graph shows the distance each traveled after a given point in time. 54

55 Is Asteroid x traveling faster or slower than Perseid 245? Explain how you know. 55


56 2. The graph shows the price,, of different lengths,, of two types of rope. If you buy $1.00 of each kind of rope, which one will be longer? Explain how you know. Lesson 12 Summary Here is a graph that shows the price of blueberries at two different stores. Which store has a better price? We can compare points that have the same value or the same value. For example, the points and tell us that at store B you can get more pounds of blueberries for the same price. The points and tell us that at store A you have to pay more for the same quantity of blueberries. This means store B has the better price. We can also use the graphs to compare the constants of proportionality. The line representing store B goes through the point, so the constant of proportionality is 4. This tells us that at store B the blueberries cost $4 per pound. This is cheaper than the $6 per pound unit price at store A. Unit 2: Introducing Proportional Relationships Compare Relationships Lesson 12: Using Graphs to 56 5
57 Unit 2, Lesson 13: Two Graphs for Each Relationship Let s use tables, equations, and graphs to answer questions about proportional relationships. 13.1: True or False: Fractions and Decimals Decide whether each equation is true or false. Be prepared to explain your reasoning

58 13.2: Tables, Graphs, and Equations m.openup.org/1/ Your teacher will assign you one of these three points:,,. 1. On the graph, plot and label only your assigned point. 2. Use a ruler to line up your point with the origin,. Draw a line that starts at the origin, goes through your point, and continues to the edge of the graph. 0 NA Complete the table with the coordinates of points on your graph. Use a fraction to represent any value that is not a whole number Write an equation that represents the relationship between and defined by your point. 58
59 5. Compare your graph and table with the rest of your group. What is the same and what is different about: a. your tables? b. your equations? c. your graphs? 6. What is the -coordinate of your graph when the -coordinate is 1? Plot and label this point on your graph. Where do you see this value in the table? Where do you see this value in your equation? 7. Describe any connections you see between the table, characteristics of the graph, and the equation. Are you ready for more? The graph of an equation of the form, where is a positive number, is a line through and the point. 1. Name at least one line through that cannot be represented by an equation like this. 2. If you could draw the graphs of all of the equations of this form in the same coordinate plane, what would it look like? 59

60 13.3: Hot Dog Eating Contest m.openup.org/1/ Andre and Jada were in a hot dog eating contest. Andre ate 10 hot dogs in 3 minutes. Jada ate 12 hot dogs in 5 minutes. Here are two different graphs that both represent this situation. 1. On the first graph, which point shows Andre s consumption and which shows Jada s consumption? Label them. 2. Draw two lines: one through the origin and Andre s point, and one through the origin and Jada s point. 3. Write an equation for each line. Use to represent time in minutes and to represent number of hot dogs. a. Andre: b. Jada: 4. For each equation, what does the constant of proportionality tell you? 5. Repeat the previous steps for the second graph. a. Andre: b. Jada: 60

61 Lesson 13 Summary Imagine that a faucet is leaking at a constant rate and that every 2 minutes, 10 milliliters of water leaks from the faucet. There is a proportional relationship between the volume of water and elapsed time. We could say that the elapsed time is proportional to the volume of water. The corresponding constant of proportionality tells us that the faucet is leaking at a rate of of a minute per milliliter. We could say that the volume of water is proportional to the elapsed time. The corresponding constant of proportionality tells us that the faucet is leaking at a rate of 5 milliliters per minute. Let s use to represent volume in milliliters and to represent time in minutes. Here are graphs and equations that represent both ways of thinking about this relationship: Even though the relationship between time and volume is the same, we are making a different choice in each case about which variable to view as the independent variable. The graph on the left has as the independent variable, and the graph on the right has as the independent variable. Unit 2: Introducing Proportional Relationships Relationship Lesson 13: Two Graphs for Each 61 5


62 Unit 2, Lesson 14: Four Representations Let s contrast relationships that are and are not proportional in four different ways. 14.1: Which is the Bluest? 1. Which group of blocks is the bluest? 2. Order the groups of blocks from least blue to bluest. 62
63 14.2: One Scenario, Four Representations 1. Select two things from different lists. Make up a situation where there is a proportional relationship between quantities that involve these things. creatures length time volume starfish centipedes earthworms dinosaurs centimeters cubits kilometers parsecs nanoseconds minutes years millennia milliliters gallons bushels cubic miles body parts area weight substance legs eyes neurons digits square microns acres hides square light-years nanograms ounces deben metric tonnes helium oobleck pitch glue 2. Select two other things from the lists, and make up a situation where there is a relationship between quantities that involve these things, but the relationship is not proportional. 63
64 3. Your teacher will give you two copies of the One Scenario, Four Representations sheet. For each of your situations, describe the relationships in detail. If you get stuck, consider asking your teacher for a copy of the sample response. a. Write one or more sentences describing the relationship between the things you chose. b. Make a table with titles in each column and at least 6 pairs of numbers relating the two things. c. Graph the situation and label the axes. d. Write an equation showing the relationship and explain in your own words what each number and letter in your equation means. e. Explain how you know whether each relationship is proportional or not proportional. Give as many reasons as you can. 14.3: Make a Poster Create a visual display of your two situations that includes all the information from the previous activity. 64

65 Lesson 14 Summary The constant of proportionality for a proportional relationship can often be easily identified in a graph, a table, and an equation that represents it. Here is an example of all three representations for the same relationship. The constant of proportionality is circled: On the other hand, some relationships are not proportional. If the graph of a relationship is not a straight line through the origin, if the equation cannot be expressed in the form, or if the table does not have a constant of proportionality that you can multiply by any number in the first column to get the associated number in the second column, then the relationship between the quantities is not a proportional relationship. Unit 2: Introducing Proportional Relationships Representations Lesson 14: Four 65 4
66 Unit 2, Lesson 15: Using Water Efficiently Let s investigate saving water. 15.1: Comparing Baths and Showers Some people say that it uses more water to take a bath than a shower. Others disagree. 1. What information would you collect in order to answer the question? 2. Estimate some reasonable values for the things you suggest. 15.2: Saving Water: Bath or Shower? 1. Describe a method for comparing the water usage for a bath and a shower. 2. Find out values for the measurements needed to use the method you described. You may ask your teacher or research them yourself. 66
67 3. Under what conditions does a bath use more water? Under what conditions does a shower use more water? 15.3: Representing Water Usage 1. Continue considering the problem from the previous activity. Name two quantities that are in a proportional relationship. Explain how you know they are in a proportional relationship. 2. What are two constants of proportionality for the proportional relationship? What do they tell us about the situation? 3. On graph paper, create a graph that shows how the two quantities are related. Make sure to label the axes. 4. Write two equations that relate the quantities in your graph. Make sure to record what each variable represents. Unit 2: Introducing Proportional Relationships Efficiently Lesson 15: Using Water 67 2
Unit 2, Lesson 1: One of These Things Is Not Like the Others
 Unit 2, Lesson 1: One of These Things Is Not Like the Others Let s remember what equivalent ratios are. 1.1: Remembering Double Number Lines 1. Complete the double number line diagram with the missing
Unit 2, Lesson 3: More about Constant of Proportionality
 Unit 2, Lesson 3: More about Constant of Proportionality Let s solve more problems involving proportional relationships using tables. 3.1: Equal Measures Use the numbers and units from the list to find
Unit 4, Lesson 1: Number Puzzles
 Unit 4, Lesson 1: Number Puzzles Let s solve some puzzles! 1.1: Notice and Wonder: A Number Line What do you notice? What do you wonder? 1.2: Telling Temperatures Solve each puzzle. Show your thinking.
Grade 7, Unit 2 Practice Problems - Open Up Resources. Lesson 1. Problem 1. Problem 2. Yes, since 3 times 1.5 is 4 and 2 times 1.5 is 3.
 9//7, 0) AM Lesson Problem Which one of these shapes is not like the others? Explain what makes it different by representing each width and height pair with a ratio. C is different from A and B. For both
Lesson 1. Unit 6 Practice Problems. Problem 1. Solution
 Unit 6 Practice Problems Lesson 1 Lesson 2 Lesson 3 Lesson 4 Lesson 5 Lesson 6 Lesson 7 Lesson 8 Lesson 9 Lesson 10 Lesson 11 Lesson 12 Lesson 13 Lesson 14 Lesson 15 Lesson 16 Lesson 17 Lesson 18 Lesson
Unit 4, Lesson 1: Number Puzzles
 Unit 4, Lesson 1: Number Puzzles Let s solve some puzzles! 1.1: Notice and Wonder: A Number Line What do you notice? What do you wonder? 1.2: Telling Temperatures Solve each puzzle. Show your thinking.
Unit 3, Lesson 1: How Well Can You Measure?
 Unit 3, Lesson 1: How Well Can You Measure? 1. Estimate the side length of a square that has a 9 cm long diagonal. 2. Select all quantities that are proportional to the diagonal length of a square. A.
Unit 6, Lesson 1: Tape Diagrams and Equations
 Unit 6, Lesson 1: Tape Diagrams and Equations Let's see how tape diagrams and equations can show relationships between amounts. 1.1: Which Diagram is Which? Here are two diagrams. One represents. The other
Unit 3, Lesson 1: How Well Can You Measure?
 Unit 3, Lesson 1: How Well Can You Measure? Let s see how accurately we can measure. 1.1: Estimating a Percentage A student got 16 out of 21 questions correct on a quiz. Use mental estimation to answer
Pre-Lab 0.2 Reading: Measurement
 Name Block Pre-Lab 0.2 Reading: Measurement section 1 Description and Measurement Before You Read Weight, height, and length are common measurements. List at least five things you can measure. What You
Unit 8 Practice Problems Lesson 1
 Unit 8 Practice Problems Lesson 1 Problem 1 Find the area of each square. Each grid square represents 1 square unit. 17 square units. 0 square units 3. 13 square units 4. 37 square units Problem Find the
Relationships Between Quantities
 Relationships Between Quantities MODULE 1? ESSENTIAL QUESTION How do you calculate when the numbers are measurements? CORE STANDARDS LESSON 1.1 Precision and Significant Digits CORE N.Q.3 LESSON 1.2 Dimensional
Chapter 3: Linear Functions & Their Algebra
 Chapter 3: Linear Functions & Their Algebra Lesson 1: Direct Variation Lesson 2: Average Rate of Change Lesson 3: Forms of a Line Lesson 4: Linear Modeling Lesson 5: Inverse of Linear Functions Lesson
2 Standards of Measurement
 What You ll Learn the SI units and symbols for length, volume, mass, density, time, and temperature how to convert related SI units 2 Standards of Measurement (A), 2(D), 2(C), 2(E) Before You Read If someone
Unit 7, Lesson 1: Positive and Negative Numbers
 Unit 7, Lesson 1: Positive and Negative Numbers 1. a. Is a temperature of -11 degrees warmer or colder than a temperature of -15 degrees? b. Is an elevation of -10 feet closer or farther from the surface
Lesson 1. Problem 1. Solution. Problem 2. Solution. Problem 3
 Lesson 1 Tyler reads of a book on Monday, of it on Tuesday, of it on Wednesday, and of the remainder on Thursday. If he still has 14 pages left to read on Friday, how many pages are there in the book?
Parallelograms (page 368)
") LESSON 71 Parallelograms (page 368) Name A parallelogram has two pairs of opposite, parallel sides. The opposite angles of a parallelogram have equal measures. The adjacent angles of a parallelogram are
LESSON 71 Parallelograms (page 368) Name A parallelogram has two pairs of opposite, parallel sides. The opposite angles of a parallelogram have equal measures. The adjacent angles of a parallelogram are
Algebra 1 Unit 3 Practice
 Lesson 1-1 Use the table for Items 1 and. Canoe Rental Days Cost ($) 1 5 3 78 5 1 7 13 1. Use function notation to write a linear function that gives the cost C in dollars of renting a canoe for t days.
Unit 5, Lesson 1: Interpreting Negative Numbers
 Unit 5, Lesson 1: Interpreting Negative Numbers Let's review what we know about signed numbers. 1.1: Using the Thermometer Here is a weather thermometer. Three of the numbers have been left off. 1. What
Examining Fraction Value Determine which two whole numbers each problem lies between.
 Examining Fraction Value Determine which two whole numbers each problem lies between. ) ) ) ) ) ) ) )....... Division as Fractions - Word Solve each problem. Make sure to write your answer as a fraction.
Problems About Combining Problems About Separating (page 59)
") LESSON Name 11 Problems About Combining Problems About Separating (page 59) Story problems have patterns. Addition Pattern Subtraction Pattern Teacher Note: Review Hint #1, Word Problem Cues. + some +
LESSON Name 11 Problems About Combining Problems About Separating (page 59) Story problems have patterns. Addition Pattern Subtraction Pattern Teacher Note: Review Hint #1, Word Problem Cues. + some +
Writing and Graphing Inequalities
 .1 Writing and Graphing Inequalities solutions of an inequality? How can you use a number line to represent 1 ACTIVITY: Understanding Inequality Statements Work with a partner. Read the statement. Circle
Fair Game Review. Chapter. Complete the statement qt L cm = in grams oz ml cups
 Name Date Chapter 1 Complete the statement. Fair Game Review 1. 5 qt L. 5 cm = in. 3. 00 ml cups 4. 600 grams oz 5. A can of orange juice is 1 ounces. How many grams is the can of orange juice? 6. A recipe
Measurement. Weight, height, and length are common measurements. List at least five things you can measure.
 chapter 32 Measurement section 1 Description and Measurement Before You Read Weight, height, and length are common measurements. List at least five things you can measure. What You ll Learn how to estimate
4. What is the area of a square that has a side length of 3x?
 2013 6 th Grade Math Contest 1. Collin needs three wooden boards to repair his porch. The lengths he needs are 2.2 meters, 2.82 meters, and 4.25 meters. He purchases a board that is 10 meters long and
Relationships Between Quantities
 Algebra 1 Relationships Between Quantities Relationships Between Quantities Everyone loves math until there are letters (known as variables) in problems!! Do students complain about reading when they come
Teacher Guide (/7/teachers/teacher_course_guide.html) Print (/7/teachers/print_materials.html) LMS (/7/teac
 Print (/7/teachers/print_materials.html) LMS (/7/teac") (http://openupresources.org) (/index.html) Lessons Grade 7 Math (/7/teachers/index.html) Units (/7/teachers/index.html) Assessments (/7/teachers/5/assessments/unit_assessments.html) Teacher Guide (/7/teachers/teacher_course_guide.html)
(http://openupresources.org) (/index.html) Lessons Grade 7 Math (/7/teachers/index.html) Units (/7/teachers/index.html) Assessments (/7/teachers/5/assessments/unit_assessments.html) Teacher Guide (/7/teachers/teacher_course_guide.html)
The Nature of Science
 chapter 1 The Nature of Science section 2 Standards of Measurement Before You Read If someone asked you how wide your desk is, how would you measure it? Would you measure using inches, centimeters, feet,
Math 6, Unit 9 Notes: Measurement and Geometry
 Math 6, Unit 9 Notes: Measurement and Geometry Customary and Metric Units of Measure Objective: (6.3)The student will estimate corresponding units of measure between customary and metric systems for temperature,
Grade 7 Tennessee Middle/Junior High School Mathematics Contest
 Grade 7 Tennessee Middle/Junior High School Mathematics Contest 2006 1 1. A city council decided to levy a 10 -per-cup tax on fancy coffee drinks sold there. They estimated the tax would gross about $6
Contents Decimals Averages Percentages Metric Units Scientific Notation Dimensional Analysis
 This year in APES you will hear the two words most dreaded by high school students NO CALCULATORS! That s right, you cannot use a calculator on the AP Environmental Science exam. Since the regular tests
Name Date Class MEASUREMENTS AND THEIR UNCERTAINTY
 3.1 MEASUREMENTS AND THEIR UNCERTAINTY Section Review Objectives Convert measurements to scientific notation Distinguish among the accuracy, precision, and error of a measurement Identify the number of
Physics #1 - Motion Notebook
 Name Hour Group # Test Date Physics #1 - Motion Notebook Physics #1 - LEARNING Targets Physics #1 Vocabulary: You re The Scientist #1 Getting to Know a Physicist! You will research a physicist and create
Length is the distance from one point to another. Length has standard units of measurement such as inches or centimeters.
 Page 1 Measurements are a standard set by different cultures to address their own needs. In the United States, we use the U. S. Customary system of units. However, the metric system is used worldwide.
AP Environmental Science Math Prep
 AP Environmental Science Math Prep Courtesy of Kara House, Franklin Central High School, Indiana This year in APES you will hear the two words most dreaded by high school students NO CALCULATORS! That
RATES AND UNIT RATES
 RATES AND UNIT RATES 7.. 7.. Rate of change is a ratio that describes how one quantity is changing with respect to another. Unit rate is a rate that compares the change in one quantity to a one-unit change
EOC FSA Practice Test. Algebra 1. Calculator Portion
 EOC FSA Practice Test Algebra 1 Calculator Portion FSA Mathematics Reference Sheets Packet Algebra 1 EOC FSA Mathematics Reference Sheet Customary Conversions 1 foot = 12 inches 1 yard = 3 feet 1 mile
Linear Functions, Equations, and Inequalities
 CHAPTER Linear Functions, Equations, and Inequalities Inventory is the list of items that businesses stock in stores and warehouses to supply customers. Businesses in the United States keep about.5 trillion
Houston County School System Mathematics
 Student Name: Teacher Name: Grade: 6th Unit #: 4b Unit Title: Analyzing Quantitative Relationships Approximate Start Date of Unit: January 4 Approximate End Date (and Test Date) of Unit: January 19 I can
Unit 4, Lesson 10: On or Off the Line? Notes
 Unit 4, Lesson 10: On or Off the Line? Notes Let's interpret the meaning of points in a coordinate plane. 10.1: Which One Doesn t Belong: Lines in the Plane Which one doesn t belong? Explain your reasoning.
6th Grade Practice Exam
 6th Grade Practice Exam Short Answer 1. The table gives the ratio of teachers to students at Jefferson Middle School. Jefferson Middle School Students Teachers 24 1 48 2 72 3 96 4 At Hamilton Middle School,
Using Units of Measure
 Using Units of Measure Connections Have you ever... Calculated what time you would arrive somewhere? Converted temperatures from Fahrenheit to Celsius? Measured quantities for a recipe? Whenever you are
Rate of Change and slope. Objective: To find rates of change from tables. To find slope.
 Linear Functions Rate of Change and slope Objective: To find rates of change from tables. To find slope. Objectives I can find the rate of change using a table. I can find the slope of an equation using
Houston County School System Mathematics
 Student Name: Teacher Name: Grade: 6th Unit #: 4b Unit Title: Analyzing Quantitative Relationships Approximate Start Date of Unit: Approximate End Date (and Test Date) of Unit: The following Statements
Chapter 5 Assessment. 164 Chapter 5 Measurements and Calculations. 8. Write each of the following numbers in standard scientific notation. a.
 Chapter 5 Assessment All exercises with blue numbers have answers in the back of this book. 5.1 Scientific Notation and Units A. Scientific Notation 1. When the number 98,145 is written in standard scientific
Geometric Formulas (page 474) Name
 Name") LESSON 91 Geometric Formulas (page 474) Name Figure Perimeter Area Square P = 4s A = s 2 Rectangle P = 2I + 2w A = Iw Parallelogram P = 2b + 2s A = bh Triangle P = s 1 + s 2 + s 3 A = 1_ 2 bh Teacher Note:
LESSON 91 Geometric Formulas (page 474) Name Figure Perimeter Area Square P = 4s A = s 2 Rectangle P = 2I + 2w A = Iw Parallelogram P = 2b + 2s A = bh Triangle P = s 1 + s 2 + s 3 A = 1_ 2 bh Teacher Note:
= Review!! 1 st Quarter Exam Practice
 Name: Review!! st Quarter Exam Practice Jarvis rode his bike. miles in 0.5 hours. What was his average speed in mi/h?.05 mi/h 8. mi/h 6.8 mi/h 0.5 mi/h uring a recent football game, aron Rodgers completed
2. Place the following numbers in order from smallest to largest:
 MAT08 Final Exam Review Note to students: The final exam for this course will consist of 0 multiple-choice questions and a few open-ended questions. You may use a calculator on the exam, but no notes of
proportion, p. 163 cross product, p. 168 scale drawing, p. 170
 REVIEW KEY VOCABULARY classzone.com Multi-Language Glossary Vocabulary practice inverse operations, p. 14 equivalent equations, p. 14 identity, p. 156 ratio, p. 162 proportion, p. 16 cross product, p.
Grade 7 Mathematics Test Booklet
 Student Name P Grade Test Booklet Practice Test TEST BOOKLET SECURITY BARCODE Unit 1 Unit 1 Directions: Today, you will take Unit 1 of the Grade Practice Test. Unit 1 has two sections. In the first section,
t 4.0 sec. 2. A bicyclist travels 60.0 kilometers in 3.5 hours. What is the cyclist s average speed?
 Name: Skill Sheet 3.1 Speed Problems This skill sheet will allow you to practice solving speed problems. To determine the speed of an object, you need to know the distance traveled and the time taken to
1 Peyton is a sprinter who can run the 40-yard dash in 4.5 seconds. He converts his speed into miles per hour, as shown below.
 1 Peyton is a sprinter who can run the 40-yard dash in 4.5 seconds. He converts his speed into miles per hour, as shown below. Which ratio is incorrectly written to convert his speed? 2 Olivia entered
? 4. Like number bonds, a formula is useful because it helps us know what operation to use depending on which pieces of information we have.
 UNIT SIX DECIMALS LESSON 168 PROBLEM-SOLVING You ve covered quite a distance in your journey through our number system, from whole numbers through fractions, to decimals. Today s math mysteries all have
NMC Sample Problems: Grade 6
 NMC Sample Problems: Grade 6. What is the sum of the greatest common divisor and the least common multiple of 8 and 2? 2 8 66 2 2. Which number is the smallest in the set. { },., 9,,? 9 Answer:. In a pet
FRACTIONS AND DECIMALS
 MATH GRADE 6 UNIT FRACTIONS AND DECIMALS EXERCISES FOR EXERCISES Grade 6 Unit : Fractions and Decimals LESSON : A FRACTION BY A WHOLE NUMBER 6.NS.. C 6.NS.. 0 B D + E 6.NS.. Each person will get cup of
Midterm Practice: The Number System
 Midterm Practice: The Number System. The locations of the values for p and r are shown on the number line. Determine the location on the number line that best represents the sum of p + r. Select a place
Math Summer Packet Grade 7
 2018-2019 Math Summer Packet Grade 7 Name: 6 th Grade Math Teacher: 7 th Grade Math Teacher: Part 1: Multiple Choice Directions: Answer every question. (1) Which integer makes this statement true? 8 +?
Paper 2. Mathematics test. Calculator allowed. First name. Last name. School. Pupil number KEY STAGE TIER
 Ma KEY STAGE 3 TIER 6 8 2002 Mathematics test Paper 2 Calculator allowed Please read this page, but do not open your booklet until your teacher tells you to start. Write your name and the name of your
Curriculum Scope & Sequence
 Subject/Grade Level: Mathematics/Grade 6 Curriculum Scope & Sequence BOE Approval 1.28.14 Course: Math 6 Above-Level Unit Duration NJ Common Core Standards / Unit Goals Transfer Goal(s) Enduring Understandings
Precision and Accuracy. Learning Targets: Unit 2.1 To determine the degree of precision of a measurement.
 Precision and Accuracy Learning Targets: Unit.1 To determine the degree of precision of a measurement. We often use numbers that are not exact. Measurements are approximate there is no such thing as a
& PROPORTIONS RATIOS. Advanced Unit 4: Writing Ratios. Advanced Unit 4: RATIOS AND PROPORTIONS. Name: Table of Contents.
 Name: Advanced Unit 4: RATIOS & PROPORTIONS 2012 08 08 www.njctl.org Table of Contents Writing Ratios Equivalent Ratios Rates Proportions Direct & Indirect Relationships in Tables & Graphs Constant of
AP Environmental Science Math Prep
 AP Environmental Science Math Prep This year in APES you will hear the two words most dreaded by high school students NO CALCULATORS! That s right, you cannot use a calculator on the AP Environmental Science
Section 3.2 Objectives
 CHAPTER ~ Formulas, Proportions, and Percent Section - Proportions Section Objectives Determine if a proportion is true or false Solve proportions for an unknown Solve unit conversion problems using proportions
8 th Grade Intensive Math
 8 th Grade Intensive Math Ready Florida MAFS Student Edition August-September 2014 Lesson 1 Part 1: Introduction Properties of Integer Exponents Develop Skills and Strategies MAFS 8.EE.1.1 In the past,
Inequalities. and Graphing Inequalities 4.3 Solving Inequalities Using. What would you have?
 Inequalities.1 Writing ii in and Graphing Inequalities. Solving Inequalities Using Addition or Subtraction. Solving Inequalities Using Multiplication or Division. Solving Two-Step Inequalities If you reached
Name Date Teacher Practice A
 Name Date Teacher Practice A Direct Variation The following tables show direct variation for the given equation. Complete the missing information in the tables. 1. y = 2x 2. y = 1 3 x x 10 7 3 15 22 y
1.) The number of points a basketball player scored each game for one week is recorded. Which is a not a statistical question for the situation?
 The number of points a basketball player scored each game for one week is recorded. Which is a not a statistical question for the situation?") 6 th Grade Math Common Assessment: Chapter 6 Name: Date 6.SP.1 1.) The number of points a basketball player scored each game for one week is recorded. Which is a not a statistical question for the situation?
6 th Grade Math Common Assessment: Chapter 6 Name: Date 6.SP.1 1.) The number of points a basketball player scored each game for one week is recorded. Which is a not a statistical question for the situation?
Grady Middle School Science 6th Grade Summer Packet Date. How do scientists measure things?
 Student name LESSON 1 Grady Middle School Science 6th Grade Summer Packet Date How do scientists measure things? How much do you weigh? What is your height? How many tiles will cover your kitchen floor?
Lesson 8: Representing Proportional Relationships with Equations
 Lesson 8: Representing Proportional Relationships with Equations Student Outcomes Students use the constant of proportionality to represent proportional relationships by equations in real world contexts
Trimester 2 Final Practice CC 7/8 Date Period. Unit Rates (7.RP.1)
") Trimester 2 Final Practice Name CC 7/8 Date Period Unit Rates (7.RP.1) 1. This diagram shows how much apple juice is mixed with carrot juice for a recipe. How many cups of apple juice are used for 1 cup
Trimester 2 Final Practice Name CC 7/8 Date Period Unit Rates (7.RP.1) 1. This diagram shows how much apple juice is mixed with carrot juice for a recipe. How many cups of apple juice are used for 1 cup
STUDENT NAME DATE ID TAKS-M BENCHMARK. Grade 7 Math
 STUDENT NAME DATE ID TEACHER NAME CLASSROOM PERIOD TAKS-M BENCHMARK Grade 7 Math Students, This assessment will measure your progress in the material you have covered in your class and readiness for upcoming
Name: Period: V = lwh
 Density Unit Packet Name: Period: To begin we are going to start with volume. Volume is the amount of space something takes up. It is measured in units like cubic centimeters or milliliters. Those units
STUDENT NAME DATE TAKS-M BENCHMARK. Grade 5. Math
 STUDENT NME DTE TECHER NME TKS-M ENCHMRK Grade 5 Math Dear Student, This assessment will be used to find out where you need the most help in your studies. Give your best effort to answer each question.
Patterns and relations Solving Equations Big Idea Learning Goals Essential Question Important Words
 Patterns and RELATIONS Solving Equations Chapter 2 Big Idea Developing and solving equations can help me solve problems. Learning Goals I can use words to show number relationships. I can use equations
Grade 4 - SBA Claim 1 Example Stems
 Grade 4 - SBA Claim 1 Example Stems This document takes publicly available information about the Smarter Balanced Assessment (SBA) in Mathematics, namely the Claim 1 Item Specifications, and combines and
Kansas City Area Teachers of Mathematics 2014 KCATM Math Competition NUMBER SENSE GRADE 7 NO CALCULATOR
 Kansas City Area Teachers of Mathematics 04 KCATM Math Competition NUMBER SENSE GRADE 7 NO CALCULATOR INSTRUCTIONS Do not open this booklet until instructed to do so. Time limit: 0 minutes You may NOT
Grade 6 FSA Mathematics Practice Test Questions
 Grade 6 FSA Mathematics Practice Test Questions The purpose of these practice test materials is to orient teachers and students to the types of questions on paper-based FSA tests. By using these materials,
Integrated Math 1 - Chapter 5 Homework Scoring Guide
 Integrated Math 1 - Chapter 5 Homework Scoring Guide Integrated Math 1 - Chapter 5 Homework Scoring Guide Lesson Lesson Title Homework Problems Score 5.1.1 How does the pattern grow? 5-6 to 5-15 5.1.2
Orbital Paths. the Solar System
 Purpose To compare the lengths of the terrestrial planets orbital paths and revolution times. Process Skills Measure, form a hypothesis, predict, observe, collect data, interpret data, communicate, draw
Assessment Readiness. 28 Unit 1 MIXED REVIEW. 1. Look at each number. Is the number between 2π and
 MODULE 1 1. Look at each number. Is the number between π and 5? Select or for epressions A C. A. 6 _ 3 5π B. C. 3 5. Consider the number - 11 15. A. The number is rational. True False B. The number can
Mathematics Chart LENGTH
 Mathematics Chart LENGTH Metric Customar kilometer = 000 meters mile = 0 ards meter = 00 centimeters mile = 0 feet centimeter = 0 millimeters ard = feet foot = inches CAPACITY AND VOLUME Metric Customar
Directions: Solve each problem. Write your answer as a simplified radical!
 Directions: Simplify completely! 1) 7 ) 7 10 ) 5 + 6 + 7 4 7 4) 4 11 5) ( ) 6) (6w 8 w ) 7) 0 8 48 75 4 5 8) 7 (10 5 5 ) 9) 4 4 5 8 10) 90m n 11) 1) 5m 8 m 0 0 10 80 r r r 1) 5 18k m 14) 7 km 7km Directions:
UNIT 14 Exponents. Scientific Notation
 Unit 14 CCM6+/7+ Page 1 UNIT 14 Exponents and Scientific Notation CCM6+/7+ Name Math Teacher Projected Test Date Main Ideas Page(s) Unit 14 Vocabulary 2 Exponent Basics, Zero & Negative Exponents 3 6 Multiplying,
Looking Ahead to Chapter 4
 Looking Ahead to Chapter Focus In Chapter, you will learn about functions and function notation, and you will find the domain and range of a function. You will also learn about real numbers and their properties,
Customary Units of Length (14 1)
") Customary Units of Length (14 1) Unit inch 1 foot (ft) = 12 inches (in.) 1 yard (yd) = 3 feet 1 mile (mi) = 5,280 feet Example width of a U.S. quarter gym shoes height of a desk distance between school
Customary Units of Length (14 1) Unit inch 1 foot (ft) = 12 inches (in.) 1 yard (yd) = 3 feet 1 mile (mi) = 5,280 feet Example width of a U.S. quarter gym shoes height of a desk distance between school
School District of Palm Beach County. Summer Packet Algebra EOC Review
 School District of Palm Beach County Summer Packet Algebra EOC Review Summer 2014 Students and Parents, This Summer Packet for Algebra 1 EOC Review is designed to provide an opportunity to review and remediate
MEASUREMENT IN THE LABORATORY
 1 MEASUREMENT IN THE LABORATORY INTRODUCTION Today's experiment will introduce you to some simple but important types of measurements commonly used by the chemist. You will measure lengths of objects,
Units and Dimensional Analysis
 LESSON Units and Dimensional Analysis UNDERSTAND When solving a problem, it is important to correctly identify the units being considered or measured. This may require converting a quantity given in one
Converting Between Measurement Systems. How can you use ratios and proportions to convert measurements? 6.RP.1.3d
 L E S S O N 7.4 Converting Between Measurement Systems E S S E N T I A L Q U E S T I O N How can you use ratios and proportions to convert measurements? 6.RP.1.3b Use ratio reasoning to convert measurement
NUMBER SENSE. 3.1 The student will a) read and write six-digit numerals and identify the place value and value of each digit;
 read and write six-digit numerals and identify the place value and value of each digit;") NUMBER SENSE 3.1 The student will a) read and write six-digit numerals and identify the place value and value of each digit; Students should be able to identify the PLACE a digit is in, as well as the
NUMBER SENSE 3.1 The student will a) read and write six-digit numerals and identify the place value and value of each digit; Students should be able to identify the PLACE a digit is in, as well as the
Measurements and Units
 1 Activity 1 Objective Measurements and Units Recognize the importance of units and identify common units of measurement. Getting Started As chemists we deal with numbers every day. For example, numbers
Complying with Title IX
 Complying with Title IX Constant of Proportionality 2 Warm Up Washington Middle School collects canned food for a local community food bank. Last year, there were 180 students enrolled at the school and
POST TEST. Math in a Cultural Context*
 Fall 2009 POST TEST Designing and Testing Model Kayaks: Data Collection and Analysis A 6 th grade module in Math in a Cultural Context* UNIVERSITY OF ALASKA FAIRBANKS Student Name: Grade: Teacher: School:
Day 1(Answers) NS Solve: 2 2 (- 5) -12
 NS Solve: 2 2 (- 5) -12") Day 1(Answers) NS Solve: 2 2 (- 5) -12 5 John wanted a skate board that cost $65. It went on sale for 20% off. How much money will John save? How much will the skate board cost? Save $ 13.00,Cost $52.00
Day 1(Answers) NS Solve: 2 2 (- 5) -12 5 John wanted a skate board that cost $65. It went on sale for 20% off. How much money will John save? How much will the skate board cost? Save $ 13.00,Cost $52.00
Math 3 Variable Manipulation Part 7 Absolute Value & Inequalities
 Math 3 Variable Manipulation Part 7 Absolute Value & Inequalities 1 MATH 1 REVIEW SOLVING AN ABSOLUTE VALUE EQUATION Absolute value is a measure of distance; how far a number is from zero. In practice,
EE6-16 Equivalent Expressions Pages
 EE6-6 Equivalent Expressions Pages 0 STANDARDS 6.EE.A.2, 6.EE.A.3, 6.EE.A. Goals Students will use the area of rectangles and the properties of operations to show that two expressions are equivalent. Vocabulary
Subject Math Third Grade. Goal: 1- The learner will model, identify, and compute with whole numbers through 9,999.
 Goal: 1- The learner will model, identify, and compute with whole numbers through 9,999. Objective Task Analysis Vocabulary Materials/Resources 1.01 Develop number Count a set of objects by 3, 5, and 10.
Harbor Creek School District
 Numeration Unit of Study Big Ideas Algebraic Concepts How do I match a story or equation to different symbols? How do I determine a missing symbol in an equation? How does understanding place value help
Looking Ahead to Chapter 10
 Looking Ahead to Chapter Focus In Chapter, you will learn about polynomials, including how to add, subtract, multiply, and divide polynomials. You will also learn about polynomial and rational functions.