LINEAR REGRESSION. Copyright 2013, SAS Institute Inc. All rights reserved.
|
|
|
- Audrey Marybeth Barrett
- 5 years ago
- Views:
Transcription


1 LINEAR REGRESSION
2 LINEAR REGRESSION REGRESSION AND OTHER MODELS Type of Response Type of Predictors Categorical Continuous Continuous and Categorical Continuous Analysis of Variance (ANOVA) Ordinary Least Squares (OLS) Regression Analysis of Covariance (ANCOVA) Categorical Contingency Table Analysis or Logistic Regression Logistic Regression Logistic Regression
3 LINEAR REGRESSION REGRESSIONS linear / non linear logistic OLS PLS LAR RIDGE LASSO LOESS ROBUST QUANTILE...


4 4 RELATIONSHIP HEIGHT-WEIGHT CORRELATION???

5 MULTIPLE LINEAR REGRESSION


6 MULTIPLE LINEAR REGRESSION MODEL In general, you model the dependent variable, Y, as a linear function of k independent variables, X 1 through X k : Y= X k X k + Y= X X 2 + Y= X X X X 22 + Linear? Nonlinear?
7 MULTIPLE LINEAR REGRESSION SAS/STAT SYNTAX & EXAMPLE DATA proc reg data=sasuser.fitness; MODEL Oxygen_Consumption = RunTime Age Weight Run_Pulse Rest_Pulse Maximum_Pulse Performance; run; quit;
8 MULTIPLE LINEAR REGRESSION APPLICATIONS: PREDICTION VS. EXPLANATORY ANALYSIS The terms in the model, the values of their coefficients, and their statistical significance are of secondary importance. The focus is on producing a model that is the best at predicting future values of Y as a function of the Xs. The predicted value of Y is given by this formula: The focus is on understanding the relationship between the dependent variable and the independent variables. Consequently, the statistical significance of the coefficients is important as well as the magnitudes and signs of the coefficients. Yˆ ˆ ˆ X ˆ Y ˆ ˆ ˆ X ˆ X k k k X k
9 SIMPLE LINEAR REGRESSION MODEL ^ Y Y Residual Unknown Relationship Y= X ^ ^ ^ Y= X Regression Best Fit Line
10 SIMPLE LINEAR REGRESSION THE BASELINE MODEL Ȳ
11 SIMPLE LINEAR REGRESSION VARIABILITY Unexplained Total Ȳ * Explained ^ ^ ^ Y= X
12 MULTIPLE LINEAR REGRESSION HYPOTHESES Null Hypothesis: The regression model does not fit the data better than the baseline model. 1 = 2 = = k =0 F statistic Also i =0 for each predictor t statistic Alternative Hypothesis: The regression model does fit the data better than the baseline model. Not all i s equal zero.
 Exploratory Data")
 Model Revision")
")
13 MULTIPLE LINEAR REGRESSION MODEL DEVELOPMENT PROCESS (1) Exploratory Data Analysis (4) Collinearity and Influential Observation Detection (5) Model Revision (2) Candidate Model Selection Yes No (3) Model Assumption Validation (6) Prediction Testing
14 (2) CANDIDATE MODEL SELECTION MULTIPLE LINEAR REGRESSION
15 CANDIDATE MODEL SELECTION MODEL SELECTION MODEL SELECTION OPTIONS The SELECTION= option in the MODEL statement of PROC REG supports these model selection techniques: Stepwise selection methods STEPWISE, FORWARD, or BACKWARD All possible regressions ranked using RSQUARE, ADJRSQ, or CP MINR, MAXR [home work] SELECTION=NONE is the default.
16 CANDIDATE MODEL SELECTION ALL POSSIBLE REGRESSIONS Variables in Full Model (k) Total Number of Subset Models (2 k )
17 CANDIDATE MODEL SELECTION ALL POSSIBLE REGRESSIONS ods graphics / imagemap=on; proc reg data=sasuser.fitness plots(only)=(rsquare adjrsq cp); ALL_REG: model oxygen_consumption = Performance RunTime Age Weight Run_Pulse Rest_Pulse Maximum_Pulse / selection=rsquare adjrsq cp best=10; title 'Best Models Using All-Regression Option'; run; quit;
18 CANDIDATE MODEL SELECTION ALL-POSSIBLE REGRESSIONS: RANK R 2 2 ( n i)(1 R ) ADJ 1 n p
19 MODEL SELECTION MALLOWS C P Look for models with max p : C p p, p = number of parameters + intercept. HOCKING'S CRITERION VERSUS MALLOWS C P Hocking (1976) suggests selecting a model based on the following: C p p for prediction C p 2p p full + 1 for parameter estimation
20 MODEL SELECTION MALLOWS C P
21 MODEL SELECTION ALL POSSIBLE REGRESSIONS RANKED USING Model Number in Adjusted C(p) R Square Index Model R Square Variables in Model RunTime Age Run_Pulse Maximum_Pulse RunTime Age Weight Run_Pulse Maximum_Pulse Performance RunTime Weight Run_Pulse Maximum_Pulse Performance RunTime Age Run_Pulse Maximum_Pulse Performance RunTime Run_Pulse Maximum_Pulse RunTime Run_Pulse Maximum_Pulse RunTime Age Run_Pulse RunTime Age Run_Pulse Rest_Pulse Maximum_Pulse Performance Age Weight Run_Pulse Maximum_Pulse Performance RunTime Age Weight Run_Pulse Maximum_Pulse RunTime Age Weight Run_Pulse Rest_Pulse Maximum_Pulse Performance RunTime Weight Run_Pulse Rest_Pulse Maximum_Pulse Performance RunTime Age Run_Pulse Rest_Pulse Maximum_Pulse
22 MODEL SELECTION STEPWISE SELECTION METHODS FORWARD SELECTION BACKWARD ELIMINATION STEPWISE SELECTION Stop SLENTRY=value SLE=value FORWARD SELECTION SLSTAY=value SLS=value
23 MODEL SELECTION STEPWISE SELECTION METHODS proc reg data=sasuser.fitness plots(only)=adjrsq; FORWARD: model oxygen_consumption = Performance RunTime Age Weight Run_Pulse Rest_Pulse Maximum_Pulse / selection=forward; BACKWARD: model oxygen_consumption = Performance RunTime Age Weight Run_Pulse Rest_Pulse Maximum_Pulse / selection=backward; STEPWISE: model oxygen_consumption = Performance RunTime Age Weight Run_Pulse Rest_Pulse Maximum_Pulse / selection=stepwise; title 'Best Models Using Stepwise Selection'; run; quit;
24 (3) MODEL ASSUMPTION VALIDATION MULTIPLE LINEAR REGRESSION
25 MULTIPLE LINEAR REGRESSION ASSUMPTIONS The mean of the Ys is accurately modeled by a linear function of the Xs. The assumptions for linear regression are that the error terms are independent and normally distributed with equal variance. ε ~ iid N(0,σ 2 ) Therefore, evaluating model assumptions for linear regression includes checking for Independent observations Normally distributed error terms Constant variance
26 ASSUMPTIONS INDEPENDENCE Know the source of your data: correlated errors can arise from data gathered over time, repeated measures, clustered data, or data from complex survey designs. For time series data, check that the errors are independent by examining plots of residuals versus time or other ordering component Durbin Watson statistic or the firstorder autocorrelation statistic for time series data WHEN THE INDEPENDENCE ASSUMPTION IS VIOLATED Use the appropriate modeling tools to account for correlated observations: PROC MIXED, PROC GENMOD, or PROC GLIMMIX for repeated measures data PROC AUTOREG or PROC ARIMA in SAS/ETS for time series data [NEXT SAS COURSE] PROC SURVEYREG for survey data

27 ASSUMPTIONS NORMALITY Check that the error terms are normally distributed by examining: a histogram of the residuals a normal probability plot of the residuals tests for normality WHEN THE NORMALITY ASSUMPTION IS VIOLATED Transform the dependent variable Fit a generalized linear model using PROC GENMOD or PROC GLIMMIX with the appropriate DIST= and LINK= option.

28 ASSUMPTIONS NORMALITY proc reg data=sasuser.cars2 plots=all; model price = hwympg hwympg2 horsepower; run; Also, formal test for normality in proc univariate
29 ASSUMPTIONS CONSTANT VARIANCE Check for constant variance of the error terms by examining: plot of residuals versus predicted values plots of residuals versus the independent variables test for heteroscedasticity Spearman rank correlation coefficient between absolute values of the residuals and predicted values. WHEN THE CONSTANT VARIANCE ASSUMPTION IS VIOLATED Request tests using the heteroscedasticityconsistent variance estimates. Transform the dependent variable. Model the nonconstant variance by using: PROC GENMOD or PROC GLIMMIX with the appropriate DIST= option PROC MIXED with the GROUP= option and TYPE =option SAS SURVEY procedures for survey data SAS/ETS procedures for time series data Weighted least squares regression model
30 ASSUMPTIONS CONSTANT VARIANCE: PLOTS
31 ASSUMPTIONS CONSTANT VARIANCE: TESTS model Y = X1 X2 X3 / white hcc hccmethod=0; Parameter Estimates Parameter Standard Variable DF t Value Pr > t Estimate Error Heteroscedasticity Consistent Standard Error t Value Pr > t Intercept 1,00 4,04 2,17 1,86 0,07 2,68 1,51 0,14 Hwympg 1,00-0,80 0,21-3,76 0,00 0,19-4,16 <.0001 Hwympg2 1,00 0,04 0,01 3,04 0,00 0,01 4,21 <.0001 Horsepower 1,00 0,10 0,02 6,03 < ,02 4,72 <.0001 Test of First and Second Moment Specification model Y = X1 X2 X3 / spec ; DF Chi-Square Pr > ChiSq proc corr [next slide ] WARNING: The average covariance matrix for the SPEC test has been deemed singular which violates an assumption of the test. Use caution when interpreting the results of the test.

32 ASSUMPTIONS CONSTANT VARIANCE SPEARMAN RANK CORRELATION COEFFICIENT The Spearman rank correlation coefficient is available as an option in PROC CORR If the Spearman rank correlation coefficient between the absolute value of the residuals and the predicted values is close to zero, then the variances are approximately equal positive, then the variance increases as the mean increases negative, then the variance decreases as the mean increases. proc reg data=sasuser.cars2 plots (label)= all; model price = hwympg hwympg2 horsepower / spec ; output out=check r=residual p=pred; run; data check; set check; abserror=abs(residual); run; proc corr data=check spearman nosimple; var abserror pred; title 'Spearman corr.'; run;
![ASSUMPTIONS LINEAR RELATION BETWEEN E[Y] AND X Use the diagnostic plots available via the ODS Graphics output of PROC REG to evaluate the model fit: Plots of residuals and studentized residuals](/docs-images/94/121286488/images/33-0.jpg "versus predicted values Residual Fit Spread (or R F) plot Plots of the observed values versus the predicted values Partial regression leverage plots and WHEN A STRAIGHT LINE IS INAPPROPRIATE Fit a")
33 ASSUMPTIONS LINEAR RELATION BETWEEN E[Y] AND X Use the diagnostic plots available via the ODS Graphics output of PROC REG to evaluate the model fit: Plots of residuals and studentized residuals versus predicted values Residual Fit Spread (or R F) plot Plots of the observed values versus the predicted values Partial regression leverage plots and WHEN A STRAIGHT LINE IS INAPPROPRIATE Fit a polynomial regression model. Transform the independent variables to obtain linearity. Fit a nonlinear regression model using PROC NLIN if appropriate. Fit a nonparametric regression model using PROC LOESS. Examine model fitting statistics such as R2, adjusted R2, AIC, SBC, and Mallows Cp. Use the LACKFIT option in the MODEL statement in PROC REG to test for lack of fit for models that have replicates for each value of the combination of the independent variables.
34 ASSUMPTIONS LINEAR RELATION BETWEEN E[Y] AND X: PLOTS Plots of residuals and studentized residuals versus predicted values
35 ASSUMPTIONS LINEAR RELATION BETWEEN E[Y] AND X: PLOTS Residual Fit Spread (or R F) plot
36 ASSUMPTIONS LINEAR RELATION BETWEEN E[Y] AND X: PLOTS Plots of the observed values versus the predicted values
37 ASSUMPTIONS LINEAR RELATION BETWEEN E[Y] AND X Partial regression leverage plots model / partial residuals for the dependent variable are calculated with the selected regressor omitted residuals for the selected regressor are calculated from a model where the selected regressor is regressed on the remaining regressors
38 (4) COLLINEARITY AND INFLUENTIAL OBSERVATION DETECTION MULTIPLE LINEAR REGRESSION
39 WHAT ELSE CAN HAPPEN MULTICOLLINEARITY Correlation statistics (PROC CORR) Variance inflation factors (VIF option in the MODEL statement in PROC REG) Condition index values (COLLIN and COLLINOINT options in the MODEL statement in PROC REG) WHEN THERE IS MULTICOLLINEARITY Exclude redundant independent variables. Redefine independent variables. Use biased regression techniques such as ridge regression or principal component regression. Center the independent variables in polynomial regression models. PROC VARCLASS to select vars [next time]
40 WHAT ELSE CAN HAPPEN MULTICOLLINEARITY Parameter Estimates proc reg data=sasuser.cars2 plots (label)=all; model price = hwympg hwympg2 horsepower / vif collin collinoint; run; Variable DF Parameter Standard t Value Pr > t Variance Estimate Error Inflation Intercept 1,00 4,04 2,17 1,86 0,07 0,00 Hwympg 1,00-0,80 0,21-3,76 0,00 4,07 Hwympg2 1,00 0,04 0,01 3,04 0,00 2,27 Horsepower 1,00 0,10 0,02 6,03 < ,37 Collinearity Diagnostics Number Eigenvalue Condition Proportion of Variation Index Intercept Hwympg Hwympg2 Horsepower 1,00 2,18 1,00 0,01 0,00 0,03 0,01 2,00 1,53 1,19 0,00 0,09 0,07 0,00 3,00 0,27 2,85 0,03 0,32 0,69 0,00 4,00 0,03 9,25 0,96 0,58 0,21 0,99 Number Collinearity Diagnostics (intercept adjusted) Condition Proportion of Variation Eigenvalue Index Hwympg Hwympg2 Horsepower 1,00 2,06 1,00 0,05 0,06 0,06 2,00 0,80 1,61 0,00 0,28 0,26 3,00 0,14 3,79 0,95 0,66 0,68
41 WHAT ELSE CAN HAPPEN MULTICOLLINEARITY: RIDGE REG proc reg data=acetyl outvif outest=b ridge=0 to 0.02 by.002; model x4=x1 x2 x3 x1x2 x1x1; run;

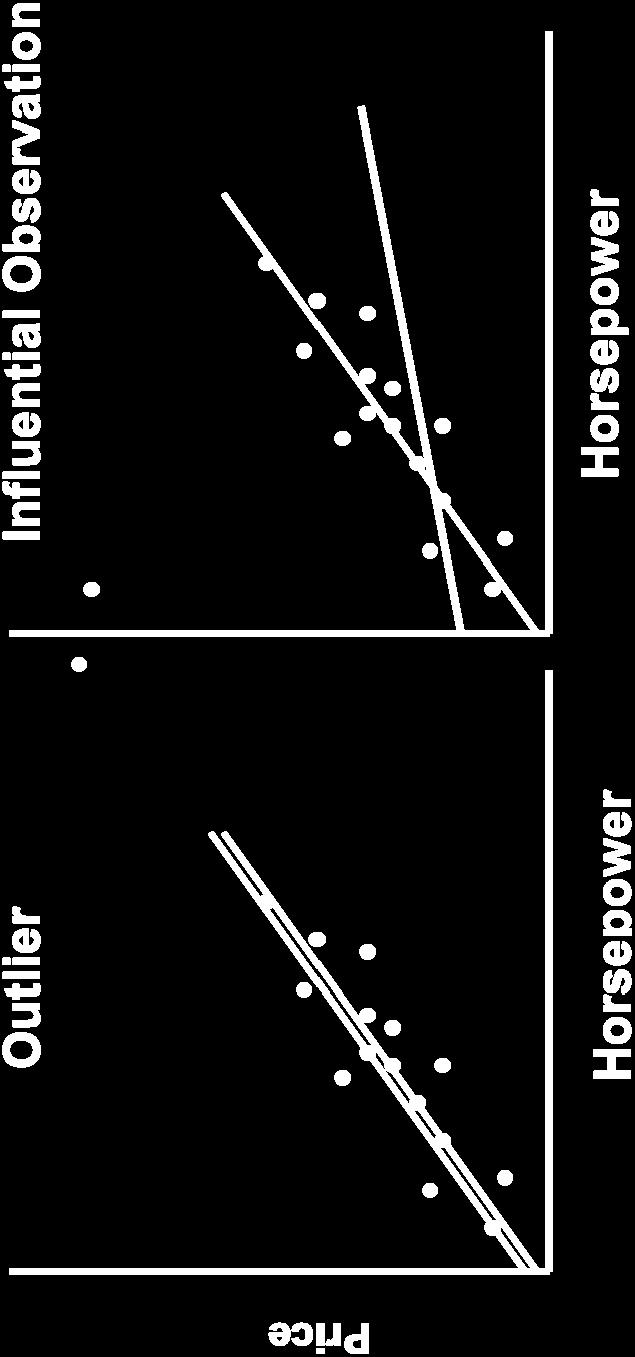
42 WHAT ELSE CAN HAPPEN INFLUENTIAL OBSERVATIONS
43 WHAT ELSE CAN HAPPEN INFLUENTIAL OBSERVATIONS RSTUDENT residual measures the change in the residuals when an observation is deleted from the model. Leverage measures how far an observation is from the cloud of observed data points Cook s D measures the simultaneous change in the parameter estimates when an observation is deleted. DFFITS measures the change in predicted values when an observation is deleted from the model. ( continued ) 1 h i =( ) ii
44 WHAT ELSE CAN HAPPEN INFLUENTIAL OBSERVATIONS DFBETAs measures the change in each parameter estimate when an observation is deleted from the model. COVRATIO DFBETA COVRATIO j( i) ˆ( b j( i) measures the change in the precision of the parameter estimates when an observation is deleted from the model i s 2 ( i) s b j X ( i) b X X X j ) ( i) WHEN THERE ARE INFLUENTIAL OBSERVATIONS Make sure that there are no data errors. Perform a sensitivity analysis and report results from different scenarios. Investigate the cause of the influential observations and redefine the model if appropriate. Delete the influential observations if appropriate and document the situation. Limit the influence of outliers by performing robust regression analysis using PROC ROBUSTREG.
45 WHAT ELSE CAN HAPPEN INFLUENTIAL OBSERVATIONS IDENTIFYING INFLUENTIAL OBSERVATIONS SUMMARY OF SUGGESTED CUTOFFS support.sas.com on proc reg
46 INFLUENTIAL OBSERVATIONS CODE proc reg data=sasuser.cars2 plots (label)=all; model price = hwympg hwympg2 horsepower / influence; id model; output out=check r=residual p=pred h=leverage rstudent=rstudent covratio=cvr; plot COVRATIO.* (hwympg hwympg2 horsepower) / vref=( ) ; run; %let numparms = 4; %let numobs = 81; data influence; set check; absrstud=abs(rstudent); if absrstud ge 2 then output; else if leverage ge (2*&numparms /&numobs) then output; run; proc print data=influence; var manufacturer model price hwympg horsepower; run;
47 INFLUENTIAL OBSERVATIONS PLOTS: RSTUDENT & LEVERAGE
48 INFLUENTIAL OBSERVATIONS PLOTS: COOK S D & DFFITS
49 INFLUENTIAL OBSERVATIONS PLOTS: DFBETAS & COVRATIO
50 INFLUENTIAL OBSERVATIONS CODE proc reg data=sasuser.cars2 plots (label)=all; model price = hwympg hwympg2 horsepower / influence; id model; output out=check r=residual p=pred h=leverage rstudent=rstudent covratio=cvr; plot COVRATIO.* (hwympg hwympg2 horsepower) / vref=( ) ; run; %let numparms = 4; %let numobs = 81; data influence; set check; absrstud=abs(rstudent); if absrstud ge 2 then output; else if leverage ge (2*&numparms /&numobs) then output; run; proc print data=influence; var manufacturer model price hwympg horsepower; run;
51 HOME WORK Same as at lecture POLYNOMIAL REGRESSION PROC GLMSELECT BOX COX ETC. TRANSFORMATION
The Steps to Follow in a Multiple Regression Analysis
 ABSTRACT The Steps to Follow in a Multiple Regression Analysis Theresa Hoang Diem Ngo, Warner Bros. Home Video, Burbank, CA A multiple regression analysis is the most powerful tool that is widely used,
Topic 18: Model Selection and Diagnostics
 Topic 18: Model Selection and Diagnostics Variable Selection We want to choose a best model that is a subset of the available explanatory variables Two separate problems 1. How many explanatory variables
Regression Model Building
 Regression Model Building Setting: Possibly a large set of predictor variables (including interactions). Goal: Fit a parsimonious model that explains variation in Y with a small set of predictors Automated
SAS/STAT 13.1 User s Guide. Introduction to Regression Procedures
 SAS/STAT 13.1 User s Guide Introduction to Regression Procedures This document is an individual chapter from SAS/STAT 13.1 User s Guide. The correct bibliographic citation for the complete manual is as
Data Mining and Data Warehousing. Henryk Maciejewski. Data Mining Predictive modelling: regression
 Data Mining and Data Warehousing Henryk Maciejewski Data Mining Predictive modelling: regression Algorithms for Predictive Modelling Contents Regression Classification Auxiliary topics: Estimation of prediction
1) Answer the following questions as true (T) or false (F) by circling the appropriate letter.
 Answer the following questions as true (T) or false (F) by circling the appropriate letter.") 1) Answer the following questions as true (T) or false (F) by circling the appropriate letter. T F T F T F a) Variance estimates should always be positive, but covariance estimates can be either positive
1) Answer the following questions as true (T) or false (F) by circling the appropriate letter. T F T F T F a) Variance estimates should always be positive, but covariance estimates can be either positive
Dr. Maddah ENMG 617 EM Statistics 11/28/12. Multiple Regression (3) (Chapter 15, Hines)
 (Chapter 15, Hines)") Dr. Maddah ENMG 617 EM Statistics 11/28/12 Multiple Regression (3) (Chapter 15, Hines) Problems in multiple regression: Multicollinearity This arises when the independent variables x 1, x 2,, x k, are
Dr. Maddah ENMG 617 EM Statistics 11/28/12 Multiple Regression (3) (Chapter 15, Hines) Problems in multiple regression: Multicollinearity This arises when the independent variables x 1, x 2,, x k, are
Multicollinearity Exercise
 Multicollinearity Exercise Use the attached SAS output to answer the questions. [OPTIONAL: Copy the SAS program below into the SAS editor window and run it.] You do not need to submit any output, so there
Review: Second Half of Course Stat 704: Data Analysis I, Fall 2014
 Review: Second Half of Course Stat 704: Data Analysis I, Fall 2014 Tim Hanson, Ph.D. University of South Carolina T. Hanson (USC) Stat 704: Data Analysis I, Fall 2014 1 / 13 Chapter 8: Polynomials & Interactions
Chapter 11 : State SAT scores for 1982 Data Listing
 EXST3201 Chapter 12a Geaghan Fall 2005: Page 1 Chapter 12 : Variable selection An example: State SAT scores In 1982 there was concern for scores of the Scholastic Aptitude Test (SAT) scores that varied
COMPREHENSIVE WRITTEN EXAMINATION, PAPER III FRIDAY AUGUST 26, 2005, 9:00 A.M. 1:00 P.M. STATISTICS 174 QUESTION
 COMPREHENSIVE WRITTEN EXAMINATION, PAPER III FRIDAY AUGUST 26, 2005, 9:00 A.M. 1:00 P.M. STATISTICS 174 QUESTION Answer all parts. Closed book, calculators allowed. It is important to show all working,
REGRESSION DIAGNOSTICS AND REMEDIAL MEASURES
 REGRESSION DIAGNOSTICS AND REMEDIAL MEASURES Lalmohan Bhar I.A.S.R.I., Library Avenue, Pusa, New Delhi 110 01 lmbhar@iasri.res.in 1. Introduction Regression analysis is a statistical methodology that utilizes
Detecting and Assessing Data Outliers and Leverage Points
 Chapter 9 Detecting and Assessing Data Outliers and Leverage Points Section 9.1 Background Background Because OLS estimators arise due to the minimization of the sum of squared errors, large residuals
Multiple Linear Regression
 Multiple Linear Regression University of California, San Diego Instructor: Ery Arias-Castro http://math.ucsd.edu/~eariasca/teaching.html 1 / 42 Passenger car mileage Consider the carmpg dataset taken from
holding all other predictors constant
 Multiple Regression Numeric Response variable (y) p Numeric predictor variables (p < n) Model: Y = b 0 + b 1 x 1 + + b p x p + e Partial Regression Coefficients: b i effect (on the mean response) of increasing
Outline. Review regression diagnostics Remedial measures Weighted regression Ridge regression Robust regression Bootstrapping
 Topic 19: Remedies Outline Review regression diagnostics Remedial measures Weighted regression Ridge regression Robust regression Bootstrapping Regression Diagnostics Summary Check normality of the residuals
Regression Diagnostics Procedures
 Regression Diagnostics Procedures ASSUMPTIONS UNDERLYING REGRESSION/CORRELATION NORMALITY OF VARIANCE IN Y FOR EACH VALUE OF X For any fixed value of the independent variable X, the distribution of the
STATISTICS 110/201 PRACTICE FINAL EXAM
 STATISTICS 110/201 PRACTICE FINAL EXAM Questions 1 to 5: There is a downloadable Stata package that produces sequential sums of squares for regression. In other words, the SS is built up as each variable
Leonor Ayyangar, Health Economics Resource Center VA Palo Alto Health Care System Menlo Park, CA
 Skewness, Multicollinearity, Heteroskedasticity - You Name It, Cost Data Have It! Solutions to Violations of Assumptions of Ordinary Least Squares Regression Models Using SAS Leonor Ayyangar, Health Economics
Introduction to Regression Procedures (Chapter)
") SAS/STAT 9.3 User s Guide Introduction to Regression Procedures (Chapter) SAS Documentation This document is an individual chapter from SAS/STAT 9.3 User s Guide. The correct bibliographic citation for
SAS/STAT 9.3 User s Guide Introduction to Regression Procedures (Chapter) SAS Documentation This document is an individual chapter from SAS/STAT 9.3 User s Guide. The correct bibliographic citation for
Statistical Modelling in Stata 5: Linear Models
 Statistical Modelling in Stata 5: Linear Models Mark Lunt Arthritis Research UK Epidemiology Unit University of Manchester 07/11/2017 Structure This Week What is a linear model? How good is my model? Does
Model Selection Procedures
 Model Selection Procedures Statistics 135 Autumn 2005 Copyright c 2005 by Mark E. Irwin Model Selection Procedures Consider a regression setting with K potential predictor variables and you wish to explore
LINEAR REGRESSION ANALYSIS. MODULE XVI Lecture Exercises
 LINEAR REGRESSION ANALYSIS MODULE XVI Lecture - 44 Exercises Dr. Shalabh Department of Mathematics and Statistics Indian Institute of Technology Kanpur Exercise 1 The following data has been obtained on
Section 2 NABE ASTEF 65
 Section 2 NABE ASTEF 65 Econometric (Structural) Models 66 67 The Multiple Regression Model 68 69 Assumptions 70 Components of Model Endogenous variables -- Dependent variables, values of which are determined
LAB 3 INSTRUCTIONS SIMPLE LINEAR REGRESSION
 LAB 3 INSTRUCTIONS SIMPLE LINEAR REGRESSION In this lab you will first learn how to display the relationship between two quantitative variables with a scatterplot and also how to measure the strength of
Statistics for exp. medical researchers Regression and Correlation
 Faculty of Health Sciences Regression analysis Statistics for exp. medical researchers Regression and Correlation Lene Theil Skovgaard Sept. 28, 2015 Linear regression, Estimation and Testing Confidence
STATISTICS 479 Exam II (100 points)
") Name STATISTICS 79 Exam II (1 points) 1. A SAS data set was created using the following input statement: Answer parts(a) to (e) below. input State $ City $ Pop199 Income Housing Electric; (a) () Give the
Name STATISTICS 79 Exam II (1 points) 1. A SAS data set was created using the following input statement: Answer parts(a) to (e) below. input State $ City $ Pop199 Income Housing Electric; (a) () Give the
Final Review. Yang Feng. Yang Feng (Columbia University) Final Review 1 / 58
 Final Review 1 / 58") Final Review Yang Feng http://www.stat.columbia.edu/~yangfeng Yang Feng (Columbia University) Final Review 1 / 58 Outline 1 Multiple Linear Regression (Estimation, Inference) 2 Special Topics for Multiple
Final Review Yang Feng http://www.stat.columbia.edu/~yangfeng Yang Feng (Columbia University) Final Review 1 / 58 Outline 1 Multiple Linear Regression (Estimation, Inference) 2 Special Topics for Multiple
The program for the following sections follows.
 Homework 6 nswer sheet Page 31 The program for the following sections follows. dm'log;clear;output;clear'; *************************************************************; *** EXST734 Homework Example 1
Checking model assumptions with regression diagnostics
 @graemeleehickey www.glhickey.com graeme.hickey@liverpool.ac.uk Checking model assumptions with regression diagnostics Graeme L. Hickey University of Liverpool Conflicts of interest None Assistant Editor
Chapter 4: Regression Models
 Sales volume of company 1 Textbook: pp. 129-164 Chapter 4: Regression Models Money spent on advertising 2 Learning Objectives After completing this chapter, students will be able to: Identify variables,
STAT 4385 Topic 06: Model Diagnostics
 STAT 4385 Topic 06: Xiaogang Su, Ph.D. Department of Mathematical Science University of Texas at El Paso xsu@utep.edu Spring, 2016 1/ 40 Outline Several Types of Residuals Raw, Standardized, Studentized
Contents. 1 Review of Residuals. 2 Detecting Outliers. 3 Influential Observations. 4 Multicollinearity and its Effects
 Contents 1 Review of Residuals 2 Detecting Outliers 3 Influential Observations 4 Multicollinearity and its Effects W. Zhou (Colorado State University) STAT 540 July 6th, 2015 1 / 32 Model Diagnostics:
Quantitative Methods I: Regression diagnostics
 Quantitative Methods I: Regression University College Dublin 10 December 2014 1 Assumptions and errors 2 3 4 Outline Assumptions and errors 1 Assumptions and errors 2 3 4 Assumptions: specification Linear
Lecture 3: Inference in SLR
 Lecture 3: Inference in SLR STAT 51 Spring 011 Background Reading KNNL:.1.6 3-1 Topic Overview This topic will cover: Review of hypothesis testing Inference about 1 Inference about 0 Confidence Intervals
Matematické Metody v Ekonometrii 7.
 Matematické Metody v Ekonometrii 7. Multicollinearity Blanka Šedivá KMA zimní semestr 2016/2017 Blanka Šedivá (KMA) Matematické Metody v Ekonometrii 7. zimní semestr 2016/2017 1 / 15 One of the assumptions
Simple Linear Regression
 Simple Linear Regression September 24, 2008 Reading HH 8, GIll 4 Simple Linear Regression p.1/20 Problem Data: Observe pairs (Y i,x i ),i = 1,...n Response or dependent variable Y Predictor or independent
10. Alternative case influence statistics
 10. Alternative case influence statistics a. Alternative to D i : dffits i (and others) b. Alternative to studres i : externally-studentized residual c. Suggestion: use whatever is convenient with the
Topic 14: Inference in Multiple Regression
 Topic 14: Inference in Multiple Regression Outline Review multiple linear regression Inference of regression coefficients Application to book example Inference of mean Application to book example Inference
Any of 27 linear and nonlinear models may be fit. The output parallels that of the Simple Regression procedure.
 STATGRAPHICS Rev. 9/13/213 Calibration Models Summary... 1 Data Input... 3 Analysis Summary... 5 Analysis Options... 7 Plot of Fitted Model... 9 Predicted Values... 1 Confidence Intervals... 11 Observed
Prediction of Bike Rental using Model Reuse Strategy
 Prediction of Bike Rental using Model Reuse Strategy Arun Bala Subramaniyan and Rong Pan School of Computing, Informatics, Decision Systems Engineering, Arizona State University, Tempe, USA. {bsarun, rong.pan}@asu.edu
y response variable x 1, x 2,, x k -- a set of explanatory variables
 11. Multiple Regression and Correlation y response variable x 1, x 2,, x k -- a set of explanatory variables In this chapter, all variables are assumed to be quantitative. Chapters 12-14 show how to incorporate
Circle the single best answer for each multiple choice question. Your choice should be made clearly.
 TEST #1 STA 4853 March 6, 2017 Name: Please read the following directions. DO NOT TURN THE PAGE UNTIL INSTRUCTED TO DO SO Directions This exam is closed book and closed notes. There are 32 multiple choice
For Bonnie and Jesse (again)
") SECOND EDITION A P P L I E D R E G R E S S I O N A N A L Y S I S a n d G E N E R A L I Z E D L I N E A R M O D E L S For Bonnie and Jesse (again) SECOND EDITION A P P L I E D R E G R E S S I O N A N A
SECOND EDITION A P P L I E D R E G R E S S I O N A N A L Y S I S a n d G E N E R A L I Z E D L I N E A R M O D E L S For Bonnie and Jesse (again) SECOND EDITION A P P L I E D R E G R E S S I O N A N A
Math 423/533: The Main Theoretical Topics
 Math 423/533: The Main Theoretical Topics Notation sample size n, data index i number of predictors, p (p = 2 for simple linear regression) y i : response for individual i x i = (x i1,..., x ip ) (1 p)
Multicollinearity: What Is It and What Can We Do About It?
 Multicollinearity: What Is It and What Can We Do About It? Deanna N Schreiber-Gregory, MS Henry M Jackson Foundation for the Advancement of Military Medicine Presenter Deanna N Schreiber-Gregory, Data
Machine Learning Linear Regression. Prof. Matteo Matteucci
 Machine Learning Linear Regression Prof. Matteo Matteucci Outline 2 o Simple Linear Regression Model Least Squares Fit Measures of Fit Inference in Regression o Multi Variate Regession Model Least Squares
K. Model Diagnostics. residuals ˆɛ ij = Y ij ˆµ i N = Y ij Ȳ i semi-studentized residuals ω ij = ˆɛ ij. studentized deleted residuals ɛ ij =
 K. Model Diagnostics We ve already seen how to check model assumptions prior to fitting a one-way ANOVA. Diagnostics carried out after model fitting by using residuals are more informative for assessing
Single and multiple linear regression analysis
 Single and multiple linear regression analysis Marike Cockeran 2017 Introduction Outline of the session Simple linear regression analysis SPSS example of simple linear regression analysis Additional topics
Experimental Design and Data Analysis for Biologists
 Experimental Design and Data Analysis for Biologists Gerry P. Quinn Monash University Michael J. Keough University of Melbourne CAMBRIDGE UNIVERSITY PRESS Contents Preface page xv I I Introduction 1 1.1
Linear Models 1. Isfahan University of Technology Fall Semester, 2014
 Linear Models 1 Isfahan University of Technology Fall Semester, 2014 References: [1] G. A. F., Seber and A. J. Lee (2003). Linear Regression Analysis (2nd ed.). Hoboken, NJ: Wiley. [2] A. C. Rencher and
Regression Analysis By Example
 Regression Analysis By Example Third Edition SAMPRIT CHATTERJEE New York University ALI S. HADI Cornell University BERTRAM PRICE Price Associates, Inc. A Wiley-Interscience Publication JOHN WILEY & SONS,
Chapter 14 Student Lecture Notes 14-1
 Chapter 14 Student Lecture Notes 14-1 Business Statistics: A Decision-Making Approach 6 th Edition Chapter 14 Multiple Regression Analysis and Model Building Chap 14-1 Chapter Goals After completing this
Stat 500 Midterm 2 12 November 2009 page 0 of 11
 Stat 500 Midterm 2 12 November 2009 page 0 of 11 Please put your name on the back of your answer book. Do NOT put it on the front. Thanks. Do not start until I tell you to. The exam is closed book, closed
Eco and Bus Forecasting Fall 2016 EXERCISE 2
 ECO 5375-701 Prof. Tom Fomby Eco and Bus Forecasting Fall 016 EXERCISE Purpose: To learn how to use the DTDS model to test for the presence or absence of seasonality in time series data and to estimate
Appendix A Summary of Tasks. Appendix Table of Contents
 Appendix A Summary of Tasks Appendix Table of Contents Reporting Tasks...357 ListData...357 Tables...358 Graphical Tasks...358 BarChart...358 PieChart...359 Histogram...359 BoxPlot...360 Probability Plot...360
Ridge Regression. Summary. Sample StatFolio: ridge reg.sgp. STATGRAPHICS Rev. 10/1/2014
 Ridge Regression Summary... 1 Data Input... 4 Analysis Summary... 5 Analysis Options... 6 Ridge Trace... 7 Regression Coefficients... 8 Standardized Regression Coefficients... 9 Observed versus Predicted...
Prepared by: Prof. Dr Bahaman Abu Samah Department of Professional Development and Continuing Education Faculty of Educational Studies Universiti
 Prepared by: Prof Dr Bahaman Abu Samah Department of Professional Development and Continuing Education Faculty of Educational Studies Universiti Putra Malaysia Serdang M L Regression is an extension to
STATISTICS 174: APPLIED STATISTICS FINAL EXAM DECEMBER 10, 2002
 Time allowed: 3 HOURS. STATISTICS 174: APPLIED STATISTICS FINAL EXAM DECEMBER 10, 2002 This is an open book exam: all course notes and the text are allowed, and you are expected to use your own calculator.
Possibly useful formulas for this exam: b1 = Corr(X,Y) SDY / SDX. confidence interval: Estimate ± (Critical Value) (Standard Error of Estimate)
 SDY / SDX. confidence interval: Estimate ± (Critical Value) (Standard Error of Estimate)") Statistics 5100 Exam 2 (Practice) Directions: Be sure to answer every question, and do not spend too much time on any part of any question. Be concise with all your responses. Partial SAS output and statistical
Statistics 5100 Exam 2 (Practice) Directions: Be sure to answer every question, and do not spend too much time on any part of any question. Be concise with all your responses. Partial SAS output and statistical
ECON 4230 Intermediate Econometric Theory Exam
 ECON 4230 Intermediate Econometric Theory Exam Multiple Choice (20 pts). Circle the best answer. 1. The Classical assumption of mean zero errors is satisfied if the regression model a) is linear in the
ssh tap sas913, sas
 B. Kedem, STAT 430 SAS Examples SAS8 ===================== ssh xyz@glue.umd.edu, tap sas913, sas https://www.statlab.umd.edu/sasdoc/sashtml/onldoc.htm Multiple Regression ====================== 0. Show
Overview Scatter Plot Example
 Overview Topic 22 - Linear Regression and Correlation STAT 5 Professor Bruce Craig Consider one population but two variables For each sampling unit observe X and Y Assume linear relationship between variables
Introduction to SAS proc mixed
 Faculty of Health Sciences Introduction to SAS proc mixed Analysis of repeated measurements, 2017 Julie Forman Department of Biostatistics, University of Copenhagen 2 / 28 Preparing data for analysis The
Regression Diagnostics for Survey Data
 Regression Diagnostics for Survey Data Richard Valliant Joint Program in Survey Methodology, University of Maryland and University of Michigan USA Jianzhu Li (Westat), Dan Liao (JPSM) 1 Introduction Topics
Introduction to Regression
 Regression Introduction to Regression If two variables covary, we should be able to predict the value of one variable from another. Correlation only tells us how much two variables covary. In regression,
Labor Economics with STATA. Introduction to Regression Diagnostics
 Labor Economics with STATA Liyousew G. Borga November 4, 2015 Introduction to Regression Diagnostics Liyou Borga Labor Economics with STATA November 4, 2015 64 / 85 Outline 1 Violations of Basic Assumptions
Unit 10: Simple Linear Regression and Correlation
 Unit 10: Simple Linear Regression and Correlation Statistics 571: Statistical Methods Ramón V. León 6/28/2004 Unit 10 - Stat 571 - Ramón V. León 1 Introductory Remarks Regression analysis is a method for
Chapter 1 Statistical Inference
 Chapter 1 Statistical Inference causal inference To infer causality, you need a randomized experiment (or a huge observational study and lots of outside information). inference to populations Generalizations
IES 612/STA 4-573/STA Winter 2008 Week 1--IES 612-STA STA doc
 IES 612/STA 4-573/STA 4-576 Winter 2008 Week 1--IES 612-STA 4-573-STA 4-576.doc Review Notes: [OL] = Ott & Longnecker Statistical Methods and Data Analysis, 5 th edition. [Handouts based on notes prepared
Day 4: Shrinkage Estimators
 Day 4: Shrinkage Estimators Kenneth Benoit Data Mining and Statistical Learning March 9, 2015 n versus p (aka k) Classical regression framework: n > p. Without this inequality, the OLS coefficients have
Topic 20: Single Factor Analysis of Variance
 Topic 20: Single Factor Analysis of Variance Outline Single factor Analysis of Variance One set of treatments Cell means model Factor effects model Link to linear regression using indicator explanatory
Business Statistics. Lecture 10: Course Review
 Business Statistics Lecture 10: Course Review 1 Descriptive Statistics for Continuous Data Numerical Summaries Location: mean, median Spread or variability: variance, standard deviation, range, percentiles,
Statistical Methods for Data Mining
 Statistical Methods for Data Mining Kuangnan Fang Xiamen University Email: xmufkn@xmu.edu.cn Linear regression Linear regression is a simple approach to supervised learning. It assumes that the dependence
Circle a single answer for each multiple choice question. Your choice should be made clearly.
 TEST #1 STA 4853 March 4, 215 Name: Please read the following directions. DO NOT TURN THE PAGE UNTIL INSTRUCTED TO DO SO Directions This exam is closed book and closed notes. There are 31 questions. Circle
Simple Linear Regression
 Simple Linear Regression Reading: Hoff Chapter 9 November 4, 2009 Problem Data: Observe pairs (Y i,x i ),i = 1,... n Response or dependent variable Y Predictor or independent variable X GOALS: Exploring
Chapter 26 Multiple Regression, Logistic Regression, and Indicator Variables
 Chapter 26 Multiple Regression, Logistic Regression, and Indicator Variables 26.1 S 4 /IEE Application Examples: Multiple Regression An S 4 /IEE project was created to improve the 30,000-footlevel metric
Topic 23: Diagnostics and Remedies
 Topic 23: Diagnostics and Remedies Outline Diagnostics residual checks ANOVA remedial measures Diagnostics Overview We will take the diagnostics and remedial measures that we learned for regression and
Course in Data Science
 Course in Data Science About the Course: In this course you will get an introduction to the main tools and ideas which are required for Data Scientist/Business Analyst/Data Analyst. The course gives an
Introduction to SAS proc mixed
 Faculty of Health Sciences Introduction to SAS proc mixed Analysis of repeated measurements, 2017 Julie Forman Department of Biostatistics, University of Copenhagen Outline Data in wide and long format
Statistics 262: Intermediate Biostatistics Model selection
 Statistics 262: Intermediate Biostatistics Model selection Jonathan Taylor & Kristin Cobb Statistics 262: Intermediate Biostatistics p.1/?? Today s class Model selection. Strategies for model selection.
Nonlinear Regression. Summary. Sample StatFolio: nonlinear reg.sgp
 Nonlinear Regression Summary... 1 Analysis Summary... 4 Plot of Fitted Model... 6 Response Surface Plots... 7 Analysis Options... 10 Reports... 11 Correlation Matrix... 12 Observed versus Predicted...
Multicollinearity occurs when two or more predictors in the model are correlated and provide redundant information about the response.
 Multicollinearity Read Section 7.5 in textbook. Multicollinearity occurs when two or more predictors in the model are correlated and provide redundant information about the response. Example of multicollinear
MATH 644: Regression Analysis Methods
 MATH 644: Regression Analysis Methods FINAL EXAM Fall, 2012 INSTRUCTIONS TO STUDENTS: 1. This test contains SIX questions. It comprises ELEVEN printed pages. 2. Answer ALL questions for a total of 100
Lecture 11: Simple Linear Regression
 Lecture 11: Simple Linear Regression Readings: Sections 3.1-3.3, 11.1-11.3 Apr 17, 2009 In linear regression, we examine the association between two quantitative variables. Number of beers that you drink
Lecture 4: Multivariate Regression, Part 2
 Lecture 4: Multivariate Regression, Part 2 Gauss-Markov Assumptions 1) Linear in Parameters: Y X X X i 0 1 1 2 2 k k 2) Random Sampling: we have a random sample from the population that follows the above
Lecture 6: Linear Regression (continued)
") Lecture 6: Linear Regression (continued) Reading: Sections 3.1-3.3 STATS 202: Data mining and analysis October 6, 2017 1 / 23 Multiple linear regression Y = β 0 + β 1 X 1 + + β p X p + ε Y ε N (0, σ) i.i.d.
Lecture 6: Linear Regression (continued) Reading: Sections 3.1-3.3 STATS 202: Data mining and analysis October 6, 2017 1 / 23 Multiple linear regression Y = β 0 + β 1 X 1 + + β p X p + ε Y ε N (0, σ) i.i.d.
STAT 212 Business Statistics II 1
 STAT 1 Business Statistics II 1 KING FAHD UNIVERSITY OF PETROLEUM & MINERALS DEPARTMENT OF MATHEMATICAL SCIENCES DHAHRAN, SAUDI ARABIA STAT 1: BUSINESS STATISTICS II Semester 091 Final Exam Thursday Feb
SAS Procedures Inference about the Line ffl model statement in proc reg has many options ffl To construct confidence intervals use alpha=, clm, cli, c
 Inference About the Slope ffl As with all estimates, ^fi1 subject to sampling var ffl Because Y jx _ Normal, the estimate ^fi1 _ Normal A linear combination of indep Normals is Normal Simple Linear Regression
Final Exam. Name: Solution:
 Final Exam. Name: Instructions. Answer all questions on the exam. Open books, open notes, but no electronic devices. The first 13 problems are worth 5 points each. The rest are worth 1 point each. HW1.
STK4900/ Lecture 5. Program
 STK4900/9900 - Lecture 5 Program 1. Checking model assumptions Linearity Equal variances Normality Influential observations Importance of model assumptions 2. Selection of predictors Forward and backward
Inferences for Regression
 Inferences for Regression An Example: Body Fat and Waist Size Looking at the relationship between % body fat and waist size (in inches). Here is a scatterplot of our data set: Remembering Regression In
Project Report for STAT571 Statistical Methods Instructor: Dr. Ramon V. Leon. Wage Data Analysis. Yuanlei Zhang
 Project Report for STAT7 Statistical Methods Instructor: Dr. Ramon V. Leon Wage Data Analysis Yuanlei Zhang 77--7 November, Part : Introduction Data Set The data set contains a random sample of observations
Multiple Regression and Regression Model Adequacy
 Multiple Regression and Regression Model Adequacy Joseph J. Luczkovich, PhD February 14, 2014 Introduction Regression is a technique to mathematically model the linear association between two or more variables,
Multiple Regression Basic
 Chapter 304 Multiple Regression Basic Introduction Multiple Regression Analysis refers to a set of techniques for studying the straight-line relationships among two or more variables. Multiple regression
Linear regression. Linear regression is a simple approach to supervised learning. It assumes that the dependence of Y on X 1,X 2,...X p is linear.
 Linear regression Linear regression is a simple approach to supervised learning. It assumes that the dependence of Y on X 1,X 2,...X p is linear. 1/48 Linear regression Linear regression is a simple approach
Statistics 5100 Spring 2018 Exam 1
 Statistics 5100 Spring 2018 Exam 1 Directions: You have 60 minutes to complete the exam. Be sure to answer every question, and do not spend too much time on any part of any question. Be concise with all
STATISTICAL BACKGROUND
 Chapter 3 Introduction to Regression Procedures Chapter Table of Contents OVERVIEW... 29 Introduction..... 29 Introductory Example...... 30 General Regression: The REG Procedure...... 34 Nonlinear Regression:
Modeling Machiavellianism Predicting Scores with Fewer Factors
 Modeling Machiavellianism Predicting Scores with Fewer Factors ABSTRACT RESULTS Prince Niccolo Machiavelli said things on the order of, The promise given was a necessity of the past: the word broken is
The ARIMA Procedure: The ARIMA Procedure
 Page 1 of 120 Overview: ARIMA Procedure Getting Started: ARIMA Procedure The Three Stages of ARIMA Modeling Identification Stage Estimation and Diagnostic Checking Stage Forecasting Stage Using ARIMA Procedure