Compiled by: Assoc. Prof. Dr Bahaman Abu Samah Department of Professional Developmentand Continuing Education Faculty of Educational Studies
|
|
|
- Alan Wheeler
- 5 years ago
- Views:
Transcription


1 Compiled by: Assoc. Prof. Dr Bahaman Abu Samah Department of Professional Developmentand Continuing Education Faculty of Educational Studies Universiti Putra Malaysia Serdang
2 Structural Equation Modeling is an extension of the General Linear Model (GLM) SEM is used more as a confirmatory technique rather than exploratory technique i.e. SEM is used to confirm model rather than to discover a new model A multivariate techniques combining Confirmatory Factor Analysis, Multiple Regression and Path Analysis
3 SEM is also known as: Linear Causal Analysis Latent Variable Analysis Dependent Analysis Analysis of Covariance Structure Linear Structural Relations (LISREL) Simultaneous Equation Modeling Covariance Structural Modeling Linear Structural Relationships
4 Model interdependencies between several outcome (DV s) and their causal factors (IV s) SEM provide overall tests of model fit and individual parameter estimate tests simultaneously Regression coefficients, means, and variances may be compared simultaneously, even across multiple between-subjects groups It improves statistical estimation by incorporate measurement errors It enables use of latent (unobserved) variables in dependence relationships
5 AMOS LISREL CALIS of SAS/STAT EQS LISCOMP SEPATH Mx (
6 Stands for Analysis of MOment Structures Moment structures refer to: :: Mean :: Variance :: Covariance A computer application under SPSS Utilizes graphical interface
7 Exogenous = Independent variable Endogenous = Dependent or mediating variables Manifest = observed variable Latent = unobserved variable Correlations and covariances are represented by bidirectional arrows Causal effects are represented by single-headed arrows Number 1 refers to the paths coefficients have fixed values of 1.00 e1 1 1 F1 e2 1 e3 1 F2 e4 1 1
8 Theory Model Construction Instrument Construction Data Collection Model Testing Results Interpretation The researcher first specifies a model based on theory, then determines how to measure constructs, collects data, and then inputs the data into the SEM software package. The package fits the data to the specified model and produces the results, which include overall model fit statistics and parameter estimates.
9 Kline (2010) has suggested 3 framework for testing SEM1: 1. Strictly confirmatory Test a single model theory: reject or fail to reject 2 Alternative model Test several alternative or competing model which are supported by theories. Choose the best fit 3. Model generating Test a single model theory. However may modify and re-estimate the model This is most commonly used framework
 2.")
10 Two types of SEM model: 1. Measurement model Assess the measures/instrument Involve Confirmatory Factor Analysis (CFA) 2. Structural model Test relationship between variables Involve regression and path analysis
 Enables an assessment of construct validity (convergent and discriminant")
11 A SEM that: Specifies the indicators for each construct Use in Confirmatory Factor Analysis (CFA) Enables an assessment of construct validity (convergent and discriminant validity)
12 Convergent validity refers to a set of variables that presume to measure a construct (Kline, 2005) It can be tested using: Average Variance Extracted (AVE) A high AVE (>.5) indicates a high convergent validity (Fornell & Larcker, 1981) Factor loadings High factor loadings (.5) on a factor indicate high convergent validity (Hair, et al, 2006)
13 Convergent validity refers to a set of variables that presume to measure different constructs (Kline, 2005) It can be tested by examining the AVE for each construct against squared correlations (shared variance) between the construct and all other constructs in the model A construct will have sufficient dicriminant validity If the AVE exceeds the squared correlation among the constructs (Fornell and Larcker, 1981; Hair et al, 2006)

14 Structural model represents set of one or more dependence relationship linking the hypothesized model s construct This model is most useful in representing the interrelationships between exogenous and endogenous Variables Use to test direct and indirect effects
15 Generally requires large sample size Klien (2005) suggests: < 100 Small sample size 100 to 200 Medium sample size > 200 Large sample size Critical sample size = 200 (Hoe, 2008) Minimum ration of 10:1 (Ho, 2006) A general rule for sample size of 15 cases per predictor


16

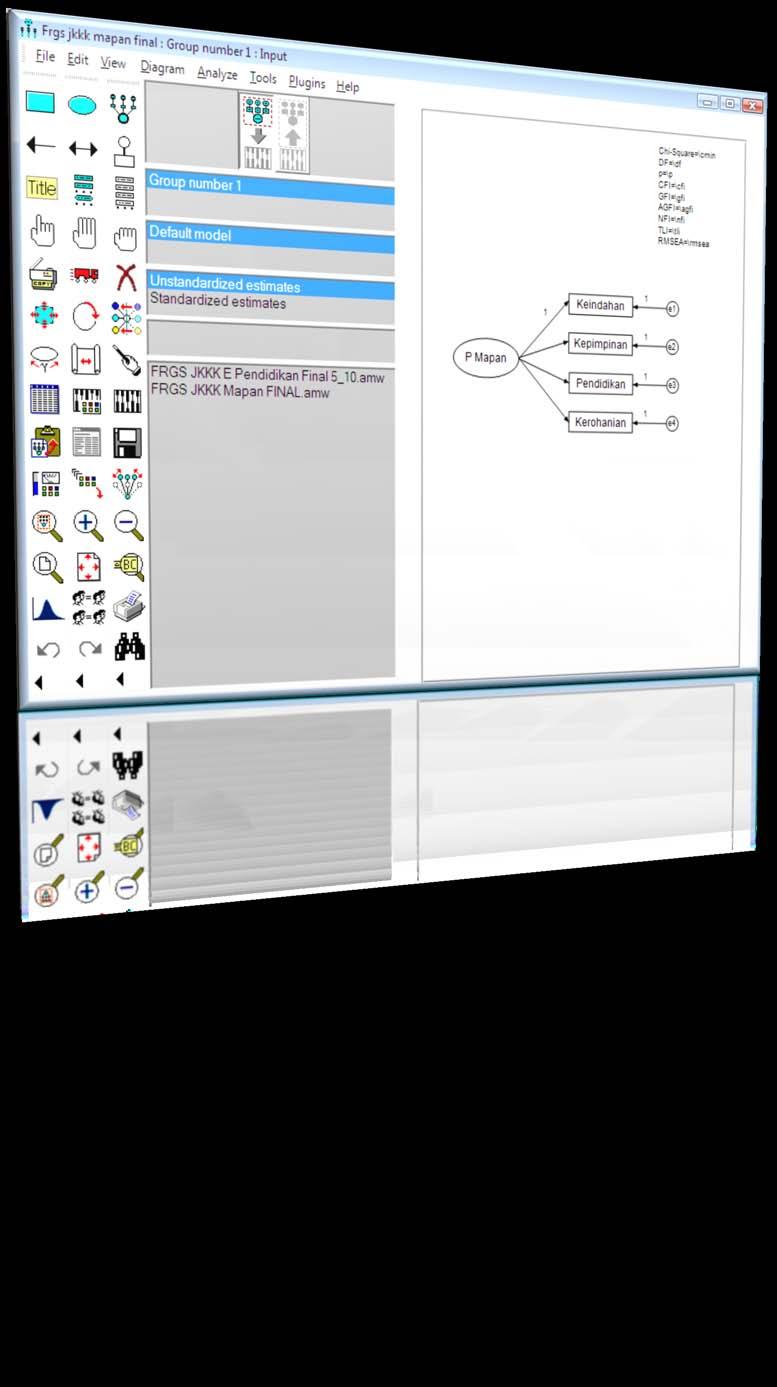
17 Cont. Tool Box Use mouse and click the appropriate icons to draw a figure of the proposed model
18 Draw manifest variables Select all objects Draw latent variables Draw a latent variable and add an indicator to it Draw causal path Draw covariance/correlation Add a unique variable to an existing variable Figure captions Deselect all objects Duplicate objects Move objects Rotate the indicators of a latent variable Select data file(s) Analysis properties List variables in the model Calculate estimates List variables in the data set Object properties Select one object at a time Resize diagram to fit page
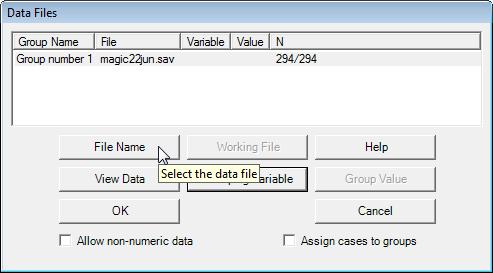
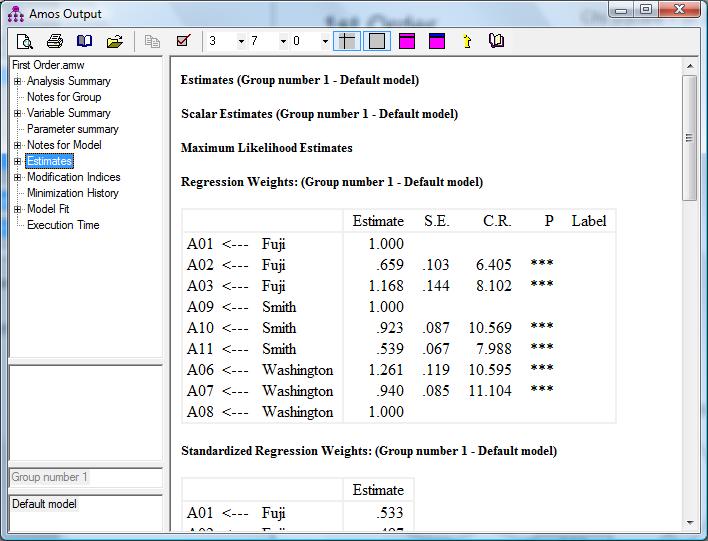
19 1. Draw figure 2. Click to select data 3. Click to display variable list 4. Drag variable into the observed variable box and label the unobserved/latent variables 5. Type the following commands in the text box 6. Click Analysis Properties 7. Click to Calculate Estimates 8. Click to view the detailed text output

20
21
22
23


24 Chi-Square=\cmin DF=\df p=\p GFI=\gfi AGFI=\agfi CFI=\cfi NFI=\nfi TLI=\tli RMSEA=\rmsea

25 :: For CFA may want to select - Normality and Outliers :: For Structural Model, select Indirect


26
27


28
29 1. Test assumption for normality and presence of outliers 2. Look for Offending Estimate (value>1) 3. Examine the Fit indexes 4 Identify values of path coefficients 5 Report the proportion of variance explained 6 Competing models 7 Multicolinearity


30 Use skewness and kurtosis to test on normality Data is considered to be normal if: :: Skewness is between -3 to +3 :: Kurtosis is between -7 to +7 (Byren, 2010)

31 By default, SEM uses maximum likelihood as the estimation technique Otherwise you may use other techniques


32 Test for outliers Remove cases if both p1 and p2 for the Mahalanobis d-squared are.000 and.000

33 Offending estimate exists when standardized regression weight > 1 We need to remove the highest std. regression estimate

 fit indices or 3")

34 A number of fit indices can be used to test for model fit Generally we need to present at least four (4) fit indices or 3 (Garson) The recommended indices include: :: GFI :: CFI :: IFI :: RMSEA
35 Fit Indices Authors Recommended Current value Fit Indices CMIN/DF Marsh & Hocevar, 1985 < 5.0 Bentler, 1990 < 5.0 Reported if n > 200 GFI Chau, 1997 >.90 Segars & Grover, 1993 >.90 CFI Bentler, 1990 >.90 Hatcher, 1994 >.90 RMSEA Byrne, 2001 <.08 Hu & Bentler, 1999 <.05 NFI Bentler & Bonett, 1980 >.90 CMIN Tabachnik & Fidell, 1996 Reported if n between
 _ CR (Coefficient Ratio) _ CR is equivalent to t value")
36 The path coefficients must be significant and the std. value >.20 Look for: _ SE (Standard Error) _ CR (Coefficient Ratio) _ CR is equivalent to t value in Regression _ p (sig-value)
 explained 71% of variance in")
37 R 2 refers to the proportion of variance explained Must be at least.10 In the example, the three variables (JRV,OV and MPV) explained 71% of variance in TM Error = 1 R 2 =.29

38 Compare the different models Choose the best fit model


39 If there is no mention of Model is NOT admissible
Structural Equation Modelling
 Slide Email: jkanglim@unimelb.edu.au Office: Room 0 Redmond Barry Building Website: http://jeromyanglim.googlepages.com/ Appointments: For appointments regarding course or with the application of statistics
Introduction to Structural Equation Modeling
 Introduction to Structural Equation Modeling Notes Prepared by: Lisa Lix, PhD Manitoba Centre for Health Policy Topics Section I: Introduction Section II: Review of Statistical Concepts and Regression
Structural Equation Modeling and Confirmatory Factor Analysis. Types of Variables
 /4/04 Structural Equation Modeling and Confirmatory Factor Analysis Advanced Statistics for Researchers Session 3 Dr. Chris Rakes Website: http://csrakes.yolasite.com Email: Rakes@umbc.edu Twitter: @RakesChris
Factor Analysis & Structural Equation Models. CS185 Human Computer Interaction
 Factor Analysis & Structural Equation Models CS185 Human Computer Interaction MoodPlay Recommender (Andjelkovic et al, UMAP 2016) Online system available here: http://ugallery.pythonanywhere.com/ 2 3 Structural
Introduction to Structural Equation Modeling Dominique Zephyr Applied Statistics Lab
 Applied Statistics Lab Introduction to Structural Equation Modeling Dominique Zephyr Applied Statistics Lab SEM Model 3.64 7.32 Education 2.6 Income 2.1.6.83 Charac. of Individuals 1 5.2e-06 -.62 2.62
STRUCTURAL EQUATION MODELING. Khaled Bedair Statistics Department Virginia Tech LISA, Summer 2013
 STRUCTURAL EQUATION MODELING Khaled Bedair Statistics Department Virginia Tech LISA, Summer 2013 Introduction: Path analysis Path Analysis is used to estimate a system of equations in which all of the
Prepared by: Prof. Dr Bahaman Abu Samah Department of Professional Development and Continuing Education Faculty of Educational Studies Universiti
 Prepared by: Prof Dr Bahaman Abu Samah Department of Professional Development and Continuing Education Faculty of Educational Studies Universiti Putra Malaysia Serdang M L Regression is an extension to
Prepared by: Prof. Dr Bahaman Abu Samah Department of Professional Development and Continuing Education Faculty of Educational Studies Universiti
 Prepared by: Prof. Dr Bahaman Abu Samah Department of Professional Development and Continuing Education Faculty of Educational Studies Universiti Putra Malaysia Serdang Use in experiment, quasi-experiment
STRUCTURAL EQUATION MODEL (SEM)
") STRUCTURAL EQUATION MODEL (SEM) V. Čekanavičius, G. Murauskas 1 PURPOSE OF SEM To check if the model of possible variable dependencies matches data. SEM can contain latent (directly unobservable) variables.
STRUCTURAL EQUATION MODEL (SEM) V. Čekanavičius, G. Murauskas 1 PURPOSE OF SEM To check if the model of possible variable dependencies matches data. SEM can contain latent (directly unobservable) variables.
EVALUATION OF STRUCTURAL EQUATION MODELS
 1 EVALUATION OF STRUCTURAL EQUATION MODELS I. Issues related to the initial specification of theoretical models of interest 1. Model specification: a. Measurement model: (i) EFA vs. CFA (ii) reflective
Essentials of Structural Equation Modeling
 University of Nebraska - Lincoln DigitalCommons@University of Nebraska - Lincoln Zea E-Books Zea E-Books 3-12-2018 Essentials of Structural Equation Modeling Mustafa Emre Civelek Istanbul Commerce University,
SC705: Advanced Statistics Instructor: Natasha Sarkisian Class notes: Introduction to Structural Equation Modeling (SEM)
") SC705: Advanced Statistics Instructor: Natasha Sarkisian Class notes: Introduction to Structural Equation Modeling (SEM) SEM is a family of statistical techniques which builds upon multiple regression,
SC705: Advanced Statistics Instructor: Natasha Sarkisian Class notes: Introduction to Structural Equation Modeling (SEM) SEM is a family of statistical techniques which builds upon multiple regression,
A study on new customer satisfaction index model of smart grid
 2nd Annual International Conference on Electronics, Electrical Engineering and Information Science (EEEIS 2016) A study on new index model of smart grid Ze-San Liu 1,a, Zhuo Yu 1,b and Ai-Qiang Dong 1,c
2/26/2017. PSY 512: Advanced Statistics for Psychological and Behavioral Research 2
 PSY 512: Advanced Statistics for Psychological and Behavioral Research 2 What is SEM? When should we use SEM? What can SEM tell us? SEM Terminology and Jargon Technical Issues Types of SEM Models Limitations
Factor analysis. George Balabanis
 Factor analysis George Balabanis Key Concepts and Terms Deviation. A deviation is a value minus its mean: x - mean x Variance is a measure of how spread out a distribution is. It is computed as the average
1 DV is normally distributed in the population for each level of the within-subjects factor 2 The population variances of the difference scores
 One-way Prepared by: Prof. Dr Bahaman Abu Samah Department of Professional Development and Continuing Education Faculty of Educational Studies Universiti Putra Malaysia Serdang The purpose is to test the
What is Structural Equation Modelling?
 methods@manchester What is Structural Equation Modelling? Nick Shryane Institute for Social Change University of Manchester 1 Topics Where SEM fits in the families of statistical models Causality SEM is
Prepared by: Assoc. Prof. Dr Bahaman Abu Samah Department of Professional Development and Continuing Education Faculty of Educational Studies
 Prepared by: Assoc. Prof. Dr Bahaman Abu Samah Department of Professional Development and Continuing Education Faculty of Educational Studies Universiti Putra Malaysia Serdang Participants to be able to:
SEM Day 1 Lab Exercises SPIDA 2007 Dave Flora
 SEM Day 1 Lab Exercises SPIDA 2007 Dave Flora 1 Today we will see how to estimate CFA models and interpret output using both SAS and LISREL. In SAS, commands for specifying SEMs are given using linear
C:\Users\Rex Kline\AppData\Local\Temp\AmosTemp\AmosScratch.amw. Date: Friday, December 5, 2014 Time: 11:20:30 AM
 Page 1 of 7 C:\Users\Rex Kline\AppData\Local\Temp\AmosTemp\AmosScratch.amw Analysis Summary Date and Time Date: Friday, December 5, 2014 Time: 11:20:30 AM Title Groups Group number 1 (Group number 1) Notes
Introduction to Structural Equation Modeling: Issues and Practical Considerations
 An NCME Instructional Module on Introduction to Structural Equation Modeling: Issues and Practical Considerations Pui-Wa Lei and Qiong Wu, The Pennsylvania State University Structural equation modeling
Preface. List of examples
 Contents Preface List of examples i xix 1 LISREL models and methods 1 1.1 The general LISREL model 1 Assumptions 2 The covariance matrix of the observations as implied by the LISREL model 3 Fixed, free,
Chapter 8. Models with Structural and Measurement Components. Overview. Characteristics of SR models. Analysis of SR models. Estimation of SR models
 Chapter 8 Models with Structural and Measurement Components Good people are good because they've come to wisdom through failure. Overview William Saroyan Characteristics of SR models Estimation of SR models
AN INTRODUCTION TO STRUCTURAL EQUATION MODELING WITH AN APPLICATION TO THE BLOGOSPHERE
 AN INTRODUCTION TO STRUCTURAL EQUATION MODELING WITH AN APPLICATION TO THE BLOGOSPHERE Dr. James (Jim) D. Doyle March 19, 2014 Structural equation modeling or SEM 1971-1980: 27 1981-1990: 118 1991-2000:
Evaluation of structural equation models. Hans Baumgartner Penn State University
 Evaluation of structural equation models Hans Baumgartner Penn State University Issues related to the initial specification of theoretical models of interest Model specification: Measurement model: EFA
Regression without measurement error using proc calis
 Regression without measurement error using proc calis /* calculus2.sas */ options linesize=79 pagesize=500 noovp formdlim='_'; title 'Calculus 2: Regression with no measurement error'; title2 ''; data
INTRODUCTION TO STRUCTURAL EQUATION MODELS
 I. Description of the course. INTRODUCTION TO STRUCTURAL EQUATION MODELS A. Objectives and scope of the course. B. Logistics of enrollment, auditing, requirements, distribution of notes, access to programs.
Multi-group analyses for measurement invariance parameter estimates and model fit (ML)
") LBP-TBQ: Supplementary digital content 8 Multi-group analyses for measurement invariance parameter estimates and model fit (ML) Medication data Multi-group CFA analyses were performed with the 16-item
LBP-TBQ: Supplementary digital content 8 Multi-group analyses for measurement invariance parameter estimates and model fit (ML) Medication data Multi-group CFA analyses were performed with the 16-item
Estimation of Curvilinear Effects in SEM. Rex B. Kline, September 2009
 Estimation of Curvilinear Effects in SEM Supplement to Principles and Practice of Structural Equation Modeling (3rd ed.) Rex B. Kline, September 009 Curvlinear Effects of Observed Variables Consider the
* IVEware Analysis Examples Replication for ASDA 2nd Edition * Berglund April 2017 * Chapter 13 ;
 IVEware Analysis Example Replication C13 * IVEware Analysis Examples Replication for ASDA 2nd Edition * Berglund April 2017 * Chapter 13 ; * 13.3.3 Alternative Approaches to Fitting GLMMs to Survey Data:
SAS Example 3: Deliberately create numerical problems
 SAS Example 3: Deliberately create numerical problems Four experiments 1. Try to fit this model, failing the parameter count rule. 2. Set φ 12 =0 to pass the parameter count rule, but still not identifiable.
The Specification of Causal Models with Tetrad IV: A Review
 Structural Equation Modeling, 17:703 711, 2010 Copyright Taylor & Francis Group, LLC ISSN: 1070-5511 print/1532-8007 online DOI: 10.1080/10705511.2010.510074 SOFTWARE REVIEW The Specification of Causal
STAT 730 Chapter 9: Factor analysis
 STAT 730 Chapter 9: Factor analysis Timothy Hanson Department of Statistics, University of South Carolina Stat 730: Multivariate Data Analysis 1 / 15 Basic idea Factor analysis attempts to explain the
A Cautionary Note on the Use of LISREL s Automatic Start Values in Confirmatory Factor Analysis Studies R. L. Brown University of Wisconsin
 A Cautionary Note on the Use of LISREL s Automatic Start Values in Confirmatory Factor Analysis Studies R. L. Brown University of Wisconsin The accuracy of parameter estimates provided by the major computer
The use of structural equation modeling to examine consumption of pornographic materials in Chinese adolescents in Hong Kong
 The use of structural equation modeling to examine consumption of pornographic materials in Chinese adolescents in Hong Kong Appendix 1 Creating matrices and checking for normality!prelis SYNTAX: Can be
Confirmatory Factor Analysis. Psych 818 DeShon
 Confirmatory Factor Analysis Psych 818 DeShon Purpose Takes factor analysis a few steps further. Impose theoretically interesting constraints on the model and examine the resulting fit of the model with
Structural Equation Modeling
 CHAPTER 23 Structural Equation Modeling JODIE B. ULLMAN AND PETER M. BENTLER A FOUR-STAGE GENERAL PROCESS OF MODELING 663 MODEL ESTIMATION TECHNIQUES AND TEST STATISTICS 667 MODEL EVALUATION 671 MODEL
An Introduction to Path Analysis
 An Introduction to Path Analysis Developed by Sewall Wright, path analysis is a method employed to determine whether or not a multivariate set of nonexperimental data fits well with a particular (a priori)
Path Analysis. PRE 906: Structural Equation Modeling Lecture #5 February 18, PRE 906, SEM: Lecture 5 - Path Analysis
 Path Analysis PRE 906: Structural Equation Modeling Lecture #5 February 18, 2015 PRE 906, SEM: Lecture 5 - Path Analysis Key Questions for Today s Lecture What distinguishes path models from multivariate
Psychology 454: Latent Variable Modeling How do you know if a model works?
 Psychology 454: Latent Variable Modeling How do you know if a model works? William Revelle Department of Psychology Northwestern University Evanston, Illinois USA October, 2017 1 / 33 Outline Goodness
PRESENTATION TITLE. Is my survey biased? The importance of measurement invariance. Yusuke Kuroki Sunny Moon November 9 th, 2017
 PRESENTATION TITLE Is my survey biased? The importance of measurement invariance Yusuke Kuroki Sunny Moon November 9 th, 2017 Measurement Invariance Measurement invariance: the same construct is being
Introduction to Confirmatory Factor Analysis
 Introduction to Confirmatory Factor Analysis Multivariate Methods in Education ERSH 8350 Lecture #12 November 16, 2011 ERSH 8350: Lecture 12 Today s Class An Introduction to: Confirmatory Factor Analysis
Chapter 5. Introduction to Path Analysis. Overview. Correlation and causation. Specification of path models. Types of path models
 Chapter 5 Introduction to Path Analysis Put simply, the basic dilemma in all sciences is that of how much to oversimplify reality. Overview H. M. Blalock Correlation and causation Specification of path
Psychology 454: Latent Variable Modeling How do you know if a model works?
 Psychology 454: Latent Variable Modeling How do you know if a model works? William Revelle Department of Psychology Northwestern University Evanston, Illinois USA November, 2012 1 / 18 Outline 1 Goodness
RESMA course Introduction to LISREL. Harry Ganzeboom RESMA Data Analysis & Report #4 February
 RESMA course Introduction to LISREL Harry Ganzeboom RESMA Data Analysis & Report #4 February 17 2009 LISREL SEM: Simultaneous [Structural] Equations Model: A system of linear equations ( causal model )
Nesting and Equivalence Testing
 Nesting and Equivalence Testing Tihomir Asparouhov and Bengt Muthén August 13, 2018 Abstract In this note, we discuss the nesting and equivalence testing (NET) methodology developed in Bentler and Satorra
Principles of factor analysis. Roger Watson
 Principles of factor analysis Roger Watson Factor analysis Factor analysis Factor analysis Factor analysis is a multivariate statistical method for reducing large numbers of variables to fewer underlying
Improper Solutions in Exploratory Factor Analysis: Causes and Treatments
 Improper Solutions in Exploratory Factor Analysis: Causes and Treatments Yutaka Kano Faculty of Human Sciences, Osaka University Suita, Osaka 565, Japan. email: kano@hus.osaka-u.ac.jp Abstract: There are
4. Path Analysis. In the diagram: The technique of path analysis is originated by (American) geneticist Sewell Wright in early 1920.
 geneticist Sewell Wright in early 1920.") 4. Path Analysis The technique of path analysis is originated by (American) geneticist Sewell Wright in early 1920. The relationships between variables are presented in a path diagram. The system of relationships
4. Path Analysis The technique of path analysis is originated by (American) geneticist Sewell Wright in early 1920. The relationships between variables are presented in a path diagram. The system of relationships
CONFIRMATORY FACTOR ANALYSIS
 1 CONFIRMATORY FACTOR ANALYSIS The purpose of confirmatory factor analysis (CFA) is to explain the pattern of associations among a set of observed variables in terms of a smaller number of underlying latent
Using Structural Equation Modeling to Conduct Confirmatory Factor Analysis
 Using Structural Equation Modeling to Conduct Confirmatory Factor Analysis Advanced Statistics for Researchers Session 3 Dr. Chris Rakes Website: http://csrakes.yolasite.com Email: Rakes@umbc.edu Twitter:
Structural equation modeling
 Structural equation modeling Rex B Kline Concordia University Montréal ISTQL Set B B1 Data, path models Data o N o Form o Screening B2 B3 Sample size o N needed: Complexity Estimation method Distributions
Condition 9 and 10 Tests of Model Confirmation with SEM Techniques
 Condition 9 and 10 Tests of Model Confirmation with SEM Techniques Dr. Larry J. Williams CARMA Director Donald and Shirley Clifton Chair of Survey Science Professor of Management University of Nebraska
Multilevel Structural Equation Modeling
 Multilevel Structural Equation Modeling Joop Hox Utrecht University j.hox@uu.nl http://www.joophox.net 14_15_mlevsem Multilevel Regression Three level data structure Groups at different levels may have
Structural Equation Modeling
 Chapter 11 Structural Equation Modeling Hans Baumgartner and Bert Weijters Hans Baumgartner, Smeal College of Business, The Pennsylvania State University, University Park, PA 16802, USA, E-mail: jxb14@psu.edu.
Introduction to Structural Equation Modeling with Latent Variables
 SAS/STAT 9.2 User s Guide Introduction to Structural Equation Modeling with Latent Variables (Book Excerpt) SAS Documentation This document is an individual chapter from SAS/STAT 9.2 User s Guide. The
WHAT IS STRUCTURAL EQUATION MODELING (SEM)?
?") WHAT IS STRUCTURAL EQUATION MODELING (SEM)? 1 LINEAR STRUCTURAL RELATIONS 2 Terminología LINEAR LATENT VARIABLE MODELS T.W. Anderson (1989), Journal of Econometrics MULTIVARIATE LINEAR RELATIONS T.W. Anderson
WHAT IS STRUCTURAL EQUATION MODELING (SEM)? 1 LINEAR STRUCTURAL RELATIONS 2 Terminología LINEAR LATENT VARIABLE MODELS T.W. Anderson (1989), Journal of Econometrics MULTIVARIATE LINEAR RELATIONS T.W. Anderson
The Role of Leader Motivating Language in Employee Absenteeism (Mayfield: 2009)
") DATE: 12/15/2009 TIME: 5:50 Page 1 LISREL 8.80 (STUDENT EDITION) BY Karl G. J reskog & Dag S rbom This program is published exclusively by Scientific Software International, Inc. 7383 N. Lincoln Avenue,
DATE: 12/15/2009 TIME: 5:50 Page 1 LISREL 8.80 (STUDENT EDITION) BY Karl G. J reskog & Dag S rbom This program is published exclusively by Scientific Software International, Inc. 7383 N. Lincoln Avenue,
An Introduction to Path Analysis
 An Introduction to Path Analysis PRE 905: Multivariate Analysis Lecture 10: April 15, 2014 PRE 905: Lecture 10 Path Analysis Today s Lecture Path analysis starting with multivariate regression then arriving
Description Remarks and examples Reference Also see
 Title stata.com example 20 Two-factor measurement model by group Description Remarks and examples Reference Also see Description Below we demonstrate sem s group() option, which allows fitting models in
Related Concepts: Lecture 9 SEM, Statistical Modeling, AI, and Data Mining. I. Terminology of SEM
 Lecture 9 SEM, Statistical Modeling, AI, and Data Mining I. Terminology of SEM Related Concepts: Causal Modeling Path Analysis Structural Equation Modeling Latent variables (Factors measurable, but thru
THE GENERAL STRUCTURAL EQUATION MODEL WITH LATENT VARIATES
 THE GENERAL STRUCTURAL EQUATION MODEL WITH LATENT VARIATES I. Specification: A full structural equation model with latent variables consists of two parts: a latent variable model (which specifies the relations
Chapter 3: Testing alternative models of data
 Chapter 3: Testing alternative models of data William Revelle Northwestern University Prepared as part of course on latent variable analysis (Psychology 454) and as a supplement to the Short Guide to R
Instrumental variables regression on the Poverty data
 Instrumental variables regression on the Poverty data /********************** poverty2.sas **************************/ options linesize=79 noovp formdlim='-' nodate; title 'UN Poverty Data: Instrumental
Assessing the relation between language comprehension and performance in general chemistry. Appendices
 Assessing the relation between language comprehension and performance in general chemistry Daniel T. Pyburn a, Samuel Pazicni* a, Victor A. Benassi b, and Elizabeth E. Tappin c a Department of Chemistry,
UNIVERSITY OF TORONTO MISSISSAUGA April 2009 Examinations STA431H5S Professor Jerry Brunner Duration: 3 hours
 Name (Print): Student Number: Signature: Last/Surname First /Given Name UNIVERSITY OF TORONTO MISSISSAUGA April 2009 Examinations STA431H5S Professor Jerry Brunner Duration: 3 hours Aids allowed: Calculator
Belowisasamplingofstructuralequationmodelsthatcanbefitby sem.
 Title intro4 Tourofmodels Description Belowisasamplingofstructuralequationmodelsthatcanbefitby sem. Remarks Ifyouhavenotread [SEM]intro 2, please doso.youneed to speak thelanguage.wealso recommend reading[sem]
UNIVERSITY OF CALGARY. The Influence of Model Components and Misspecification Type on the Performance of the
 UNIVERSITY OF CALGARY The Influence of Model Components and Misspecification Type on the Performance of the Comparative Fit Index (CFI) and the Root Mean Square Error of Approximation (RMSEA) in Structural
Short Answer Questions: Answer on your separate blank paper. Points are given in parentheses.
 ISQS 6348 Final exam solutions. Name: Open book and notes, but no electronic devices. Answer short answer questions on separate blank paper. Answer multiple choice on this exam sheet. Put your name on
Systematic error, of course, can produce either an upward or downward bias.
 Brief Overview of LISREL & Related Programs & Techniques (Optional) Richard Williams, University of Notre Dame, https://www3.nd.edu/~rwilliam/ Last revised April 6, 2015 STRUCTURAL AND MEASUREMENT MODELS:
Introduction to Confirmatory Factor Analysis
 Introduction to Confirmatory Factor Analysis In Exploratory FA, the analyst has no strong prior notion of the structure of the factor solution the goal is to infer factor structure from the patterns of
2013 IAP. Chapter 2. Feedback Loops and Formative Measurement. Rex B. Kline
 Chapter 2 Reverse Arrow Dynamics Feedback Loops and Formative Measurement Rex B. Kline Life can only be understood backwards; but it must be lived forwards. Soren Kierkegaard (843; quoted in Watkin, 2004,
SPSS LAB FILE 1
 SPSS LAB FILE www.mcdtu.wordpress.com 1 www.mcdtu.wordpress.com 2 www.mcdtu.wordpress.com 3 OBJECTIVE 1: Transporation of Data Set to SPSS Editor INPUTS: Files: group1.xlsx, group1.txt PROCEDURE FOLLOWED:
Course title SD206. Introduction to Structural Equation Modelling
 10 th ECPR Summer School in Methods and Techniques, 23 July - 8 August University of Ljubljana, Slovenia Course Description Form 1-2 week course (30 hrs) Course title SD206. Introduction to Structural
Evaluating the Sensitivity of Goodness-of-Fit Indices to Data Perturbation: An Integrated MC-SGR Approach
 Evaluating the Sensitivity of Goodness-of-Fit Indices to Data Perturbation: An Integrated MC-SGR Approach Massimiliano Pastore 1 and Luigi Lombardi 2 1 Department of Psychology University of Cagliari Via
Principles and Practice in Reporting Structural Equation Analyses
 Psychological Methods Copyright 2002 by the American Psychological Association, Inc. 2002, Vol. 7, No. 1, 64 82 1082-989X/02/$5.00 DOI: 10.1037//1082-989X.7.1.64 Principles and Practice in Reporting Structural
An Introduction to Mplus and Path Analysis
 An Introduction to Mplus and Path Analysis PSYC 943: Fundamentals of Multivariate Modeling Lecture 10: October 30, 2013 PSYC 943: Lecture 10 Today s Lecture Path analysis starting with multivariate regression
APPLIED STRUCTURAL EQUATION MODELLING FOR RESEARCHERS AND PRACTITIONERS. Using R and Stata for Behavioural Research
 APPLIED STRUCTURAL EQUATION MODELLING FOR RESEARCHERS AND PRACTITIONERS Using R and Stata for Behavioural Research APPLIED STRUCTURAL EQUATION MODELLING FOR RESEARCHERS AND PRACTITIONERS Using R and Stata
Measurement Invariance Testing with Many Groups: A Comparison of Five Approaches (Online Supplements)
") University of South Florida Scholar Commons Educational and Psychological Studies Faculty Publications Educational and Psychological Studies 2017 Measurement Invariance Testing with Many Groups: A Comparison
University of South Florida Scholar Commons Educational and Psychological Studies Faculty Publications Educational and Psychological Studies 2017 Measurement Invariance Testing with Many Groups: A Comparison
4:3 LEC - PLANNED COMPARISONS AND REGRESSION ANALYSES
 4:3 LEC - PLANNED COMPARISONS AND REGRESSION ANALYSES FOR SINGLE FACTOR BETWEEN-S DESIGNS Planned or A Priori Comparisons We previously showed various ways to test all possible pairwise comparisons for
Multiple group models for ordinal variables
 Multiple group models for ordinal variables 1. Introduction In practice, many multivariate data sets consist of observations of ordinal variables rather than continuous variables. Most statistical methods
SC705: Advanced Statistics Instructor: Natasha Sarkisian Class notes: Model Building Strategies
 SC705: Advanced Statistics Instructor: Natasha Sarkisian Class notes: Model Building Strategies Model Diagnostics The model diagnostics and improvement strategies discussed here apply to both measurement
1 Correlation and Inference from Regression
 1 Correlation and Inference from Regression Reading: Kennedy (1998) A Guide to Econometrics, Chapters 4 and 6 Maddala, G.S. (1992) Introduction to Econometrics p. 170-177 Moore and McCabe, chapter 12 is
Fit Indices Versus Test Statistics
 MULTIVARIATE BEHAVIORAL RESEARCH, 40(1), 115 148 Copyright 2005, Lawrence Erlbaum Associates, Inc. Fit Indices Versus Test Statistics Ke-Hai Yuan University of Notre Dame Model evaluation is one of the
Psychology 830. Introduction to Covariance Structure Modeling
 Psychology 830 Introduction to Covariance Structure Modeling Class Notes Winter 2004 Michael W. Browne Ohio State University These notes have been developed collaboratively by Professors Michael Browne
SEM Analysis of Epigenetic Data
 SEM Analysis of Epigenetic Data By Azadeh Chizarifard Department of Statistics Uppsala University Supervisors: Åsa Johansson, Rolf Larsson 2014 Abstract DNA methylation as well as glucosylceramide has
In this module I again consider compositing. This module follows one entitled, Composites and Formative Indicators. In this module, I deal with a
 In this module I again consider compositing. This module follows one entitled, Composites and Formative Indicators. In this module, I deal with a special situation where there is an endogenous link that
Using SAS PROC TCALIS for multigroup structural equation modelling with mean structures
 516 British Journal of Mathematical and Statistical Psychology (2011), 64, 516 537 C 2011 The British Psychological Society The British Psychological Society www.wileyonlinelibrary.com Expert Tutorial
Overview. 1. Terms and Definitions. 2. Model Identification. 3. Path Coefficients
 2. The Basics Overview 1. Terms and Definitions 2. Model Identification 3. Path Coefficients 2.1 Terms and Definitions 2.1 Terms & Definitions. Structural equation model = observed, latent, composite Direct
sempower Manual Morten Moshagen
 sempower Manual Morten Moshagen 2018-03-22 Power Analysis for Structural Equation Models Contact: morten.moshagen@uni-ulm.de Introduction sempower provides a collection of functions to perform power analyses
Inference using structural equations with latent variables
 This work is licensed under a Creative Commons Attribution-NonCommercial-ShareAlike License. Your use of this material constitutes acceptance of that license and the conditions of use of materials on this
Pelatihan Statistika. Jonathan Sarwono
 Pelatihan Statistika Jonathan Sarwono Model - Model Penelitian dalam Riset Lanjutan 1. Model Dasar Hubungan Antar Variabel 2. Model Dasa dalam Analisis Jalur 3. Model dalam Structural Equiation Modeling
Factor Analysis: An Introduction. What is Factor Analysis? 100+ years of Factor Analysis FACTOR ANALYSIS AN INTRODUCTION NILAM RAM
 NILAM RAM 2018 PSYCHOLOGY R BOOTCAMP PENNSYLVANIA STATE UNIVERSITY AUGUST 16, 2018 FACTOR ANALYSIS https://psu-psychology.github.io/r-bootcamp-2018/index.html WITH ADDITIONAL MATERIALS AT https://quantdev.ssri.psu.edu/tutorials
CHAPTER 9 EXAMPLES: MULTILEVEL MODELING WITH COMPLEX SURVEY DATA
 Examples: Multilevel Modeling With Complex Survey Data CHAPTER 9 EXAMPLES: MULTILEVEL MODELING WITH COMPLEX SURVEY DATA Complex survey data refers to data obtained by stratification, cluster sampling and/or
A simulation study to investigate the use of cutoff values for assessing model fit in covariance structure models
 Journal of Business Research 58 (2005) 935 943 A simulation study to investigate the use of cutoff values for assessing model fit in covariance structure models Subhash Sharma a, *, Soumen Mukherjee b,
Journal of Multivariate Analysis. Use of prior information in the consistent estimation of regression coefficients in measurement error models
 Journal of Multivariate Analysis 00 (2009) 498 520 Contents lists available at ScienceDirect Journal of Multivariate Analysis journal homepage: www.elsevier.com/locate/jmva Use of prior information in
DATE: 9/ L I S R E L 8.80
 98 LAMPIRAN 3 STRUCTURAL EQUATION MODEL ONE CONGINERIC Use of this program is subject to the terms specified in the Convention. Universal Copyright 9/2017 DATE: 9/ TIME: 20:22 Website: www.ssicentral.com
ADVANCED C. MEASUREMENT INVARIANCE SEM REX B KLINE CONCORDIA
 ADVANCED SEM C. MEASUREMENT INVARIANCE REX B KLINE CONCORDIA C C2 multiple model 2 data sets simultaneous C3 multiple 2 populations 2 occasions 2 methods C4 multiple unstandardized constrain to equal fit
Comparing standardized coefficients in structural equation modeling: a model reparameterization approach
 Behav Res (2011) 43:730 745 DOI 10.3758/s13428-011-0088-6 Comparing standardized coefficients in structural equation modeling: a model reparameterization approach Joyce L. Y. Kwan & Wai Chan Published
Path Diagrams. James H. Steiger. Department of Psychology and Human Development Vanderbilt University
 Path Diagrams James H. Steiger Department of Psychology and Human Development Vanderbilt University James H. Steiger (Vanderbilt University) Path Diagrams 1 / 24 Path Diagrams 1 Introduction 2 Path Diagram