Backtesting Marginal Expected Shortfall and Related Systemic Risk Measures
|
|
|
- Bryce Tate
- 5 years ago
- Views:
Transcription
1 Backtesting Marginal Expected Shortfall and Related Systemic Risk Measures Denisa Banulescu 1 Christophe Hurlin 1 Jérémy Leymarie 1 Olivier Scaillet 2 1 University of Orleans 2 University of Geneva & Swiss Finance Institute RiskLab/BoF/ESRB Conference on Systemic Risk Analytics Helsinki May 28, 2018
2 Systemic risk The recent financial crisis has fostered extensive research on systemic risk, either on its definition, measurement, or regulation (Bisias et al. 2012, Benoit et al. 2016). Bisias et al. (2012), A Survey of Systemic Risk Analytics, Annual Review of Financial Economics Benoit et al. (2016), Where the Risks Lie : A Survey on Systemic Risk, Review of Finance
3 In practice, measuring the systemic risk is challenging. 1 A recent approach relies on structural models that identify specific sources of systemic risk, such as contagion, bank runs, or liquidity crises. 2 The regulatory approach is based on proprietary data (cross-positions, size, leverage, liquidity, interconnectedness, etc...). Ex : FSB-BCBS methodology used to identify the G-SIB. 3 A third approach aims to derive global measures of systemic risk based on market data, such as stock or asset returns, option prices, or CDS spreads.
4 The most well-known market-based systemic risk measures are : 1 Marginal Expected Shortfall (MES) and the Systemic Expected Shortfall (SES) of Acharya et al. (2016, RFS), 2 The Systemic Risk Measure (SRISK) of Acharya et al. (2012, AER) and Brownlees and Engle (2017, RFS), 3 Delta Conditional Value-at-Risk ( CoVaR) of Adrian and Brunnermeier (2016, AER).
5 Example (EBA stress tests, October 26, 2014) According to stress tests (regulatory approach) : Twenty-four european banks fail EBA stress tests, All the French banks succeeded the tests.

6
7
8 Goal of the paper 1 Proposing a backtesting procedure for the MES, similar to that used for the VaR (Kupiec, 1995, Christoffersen, 1998, etc.). 2 Taking into account the estimation risk (Escanciano & Olmo, 2010, 2011, Gouriéroux & Zakoian, 2013) 3 Generalizing the backtesting procedure to the MES-based systemic risk measures (SES, SRISK) and to the CoVaR.
9 Notations Contents 1 Methodology Notations Cumulative joint violation process Backtesting MES in practice 2 Backtesting related systemic risk measures 3 Empirical application 4 Conclusion
10 Notations Notations : Y t = (Y 1t, Y 2t ) denotes a vector of stock returns for two assets at time t. Y 1t corresponds to the stock return of a financial institution, Whereas Y 2t corresponds to the market return. Ω t 1 is the information set available at time t 1. F Yt (.; Ω t 1 ) is the joint cdf of Y t given Ω t 1 y = (y 1, y 2 ) R 2 such that : F Yt (y; Ω t 1 ) Pr [Y 1t < y 1, Y 2t < y 2 Ω t 1 ]
11 Notations Definition (MES, Acharya et al. 2010) The MES of a financial firm is the short-run expected equity loss conditional on the market taking a loss greater than its VaR : MES 1t (α) = E [Y 1t Y 2t VaR 2t (α); Ω t 1 ] where VaR 2t (α) denotes the α-level VaR of Y 2t, such that Pr [Y 2t VaR 2t (α) Ω t 1 ] = α with α [0, 1]
12 Notations Definition (CoVaR) The (β, α)-level CoVaR for the firm 1, denoted CoVaR 1t (β, α) is defined as : CoVaR 1t (β, α) = F 1 Y 1t Y 2t VaR 2t (α) (β; Ω t 1) where CoVaR 1t (β, α) is such that : Pr[Y 1t < CoVaR 1t (β, α) Y 2t < VaR 2t (α); Ω t 1 ] = β
13 Notations Lemma (MES - CoVaR) Using definition of cond. probability and a change in variables yields to : MES 1t (α) = 1 0 CoVaR 1t (β, α)dβ The backtest of MES 1t (α) comes down to backtest CoVaR 1t (β, α) β [0, 1]
14 Notations Risk Model In general, the MES forecasts are issued from a parametric model specified by the researcher, the risk manager or the regulator (ex : multivariate GARCH model). θ 0 denotes an unknown model parameter set in Θ R p F Yt (.; Ω t 1, θ 0 ) denotes the joint cdf of Y t, F Y2t (.; Ω t 1, θ 0 ) denotes the marginal cdf of Y 2t F Y1t Y 2t VaR 2t (α,θ 0 )(.; Ω t 1, θ 0 ) denotes the cdf of the truncated distribution of Y 1t given Y 2t VaR 2t (α, θ 0 ).
15 Cumulative joint violation process Contents 1 Methodology Notations Cumulative joint violation process Backtesting MES in practice 2 Backtesting related systemic risk measures 3 Empirical application 4 Conclusion
16 Cumulative joint violation process Cumulative joint violation process In order to backtest the MES, we need to introduce a new violation concept which we call cumulative joint violation process This cumulative joint violation process can be viewed as a violation concept based on the MES definition. Du Z. & Escanciano J.C. (2016), Backtesting expected shortfall : Accounting for tail risk, Management Science
17 Cumulative joint violation process Definition (joint violation process) The joint violation process of the (β, α)-covar of Y 1t and the α-var of Y 2t is defined as : h t (β, α, θ 0 ) = 1(Y 1t CoVaR 1t (β, α, θ 0 )) 1(Y 2t VaR 2t (α, θ 0 ))
18 Cumulative joint violation process Joint violation s illustration 5 0 Y 1t CoVaR 1t (,,-) Y 2t VaR 2t (,) h t (,,-)
19 Cumulative joint violation process Lemma (statistical properties of h t (β, α, θ 0 )) If the CoVaR 1t (β, α, θ 0 ) forecasts are correct, the joint violation h t (β, α, θ 0 ) checks h t (β, α, θ 0 ) i.i.d. Bern(αβ) t, (α, β) [0, 1] 2
20 Cumulative joint violation process Reminder : MES 1t (α) = 1 0 CoVaR 1t(β, α, θ 0 )dβ Definition (cumulative joint violation process) The cumulative joint violation process is defined as the integral of the joint violation process h t (β, α, θ 0 ) for all the risk levels β between 0 and 1 H t (α, θ 0 ) = 1 0 h t (β, α, θ 0 )dβ
21 Cumulative joint violation process Lemma (statistical properties of H t (α)) If the MES 1t (α) forecasts are correct, the cumulative joint violation H t (α, θ 0 ) satisfies this implication : E [ H t (α, θ 0 ) α/2 Ω t 1 ] = 0 i.e. centered joint cumulative violations are a mds for each α [0, 1]
22 Backtesting MES in practice Contents 1 Methodology Notations Cumulative joint violation process Backtesting MES in practice 2 Backtesting related systemic risk measures 3 Empirical application 4 Conclusion
23 Backtesting MES in practice Backtesting MES in practice Exploiting the mds property of the cumulative joint violation process E [ H t (α, θ 0 ) α/2 Ω t 1 ] = 0 We propose two backtests for the MES. These tests are similar to those generally used by the regulator or the risk manager for VaR backtesting (Kupiec 1995, Christoffersen 1998, etc.).
24 Backtesting MES in practice Backtesting MES 1 The Unconditional Coverage (hereafter UC) test corresponds to the null hypothesis H 0,UC : E (H t (α, θ 0 )) = α/2. 2 The null of the Independence test (IND) is defined as H 0,IND : ρ 1 =... = ρ K = 0. ρ k = corr (H t (α, θ 0 ) α/2, H t k (α, θ 0 ) α/2)
25 Backtesting MES in practice Estimation These two tests imply to estimate the parameters θ 0 Θ. Denote by θ T a consistent estimator of θ 0. The backtesting tests are based on the out-of-sample forecasts of the cumulative violation process given by : H t (α, θ ( ) ( ) T ) = 1 u 12t ( θ T ) 1 u 2t ( θ T ) α t = T +1,..., T +N.
26 Backtesting MES in practice Definition (UC test statistic) The test statistic for UC, denoted UC MES, is defined as ( N H(α, θ T ) α/2) UC MES =, α (1/3 α/4) with H(α, θ T ) the out-of-sample mean of H t (α, θ T ) H(α, θ T ) = 1 N T +N t=t +1 H t (α, θ T ).
27 Backtesting MES in practice Estimation risk 1 Without estimation risk and when N, we have ( N H(α, θ0 ) α/2) UC MES (α, θ 0 ) = α (1/3 α/4) d N (0, 1) 2 A similar result holds for the feasible statistic UC MES UC MES (α, θ T ) when T and N, whereas λ = N/T 0, i.e. when there is no estimation risk.
28 Backtesting MES in practice Corollary (UC robust test statistic) When T, N and N/T λ with 0 < λ < N ( H(α, θ T ) α/2) UCMES c = (α (1/3 α/4) + λ R MES Σ R ) 1/2 0 MES d N (0, 1) with R MES a consistent estimator of R MES given by R MES = 1 N T +N t=t +1 H t (α, θ) θ θt
29 Backtesting MES in practice Definition (IND test statistic) The independance test for H 0,IND is based on the well known Box-Pierce test statistic defined as γ j = 1 N j T +N t=t +1 k IND MES = N ˆρ 2 j, j=1 ˆρ j = γ j γ 0, ( H t (α, θ ) ( T ) α/2 H t j (α, θ ) T ) α/2.
30 Contents 1 Methodology Notations Cumulative joint violation process Backtesting MES in practice 2 Backtesting related systemic risk measures 3 Empirical application 4 Conclusion
31 Backtesting related systemic risk Measures Other systemic risk measures can be backtested according to our methodology : 1 CoVaR (Adrian & Brunnermeier 2016), 2 SES (Acharya et al. 2010), 3 SRISK (Acharya et al. 2012, and Brownlees & Engle 2015).
32 Backtesting related systemic risk Measures Other systemic risk measures can be backtested according to our methodology : 1 CoVaR (Adrian & Brunnermeier 2016), 2 SES (Acharya et al. 2010), 3 SRISK (Acharya et al. 2012, and Brownlees & Engle 2015).
33 Definition (SRISK) The SRISK 1t corresponds to the expected capital shortfall of a given financial institution 1 at time t, conditional on a severe decline of the financial market Y 2t such as : SRISK 1t = E t 1 [ CS 1t Y 2t C ]
34 Fact (Link MES-SRISK) We can identify a (deterministic) direct link between MES and SRISK such that : with : MES 1t (α) = E [ Y 1t Y 2t VaR 2t (α) ; Ω t 1 ] SRISK 1t (α) = E [ g t (Y 1t, X t 1 ) Y 2t VaR 2t (α) ; Ω t 1 ] g t (.) a decreasing monotonous function (with respect to Y 1t ), X t 1 a set of variables that belong to Ω t 1.
35 MES 1t (α) = E [ Y 1t Y 2t VaR 2t (α) ; Ω t 1 ] SRISK 1t (α) = E [ g t (Y 1t, X t 1 ) Y 2t VaR 2t (α) ; Ω t 1 ] Theorem (Equivalence SRISK and MES tests) Since g t (.) is a monotonous and deterministic function given Ω t 1, the test statistic has the same form for SRISK and MES such that : UC MES = UC SRISK H0 N(0, 1) Same finding for the SES, test slightly different for the CoVaR
36 Contents 1 Methodology Notations Cumulative joint violation process Backtesting MES in practice 2 Backtesting related systemic risk measures 3 Empirical application 4 Conclusion
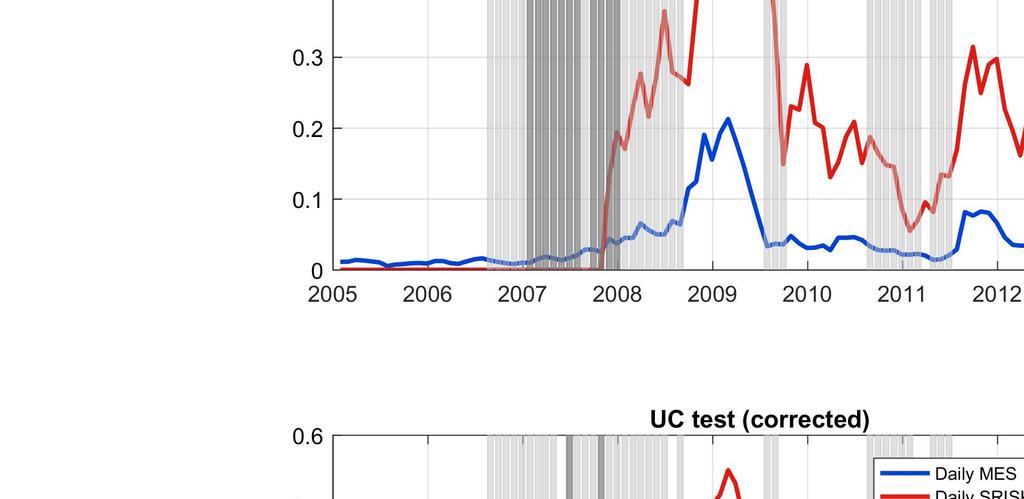
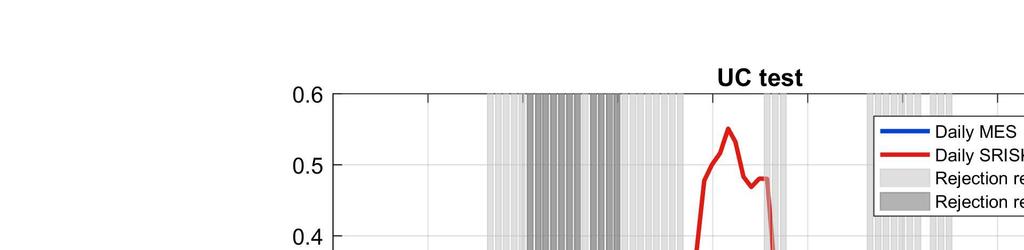
37 Empirical application We test validity of daily SRISK, SES, and MES using our UC and IND test, We consider the same benchmark as in C. Brownlees. & R. Engle (2016), SRISK : A Conditionnal Capital Shortfall Measure Of Systemic Risk, RFS Consequently, we use : 1 the same panel of large US financial firms (i.e. 95 firms), 2 data from January 3, 2000 to December 31, 2015 (extented sample), 3 GJR DCC(1, 1) specification to forecast systemic risk measures.

38 Figure Citigroup (recursive estimation scheme, N=250)
39 Contents 1 Methodology Notations Cumulative joint violation process Backtesting MES in practice 2 Backtesting related systemic risk measures 3 Empirical application 4 Conclusion
40 Conclusion 1 We propose a methodology to validate SRISK, MES, SES and CoVaR systemic risk measures forecasts, 2 Similar to traditional VaR backtesting tests, our procedure is based on the UC and IND hypothesis. These tests can be adapted in order to be robust to the presence of estimation risk, 3 Finally, we apply our methodology on real data to study how models currently used manage to provide valid SRISK, MES, SES and CoVaR forecasts.
41 Conclusion 1 We propose a methodology to validate SRISK, MES, SES and CoVaR systemic risk measures forecasts, 2 Similar to traditional VaR backtesting tests, our procedure is based on the UC and IND hypothesis. These tests can be adapted in order to be robust to the presence of estimation risk, 3 Finally, we apply our methodology on real data to study how models currently used manage to provide valid SRISK, MES, SES and CoVaR forecasts. Thank you!
42 Lemma (statistical properties of H t (α)) If the MES 1t (α) forecasts are correct, we have : 1 E [ H t (α, θ 0 ) Ω t 1 ] = α/2, V [ H t (α, θ 0 ) Ω t 1 ] = α (1/3 α/4). 2 One implication of these is : E [ H t (α, θ 0 ) α/2 Ω t 1 ] = 0 i.e. centered joint cumulative violations are a mds for each α [0, 1]
43 Definition (Feasible H t (α, θ 0 )) The process H t (α, θ 0 ) can be expressed as a function of the «generalized errors» u 2t and u 12t, such as H t (α, θ 0 ) = (1 u 12t (θ 0 )) 1(u 2t (θ 0 ) α). With : u 2t (θ 0 ) = F Y2t (Y 2t ; Ω t 1, θ 0 ), u 12t (θ 0 ) = 1 α F Y t (Ỹt ; Ω t 1, θ 0 ), and where the vector Ỹt is defined as Ỹt = (Y 1t, VaR 2t (α, θ 0 )).
44 Theorem (UC test statistic with estimation risk) Under assumptions A1-A4, when T, N and N/T λ with 0 < λ < ) d UC MES N (0, σλ 2, where the asymptotic variance σ 2 λ is σ 2 λ = 1 + λ R MES Σ 0R MES α (1/3 α/4), where R MES = E 0 ( H t (α, θ 0 ) / θ) and V as (ˆθ T ) = Σ 0 /T.
45 Estimation risk 1 Without estimation risk and when N, we have k IND MES (α, θ 0 ) = N ρ 2 j j=1 d χ 2 (k) 2 A similar result holds for the feasible statistic IND MES IND MES (α, θ T ) when T and N, whereas λ = N/T 0, i.e. when there is no estimation risk.
46 Corollary (robust IND test statistic) The feasible robust IND backtest statistic satisfies IND c MES = N ρ (k) 1 ρ (k) d χ 2 (k) where is a consistent estimator for, such that 1 1 R j = α (1/3 α/4) N j ij = δ ij + λ R i Σ 0 Rj, T +N t=t +j+1 ( H t j (α, θ ) Ht (α, T ) α/2 θ T ). θ θt
47 Theorem (IND test statistic with estimation risk) When T, N and N/T λ with 0 < λ < IND MES d k j=1 π j Z 2 j, where {π j } k j=1 are the eigenvalues of the matrix with the ij-th element given by ij = δ ij + λr i Σ 0 R j, ( 1 R j = α (1/3 α/4) E 0 (H t j (α, θ 0 ) α/2) H ) t(α, θ 0 ), θ δ ij is a dummy variable that takes a value 1 if i = j and 0 otherwise, {Z j } m j=1 are independent standard normal variables.
48 UC MES ( θt ) UCMES C ( θt ) IND MES ( θt ) INDMES C ( θt ) T=250, N=250, Size and Power H H1 A σ1 2 = 25% σ1 2 = 50% σ1 2 = 75% H1 B σ2 2 = 25% σ2 2 = 50% σ2 2 = 75% H1 C ρ H1 = 20% H1 C ρ H1 = 60%
49 UC MES ( θt ) UCMES C ( θt ) IND MES ( θt ) INDMES C ( θt ) T=250, N=2500, Size and Power H H1 A σ1 2 = 25% σ1 2 = 50% σ1 2 = 75% H1 B σ2 2 = 25% σ2 2 = 50% σ2 2 = 75% H1 C ρ H1 = 20% H1 C ρ H1 = 60%
50 Definition (capital shortfall) Denote CS 1t, the capital shortfall of the firm 1 at time t such as : CS 1t = regulatory equity firm s equity = k (L 1t + W 1t ) W 1t where : k is the prudential ratio L 1t is the amount of firm 1 s liabilities W 1t is the firm 1 s market capitalization
51 Definition (SRISK) The SRISK 1t corresponds to the expected capital shortfall of a given financial institution 1 at time t, conditional on a severe decline of the financial market Y 2t such as : SRISK 1t = E t 1 [ CS 1t Y 2t C ]
52 Assumption E t 1 [L 1t Y 2t C] = L 1t 1 (i.e in the case of a systemic event debt cannot be renegotiated) Definition (SRISK - MES) Under this assumption, Acharya et al. (2012) and Brownlees & Engle (2015) show that SRISK 1t = k L 1t 1 (1 k)w 1t 1 MES 1t (C)
53 1 UC test Rejection rate for all firms(recursive estimation scheme, N = 250) (Bonferroni multiple testing correction) 1 IND test with lag = 5 Rejection rate at 0.05 level Rejection rate at 0.05 level UC test (corrected) 1 IND test with lag = 5 (corrected) Rejection rate at 0.05 level Rejection rate at 0.05 level
Backtesting Marginal Expected Shortfall and Related Systemic Risk Measures
 and Related Systemic Risk Measures Denisa Banulescu, Christophe Hurlin, Jérémy Leymarie, Olivier Scaillet, ACPR Chair "Regulation and Systemic Risk" - March 24, 2016 Systemic risk The recent nancial crisis
Backtesting Marginal Expected Shortfall and Related Systemic Risk Measures
 Backtesting Marginal Expected Shortfall and Related Systemic Risk Measures Denisa Banulescu, Christophe Hurlin, Jérémy Leymarie, Olivier Scaillet February 13, 2016 Preliminary version - Please do not cite
Where the Risks Lie: A Survey on Systemic Risk
 S. Benoit a, J.-E. Colliard b, C. Hurlin c, C. Pérignon b a Université Paris-Dauphine b HEC Paris c Université d Orléans Conference: Risks, Extremes & Contagion Motivation Microprudential Regulation vs.
Robust Backtesting Tests for Value-at-Risk Models
 Robust Backtesting Tests for Value-at-Risk Models Jose Olmo City University London (joint work with Juan Carlos Escanciano, Indiana University) Far East and South Asia Meeting of the Econometric Society
Backtesting Value-at-Risk: From Dynamic Quantile to Dynamic Binary Tests
 Backtesting Value-at-Risk: From Dynamic Quantile to Dynamic Binary Tests Elena-Ivona Dumitrescu, Christophe Hurlin, Vinson Pham To cite this version: Elena-Ivona Dumitrescu, Christophe Hurlin, Vinson Pham.
SPECIFICATION TESTS IN PARAMETRIC VALUE-AT-RISK MODELS
 SPECIFICATION TESTS IN PARAMETRIC VALUE-AT-RISK MODELS J. Carlos Escanciano Indiana University, Bloomington, IN, USA Jose Olmo City University, London, UK Abstract One of the implications of the creation
Backtesting value-at-risk accuracy: a simple new test
 First proof Typesetter: RH 7 December 2006 Backtesting value-at-risk accuracy: a simple new test Christophe Hurlin LEO, University of Orléans, Rue de Blois, BP 6739, 45067 Orléans Cedex 2, France Sessi
Risk and Uncertainty
 Risk and Uncertainty Rogier Quaedvlieg Maastricht University School of Business and Economics Maastricht, Netherlands A thesis submitted for the degree of Doctor of Philosophy at Maastricht University
Dependence and VaR Estimation:An Empirical Study of Chinese Stock Markets using Copula. Baoliang Li WISE, XMU Sep. 2009
 Dependence and VaR Estimation:An Empirical Study of Chinese Stock Markets using Copula Baoliang Li WISE, XMU Sep. 2009 Outline Question: Dependence between Assets Correlation and Dependence Copula:Basics
The Analysis of Power for Some Chosen VaR Backtesting Procedures - Simulation Approach
 The Analysis of Power for Some Chosen VaR Backtesting Procedures - Simulation Approach Krzysztof Piontek Department of Financial Investments and Risk Management Wroclaw University of Economics ul. Komandorska
SFB 823. A simple and focused backtest of value at risk. Discussion Paper. Walter Krämer, Dominik Wied
 SFB 823 A simple and focused backtest of value at risk Discussion Paper Walter Krämer, Dominik Wied Nr. 17/2015 A simple and focused backtest of value at risk 1 by Walter Krämer and Dominik Wied Fakultät
Pitfalls in Backtesting Historical Simulation VaR Models
 CAEPR Working Paper #202-003 Pitfalls in Backtesting Historical Simulation VaR Models Juan Carlos Escanciano Indiana University Pei Pei Indiana University and Chinese Academy of Finance and Development,
Appendix of the paper: Are interest rate options important for the assessment of interest rate risk?
 Appendix of the paper: Are interest rate options important for the assessment of interest rate risk? Caio Almeida,a, José Vicente b a Graduate School of Economics, Getulio Vargas Foundation b Research
Lesson 8: Testing for IID Hypothesis with the correlogram
 Lesson 8: Testing for IID Hypothesis with the correlogram Dipartimento di Ingegneria e Scienze dell Informazione e Matematica Università dell Aquila, umberto.triacca@ec.univaq.it Testing for i.i.d. Hypothesis
Elicitability and backtesting
 Elicitability and backtesting Johanna F. Ziegel University of Bern joint work with Natalia Nolde, UBC 17 November 2017 Research Seminar at the Institute for Statistics and Mathematics, WU Vienna 1 / 32
ROBUST BACKTESTING TESTS FOR VALUE-AT-RISK MODELS
 ROBUST BACKTESTING TESTS FOR VALUE-AT-RISK MODELS J. Carlos Escanciano Indiana University, Bloomington, IN, USA Jose Olmo City University, London, UK November 2008 Abstract Backtesting methods are statistical
NCoVaR Granger Causality
 NCoVaR Granger Causality Cees Diks 1 Marcin Wolski 2 1 Universiteit van Amsterdam 2 European Investment Bank Bank of Italy Rome, 26 January 2018 The opinions expressed herein are those of the authors and
Solutions of the Financial Risk Management Examination
 Solutions of the Financial Risk Management Examination Thierry Roncalli January 9 th 03 Remark The first five questions are corrected in TR-GDR and in the document of exercise solutions, which is available
Asymptotic behaviour of multivariate default probabilities and default correlations under stress
 Asymptotic behaviour of multivariate default probabilities and default correlations under stress 7th General AMaMeF and Swissquote Conference EPFL, Lausanne Natalie Packham joint with Michael Kalkbrener
Evaluating Value-at-Risk models via Quantile Regression
 Evaluating Value-at-Risk models via Quantile Regression Luiz Renato Lima (University of Tennessee, Knoxville) Wagner Gaglianone, Oliver Linton, Daniel Smith. NASM-2009 05/31/2009 Motivation Recent nancial
CONTAGION VERSUS FLIGHT TO QUALITY IN FINANCIAL MARKETS
 EVA IV, CONTAGION VERSUS FLIGHT TO QUALITY IN FINANCIAL MARKETS Jose Olmo Department of Economics City University, London (joint work with Jesús Gonzalo, Universidad Carlos III de Madrid) 4th Conference
The Instability of Correlations: Measurement and the Implications for Market Risk
 The Instability of Correlations: Measurement and the Implications for Market Risk Prof. Massimo Guidolin 20254 Advanced Quantitative Methods for Asset Pricing and Structuring Winter/Spring 2018 Threshold
On Backtesting Risk Measurement Models
 On Backtesting Risk Measurement Models Hideatsu Tsukahara Department of Economics, Seijo University e-mail address: tsukahar@seijo.ac.jp 1 Introduction In general, the purpose of backtesting is twofold:
Introduction to Algorithmic Trading Strategies Lecture 10
 Introduction to Algorithmic Trading Strategies Lecture 10 Risk Management Haksun Li haksun.li@numericalmethod.com www.numericalmethod.com Outline Value at Risk (VaR) Extreme Value Theory (EVT) References
Probabilities & Statistics Revision
 Probabilities & Statistics Revision Christopher Ting Christopher Ting http://www.mysmu.edu/faculty/christophert/ : christopherting@smu.edu.sg : 6828 0364 : LKCSB 5036 January 6, 2017 Christopher Ting QF
Arma-Arch Modeling Of The Returns Of First Bank Of Nigeria
 Arma-Arch Modeling Of The Returns Of First Bank Of Nigeria Emmanuel Alphonsus Akpan Imoh Udo Moffat Department of Mathematics and Statistics University of Uyo, Nigeria Ntiedo Bassey Ekpo Department of
Determining and Forecasting High-Frequency Value-at-Risk by Using Lévy Processes
 Determining and Forecasting High-Frequency Value-at-Risk by Using Lévy Processes W ei Sun 1, Svetlozar Rachev 1,2, F rank J. F abozzi 3 1 Institute of Statistics and Mathematical Economics, University
A Non-Parametric Approach of Heteroskedasticity Robust Estimation of Vector-Autoregressive (VAR) Models
 Models") Journal of Finance and Investment Analysis, vol.1, no.1, 2012, 55-67 ISSN: 2241-0988 (print version), 2241-0996 (online) International Scientific Press, 2012 A Non-Parametric Approach of Heteroskedasticity
Journal of Finance and Investment Analysis, vol.1, no.1, 2012, 55-67 ISSN: 2241-0988 (print version), 2241-0996 (online) International Scientific Press, 2012 A Non-Parametric Approach of Heteroskedasticity
Measuring interconnectedness between financial institutions with Bayesian time-varying vector autoregressions
 Introduction Previous Studies Empirical methodology Empirical analysis Conclusion References Appendix Measuring interconnectedness between financial institutions with Bayesian time-varying vector autoregressions
PITFALLS IN BACKTESTING HISTORICAL SIMULATION MODELS
 PITFALLS IN BACKTESTING HISTORICAL SIMULATION MODELS Juan Carlos Escanciano Indiana University Pei, Pei Indiana University February 14, 2011 Abstract Historical Simulation (HS) and its variant, the Filtered
Liquidity Preference hypothesis (LPH) implies ex ante return on government securities is a monotonically increasing function of time to maturity.
 implies ex ante return on government securities is a monotonically increasing function of time to maturity.") INTRODUCTION Liquidity Preference hypothesis (LPH) implies ex ante return on government securities is a monotonically increasing function of time to maturity. Underlying intuition is that longer term bonds
INTRODUCTION Liquidity Preference hypothesis (LPH) implies ex ante return on government securities is a monotonically increasing function of time to maturity. Underlying intuition is that longer term bonds
Volatility. Gerald P. Dwyer. February Clemson University
 Volatility Gerald P. Dwyer Clemson University February 2016 Outline 1 Volatility Characteristics of Time Series Heteroskedasticity Simpler Estimation Strategies Exponentially Weighted Moving Average Use
Expected Shortfall is not elicitable so what?
 Expected Shortfall is not elicitable so what? Dirk Tasche Bank of England Prudential Regulation Authority 1 dirk.tasche@gmx.net Modern Risk Management of Insurance Firms Hannover, January 23, 2014 1 The
Nonlinear Bivariate Comovements of Asset Prices: Theory and Tests
 Nonlinear Bivariate Comovements of Asset Prices: Theory and Tests M. Corazza, A.G. Malliaris, E. Scalco Department of Applied Mathematics University Ca Foscari of Venice (Italy) Department of Economics
Market Risk. MFM Practitioner Module: Quantitiative Risk Management. John Dodson. February 8, Market Risk. John Dodson.
 MFM Practitioner Module: Quantitiative Risk Management February 8, 2017 This week s material ties together our discussion going back to the beginning of the fall term about risk measures based on the (single-period)
A DARE for VaR. Keywords : Expected Shortfall, Value-at-Risk, Expectile, Risk Measures, Backtests.
 A DARE for VaR Benjamin Hamidi, Christophe Hurlin, Patrick Kouontchou and Bertrand Maillet March 2015 Abstract This paper introduces a new class of models for the Value-at-Risk (VaR) and Expected Shortfall
Econ 423 Lecture Notes: Additional Topics in Time Series 1
 Econ 423 Lecture Notes: Additional Topics in Time Series 1 John C. Chao April 25, 2017 1 These notes are based in large part on Chapter 16 of Stock and Watson (2011). They are for instructional purposes
Introduction to Algorithmic Trading Strategies Lecture 3
 Introduction to Algorithmic Trading Strategies Lecture 3 Pairs Trading by Cointegration Haksun Li haksun.li@numericalmethod.com www.numericalmethod.com Outline Distance method Cointegration Stationarity
Financial Econometrics Lecture 6: Testing the CAPM model
 Financial Econometrics Lecture 6: Testing the CAPM model Richard G. Pierse 1 Introduction The capital asset pricing model has some strong implications which are testable. The restrictions that can be tested
GARCH Models. Eduardo Rossi University of Pavia. December Rossi GARCH Financial Econometrics / 50
 GARCH Models Eduardo Rossi University of Pavia December 013 Rossi GARCH Financial Econometrics - 013 1 / 50 Outline 1 Stylized Facts ARCH model: definition 3 GARCH model 4 EGARCH 5 Asymmetric Models 6
A Semi-Parametric Measure for Systemic Risk
 Natalia Sirotko-Sibirskaya Ladislaus von Bortkiewicz Chair of Statistics C.A.S.E. - Center for Applied Statistics and Economics Humboldt Universität zu Berlin http://lvb.wiwi.hu-berlin.de http://www.case.hu-berlin.de
Control and Out-of-Sample Validation of Dependent Risks
 Control and Out-of-Sample Validation of Dependent Risks Christian, Gourieroux and Wei, Liu May 25, 2007 Abstract The aim of this paper is to propose a methodology for validating the reserve levels proposed
Backtesting VaR Accuracy: A New Simple Test
 Backtesting VaR Accuracy: A New Simple Test Christophe Hurlin, Sessi Tokpavi To cite this version: Christophe Hurlin, Sessi Tokpavi. Backtesting VaR Accuracy: A New Simple Test. 2006.
Combined Lagrange Multipier Test for ARCH in Vector Autoregressive Models
 MEDDELANDEN FRÅN SVENSKA HANDELSHÖGSKOLAN HANKEN SCHOOL OF ECONOMICS WORKING PAPERS 563 Paul Catani and Niklas Ahlgren Combined Lagrange Multipier Test for ARCH in Vector Autoregressive Models 2016 Combined
Lecture 8: Multivariate GARCH and Conditional Correlation Models
 Lecture 8: Multivariate GARCH and Conditional Correlation Models Prof. Massimo Guidolin 20192 Financial Econometrics Winter/Spring 2018 Overview Three issues in multivariate modelling of CH covariances
A New Independence Test for VaR violations
 A New Independence Test for VaR violations P. Araújo Santos and M.I. Fraga Alves Abstract Interval forecasts evaluation can be reduced to examining the unconditional coverage and independence properties
Gaussian kernel GARCH models
 Gaussian kernel GARCH models Xibin (Bill) Zhang and Maxwell L. King Department of Econometrics and Business Statistics Faculty of Business and Economics 7 June 2013 Motivation A regression model is often
Asymptotic distribution of the sample average value-at-risk
 Asymptotic distribution of the sample average value-at-risk Stoyan V. Stoyanov Svetlozar T. Rachev September 3, 7 Abstract In this paper, we prove a result for the asymptotic distribution of the sample
MFE Financial Econometrics 2018 Final Exam Model Solutions
 MFE Financial Econometrics 2018 Final Exam Model Solutions Tuesday 12 th March, 2019 1. If (X, ε) N (0, I 2 ) what is the distribution of Y = µ + β X + ε? Y N ( µ, β 2 + 1 ) 2. What is the Cramer-Rao lower
Bayesian tail risk interdependence using quantile regression
 Bayesian tail risk interdependence using quantile regression M. Bernardi, G. Gayraud and L. Petrella Sapienza University of Rome Université de Technologie de Compiègne and CREST, France Fourth International
Intro VEC and BEKK Example Factor Models Cond Var and Cor Application Ref 4. MGARCH
 ntro VEC and BEKK Example Factor Models Cond Var and Cor Application Ref 4. MGARCH JEM 140: Quantitative Multivariate Finance ES, Charles University, Prague Summer 2018 JEM 140 () 4. MGARCH Summer 2018
The Slow Convergence of OLS Estimators of α, β and Portfolio. β and Portfolio Weights under Long Memory Stochastic Volatility
 The Slow Convergence of OLS Estimators of α, β and Portfolio Weights under Long Memory Stochastic Volatility New York University Stern School of Business June 21, 2018 Introduction Bivariate long memory
Regression Based Expected Shortfall Backtesting
 Regression Based Expected Shortfall Backtesting Sebastian Bayer and Timo Dimitriadis University of Konstanz, Department of Economics, 78457 Konstanz, Germany This Version: January 15, 2018 Abstract arxiv:1804112v1
SPRING 2007 EXAM C SOLUTIONS
 SPRING 007 EXAM C SOLUTIONS Question #1 The data are already shifted (have had the policy limit and the deductible of 50 applied). The two 350 payments are censored. Thus the likelihood function is L =
Evaluating Forecast Models with an Exact Independence Test
 Evaluating Forecast Models with an Exact Independence Test P. Araújo Santos M.I. Fraga Alves Instituto Politécnico de Santarém and CEAUL Universidade de Lisboa and CEAUL paulo.santos@esg.ipsantarem.pt
Multivariate Asset Return Prediction with Mixture Models
 Multivariate Asset Return Prediction with Mixture Models Swiss Banking Institute, University of Zürich Introduction The leptokurtic nature of asset returns has spawned an enormous amount of research into
Expected Shortfall is not elicitable so what?
 Expected Shortfall is not elicitable so what? Dirk Tasche Bank of England Prudential Regulation Authority 1 dirk.tasche@gmx.net Finance & Stochastics seminar Imperial College, November 20, 2013 1 The opinions
Connecting the dots: Econometric methods for uncovering networks with an application to the Australian financial institutions
 Connecting the dots: Econometric methods for uncovering networks with an application to the Australian financial institutions Mikhail Anufriev a b a Economics, University of Technology, Sydney b Business
Multivariate Stress Testing for Solvency
 Multivariate Stress Testing for Solvency Alexander J. McNeil 1 1 Heriot-Watt University Edinburgh Vienna April 2012 a.j.mcneil@hw.ac.uk AJM Stress Testing 1 / 50 Regulation General Definition of Stress
Time Series Models for Measuring Market Risk
 Time Series Models for Measuring Market Risk José Miguel Hernández Lobato Universidad Autónoma de Madrid, Computer Science Department June 28, 2007 1/ 32 Outline 1 Introduction 2 Competitive and collaborative
Measuring interconnectedness between financial institutions with Bayesian time-varying VARs
 Measuring interconnectedness between financial institutions with Bayesian time-varying VARs Financial Risk & Network Theory Marco Valerio Geraci 1,2 Jean-Yves Gnabo 2 1 ECARES, Université libre de Bruxelles
Empirical properties of large covariance matrices in finance
 Empirical properties of large covariance matrices in finance Ex: RiskMetrics Group, Geneva Since 2010: Swissquote, Gland December 2009 Covariance and large random matrices Many problems in finance require
Financial Econometrics
 Financial Econometrics Estimation and Inference Gerald P. Dwyer Trinity College, Dublin January 2013 Who am I? Visiting Professor and BB&T Scholar at Clemson University Federal Reserve Bank of Atlanta
ESTIMATION RISK EFFECTS ON BACKTESTING FOR PARAMETRIC VALUE-AT-RISK MODELS
 ESTIMATION RISK EFFECTS ON BACKTESTING FOR PARAMETRIC VALUE-AT-RISK MODELS J. Carlos Escanciano Indiana University, Bloomington, IN, USA Jose Olmo City University, London, UK This draft, March 2007 Abstract
SYSM 6303: Quantitative Introduction to Risk and Uncertainty in Business Lecture 4: Fitting Data to Distributions
 SYSM 6303: Quantitative Introduction to Risk and Uncertainty in Business Lecture 4: Fitting Data to Distributions M. Vidyasagar Cecil & Ida Green Chair The University of Texas at Dallas Email: M.Vidyasagar@utdallas.edu
Efficient estimation of a semiparametric dynamic copula model
 Efficient estimation of a semiparametric dynamic copula model Christian Hafner Olga Reznikova Institute of Statistics Université catholique de Louvain Louvain-la-Neuve, Blgium 30 January 2009 Young Researchers
Evaluating Interval Forecasts
 Evaluating Interval Forecasts By Peter F. Christoffersen 1 A complete theory for evaluating interval forecasts has not been worked out to date. Most of the literature implicitly assumes homoskedastic errors
Multivariate Stress Scenarios and Solvency
 Multivariate Stress Scenarios and Solvency Alexander J. McNeil 1 1 Heriot-Watt University Edinburgh Croatian Quants Day Zagreb 11th May 2012 a.j.mcneil@hw.ac.uk AJM Stress Testing 1 / 51 Regulation General
Tasmanian School of Business & Economics Economics & Finance Seminar Series 1 February 2016
 P A R X (PARX), US A A G C D K A R Gruppo Bancario Credito Valtellinese, University of Bologna, University College London and University of Copenhagen Tasmanian School of Business & Economics Economics
Rearrangement Algorithm and Maximum Entropy
 University of Illinois at Chicago Joint with Carole Bernard Vrije Universiteit Brussel and Steven Vanduffel Vrije Universiteit Brussel R/Finance, May 19-20, 2017 Introduction An important problem in Finance:
Solution of the Financial Risk Management Examination
 Solution of the Financial Risk Management Examination Thierry Roncalli January 8 th 014 Remark 1 The first five questions are corrected in TR-GDR 1 and in the document of exercise solutions, which is available
ECON3327: Financial Econometrics, Spring 2016
 ECON3327: Financial Econometrics, Spring 2016 Wooldridge, Introductory Econometrics (5th ed, 2012) Chapter 11: OLS with time series data Stationary and weakly dependent time series The notion of a stationary
Quantile Impulse Response Functions
 Quantile Impulse Response Functions Sulkhan Chavleishvili DG - Research, European Central Bank and Simone Manganelli DG - Research, European Central Bank Preliminary Draft Abstract This article develops
Stock index returns density prediction using GARCH models: Frequentist or Bayesian estimation?
 MPRA Munich Personal RePEc Archive Stock index returns density prediction using GARCH models: Frequentist or Bayesian estimation? Ardia, David; Lennart, Hoogerheide and Nienke, Corré aeris CAPITAL AG,
Heteroskedasticity in Time Series
 Heteroskedasticity in Time Series Figure: Time Series of Daily NYSE Returns. 206 / 285 Key Fact 1: Stock Returns are Approximately Serially Uncorrelated Figure: Correlogram of Daily Stock Market Returns.
Value-at-Risk for Greek Stocks
 1 Value-at-Risk for Greek Stocks Timotheos Angelidis University of Peloponnese, Greece Alexandros Benos National Bank of Greece, Greece This paper analyses the application of several volatility models
Assessing financial model risk
 Assessing financial model risk and an application to electricity prices Giacomo Scandolo University of Florence giacomo.scandolo@unifi.it joint works with Pauline Barrieu (LSE) and Angelica Gianfreda (LBS)
Quality control of risk measures: backtesting VAR models
 De la Pena Q 9/2/06 :57 pm Page 39 Journal o Risk (39 54 Volume 9/Number 2, Winter 2006/07 Quality control o risk measures: backtesting VAR models Victor H. de la Pena* Department o Statistics, Columbia
Lecture 12 Robust Estimation
 Lecture 12 Robust Estimation Prof. Dr. Svetlozar Rachev Institute for Statistics and Mathematical Economics University of Karlsruhe Financial Econometrics, Summer Semester 2007 Copyright These lecture-notes
Exercises Chapter 4 Statistical Hypothesis Testing
 Exercises Chapter 4 Statistical Hypothesis Testing Advanced Econometrics - HEC Lausanne Christophe Hurlin University of Orléans December 5, 013 Christophe Hurlin (University of Orléans) Advanced Econometrics
Applications of Random Matrix Theory to Economics, Finance and Political Science
 Outline Applications of Random Matrix Theory to Economics, Finance and Political Science Matthew C. 1 1 Department of Economics, MIT Institute for Quantitative Social Science, Harvard University SEA 06
Bootstrap tests of multiple inequality restrictions on variance ratios
 Economics Letters 91 (2006) 343 348 www.elsevier.com/locate/econbase Bootstrap tests of multiple inequality restrictions on variance ratios Jeff Fleming a, Chris Kirby b, *, Barbara Ostdiek a a Jones Graduate
CHICAGO: A Fast and Accurate Method for Portfolio Risk Calculation
 CHICAGO: A Fast and Accurate Method for Portfolio Risk Calculation University of Zürich April 28 Motivation Aim: Forecast the Value at Risk of a portfolio of d assets, i.e., the quantiles of R t = b r
DEPARTMENT OF ECONOMICS
 ISSN 0819-2642 ISBN 0 7340 2601 3 THE UNIVERSITY OF MELBOURNE DEPARTMENT OF ECONOMICS RESEARCH PAPER NUMBER 945 AUGUST 2005 TESTING FOR ASYMMETRY IN INTEREST RATE VOLATILITY IN THE PRESENCE OF A NEGLECTED
High-frequency data modelling using Hawkes processes
 High-frequency data modelling using Hawkes processes Valérie Chavez-Demoulin 1 joint work J.A McGill 1 Faculty of Business and Economics, University of Lausanne, Switzerland Boulder, April 2016 Boulder,
Bayesian Semiparametric GARCH Models
 Bayesian Semiparametric GARCH Models Xibin (Bill) Zhang and Maxwell L. King Department of Econometrics and Business Statistics Faculty of Business and Economics xibin.zhang@monash.edu Quantitative Methods
Extreme Value Theory.
 Bank of England Centre for Central Banking Studies CEMLA 2013 Extreme Value Theory. David G. Barr November 21, 2013 Any views expressed are those of the author and not necessarily those of the Bank of
Bayesian Semiparametric GARCH Models
 Bayesian Semiparametric GARCH Models Xibin (Bill) Zhang and Maxwell L. King Department of Econometrics and Business Statistics Faculty of Business and Economics xibin.zhang@monash.edu Quantitative Methods
Normal Probability Plot Probability Probability
 Modelling multivariate returns Stefano Herzel Department ofeconomics, University of Perugia 1 Catalin Starica Department of Mathematical Statistics, Chalmers University of Technology Reha Tutuncu Department
Testing an Autoregressive Structure in Binary Time Series Models
 ömmföäflsäafaäsflassflassflas ffffffffffffffffffffffffffffffffffff Discussion Papers Testing an Autoregressive Structure in Binary Time Series Models Henri Nyberg University of Helsinki and HECER Discussion
Fall 2017 STAT 532 Homework Peter Hoff. 1. Let P be a probability measure on a collection of sets A.
 1. Let P be a probability measure on a collection of sets A. (a) For each n N, let H n be a set in A such that H n H n+1. Show that P (H n ) monotonically converges to P ( k=1 H k) as n. (b) For each n
High-frequency data modelling using Hawkes processes
 Valérie Chavez-Demoulin joint work with High-frequency A.C. Davison data modelling and using A.J. Hawkes McNeil processes(2005), J.A EVT2013 McGill 1 /(201 High-frequency data modelling using Hawkes processes
Econometrics of Panel Data
 Econometrics of Panel Data Jakub Mućk Meeting # 6 Jakub Mućk Econometrics of Panel Data Meeting # 6 1 / 36 Outline 1 The First-Difference (FD) estimator 2 Dynamic panel data models 3 The Anderson and Hsiao
Financial Econometrics
 Financial Econometrics Nonlinear time series analysis Gerald P. Dwyer Trinity College, Dublin January 2016 Outline 1 Nonlinearity Does nonlinearity matter? Nonlinear models Tests for nonlinearity Forecasting
How to Measure Interconnectedness between Banks, Insurers and Financial Conglomerates?
 How to Measure Interconnectedness between Banks, Insurers and Financial Conglomerates? G. Hauton 1 JC. Héam 2 1 ACPR 2 ACPR, CREST 3 rd EBA Policy Research Workshop, November 2014, London. The views expressed
Multivariate GARCH models.
 Multivariate GARCH models. Financial market volatility moves together over time across assets and markets. Recognizing this commonality through a multivariate modeling framework leads to obvious gains
Expecting the Unexpected: Uniform Quantile Regression Bands with an application to Investor Sentiments
 Expecting the Unexpected: Uniform Bands with an application to Investor Sentiments Boston University November 16, 2016 Econometric Analysis of Heterogeneity in Financial Markets Using s Chapter 1: Expecting
A simple graphical method to explore tail-dependence in stock-return pairs
 A simple graphical method to explore tail-dependence in stock-return pairs Klaus Abberger, University of Konstanz, Germany Abstract: For a bivariate data set the dependence structure can not only be measured
28 March Sent by to: Consultative Document: Fundamental review of the trading book 1 further response
 28 March 203 Norah Barger Alan Adkins Co Chairs, Trading Book Group Basel Committee on Banking Supervision Bank for International Settlements Centralbahnplatz 2, CH 4002 Basel, SWITZERLAND Sent by email
Two hours. To be supplied by the Examinations Office: Mathematical Formula Tables and Statistical Tables THE UNIVERSITY OF MANCHESTER.
 Two hours MATH38181 To be supplied by the Examinations Office: Mathematical Formula Tables and Statistical Tables THE UNIVERSITY OF MANCHESTER EXTREME VALUES AND FINANCIAL RISK Examiner: Answer any FOUR