State of Wisconsin/Department of Transportation RESEARCH PROGRESS REPORT FOR THE QUARTER ENDING: JUNE 30, 2008
|
|
|
- Merry Townsend
- 5 years ago
- Views:
Transcription
1 State of Wisconsin/Department of Transportation RESEARCH PROGRESS REPORT FOR THE QUARTER ENDING: JUNE 30, 2008 Program: SPR-0010(36) FFY99 Part: II Research and Development Project Title: Materials Characterization and Analysis of the Project ID: MRUTC ( ) Marquette Interchange Project Administrative Contact: Jason Bittner Sponsor: MRUTC WisDOT Technical Contact: Leonard Makowski Approved Starting Date: May 1, 2007 Approved by COR/Steering Committee: $60,000 Approved Ending Date: August 31, 2008 Project Investigator (agency & contact): Marquette University, Dr. James A. Crovetti Description: The objectives of this study are to characterize the materials used to construct the HMA perpetual pavement within the Marquette Interchange project and to analyze the collected pavement response data to investigate the interactions between materials, environment, and traffic loadings. This study will require a detailed examination of the predictive equations and sub-routines which are part of the mechanistic-empirical design procedures developed under NCHRP Project 1-37A to determine how well these reflect the actual response measures. The conclusions of this study should provide guidance for the Wisconsin Department of Transportation to perform mechanistic-empirical pavement designs which are validated for local conditions. Total study budget Current FFY budget Expenditures for current Total Expenditures to Percent Complete quarter date $60,000 $45,000 $10, $43, % Progress This Quarter: (Includes project committee mtgs, work plan status, contract status, significant progress, etc.) Laboratory testing of unbound aggregate materials was completed at UW-Milwaukee. Attachment A provides a copy of the UWM testing report. Reporting on the asphalt testing results conducted at Iowa State University was also completed. Attachment B provides a copy of the ISU report. Performance predictions for the perpetual HMA pavement along I-43 were completed using the MEPDG software. Additional analyses were conducted using the stand-alone software KENLAYER, which allows for the determination of specific pavement outputs, such as HMA strain and subgrade compressive stresses. These values are being compared to actual field measurements obtained with on-site instrumentation. A project presentation was made to the WHRP Flexible Pavement Technical Oversight Committee on May 14 th. Many members of this committee serve on the MRUTC Project Oversight Committee responsible for this project. The draft final project report is being prepared for submission by July 15, This will provide a ten-day review period prior to the project close-out presentation scheduled for July 25 th. Work Next Quarter: The draft final report will be submitted for review by July 15 th, 2008 and a close-out presentation will be provided on July 25 th, The revised final project report will be prepared to incorporate responses to all review comments received prior to August 8 th, 2008 and submitted prior to August 31, Circumstances affecting progress/budget: None
2 Gantt Chart: CY 2007 CY 2008 Project Task M J J A S O N D J F M A M J J A 1-Lit Review P P P P P A A A A A 2-Lab Testing P P P P P P P A A A A A A A A A A A A 3-Database Analysis P P P P P P P A A A A A A A A A 4-Performance Prediction P P P P P A A A A A A 5-Final Report P P P P P P A A A A
3 Attachment A Characterization of the Marquette Interchange Subgrade and Aggregate Base Course Materials Hani H. Titi, Ph.D., P.E. Associate Professor Department of Civil Engineering and Mechanics University of Wisconsin-Milwaukee P.O. Box 784 Milwaukee, WI hanititi@uwm.edu Phone : (414) Fax : (414) Graduate Students Aaron Coenen, MS Mohammed Elias, Ph.D. Candidate 1
4 Characterization of the Marquette Interchange Subgrade and Aggregate Base Course Materials A laboratory testing program was conducted on subgrade soil and aggregate base course materials obtained from the Marquette Interchange site in Milwaukee, Wisconsin. The testing program was conducted at the Geotechnical and Pavement Research Laboratory at the University of Wisconsin-Milwaukee as part of the Materials Characterization and Analysis of the Marquette Interchange HMA Perpetual Pavement project awarded to Dr. Jim Crovetti of Marquette University. Soil and aggregate samples were subjected to different tests to determine their physical properties, compaction characteristics, and resilient modulus. Subgrade Soil and Aggregate Samples Soil and aggregate samples were provided to UWM by Dr. Crovetti, the PI of the research project. The samples from the Marquette Interchange Project consist of two soil samples and two aggregate samples. The soil samples are from Location 1 (sta , off Rt) and Location 2 ( , off Rt) referred to in this report as Soil 1 and Soil 2, respectively. Two 5-gallon buckets of each soil were provided, from different elevations. Soil 1 samples are from elevations and Soil 2 samples are from elevations and Basic soil characterization tests showed that samples of Soil 1 from each elevation have different properties and as a result different classifications, and will be more accurately referred to as Soil 1A and Soil 1B from here on. Tests indicated that the two samples of Soil 2 were of the same material and will therefore continue to be grouped as Soil 2. This extended the testing to three soil samples, Soil 1A, Soil 1B, Soil 2, and two aggregate samples: Open-Graded and Dense-Graded. Laboratory Testing Program Physical Properties, Permeability, and Compaction Characteristics of Subgrade Soils Collected soils were subjected to standard laboratory tests to determine their physical properties, permeability, and compaction characteristics. Soil testing consisted of the following: grain size distribution (sieve and hydrometer analyses), Atterberg limits (liquid limit, LL, plastic limit, PL, and Shrinkage Limit, SL), specific gravity (G s ), and permeability. Soils were also subjected to Standard Proctor test to determine the optimum moisture content (w opt. ) and maximum dry unit weight (γ dmax ). Laboratory tests were conducted following the AASHTO standard test procedures. Table 1 presents a summary of the standard tests used in this study. 2
5 Table 1: Standard tests used in this investigation Soil Property Specific Gravity Particle Size Analysis Permeability Atterberg Limits Shrinkage Limit Compaction Tests AASHTO Soil Classification Standard Test Designation AASHTO T 84/85: Specific Gravity and Absorption of Fine Aggregate/Coarse Aggregate AASHTO T 100: Standard Method of Test for Specific Gravity of Soils AASHTO T 88/311: Particle Size Analysis of Soils/Grain-Size Analysis of Granular Soil Materials AASHTO T 215: Permeability of Granular Soils (Constant Head) Falling Head Permeability Test of Cohesive Soils* AASHTO T 89/90: Determining the Liquid Limit of Soils/Determining the Plastic Limit and Plasticity Index of Soils AASHTO T 92: Determining the Shrinkage Factors of Soils AASHTO T 99/180: Moisture-Density Relations of Soils Using a 2.5-kg (5.5-lb) Rammer and a 305-mm (12-in) Drop/4.54-kg (10- lb) Rammer and a 457-mm (18in) Drop AASHTO M : Standard Classification of Soils and Soil- Aggregate Mixtures for Highway Construction Purposes ASTM D 2487: Standard Classification of Soils for Engineering ASTM Soil Classification Purposes (Unified Soil Classification System) * Traditional rigid wall permeability test. Repeated Load Triaxial Test A repeated loading triaxial test was conducted, to determine the resilient modulus of the investigated soils, following AASHTO T 307: Standard Method of Test for Determining the Resilient Modulus of Soils and Aggregate Materials. The test was conducted on compacted soil specimens that were prepared in accordance with the procedure described by AASHTO T 307. Dynamic Test System for Materials The repeated load triaxial test was conducted using Instron FastTrack 8802 closed loop servo-hydraulic dynamic materials test system at UWM. The system utilizes 8800 Controller with four control channels of 19-bit resolution and data acquisition. A computer with FastTrack Console is the main user interface. This is a fully digital controlled system with adaptive control that allows continuous update of PID terms at 1 khz, which automatically compensates for the specimen stiffness during repeated load testing. The loading frame capacity of the system is 56 kips with a series 3690 actuator that has a stroke of 6 inches. The system has two dynamic load cells 1.1 and 0.22 kip for measurement of the repeated applied load. The load cells include integral accelerometer to remove the effect of dynamic loading on the moving load cell. Figure 1 depicts pictures of the dynamic materials test system used in this study. 3
 Triaxial cell")


6 (a) Loading frame (b) Triaxial cell (c) Control software Figure 1: The servo-hydraulic closed-loop dynamic materials test system used to perform the repeated load triaxial tests on subgrade soils and aggregates. 4
7 Specimen Preparation Compacted soil specimens were prepared according to the procedure described by AASHTO T 307, which requires five-lift static compaction. Therefore, special molds were designed and used to prepare soil specimens by static compaction of five equal layers. This compaction method provided uniform compacted lifts while using the same weight of soil for each lift. Figure 2 depicts pictures of the molds used to prepare soil specimens and pictures of specimen preparation procedure. For each soil type, compacted soil specimens were prepared at the maximum dry unit weight and optimum moisture content. In order to ensure the repeatability of test results, the repeated load triaxial test was performed on two specimens of each soil at the specified unit weight and moisture content. After a soil specimen was prepared under a specified unit weight and moisture content, it was placed in a membrane and mounted on the base of the triaxial cell. Porous stones were placed at the top and bottom of the specimen. The triaxial cell was sealed and mounted on the base of the dynamic materials test system frame. All connections were tightened and checked. Cell pressure, LVTD s, load cell, and all other required setup were connected and checked. Figure 3 shows pictures of specimen preparation for the repeated load triaxial test. Specimen Testing The software that controls the materials dynamic test system was programmed to apply repeated loads according to the test sequences specified by AASHTO T 307 based on the material type. Once the triaxial cell is mounted on the system, the air pressure panel is connected to the cell. The required confining pressure ( ) is then applied. Figure 4 shows pictures of the software used to control and run the repeated load triaxial test. The soil specimen was conditioned by applying 1,000 repetitions of a specified deviator stress (σ d ) at a certain confining pressure. Conditioning eliminates the effects of specimen disturbance from compaction and specimen preparation procedures and minimizes the imperfect contacts between end platens and the specimen. The specimen is then subjected to different deviator stress sequences according to AASHTO T 307. The stress sequence is selected to cover the expected in-service range that a pavement or subgrade material experiences because of traffic loading. It is very difficult to apply the exact specified loading on a soil specimen in a repeated load configuration. This is in part due to the controls of the equipment and soil specimen stiffness. However, the closed-loop servo hydraulic system is one of the most accurate systems used to apply repeated loads. In this system, the applied loads and measured displacements are continuously monitored. This is to make sure that the applied loads are within an acceptable tolerance. If there are out of range applied loads or measured displacements, then the system will display warning messages and can be programmed to terminate the test. 5
 Filling mold with one soil")


8 (a) Molds of different sizes (b) Filling mold with one soil layer (c) Applying static force to compact soil specimen Figure 2: Preparing soil specimens according to AASHTO T 307 requirements 6


")


9 (a) Compacted subgrade soil specimen (b) Seating a specimen on the cell base and placing the top cap (c) Mounting the cell on the loading frame Figure 3: Preparation of soil specimen for repeated load triaxial test 7


10 Figure 4: Computer program used to control and run the repeated load triaxial test for determination of resilient modulus 8
11 Results of Testing Program on Subgrade Soils The results of laboratory tests conducted to evaluate soil properties are presented in Table 2. The data on soil properties consists of particle size analysis (sieve and hydrometer); consistency limits (LL, PL, SL, and PI); specific gravity; maximum dry unit weight and optimum moisture content; soil classification using the Unified Soil Classification System (USCS); and soil classification using the AASHTO method including group index (GI). The following is a brief description of selected soils. Soil (1A) Test results indicated that the soil consists of 78% of fine materials (passing sieve #200) with a plasticity index PI = 2, which was classified as silt with sand (ML) according to the USCS and silty soil (A-4) according to the AASHTO soil classification with a group index GI = 0. Figure 5 shows the particle size distribution curve of soil 1A. The results of the Standard Proctor test on soil 1A are depicted in Figure 6. Test results showed that the maximum dry unit weight γ dmax =20.1 kn/m 3 and the optimum moisture content w opt. = 10%. Soil (1B) Figure 7 depicts the particle size distribution curve for soil 1B. This soil consists of 94% passing sieve #200 with plasticity index PI = 8, which was classified as lean clay (CL) according to USCS and silty soil (A-4) according to the AASHTO soil classification with GI=5. Standard Proctor test results showed that the average maximum dry unit weight γ dmax = 18.9 kn/m 3 and the corresponding average optimum moisture content w opt = 12.5%, as shown in Figure 8. Figure 9 shows a comparison of particle distribution curves for soils 1A and 1B. Soil (2) The results of particle size analysis of soil 2 are shown in Figure 10. Both tests are showing consistent results. Soil consists of about 60% passing sieve #200 with non plastic fines. The soil was classified as sandy silt (ML) according to USCS and silty soil (A-4) according to the AASHTO soil classification with GI=0. Standard Proctor test results showed that the average maximum dry unit weight γ dmax = 18.6 kn/m 3 and the corresponding average optimum moisture content w opt. = 10.5%, as shown in Figure 11. The results of the repeated load triaxial test conducted on the investigated soils are shown in Table 3. The test was conducted on soil specimens 1 and 2 compacted at γ dmax and optimum moisture content w opt.. Table 3 presents the mean resilient modulus values, standard deviation, and coefficient of variation for the 15 test sequences conducted according to AASHTO T 307. The mean resilient modulus values, standard deviation and coefficient of variation summarized in Table 3 are obtained from the last five load cycles of each test sequence. The coefficient of variation for the test results presented in Table 3 ranges between 0.30 and 9.87% for specimen #1 and from 0.16 to 8.56% for 9
12 specimen #2. This indicates that each soil specimen showed consistent behavior during each test sequence. Figure 12 shows a graphical representation of the results presented in Table 3. Inspection of Figure 12 indicates that the resilient modulus (M r ) of soil 1A decreases with the increase of the deviator stress (σ d ) under constant confining pressure ( ). Under constant = 41.4 kpa, the resilient modulus decreased from M r = MPa at σ d = 13.0 kpa to M r = MPa at σ d = 61.6 kpa for soil specimen #1. Moreover, the resilient modulus increases with the increase of confining pressure under constant deviator stress, which reflects a typical behavior. Resilient modulus test results for soils 1B and 2 are summarized in Tables 4 and 5, respectively. Moreover, these results are shown in Figures 13 and 14. The traditional (rigid wall) falling head permeability test was conducted on the investigated subgrade soils. Test results are presented in Table 6. 10
13 Table 2: Properties of the investigated soils Soil ID Soil 1A Test-1 Soil 1A Test-2 Soil 1B Test-1 Soil 1B Test-2 Moisture Content (%) Passing Sieve #200 (%) Liquid Limit LL (%) Plastic Limit PL (%) Plasticity Index PI (%) Shrinkage Limit SL (%) Specific Gravity Gs Optimum Moisture Content W opt (%) Maximum Dry Unit Weight γ dmax (pcf) γ dmax (kn/m 3 ) Soil 2A NP NP NP NP Soil 2B NP NP NP NP Unified Soil Classification System (USCS) ML (Silt w/ Sand) CL-ML (Silty clay w/sand) CL (Lean Clay) CL-ML (Silty clay w/sand ML (Sandy Silt) ML (Sandy Silt) Group Index (GI) AASHTO Soil Classification 0 A-4 0 A-4 5 A-4 5 A-4 0 A-4 0 A-4 NP: Non Plastic Soil 1A: sta , off Rt Elev Soil 1B: sta , off Rt Elev Soil 2A: sta , off Rt Elev Soil 2B: sta , off Rt Elev
14 Particle size (in) E Soil 1(A) %Passing Particle Size (mm) Figure 5: Particle size distribution of soil 1(A) Soil 1(A) 20 Dry Unit Weight (lb/ft 3 ) Dry Unit Weight (kn/m 3 ) Moisture Content (%) Figure 6: Compaction curve for soil 1(A). 12
15 Particle size (in) E Soil 1(B) %Passing Particle Size (mm) Figure 7: Particle size distribution of soil 1(B) Soil 1(B) 20 Dry Unit Weight (lb/ft 3 ) Dry Unit Weight (kn/m 3 ) Moisture Content (%) Figure 8: Compaction curve for soil 1(B). 13
16 Particle size (in) E Soil 1(A) Soil 1(B) %Passing Particle Size (mm) Figure 9: Particle size distribution of soil 1. Particle size (in) E Soil 2 (test 1) Soil 2(test 2) %Passing Particle Size (mm) Figure 10: Particle size distribution of soil 2. 14
17 Dry Unit Weight (lb/ft 3 ) Dry Unit Weight (kn/m 3 ) Moisture Content (%) (a) Test Dry Unit Weight (lb/ft 3 ) Dry Unit Weight (kn/m 3 ) Moisture Content (%) (b) Test 2 Figure 11: Compaction curve for soil 2 15
18 Test Sequence Table 3: Results of the repeated load triaxial test on subgrade soil 1A (kpa) Test #1 Test #2 M r M r σ Standard COV d M r (kpa) (MPa) Deviation (%) M σ d M r M r r Standard COV (kpa) (MPa) Deviation (%)
19 Deviator Stress σ d (psi) Resilient Modulus, M r (MPa) = 41.4 kpa =27.6 kpa =13.8 kpa Resilient Modulus, M r (psi) Deviator Stress σ d (kpa) (a) Test 1 Deviator Stress σ d (psi) Resilient Modulus, M r (MPa) =41.4 kpa =27.6 kpa =13.8 kpa Resilient Modulus, M r (psi) Deviator Stress σ (kpa) d (b) Test 2 Figure 12: Results of repeated load triaxial test on soil 1A. 17
20 Test Sequence Table 4: Results of the repeated load triaxial test on subgrade soil 1B (kpa) Test #1 Test #2 M r M r σ Standard COV d M r (kpa) (MPa) Deviation (%) M σ d M r M r r Standard COV (kpa) (MPa) Deviation (%)
21 Test Sequence Table 5: Results of the repeated load triaxial test on subgrade soil 2 (kpa) Test #1 Test #2 M r M r σ Standard COV d M r (kpa) (MPa) Deviation (%) M σ d M r M r r Standard COV (kpa) (MPa) Deviation (%)
22 Deviator Stress σ d (psi) Resilient Modulus, M r (MPa) = 41.4 kpa =27.6 kpa =13.8 kpa Resilient Modulus, M r (psi) Deviator Stress σ d (kpa) (a) Test 1 Deviator Stress σ d (psi) Resilient Modulus, M r (MPa) =41.4 kpa =27.6 kpa =13.8 kpa Deviator Stress σ (kpa) d Resilient Modulus, M r (psi) (b) Test 2 Figure 13: Results of repeated load triaxial test on soil 1B. 20
23 Deviator Stress σ d (psi) Resilient Modulus, M r (MPa) = 41.4 kpa =27.6 kpa =13.8 kpa Resilient Modulus, M r (psi) Deviator Stress σ d (kpa) (a) Test 1 Deviator Stress σ d (psi) Resilient Modulus, M r (MPa) =41.4 kpa =27.6 kpa =13.8 kpa Resilient Modulus, M r (psi) Deviator Stress σ d (kpa) (b) Test 2 Figure 14: Results of repeated load triaxial test on soil 2. 21
24 Table 6: Results of the falling head permeability tests on subgrade soils Subgrade Soil Coefficient of Permeability k (cm/sec) Soil 1A Test Soil 1B Test Soil 2 Test Soil 2 Test
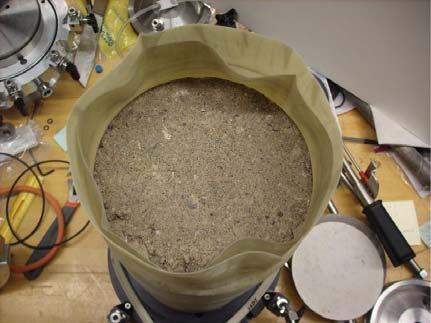
25 Physical Properties, Permeability, and Compaction Characteristics of Aggregates Collected aggregates were subjected to standard laboratory tests to determine their physical properties, permeability, and compaction characteristics. Aggregate testing consisted of the following: moisture content, grain size distribution, specific gravity (G s ), absorption, and permeability. Aggregates were also subjected to compaction test to determine the optimum moisture content (w opt. ) and maximum dry unit weight (γ dmax ). Repeated load triaxial test was conducted, to determine the resilient modulus of the investigated aggregates, following AASHTO T 307: Standard Method of Test for Determining the Resilient Modulus of Soils and Aggregate Materials. The test was conducted on compacted specimens at optimum moisture content (w opt. ) and maximum dry unit weight (γ dmax ). It should be noted that several test trials were attempted on aggregate specimens and difficulties were encountered during testing, especially with the open graded aggregates. It was difficult to keep the open grade aggregate standing inside the triaxial chamber under very low confining pressure. Therefore three plastic straps were used around the membrane without applying any confinement on the specimen. Figure 15 depicts pictures of aggregate samples preparation and testing. Results of Testing Program on Aggregates The results of laboratory tests conducted to evaluate aggregate properties are presented in Table 7. The data on aggregate properties consists of moisture content; particle size analysis; specific gravity; absorption; maximum dry unit weight and optimum moisture content; and classification using the Unified Soil Classification System (USCS). Figures 16 and 17 show the particle size distribution curves for the open graded and dense graded aggregates, respectively. The results of the repeated load triaxial test on the dense graded and open graded aggregates are summarized in Tables 8 and 9, respectively. For dense graded aggregates, the resilient modulus showed increasing trend with the increase of bulk stress (σ b ). The coefficient of variation for the resilient modulus values shows very low values (0.09 to 0.52) indicating consistent test results. The variation of the resilient modulus values with bulk stress for dense graded and open graded aggregates are shown in Figures 18 and 19, respectively. 23


26 Figure 15: Sample preparation and resilient modulus testing of aggregates 24
27 Table 7: Properties of Aggregates Aggregate Type Open Graded Dense Graded Moisture Content (%) 1 Sieve ¾ Sieve 3/8 Sieve Sieve #4 % Passing Sieve #10 Sieve #20 Sieve #40 Sieve #60 Sieve #140 Sieve #200 Bulk Specific Gravity (SSD) Apparent Specific Gravity Absorption (%) Unified Soil Classification System (USCS) GP Poorly Graded Gravel with Sand Well-Graded Gravel with Sand Aggregate Type Optimum Moisture Content W opt (%) Maximum Dry Unit Weight, γ dmax (pcf) Open Graded Dense Graded Open graded aggregate D D D C u C c Dense graded aggregate 25
28 Particle Size (in.) Open Graded Aggregate %Passing) Particle Size (mm) Figure 16: Particle size distribution curve for the open graded aggregate. 26
29 Particle Size (in.) Dense Graded Aggregate %Passing Particle Size (mm) Figure 17: Particle size distribution curve for the dense graded aggregate. 27
30 Table 8: Repeated load triaxial test results on dense graded aggregate Test Sequence (kpa) σ d (kpa) σ b (kpa) Test #1 M r (MPa) M r Standard Deviation M r COV (%) Table 9: Repeated load triaxial test results on open graded aggregate Test Sequence (kpa) σ d (kpa) σ b (kpa) Test #2 M r (MPa) M r Standard Deviation M r COV (%)
31 240 =20.7 kpa =34.5 kpa =68.9 kpa =103.4 kpa =137.9 kpa Resilient Modulus, M r (MPa) ,000 25,000 20,000 15,000 10,000 Resilient Modulus, M r (psi) Bulk Stress, σ b (kpa) Figure 18: Results of repeated load triaxial test on dense graded aggregate base. 29
32 100 =20.7 kpa =34.5 kpa =68.9 kpa =103.4 kpa =137.9 kpa 14,000 Resilient Modulus, M r (MPa) ,000 10,000 8,000 6,000 4,000 Resilient Modulus, M r (psi) Bulk Stress, σ b (kpa) Figure 19: Results of repeated load triaxial test on open graded aggregate base. 30
33 ATTACHMENT B DYNAMIC MODULUS TESTING FOR THE THREE WISCONSIN MIXTURES Project Report R. Christopher Williams Xinjun Li Department of Civil, Construction, and Environmental Engineering Iowa State University 1
34 May Sample Preparation Cylindrical specimens 100-mm by 150-mm were compacted in the laboratory using a Pine gyratory compactor. The air voids were measured on the finished test specimens. Adjustments were made to the number of gyrations during compaction to achieve the designated air voids. This sample preparation procedure was followed to prepare five samples for all three mixtures. Table 1 summarizes the parameters obtained during sample preparation, including air voids, compaction temperature, number of gyrations, and height of the specimens. Sample ID Table 1. Sample Preparation Data Compact Temp, C Number of Gyrations Air voids, % Height, Mm C C C C C E E E E E SMA SMA SMA SMA SMA Testing Equipment All tests were performed on a Cooper servo-hydraulic testing system. Flat, circular load platens were used to apply the cyclic compressive load to the specimens. The vertical deformation measurements were obtained using four Cooper extensometers with a 100-mm gage length. They were attached to specimens by aluminum buttons which were glued on the specimen s surface using epoxy glue. One average strain 2
 All tests were performed inside an environmental chamber.")
35 measurement was obtained from the four extensometers and this average strain was then used to control the testing. The test setup is shown in Figure 1. Specimen LVDT Loading Figure 1 Dynamic Modulus Test Setup (NCHRP Report 547) All tests were performed inside an environmental chamber. Mechanical cooling and heating was used for the test temperatures. The temperature was controlled by a temperature controller and verified using an independent platinum thermometer. 3. Testing Procedures The testing procedure was based on AASHTO TP 62: Standard Method of Test for Determining Dynamic Modulus of Hot-Mix Asphalt Concrete Mixtures [1]. The procedure describes performing tests at several different temperatures and loading frequencies. Tests were performed at temperatures of 4, 21 and 37 º C and frequencies of 25, 15, 10, 5, 3, 1, 0.5, 0.3 and 0.1 Hz. Each specimen was tested for 27 combinations of temperature and frequency. Testing began with the lowest temperature and proceeded to the highest. At a given temperature, the testing began with the highest frequency of loading and proceeded to the lowest. On the morning of testing, specimen were placed in the environmental test chamber at the desired temperature and allowed to equilibrate for three hours. To begin 3
36 testing, a minimal contact load was applied to the specimen. A sinusoidal axial compressive load was applied to the specimen without impact in a cyclic manner. The load was adjusted in each case to attempt to achieve an axial strain with an amplitude of 80 με with the aim to avoid accumulated damage to the specimen. It should be noted that the strain used for the testing control is an average strain from the four extensometers. The axial compressive load was adjusted in each test in an attempt to maintain the 80 με level of axial strain. The first step was to apply a preconditioning load to the specimen with 200 cycles at 25 Hz. Testing continued with varying load cycles for each frequency as shown in Table 2. A two minutes rest period was set between two continuous frequencies for all tests. The data acquisition system was programmed to record the last seven cycles for analysis at each frequency with about 200 points per cycle. Table 2 Cycles for Test Sequence Frequency, Hz Number of Cycles Preconditioning (25) A total of five replicates was tested for each mixture for the same testing condition. After the entire cycle of testing was complete at the lower temperature, the environmental chamber was set to the next temperature. After another three hours conditioning, the above steps were repeated until the entire sequence of temperatures and frequencies was completed. 4. Data Analysis and Discussion Data Variables 4
37 The test variables obtained from the data acquisition system include the time, axial force, axial displacement and the displacements from the four extensometers. The variable time is the time period from the test start to the time a data point is recorded. The axial force is the vertical load on the specimen, and axial displacement is the vertical displacement of the load piston. The axial displacement for each extensometer was recorded. After the axial force and displacement for each extensometer was recorded, the actual stress and strain was calculated for the analysis. For any given test temperature, one data file was created for each frequency for each specimen. The data file starts from 25 Hz and ends at 0.1 Hz for each of the test temperatures. At 25 Hz, 15 Hz, 10Hz, the test data is obtained from the 194 th cycle to the 200 th cycle, and there are 400 data points in each cycle. For 5 Hz, the test data is from the 94 th cycle to the 100 th cycle, and there are about 400 data points in each cycle. For 3 Hz and 1 Hz, the data is from the 14 th cycle to the 20 th cycle, and there are about 400 data points in each cycle. For 0.5 Hz, 0.3 Hz and 0.1 Hz, the data is from the 9 th cycle to 15 th cycle and about 400 points in each cycle. Raw Data Plots For asphalt concrete, the complex dynamic modulus and phase angle change with temperature and load duration time or frequency of loading. At lower temperatures, the modulus for asphalt concrete is large, so it is easy to control the applied axial force in order to obtain small displacements. At higher temperatures, such as 37 C, the material becomes soft and it is more difficult to control the axial force to obtain small displacements. Figures 3 is a typical plot of the raw test data, in which the stress curve is sinusoidal shape whereas the curve for strain has an upward drift with time. 5
38 Stress (KPa) Stress Strain Strain (ε) Time (s) Figure 3 Typical Stress, Strain vs. Time Plot at Lower Temperature (4 C) From the above plot, it can be seen that the displacement curves are not sinusoidal but increase with time, due to the drift in the displacement. This is especially obvious for higher temperatures. The following equations generally represent the load and displacement. F = A + C *sin(2π f * t + θ ) (1) 0F 1F F D = A t + C *sin(2π f * t + θ ) (2) 0D * 1D D where: F and D = load and displacement, respectively; A 0F = mean value for the load; A 0D = slope of the drift curve for the displacement; C 1F and C 1D = amplitude specifies the height of the oscillation for the load and displacement, respectively; f = frequency for the test; and θ F and θ D = phase angle for the load and displacement, respectively. One can invoke the trigonometric identity for equations (1) and (2): C [ sin(2πft)cos( θ ) cos(2πft)sin( θ )] sin( 2π ft + θ F ) = C1F F + (3) 1F F F = A0 F + C1F * sin(2π f * t + θ F ) = A0 F + A1 F cos(2πft) + B1F sin(2πft) (4) where 6
39 A = sin( θ ) and B = cos( θ ) (5) 1F C1 F F 1F C1 F F The phase angle and amplitude for the load are obtained as follows [2]: A1 F θ F = arctan( ) (6) B 1F 2 2 1F A1 F B1F C = + (7) Using the least-square fit of a sinusoid, the goal is to determine coefficient values that minimize [2]: S r = N { yi [ A0 + A1 cos( 2 fti ) + B1 sin(2πfti )]} i= 1 2 π (8) The solutions for the equation (8) are [2]: Y 2 2 A0 =, A1 = Y cos(2π ft) and B1 = Y sin(2π ft) (9) N N N Here, Y is the centered load from the actual load value and N is the data point. The four parameters are used to characterize the sinusoidal function for the load. Maximum and minimum values were obtained for every cycle for the displacement. The slope was then calculated for the maximum and minimum values, respectively. The average of these two slopes was interpreted as the drift rate. Equation 9 could be used to calculate the parameters for the displacement. It should be noted that Y should be the corrected displacement. The method for this correction is given by the following equation: Y c = ( Y 0 E) R * t (10) where: Y C = Corrected displacement; Y 0 = actual displacement; E = Average of all the actual displacements; (Y 0 -E) = centered displacement; R = displacement drift rate; and t = time. After the corrected displacement was obtained, equation 9 was used to calculate A 0, A 1 and B 1. From these parameters, equations 4, 5, and 6 were used to calculate the amplitude and phase angle for the displacement curve. 7
40 Once all the parameters for the load and displacement curve are obtained, it is straightforward to calculate the complex dynamic modulus and phase angle for the asphalt mixture: C L E * 1 F G = * (11) C A θ = θ F θ D (12) where E * and θ = complex modulus and phase angle for the material, respectively; C 1F and C 1D = amplitude for the load and displacement curve as described above; L G = gage length; A = specimen area; and θ F and θ D = phase angle for the load and displacement, respectively. 1D Test Data One analysis file was obtained for each load frequency. In this analysis file, the complex dynamic modulus in GPa and the phase angle in degrees were obtained for the given test temperature and frequency. Five replicate specimens were tested for each asphalt mixture. After all the complex dynamic modulus and phase angle values were calculated for each specimen under the same test conditions, the average value for both of these parameters was calculated. The coefficients of variation for both dynamic modulus and phase angle were also calculated for each mixture. The average values from the five specimens for the three asphalt mixtures are shown in Table 3, 4, 5, respectively. Temperature (ºC) 4 Table 3 Average Dynamic Modulus and Phase Angle for the SMA Mixture Dynamic Modulus, GPa Phase Angle, degrees Frequency (Hz) Mean Standard Coefficient of Standard Coefficient of Mean Deviation Variation (%) Deviation Variation (%)
41 Temperature (ºC) Table 4 Average Dynamic Modulus and Phase Angle for the E30 Mixture Dynamic Modulus, GPa Phase Angle, degrees Frequency (Hz) Mean Standard Coefficient of Standard Coefficient of Mean Deviation Variation (%) Deviation Variation (%)
42 Temperature (ºC) Table 5 Average Dynamic Modulus and Phase Angle for the C2 Mixture Dynamic Modulus, GPa Phase Angle, degree Frequency (Hz) Mean Standard Coefficient of Standard Coefficient of Mean Deviation Variation (%) Deviation Variation (%)
43 It can be seen from the experimental data that for all mixtures, most coefficients of variation (COV) for both the dynamic modulus and phase angle under the different test temperatures and frequencies are less than 20%, which means the repeatability of the tests is satisfactory. Figures 4 through 6 plot the average dynamic modulus data for the SMA, E30 and C2 mixtures, respectively, while Figures 7 through 9 illustrate the phase angle values for these same three mixtures E* (GPa) SMA+4 C SMA+21 C SMA+37 C Frequency (Hz) Figure 4 Dynamic modulus data for the SMA mixture 11
44 30 E* (GPa) E30+4 C E30+21 C E30+37 C Frequency (Hz) 35 Figure 5 Dynamic modulus data for the E30 mixture 30 E* (GPa) C2+4 C C2+21 C C2+37 C Frequency (Hz) Figure 6 Dynamic modulus data for the C2 mixture 12
45 Phase angle (degree) SMA+4 C SMA+21 C SMA+37 C Frequency (Hz) Figure 7 Phase angle data for the SMA mixture Phase angle (degree) E30+4 C E30+21 C E30+37 C Frequency (Hz) 13
46 Phase angle (degree) Figure 8 Phase angle data for the E30 mixture C2+4 C C2+21 C C2+37 C Frequency (Hz) Figure 9 Phase angle data for the C2 mixture From the above figures, it was observed that the dynamic modulus values for all mixtures decrease with the increase of test temperature and increase with the increase of frequency, as is well known for asphalt mixtures. As for the phase angle, it was found that the phase angle increases with the increase of test temperature and decreases with frequency. This is nearly true for all mixtures except for few points at the highest test temperature. It is well documented that asphalt materials are viscoelastic materials and they always demonstrates more viscous properties at higher temperatures, which leads to more difficult accurate measurement of the phase angle at higher temperatures, such as 37º C. This can be used to explain the phase angle values at higher temperature, as shown in Figures 7 through 9. In order to compare the dynamic modulus values for different mixtures, the dynamic modulus data is plotted in one figure, as shown in Figure
47 E* (GPa) SMA+4 C SMA+21 C SMA+37 C E30+4ºC E30+21ºC E30+37ºC C2+4ºC C2+21ºC C2+37ºC Frequency (Hz) Figure 10 Dynamic modulus data for all mixtures It can be seen from Figure 10 that the SMA mixture has substantially lower dynamic modulus value than the other two mixtures, given the same test condition. The E30 and C2 mixtures have very close dynamic modulus values at the two higher test temperatures, whereas at the highest test temperature the C2 mixture has a higher dynamic modulus than the E30 mixture. Dynamic Modulus Master Curves The asphalt mixtures are thermorheologically simple materials and the timetemperature superposition principle is applicable in the linear viscoelastic state. The dynamic modulus and phase angle of asphalt mixtures can be shifted along the frequency axis to form single characteristic master curves at a desired reference temperature or frequency. Typically the shift factors α T are obtained from the WLF equation [3]: C1 ( T TS ) logα T = (13) C + T T where C 1 and C 2 are constants, T s is the reference temperature, and T is the temperature of each individual test. 2 S 15
48 A new method of developing the master curve for asphalt mixtures was developed in the research conducted by Pellinen [4] at the University of Maryland. In this study, master curves were constructed fitting a sigmoidal function to the measured compressive dynamic modulus test data using non-linear least squares regression techniques [4]. The shift can be done by solving the shift factors simultaneously with the coefficients of the sigmoidal function. The sigmoidal function is defined by equation 14. log E * α = δ + (14) 1+ e β γ ( log( f r ) + s T ) where log E * = log of dynamic modulus; δ = minimum modulus value; f r = reduced frequency; α = span of modulus values; s T = shift factor according to temperature; and β, γ = shape parameters. The master curve can be constructed using any non-linear curve-fitting technique. The reference temperature for all mixtures is 21 C. The Microsoft Excel Solver was used to fit the master curve for each set of data. This method uses the Generalized Reduced Gradient nonlinear optimization approach to find the parameters that give the "best fit" between the equation and the data. The nonlinear regression algorithm seeks the values of the parameters that minimize the sum of the squared differences between the values of the observed and predicted values of the dynamic modulus. Figure 11 shows the dynamic modulus master curve for the three mixtures. 16
49 1.0.E E+07 E*, KPa 1.0.E+06 SMA E30 C2 1.0.E+05 1.E-05 1.E-03 1.E-01 1.E+01 1.E+03 1.E+05 Frequency, Hz Figure 11 Dynamic modulus master curve for the three mixtures From the dynamic modulus master curve, it can be found that the SMA mixture has the lowest dynamic modulus values for the most of the frequency domain except in the low frequency range. It also shows that the E30 and C2 mixtures have very similar dynamic modulus value in most of the frequency domain. However, it was found that the E30 mixture has a higher dynamic modulus values than the C2 mixture at the low frequency domain, whereas the C2 mixture has a slightly higher dynamic modulus values than the E30 mixture at a high frequency domain, which is consistent with the dynamic modulus data shown in Figures 4 through Summary A complex dynamic modulus experimental protocol was developed and three asphalt mixtures were performed the dynamic modulus test at three test temperatures and nine frequencies using this protocol. Dynamic modulus and phase angle was calculated using the axial load and displacements recorded by four extensometers mounted on the specimen surface. The dynamic modulus master curves were constructed by fitting a sigmoidal function to the measured compressive dynamic modulus test data using nonlinear least squares regression techniques for each of the three mixtures tested. 17
50 As expected, the experimental data shows that dynamic modulus increases with an increase of frequency, but decreases with the increase of test temperature. It is also shown that the phase angle calculated from experimental data increases with the increase of test temperature, but decreases with the increase of frequency. The experimental data also shows that the mixture of SMA has the lowest dynamic modulus values, given the same test condition. The E30 and C2 mixtures have very similar dynamic modulus values at the two higher test temperatures while at the lowest temperature the C2 mixture has higher dynamic modulus values than E30. The dynamic modulus master curve confirms that the SMA mixture has the lowest dynamic modulus values for most of the frequency domain. The dynamic modulus master curves also demonstrates that the E30 and C2 mixtures have very similar dynamic modulus values for most of the frequency domain, and only a slight difference was found at the high frequency domain. Reference 1. American Association of State Highway and Transportation Officials (AASHTO): Standard Method of Test for Determining Dynamic Modulus of Hot-Mix Asphalt Concrete Mixtures: TP62, "AASHTO Provisional Standards," May 2002 Edition, Chapra, S.C., and R.P. Canale. Numerical Methods for Engineers, 4 th Edition, McGraw-Hill, Boston, Williams, M. L., R. F. Landel, and J. D. Ferry, The Temperature Dependence of Relaxation Mechanism in Amorphous Polymers and Other Glass-Liquids, J. of Am. Chem. Soc., vol. 77, 1955, p Pellinen, T. K., and M. W. Witczak, Stress Dependent Master Curve Construction for Dynamic (Complex) Modulus, Journal of the Association of Asphalt Paving Technologists, vol. 71,
Dynamic Modulus of Asphalt Mixtures for Development of
 JOURNAL PAPER TYPE Journal of Testing and Evaluation, Sept 2002 Vol XX, No. X Paper ID: Available online at: www.astm.org Published XXXX Lee, K. 1, Kim, H. 2, Kim, N. 3, Kim, Y 4 Dynamic Modulus of Asphalt
Lecture 7 Constitutive Behavior of Asphalt Concrete
 Lecture 7 Constitutive Behavior of Asphalt Concrete What is a Constitutive Model? A constitutive model or constitutive equation is a relation between two physical quantities that is specific to a material
Flexible Pavement Design
 Flexible Pavement Design The Mechanistic-Empirical Way Presented by: Keith D. Herbold, P.E. 1 Presentation Outline What s new in flexible design Example of new design Differences Capabilities Tests and
Chapter 1 - Soil Mechanics Review Part A
 Chapter 1 - Soil Mechanics Review Part A 1.1 Introduction Geotechnical Engineer is concerned with predicting / controlling Failure/Stability Deformations Influence of water (Seepage etc.) Soil behavour
Dynamic Resilient Modulus and the Fatigue Properties of Superpave HMA Mixes used in the Base Layer of Kansas Flexible Pavements
 06-1012 Dynamic Resilient Modulus and the Fatigue Properties of Superpave HMA Mixes used in the Base Layer of Kansas Flexible Pavements by Stefan A. Romanoschi, Nicoleta Dumitru, Octavian Dumitru and Glenn
Unbound Pavement Applications of Excess Foundry System Sands: Subbase/Base Material
 Unbound Pavement Applications of Excess Foundry System Sands: Subbase/Base Material Tuncer B. Edil University of Wisconsin-Madison Recycled Materials Resource Center RMRC Participant Job Description Which
Unbound material characterisation with Nottingham asphalt tester
 Civil, Construction and Environmental Engineering Civil, Construction and Environmental Engineering Publications 2012 Sunghwan Kim Iowa State University, sunghwan@iastate.edu Kasthurirangan Gopalakrishnan
Geotechnical Properties of Soil
 Geotechnical Properties of Soil 1 Soil Texture Particle size, shape and size distribution Coarse-textured (Gravel, Sand) Fine-textured (Silt, Clay) Visibility by the naked eye (0.05 mm is the approximate
2008 SEAUPG CONFERENCE-BIRMINGHAM, ALABAMA
 Introduction Overview M E E Design Inputs MEPDG Where are we now MEPDG Inputs, Outputs, and Sensitivity Southeast Asphalt User Producer Group Bill Vavrik 19 November 2008 2 Implementation Timeframe DARWin
 Project: ITHACA-TOMPKINS REGIONAL AIRPORT EXPANSION Project Location: ITHACA, NY Project Number: 218-34 Key to Soil Symbols and Terms TERMS DESCRIBING CONSISTENCY OR CONDITION COARSE-GRAINED SOILS (major
NJDOT RESEARCH PROJECT MANAGER: Mr. Anthony Chmiel
 Project Title: RFP NUMBER: CAIT NJDOT Bureau of Research QUARTERLY PROGRESS REPORT Evaluation of Poisson s Ratio NJDOT RESEARCH PROJECT MANAGER: Mr. Anthony Chmiel TASK ORDER NUMBER/Study Number: Task
Stress Sweep Rutting (SSR) Test: AMPT
 Test: AMPT") Stress Sweep Rutting (SSR) Test: AMPT Amir Ghanbari Graduate Research Assistant Y. Richard Kim Jimmy D. Clark Distinguished University Professor Alumni Distinguished Graduate Professor B. Shane Underwood
Stress Sweep Rutting (SSR) Test: AMPT Amir Ghanbari Graduate Research Assistant Y. Richard Kim Jimmy D. Clark Distinguished University Professor Alumni Distinguished Graduate Professor B. Shane Underwood
CE 240 Soil Mechanics & Foundations Lecture 3.2. Engineering Classification of Soil (AASHTO and USCS) (Das, Ch. 4)
 (Das, Ch. 4)") CE 240 Soil Mechanics & Foundations Lecture 3.2 Engineering Classification of Soil (AASHTO and USCS) (Das, Ch. 4) Outline of this Lecture 1. Particle distribution and Atterberg Limits 2. Soil classification
CE 240 Soil Mechanics & Foundations Lecture 3.2 Engineering Classification of Soil (AASHTO and USCS) (Das, Ch. 4) Outline of this Lecture 1. Particle distribution and Atterberg Limits 2. Soil classification
P.E. Civil Exam Review: GEOMECHANICS. Jerry Vandevelde, P.E.
 P.E. Civil Exam Review: GEOMECHANICS Jerry Vandevelde, P.E. gtv@gemeng.com GEOMECHANICS National Council of Examiners for Engineering and Surveying http://www.ncees.org/ 3 STUDY REFERENCES Foundation Engineering;
Application of DCP in Prediction of Resilient Modulus of Subgrade Soils
 Application of DCP in Prediction of Resilient Modulus of Subgrade Soils Louay Mohammad, Ph.D. Louisiana Transportation Research Center Louisiana State University 2006 Pavement Performance Seminar April
Evaluating Structural Performance of Base/Subbase Materials at the Louisiana Accelerated Pavement Research Facility
 Evaluating Structural Performance of Base/Subbase Materials at the Louisiana Accelerated Pavement Research Facility Zhong Wu, Ph.D., P.E. Zhongjie Zhang, Bill King Louay Mohammad Outline Background Objectives
GeoShanghai 2010 International Conference Paving Materials and Pavement Analysis
 Particle Shape, Type and Amount of Fines, and Moisture Affecting Resilient Modulus Behavior of Unbound Aggregates Debakanta Mishra 1, Erol Tutumluer 2, M. ASCE, Yuanjie Xiao 3 1 Graduate Research Assistant,
Evaluating Structural Performance of Base/Subbase Materials at the Louisiana Accelerated Pavement Research Facility
 Evaluating Structural Performance of Base/Subbase Materials at the Louisiana Accelerated Pavement Research Facility Zhong Wu, Ph.D., P.E. Louisiana Transportation Research Center 2007 Transportation Engineering
DYNAMIC MODULUS MASTER CURVE AND CHARACTERIZATION OF SUPERPAVE HMA CONTAINING VARIOUS POLYMER TYPES
 DYNAMIC MODULUS MASTER CURVE AND CHARACTERIZATION OF SUPERPAVE HMA CONTAINING VARIOUS POLYMER TYPES Al-Hosain M. Ali 1, Mohamed S. Aazam 2, and Mohamed A. Alomran 3 1 Assistant Professor, Civil Engineering.
What is on the Horizon in HMA. John D AngeloD Federal Highway Administration
 What is on the Horizon in HMA John D AngeloD Federal Highway Administration Are they all the same? Internal Angle of Gyration Internal Angle of Gyration Development of the Dynamic Angle Validator (DAV)
Solution:Example 1. Example 2. Solution: Example 2. clay. Textural Soil Classification System (USDA) CE353 Soil Mechanics Dr.
 CE353 Soil Mechanics Dr.") CE353 Soil Mechanics CE353 Lecture 5 Geotechnical Engineering Laboratory SOIL CLASSIFICATION Lecture 5 SOIL CLASSIFICATION Dr. Talat A Bader Dr. Talat Bader 2 Requirements of a soil Systems Why do we need
CE353 Soil Mechanics CE353 Lecture 5 Geotechnical Engineering Laboratory SOIL CLASSIFICATION Lecture 5 SOIL CLASSIFICATION Dr. Talat A Bader Dr. Talat Bader 2 Requirements of a soil Systems Why do we need
Cyclic Triaxial Behavior of an Unsaturated Silty Soil Subjected to Suction Changes
 6 th International Conference on Earthquake Geotechnical Engineering 1-4 November 215 Christchurch, New Zealand Cyclic Triaxial Behavior of an Unsaturated Silty Soil Subjected to Suction Changes T. Nishimura
research report Characterization of Unbound Pavement Materials From New Mechanistic-Empirical Pavement Design Procedure
 Final Report VTRC 11-R6 Virginia Transportation Research Council research report Characterization of Unbound Pavement Materials From Virginia Sources for Use in the New Mechanistic-Empirical Pavement Design
4. Soil Consistency (Plasticity) (Das, chapter 4)
 (Das, chapter 4)") 4. Soil Consistency (Plasticity) (Das, chapter 4) 1 What is Consistency? Consistency is a term used to describe the degree of firmness of fine-grained soils (silt and clay). The consistency of fine grained
4. Soil Consistency (Plasticity) (Das, chapter 4) 1 What is Consistency? Consistency is a term used to describe the degree of firmness of fine-grained soils (silt and clay). The consistency of fine grained
Standard Title Page - Report on State Project Report No. Report Date No. Pages Type Report: Final VTRC 05- Project No.: 70984
 Standard Title Page - Report on State Project Report No. Report Date No. Pages Type Report: Final VTRC 05- Period Covered: June 2005 57 CR22 10/01/03 to 4/30/05 Title: Laboratory Tests for Hot-Mix Asphalt
Determination of Resilient Modulus Model for Road-Base Material
 JOURNAL OF APPLIED SCIENCES RESEARCH ISSN: 1819-544X Published BY AENSI Publication EISSN: 1816-157X http://www.aensiweb.com/jasr 2017 January; 13(1): pages 10-16 Open Access Journal Determination of Resilient
Effect of Suction on the Resilient Modulus of Compacted Fine- Grained Subgrade Soils
 THE UNIVERSITY OF WISCONSIN-MADISON Effect of Suction on the Resilient Modulus of Compacted Fine- Grained Subgrade Soils by Auckpath Sawangsuriya, Ph.D. Tuncer B. Edil, Ph.D., P.E. Craig H. Benson, Ph.D.,
USE OF BBR TEST DATA TO ENHANCE THE ACCURACY OF G* -BASED WITCZAK MODEL PREDICTIONS
 USE OF BBR TEST DATA TO ENHANCE THE ACCURACY OF G* -BASED WITCZAK MODEL PREDICTIONS Mekdim T. Weldegiorgis * PhD. Candidate, Department of Civil Engineering, University of New Mexico, USA * 1 University
Pavement Design Where are We? By Dr. Mofreh F. Saleh
 Pavement Design Where are We? By Dr. Mofreh F. Saleh Pavement Design Where are We?? State-of-Practice State-of-the-Art Empirical Mechanistic- Empirical Mechanistic Actual Current Practice?? Inputs Structure
EVALUATION OF VACUUM DRYING FOR DETERMINATION OF BULK SPECIFIC GRAVITY OF HMA SAMPLES
 Cross and Pokhrel 1 EVALUATION OF VACUUM DRYING FOR DETERMINATION OF BULK SPECIFIC GRAVITY OF HMA SAMPLES 6784 Equivalent Words by: Stephen A. Cross, Ph.D., P.E. Professor School of Civil and Environmental
Clay Robinson, PhD, CPSS, PG copyright 2009
 Engineering: What's soil got to do with it? Clay Robinson, PhD, CPSS, PG crobinson@wtamu.edu, http://www.wtamu.edu/~crobinson, copyright 2009 Merriam-Webster Online Dictionary soil, noun 1 : firm land
Module 1 GEOTECHNICAL PROPERTIES OF SOIL AND OF REINFORCED SOIL (Lectures 1 to 4)
") Module 1 GEOTECHNICAL PROPERTIES OF SOIL AND OF REINFORCED SOIL (Lectures 1 to 4) Topics 1.1 INTRODUCTION 1.2 GRAIN-SIZE DISTRIBUTION Sieve Analysis Hydrometer Analysis 1.3 SIZE LIMITS FOR SOILS 1.4 WEIGHT-VOLUME
Module 1 GEOTECHNICAL PROPERTIES OF SOIL AND OF REINFORCED SOIL (Lectures 1 to 4) Topics 1.1 INTRODUCTION 1.2 GRAIN-SIZE DISTRIBUTION Sieve Analysis Hydrometer Analysis 1.3 SIZE LIMITS FOR SOILS 1.4 WEIGHT-VOLUME
Impact of Water on the Structural Performance of Pavements
 Impact of Water on the Structural Performance of Pavements S. Erlingsson Highway Engineering, VTI The Swedish National Road and Transport Research Institute, Linköping, Sweden & Faculty of Civil and Environmental
research report Virginia Transportation Research Council Final Report VTRC 09-R4 M. SHABBIR HOSSAIN, Ph.D., P.E. Research Scientist
 Final Report VTRC 09-R4 Virginia Transportation Research Council research report Characterization of Subgrade Resilient Modulus for Virginia Soils and Its Correlation with the Results of Other Soil Tests
APPENDIX F CORRELATION EQUATIONS. F 1 In-Situ Tests
 APPENDIX F 1 APPENDIX F CORRELATION EQUATIONS F 1 In-Situ Tests 1. SPT (1) Sand (Hatanaka and Uchida, 1996), = effective vertical stress = effective friction angle = atmosphere pressure (Shmertmann, 1975)
NCAT Test Track Prediction
 NCAT Test Track Prediction % Cracking Measured 60 50 40 30 20 10 0 O FW AW C RW R 5 7 9 11 13 15 % Damage Predicted Stress Sweep Rutting (SSR) Test Y. Richard Kim Jimmy D. Clark Distinguished University
Mechanistic-Empirical Pavement Design Guide: A User s Perspective. Brian D. Prowell, Ph.D., P.E.
 Mechanistic-Empirical Pavement Design Guide: A User s Perspective Brian D. Prowell, Ph.D., P.E. Empirical Approach Based on results of experiments or experience Scientific basis not established AASHTO
Principles of Foundation Engineering 8th Edition Das SOLUTIONS MANUAL
 Principles of Foundation Engineering 8th Edition SOLUTIONS MANUAL Full clear download (no formatting errors) at: https://testbankreal.com/download/principles-foundation-engineering- 8th-edition-das-solutions-manual/
TECHNICAL PAPER INVESTIGATION INTO THE VALIDATION OF THE SHELL FATIGUE TRANSFER FUNCTION
 Authors: TECHNICAL PAPER INVESTIGATION INTO THE VALIDATION OF THE SHELL FATIGUE TRANSFER FUNCTION Anthony Stubbs (Presenter), BE(Hons), Masters student, University of Canterbury. aps49@student.canterbury.ac.nz.
DYNAMIC TORSIONAL SHEAR TEST FOR HOT MIX ASPHALT
 DYNAMIC TORSIONAL SHEAR TEST FOR HOT MIX ASPHALT By LINH V. PHAM A THESIS PRESENTED TO THE GRADUATE SCHOOL OF THE UNIVERSITY OF FLORIDA IN PARTIAL FULFILLMENT OF THE REQUIREMENTS FOR THE DEGREE OF MASTER
Mandal, Tinjum, and Edil 1 NON-DESTRUCTIVE TESTING OF CEMENTITIOUSLY STABILIZED MATERIALS USING ULTRASONIC PULSE VELOCITY TEST
 Mandal, Tinjum, and Edil NON-DESTRUCTIVE TESTING OF CEMENTITIOUSLY STABILIZED MATERIALS USING ULTRASONIC PULSE VELOCITY TEST Tirupan Mandal (Corresponding Author) Graduate Research Assistant, Civil and
2002 Design Guide Preparing for Implementation
 2002 Preparing for Implementation By Monte Symons 2003 NCUAPG Annual Meeting Excerpts from the 2002 Guide Implementation Package 2002 Presentation Overview Need for NCHRP 1-37A - Status Guide Basics Asphalt
Guide for Mechanistic-Empirical Design
 Copy No. Guide for Mechanistic-Empirical Design OF NEW AND REHABILITATED PAVEMENT STRUCTURES FINAL DOCUMENT APPENDIX DD-1: RESILIENT MODULUS AS FUNCTION OF SOIL MOISTURE-SUMMARY OF PREDICTIVE MODELS NCHRP
NCAT Report Results of Inter- laboratory Study for AMPT Pooled Fund Study TPF- 5(178) By Adam Taylor, P.E. Nam Tran, Ph.D., P.E.
 By Adam Taylor, P.E. Nam Tran, Ph.D., P.E.") NCAT Report 14-1 Results of Inter- laboratory Study for AMPT Pooled Fund Study TPF- 5(178) By Adam Taylor, P.E. Nam Tran, Ph.D., P.E., LEED GA April 214 1. Report No. NCAT Report No. 14-1 4. Title and
NCAT Report 14-1 Results of Inter- laboratory Study for AMPT Pooled Fund Study TPF- 5(178) By Adam Taylor, P.E. Nam Tran, Ph.D., P.E., LEED GA April 214 1. Report No. NCAT Report No. 14-1 4. Title and
Arizona Pavements and Materials Conference Phoenix, Arizona. November 15-16, John Siekmeier P.E. M.ASCE
 Arizona Pavements and Materials Conference Phoenix, Arizona November 15-16, 2017 John Siekmeier P.E. M.ASCE Minnesota DOT Districts and Local Agencies Other State DOTs, FHWA and NCHRP Contractors and Manufacturers
Professional Agreement Invoice and Progress Report
 ITD 0771 (Rev. 10-06) itd.idaho.gov Professional Agreement Invoice and Progress Report Idaho Transportation Department This page must be filled out monthly by the Consultant and forwarded to the Agreement
Analysis of Non-Linear Dynamic Behaviours in Asphalt Concrete Pavements Under Temperature Variations
 ENOC 2017, June 25 30, 2017, Budapest, Hungary Analysis of Non-Linear Dynamic Behaviours in Asphalt Concrete Pavements Under Temperature Variations Amal Abdelaziz *, Chun-Hsing Ho *, and Junyi Shan * *
Stress Rotations Due to Moving Wheel Loads and Their Effects on Pavement Materials Characterization
 Stress Rotations Due to Moving Wheel Loads and Their Effects on Pavement Materials Characterization Erol Tutumluer June 9, 2005 OMP Brown Bag Seminar Presentation FAA Center of Excellence for Airport Technology
Status Update: NCHRP Project 9-48
 Status Update: NCHRP Project 9-48 Field versus Laboratory Volumetrics and Mechanical Properties Louay N. Mohammad Mostafa Elseifi Sam Cooper, III Department of Civil and Environmental Engineering LA Transportation
SUITABILITY OF USING CALIFORNIA BEARING RATIO TEST TO PREDICT RESILIENT MODULUS
 SUITABILITY OF USING CALIFORNIA BEARING RATIO TEST TO PREDICT RESILIENT MODULUS By: Beena Sukumaran, Associate Professor, Civil & Environmental Engineering Rowan University 201 Mullica Hill Road, Glassboro,
FACTORS AFFECTING RESILIENT MODULUS
 FACTORS AFFECTING RESILIENT MODULUS Saleh M & S J JI University of Canterbury, Christchurch, New Zealand ABSTRACT: Resilient modulus is an important property for asphalt concrete design and for mechanistic
The Development of a Performance Specification for Granular Base and Subbase Material
 FHWA-NJ-2005-003 The Development of a Performance Specification for Granular Base and Subbase Material FINAL REPORT Mr. Thomas Bennert* Research Engineer Submitted by Dr. Ali Maher* Professor and Chairman
Everything you ever wanted to know about HMA in 30 minutes. John D AngeloD The mouth
 Everything you ever wanted to know about HMA in 30 minutes John D AngeloD The mouth Are they all the same? Background SHRP A-001 A Contract Development of Superpave Mix Design Procedure Gyratory Compactor
Mechanistic Investigation of Granular Base and Subbase Materials A Saskatchewan Case Study
 Mechanistic Investigation of Granular Base and Subbase Materials A Saskatchewan Case Study Curtis Berthelot, P. Eng. Department of Civil and Geological Engineering University of Saskatchewan 57 Campus
8.1. What is meant by the shear strength of soils? Solution 8.1 Shear strength of a soil is its internal resistance to shearing stresses.
 8.1. What is meant by the shear strength of soils? Solution 8.1 Shear strength of a soil is its internal resistance to shearing stresses. 8.2. Some soils show a peak shear strength. Why and what type(s)
Class Principles of Foundation Engineering CEE430/530
 Class Principles of Foundation Engineering CEE430/530 1-1 General Information Lecturer: Scott A. Barnhill, P.E. Lecture Time: Thursday, 7:10 pm to 9:50 pm Classroom: Kaufmann, Room 224 Office Hour: I have
The Superpave System Filling the gaps.
 The Superpave System Filling the gaps. John A. D Angelo Federal Highway Administration FHWA Binder lab Continuous support to the States: Training / Ruggedness / Development / Validation Trouble shooting
Determination of Resilient Modulus of Subgrades Using Bender Elements
 TRANSPORTATION RESEARCH RECORD I 504 79 Determination of Resilient Modulus of Subgrades Using Bender Elements SHAHRIYAR BAIG AND SOHEIL NAZARIAN Resilient moduli of subgrades are becoming important input
AMPT Cyclic Fatigue Test
 AMPT Cyclic Fatigue Test Y. Richard Kim Jimmy D. Clark Distinguished University Professor Alumni Distinguished Graduate Professor NC State University North East Asphalt User/Producer Group Meeting October
Chapter 2. 53% v. 2.2 a. From Eqs. (2.11) and (2.12), it can be seen that, 2.67
 and (2.12), it can be seen that, 2.67") Chapter 2 2.1 d. (87.5)(9.81) (1000)(0.05) 3 17.17 kn/m c. d 1 w 17.17 1 0.15 3 14.93 kn/m G a. Eq. (2.12): s w (2.68)(9.81). 14.93 ; e 0.76 1 e 1 e e 0.76 b. Eq. (2.6): n 0.43 1 e 1 0.76 Vw wgs (0.15)(2.68)
Chapter 2 2.1 d. (87.5)(9.81) (1000)(0.05) 3 17.17 kn/m c. d 1 w 17.17 1 0.15 3 14.93 kn/m G a. Eq. (2.12): s w (2.68)(9.81). 14.93 ; e 0.76 1 e 1 e e 0.76 b. Eq. (2.6): n 0.43 1 e 1 0.76 Vw wgs (0.15)(2.68)
Accelerated Loading Evaluation of Base & Sub-base Layers
 Accelerated Loading Evaluation of Base & Sub-base Layers Zhong Wu, Ph.D., P.E. Louisiana Transportation Research Center (LTRC) April 2006 What is Accelerated Loading? Accelerated loading refers to Accelerated
COARSE VERSUS FINE-GRADED SUPERPAVE MIXTURES: COMPARATIVE EVALUATION OF RESISTANCE TO RUTTING
 NCAT Report 02-02 COARSE VERSUS FINE-GRADED SUPERPAVE MIXTURES: COMPARATIVE EVALUATION OF RESISTANCE TO RUTTING By Prithvi S. Kandhal L. Allen Cooley, Jr. February 2002 277 Technology Parkway Auburn, AL
Implementation of M-E PDG in Kansas
 Implementation of M-E PDG in Kansas Mustaque Hossain, Ph.D.,P.E. Kansas State University 1 Projects related to the M-E Guide Implementation and Calibration Kansas HMA Fatigue and Stiffness Study Pool Fund
Resilient modulus and segregation potential estimation from simplified laboratory procedure
 Resilient modulus and segregation potential estimation from simplified laboratory procedure Jean-Pascal Bilodeau, ing., Ph.D. Research engineer, department of civil engineering, Laval University Guy Doré,
A Study on Dynamic Properties of Cement-Stabilized Soils
 A Study on Dynamic Properties of Cement-Stabilized Soils Pei-Hsun Tsai, a and Sheng-Huoo Ni 2,b Department of Construction Engineering, Chaoyang University of Technology, 68 Jifong E. Rd., Wufong District,
Correlation of unified and AASHTO soil classification systems for soils classification
 Journal of Earth Sciences and Geotechnical Engineering, vol. 8, no. 1, 2018, 39-50 ISSN: 1792-9040 (print version), 1792-9660 (online) Scienpress Ltd, 2018 Correlation of unified and AASHTO classification
A COMPARISON BETWEEN IN SITU AND LABORATORY MEASUREMENTS OF PORE WATER PRESSURE GENERATION
 13 th World Conference on Earthquake Engineering Vancouver, B.C., Canada August 1-6, 2004 Paper No. 1220 A COMPARISON BETWEEN IN SITU AND LABORATORY MEASUREMENTS OF PORE WATER PRESSURE GENERATION Kenan
Effect of Lime on the Compressibility Characteristics of a Highly Plastic Clay
 Effect of Lime on the Compressibility Characteristics of a Highly Plastic Clay Abstract İnci Süt-Ünver Ph.D. Candidate Istanbul Technical University Istanbul - Turkey Musaffa Ayşen Lav Prof. Dr. Istanbul
DISPLACEMENT RATE AND TEMPERATURE EFFECT ON ASPHALT CONCRETE CRACKING POTENTIAL ASM TAMIM U. KHAN THESIS
 DISPLACEMENT RATE AND TEMPERATURE EFFECT ON ASPHALT CONCRETE CRACKING POTENTIAL BY ASM TAMIM U. KHAN THESIS Submitted in partial fulfillment of the requirements for the degree of Master of Science in Civil
GEOSYNTHETICS ENGINEERING: IN THEORY AND PRACTICE
 GEOSYNTHETICS ENGINEERING: IN THEORY AND PRACTICE Prof. J. N. Mandal Department of civil engineering, IIT Bombay, Powai, Mumbai 400076, India. Tel.022-25767328 email: cejnm@civil.iitb.ac.in Module-5 LECTURE-
Mn/DOT Flexible Pavement Design Mechanistic-Empirical Method
 Mn/DOT Flexible Pavement Design Mechanistic-Empirical Method Pavement Design Systems and Pavement Performance Models March 22-23, 2007 - Reykjavik, Iceland Bruce Chadbourn Assistant Pavement Design Engineer
ACKNOWLEDGMENT OF SPONSORSHIP
 ACKNOWLEDGMENT OF SPONSORSHIP This work was sponsored by the American Association of State Highway and Transportation Officials, in cooperation with the Federal Highway Administration, and was conducted
RESILIENT MODULUS AND PERMANENT DEFORMATION TESTING OF UNBOUND GRANULAR MATERIALS
 RESILIENT MODULUS AND PERMANENT DEFORMATION TESTING OF UNBOUND GRANULAR MATERIALS A Thesis by ANUROOPA KANCHERLA Submitted to the Office of Graduate Studies of Texas A&M University in partial fulfillment
Consolidation Properties of NAPL Contaminated Sediments
 Consolidation Properties of NAPL Contaminated Sediments M. B. Erten 1, C. S. El Mohtar 2, D. D. Reible 3, R. B. Gilbert 4 1 Graduate Research Assistant, University of Texas at Austin, 1 University Station
Field Rutting Performance of Various Base/Subbase Materials under Two Types of Loading
 Field Rutting Performance of Various Base/Subbase Materials under Two Types of Loading Qiming Chen, Ph.D., P.E. (presenter) Murad Abu-Farsakh, Ph.D., P.E. Louisiana Transportation Research Center Apr.
Of course the importance of these three problematics is affected by the local environmental conditions.
 SHRP METHOD/SUPERPAVE SYSTEM The Strategic Highway Research Program (SHRP) of the U.S. National Research Centre deals with, amongst other things, road construction and between 1987 and 1993 new classification
Assessment of accuracy in determining Atterberg limits for four Iraqi local soil laboratories
 IOP Conference Series: Materials Science and Engineering PAPER OPEN ACCESS Assessment of accuracy in determining Atterberg limits for four Iraqi local soil laboratories To cite this article: H O Abbas
B-1 BORE LOCATION PLAN. EXHIBIT Drawn By: 115G BROOKS VETERINARY CLINIC CITY BASE LANDING AND GOLIAD ROAD SAN ANTONIO, TEXAS.
 N B-1 SYMBOLS: Exploratory Boring Location Project Mngr: BORE LOCATION PLAN Project No. GK EXHIBIT Drawn By: 115G1063.02 GK Scale: Checked By: 1045 Central Parkway North, Suite 103 San Antonio, Texas 78232
ADVANCES in NATURAL and APPLIED SCIENCES
 ADVANCES in NATURAL and APPLIED SCIENCES ISSN: 1995-0772 Published BY AENSI Publication EISSN: 1998-1090 http://www.aensiweb.com/anas 2016 Special10(7): pages 386-391 Open Access Journal Shear Modulus
Geology 229 Engineering Geology. Lecture 8. Elementary Soil Mechanics (West, Ch. 7)
") Geology 229 Engineering Geology Lecture 8 Elementary Soil Mechanics (West, Ch. 7) Outline of this Lecture 1. Introduction of soil properties 2. Index properties of soils Soil particles Phase relationship
Geology 229 Engineering Geology Lecture 8 Elementary Soil Mechanics (West, Ch. 7) Outline of this Lecture 1. Introduction of soil properties 2. Index properties of soils Soil particles Phase relationship
Determination of AASHTO Layer Coefficients for Granular Materials by Use of Resilient Modulus
 Missouri University of Science and Technology Scholars' Mine Civil, Architectural and Environmental Engineering Faculty Research & Creative Works Civil, Architectural and Environmental Engineering 1-1-1994
Chapter (12) Instructor : Dr. Jehad Hamad
 Instructor : Dr. Jehad Hamad") Chapter (12) Instructor : Dr. Jehad Hamad 2017-2016 Chapter Outlines Shear strength in soils Direct shear test Unconfined Compression Test Tri-axial Test Shear Strength The strength of a material is the
Chapter (12) Instructor : Dr. Jehad Hamad 2017-2016 Chapter Outlines Shear strength in soils Direct shear test Unconfined Compression Test Tri-axial Test Shear Strength The strength of a material is the
From Testing to Design: An Easy Way to Use and Interpret the Results from the Asphalt Mixture Performance Tester (AMPT)
") Technical Paper ISSN 1996-6814 Int. J. Pavement Res. Technol. 6(5):527-538 Copyright @ Chinese Society of Pavement Engineering From Testing to Design: An Easy Way to Use and Interpret the Results from
Technical Paper ISSN 1996-6814 Int. J. Pavement Res. Technol. 6(5):527-538 Copyright @ Chinese Society of Pavement Engineering From Testing to Design: An Easy Way to Use and Interpret the Results from
Dynamic Modulus of Western Australia Asphalt Wearing Course. Keywords: Asphalt mixtures; dynamic modulus; master curve; MEPDG; Witczak model
 Jurnal Teknologi Full paper Dynamic Modulus of Western Australia Asphalt Wearing Course Gunawan Wibisono1 a,b, *, Hamid Nikraz, a a Civil Engineering Department, School of Civil and Mechanical Engineering,
1 MPa = 150 psi 10 kn = 1 ton 25 mm = 1 inch
 INTELLIGENT COMPACTION: AN OVERVIEW Developed by Jean-Louis Briaud Department of Civil Engineering Texas A&M University Presented to the 5 th Idaho Asphalt Conference, October 27, 5 By Fouad Bayomy Department
15. Supplementary Notes Conducted in Cooperation with the U.S. Department of Transportation, Federal Highway Administration
 FHWA/LA/406 4. Title and Subtitle Development of Models to Estimate the Subgrade and Subbase Layers Resilient Modulus from In situ Devices Test Results for Construction Control 7. Author(s) Louay N. Mohammad,
Standard Title Page - Report on Federally Funded Project 1. Report No. 2. Government Accession No. 3. Recipient s Catalog No.
 Standard Title Page - Report on Federally Funded Project 1. Report No. 2. Government Accession No. 3. Recipient s Catalog No. FHWA/VTRC 07-CR1 4. Title and Subtitle 5. Report Date Determination of the
2007 Joseph K. Anochie-Boateng
 2007 Joseph K. Anochie-Boateng ADVANCED TESTING AND CHARACTERIZATION OF TRANSPORTATION SOILS AND BITUMINOUS SANDS BY JOSEPH K. ANOCHIE-BOATENG B.S., University of Science & Technology, 1994 M.S., North
Role of Binders in Pavement Performance
 Role of Binders in Pavement Performance Presented by H. Bahia Research conducted by The University of Wisconsin-Asphalt Group The Pavement Performance Prediction Symposium Western Research Institute, Laramie,
Chapter I Basic Characteristics of Soils
 Chapter I Basic Characteristics of Soils Outline 1. The Nature of Soils (section 1.1 Craig) 2. Soil Texture (section 1.1 Craig) 3. Grain Size and Grain Size Distribution (section 1.2 Craig) 4. Particle
NEW DOWN-HOLE PENETROMETER (DHP-CIGMAT) FOR CONSTRUCTION APPLICATIONS
 FOR CONSTRUCTION APPLICATIONS") NEW DOWN-HOLE PENETROMETER (DHP-CIGMAT) FOR CONSTRUCTION APPLICATIONS 1 2 C. Vipulanandan 1, Ph.D., M. ASCE and Omer F. Usluogullari 2 Chairman, Professor, Director of Center for Innovative Grouting Materials
NEW DOWN-HOLE PENETROMETER (DHP-CIGMAT) FOR CONSTRUCTION APPLICATIONS 1 2 C. Vipulanandan 1, Ph.D., M. ASCE and Omer F. Usluogullari 2 Chairman, Professor, Director of Center for Innovative Grouting Materials
Numerical Simulation of HMA Compaction Using Discrete Element Method
 Numerical Simulation of HMA Compaction Using Discrete Element Method Jingsong Chen, Graduate Research Assistant Department of Civil and Environmental Engineering, The University of Tennessee, Knoxville,
FULL-DEPTH HMA PAVEMENT DESIGN
 FULL-DEPTH HMA PAVEMENT DESIGN Marshall R. Thompson Department of Civil Engineering University of Illinois @ U-C FULL-DEPTH HMA FULL QUALITY HMA IDOT & FULL-DEPTH HMA PAVEMENT (FD-HMA) BEFORE 1989 *AASHTO
Evaluation of Different Procedures and Models for the Construction of Dynamic Modulus Master Curves of Asphalt Mixtures
 Evaluation of Different Procedures and Models for the Construction of Dynamic Modulus Master Curves of Asphalt Mixtures Silvia Angelone, Manuel Borghi, Marina Cauhape Casaux & Fernando Martinez Road Laboratory,
VISCOELASTIC FE MODELING OF ASPHALT PAVEMENTS AND ITS APPLICATION TO U.S. 30 PERPETUAL PAVEMENT. A dissertation presented to.
 VISCOELASTIC FE MODELING OF ASPHALT PAVEMENTS AND ITS APPLICATION TO U.S. 30 PERPETUAL PAVEMENT A dissertation presented to the faculty of the Russ College of Engineering and Technology of Ohio University
Characterizing Horizontal Response Pulse at the Bottom of Asphalt Layer Based on Viscoelastic Analysis
 Technical Paper ISSN 1996-6814 Int. J. Pavement Res. Technol. 6(4):379-385 Copyright @ Chinese Society of Pavement Engineering Characterizing Horizontal Response Pulse at the Bottom of Asphalt Layer Based
MECHANISTIC-EMPIRICAL LOAD EQUIVALENCIES USING WEIGH IN MOTION
 MECHANISTIC-EMPIRICAL LOAD EQUIVALENCIES USING WEIGH IN MOTION Prepared By: Curtis Berthelot Ph.D., P.Eng. Dept. of Civil Engineering University of Saskatchewan Tanya Loewen Dept. of Civil Engineering
Development and Evaluation of Performance Tests to Enhance Superpave Mix Design and Implementation in Idaho. Quarterly Progress Report QR4
 Development and Evaluation of Performance Tests to Enhance Superpave Mix Design and Implementation in Idaho USDOT Assistance No. DTOS59-06-G-00029 (NIATT Project No. KLK479) ITD Project No. RP 181 (NIATT
COMPLEX MODULUS FROM INDIRECT TENSION TESTING
 COMPLEX MODULUS FROM INDIRECT TENSION TESTING By JAE SEUNG KIM A THESIS PRESENTED TO THE GRADUATE SCHOOL OF THE UNIVERSITY OF FLORIDA IN PARTIAL FULFILLMENT OF THE REQUIREMENTS FOR THE DEGREE OF MASTER
New light-weight device for measuring degree of compaction and dynamic load bearing capacity
 New light-weight device for measuring degree of compaction and dynamic load bearing capacity Zoltán TOMPAI assistant lecturer Department of Highway and Railway Engineering Budapest University of Technology