FINAL REPORT INTEGRATING P-WAVE AND S-WAVE SEISMIC DATA TO IMPROVE CHARACTERIZATION OF OIL RESERVOIRS. Innocent J. Aluka
|
|
|
- Lorin Patrick
- 5 years ago
- Views:
Transcription
1 1 FINAL REPORT INTEGRATING P-WAVE AND S-WAVE SEISMIC DATA TO IMPROVE CHARACTERIZATION OF OIL RESERVOIRS by Innocent J. Aluka Prepared for U.S. Department of Energy Under Grant No. DE-FG26-00NT40832 Department of Physics/Physical Science Prairie View A&M University P.O. Box 2516 Prairie View, TX December 2004
2 2 Report Title: Type of Report: Integrating P-Wave and S-Wave Seismic Data to Improve Characterization of Oil Reservoirs Final Reporting Period Start Date: September 1, 2000 Reporting Period End Date: August 31, 2004 Principal Author: Innocent J. Aluka Date of Report: December 7, 2004 Grant Number: Institution: DE-FG26-00NT40832 Prairie View A&M University Subcontractor: Bureau of Economic Geology, Austin, Texas Industrial Collaborator: Seismic Micro-Technology, Inc; Houston Address: P.O. Box 2516, Prairie View, TX 77446
3 3 DISCLAIMER This report was prepared as an account of work sponsored by an agency of the United States Government. Neither the United States Government nor any agency thereof, nor any of their employees, makes any warranty, express or implied, or assumes any legal liability or responsibility for the accuracy, completeness, or usefulness of any information, apparatus, product, or process disclosed, or represents that its use would not infringe privately owned rights. References herein to any specific commercial product, process, or service by trade name, trademark, manufacturer, or otherwise does not necessarily constitute or imply its endorsement, recommendation, or favoring by the United States Government or any agency thereof. The views and opinions of authors expressed herein do not necessarily state or reflect those of the United States Government or any agency thereof.
4 4 ABSTRACT The data used in this study were acquired by nine-component (9C) vertical seismic profile (VSP), using three orthogonal vector sources. The 9C vertical seismic profile is capable of generating P-wave mode and the fundamental S-wave mode (SH-SH and SV-SV) directly at the source station and permits the basic components of elastic wavefield (P, SH-SH and SV-SV) to be separated from one another for the purposes of imaging. Analysis and interpretations of data from the study area show that incident full-elastic seismic wavefield is capable of reflecting four different wave modes, P, SH, SV and C which can be utilized to fully understand the architecture and heterogeneities of geologic sequences. The conventional seismic stratigraphy utilizes only reflected P-wave modes. The notation SH mode is the same as SH-SH; SV mode means SV-SV and C mode which is a converted shear wave is a special SV mode and is the same as P-SV. These four wave modes image unique geologic stratigraphy and facies and at the same time reflect independent stratal surfaces because of the unique orientation of their particle-displacement vectors. As a result of the distinct orientation of individual mode s particle-displacement vector, one mode may react to a critical subsurface sequence more than the other. It was also observed that P-wave and S-wave do not always reflect from the same stratal boundaries. At inline coordinate 2100 and crossline coordinates of 10,380, 10430, and 10,520 the P-wave stratigraphy shows coherency at time slice 796 m/s and C-wave stratigraphy shows coherency at time slice 1964 m/s at the same inline coordinate and crossline coordinates of 10,400 to At inline cordinate 2800 and crossline coordinate 10,650, P-wave stratigraphy shows coherency at time slice 792 m/s and C-wave stratigraphy shows coherency at time slice 1968 m/s. The utilization of full-elastic seismic wavefield needs to be maximized in oil and gas explorations in order to optimize the search for hydrocarbons.
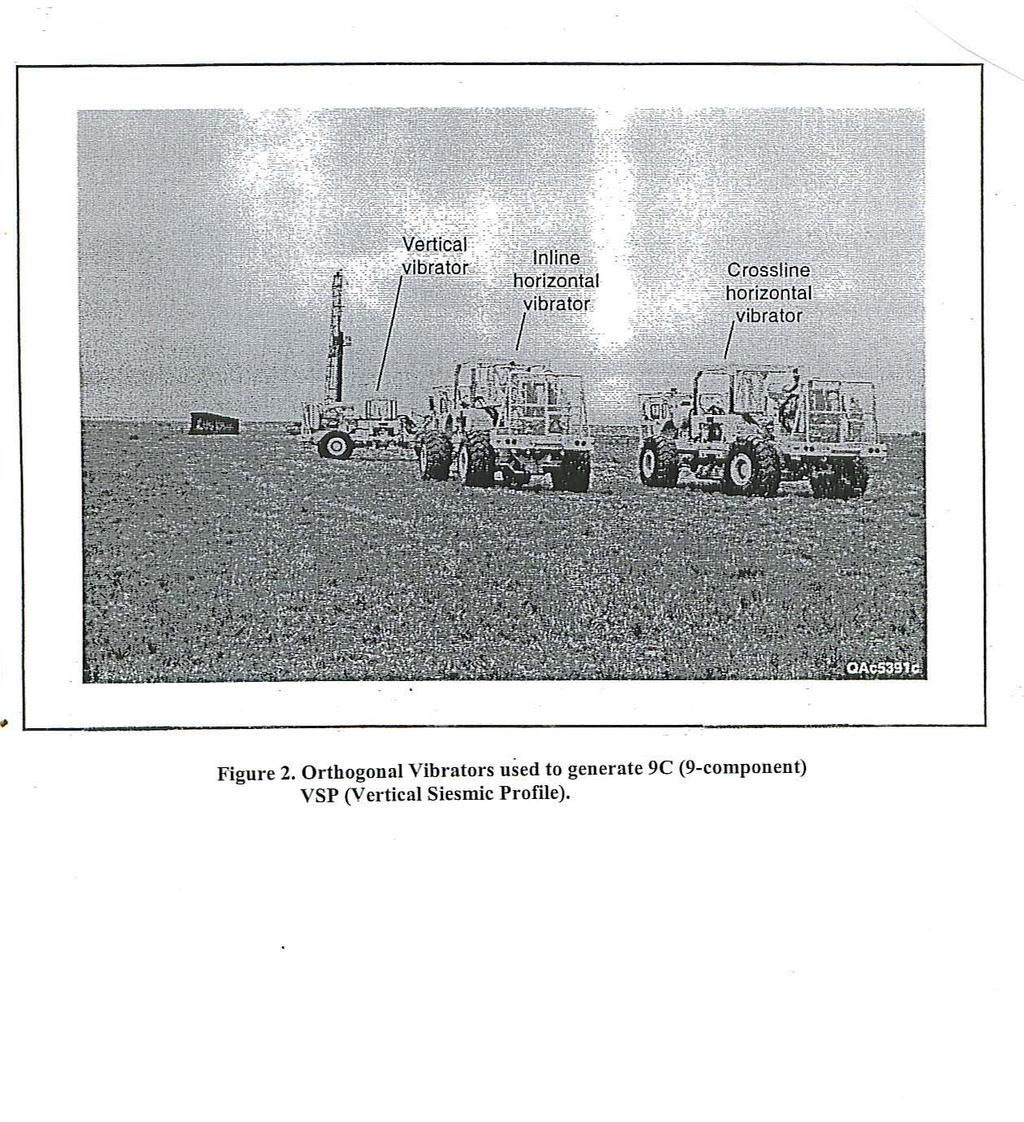
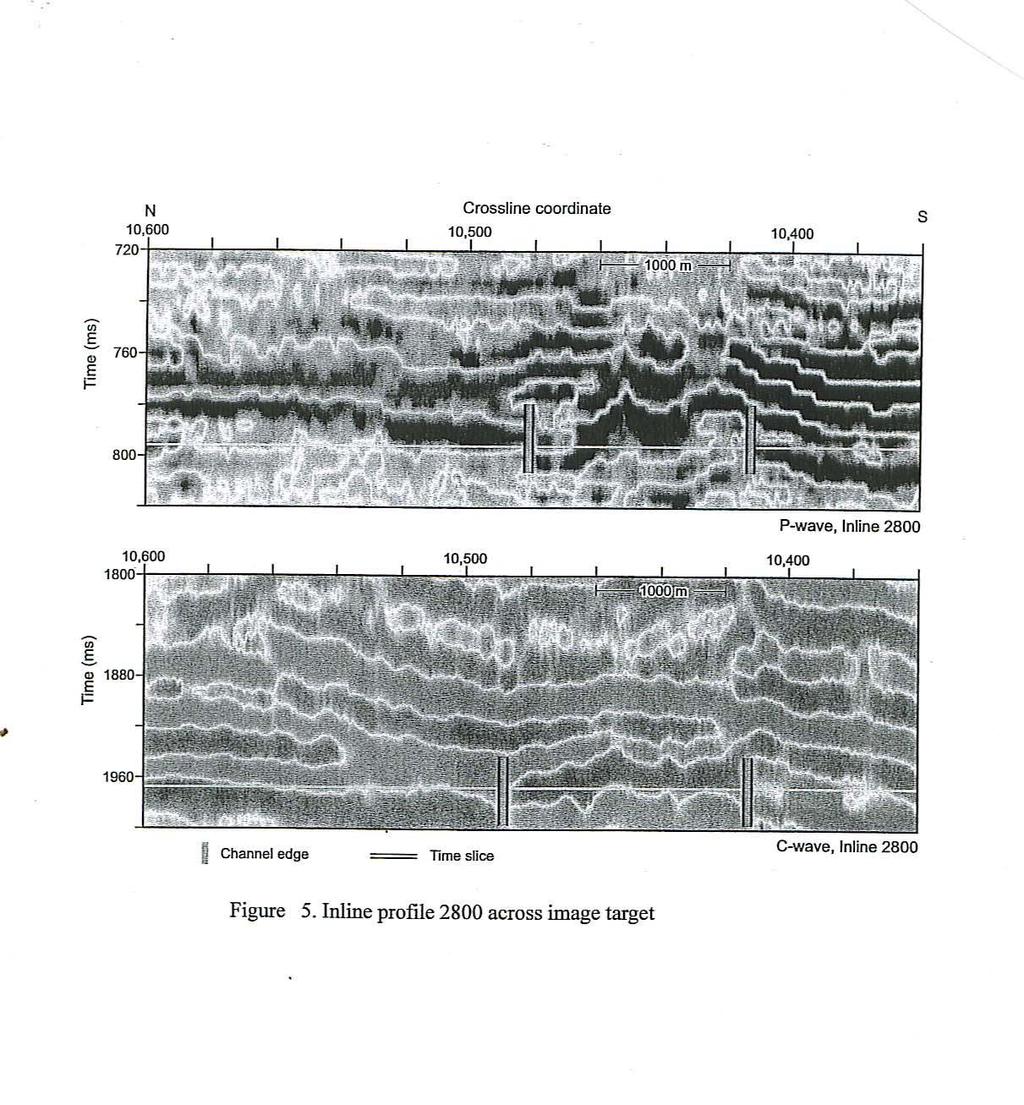
5 5 TABLE OF CONTENTS TITLE PAGE.2 Report Title...2 Type of Report...2 Author...2 Date of Report..2 Grant Number...2 Institution...2 Subcontractor..2 Industrial Collaborator...2 DISCLAIMER..3 ABSTRACT...4 TABLE OF CONTENTS..5 FIGURES...5 INTRODUCTION.6 EXECUTIVE SUMMARY... 8 EXPERIMENTAL RESULTS AND DISCUSSION..11 CONCLUSION 15 REFERENCES 16 LIST OF ACRONYMS AND ABBREVIATIONS...16 FIGURES Figure 1. Propagation of the three fundamental modes, P, SH, and SV that comprise vector-wavefield seismic data. Figure 2. Orthogonal Vibrators used to generate 9C (9-component) VSP (Vertical Siesmic Profile). Figure 3. Fundamental geometry and key elements needed for 9C VSP data acquisition. Figure 4. Comparison of conventional seismic stratigraphy and elasticwavefield seismic stratigraphy. Conventional seismic stratigraphy utilizes only reflected P-wave modes. Elasticwavefield seismic stratigraphy utilizes all elastic modes P, SH, SV, and C. Figure 5. Inline profile 2800 across image traget. Figure 6. Crossline profile 10,650 across image traget.
6 6 Figure 7. P-wave image search target. Figure 8. Depth-equivalent C-wave target. Figure 9. Comparison of P-wave and C-wave image targets. Figure 10. Contrast between P reflectivity R i,p and S reflectivity R i,s for vertical incidence on a stratal surface.
7 7 INTRODUCTION The internal complexities and heterogeneities within the oil reservoir can be characterized with seismic stratigraphy. Traditionally, most oil reservoir characterization are done with only compressional P-wave seismic data. The full science of reservoir characterization can be achieved by incorporating the principles and applications of vector-wave field seismic data in which geologic systems are interpreted using both P-wave and shear (S) wave images of subsurface stratigraphy. This is so, because, sometimes spatially coincident P and S seismic profiles do not show the same reflection sequences or the same lateral variations in seismic facies character.
8 8 EXECUTIVE SUMMARY The basic principle of seismic stratigraphy is that a seismic reflection event images a surafce of geologic sequence. The imaging of geologic sequence is accomplished by introducing an incident fullelastic seismic wavefield into the subsurface geologic sequences. The incident full-elastic seismic wavefield reflected four different wave modes, P, fast-s (SH), slow-s (SV) and C. These four wave modes reflect independent stratal surfaces and image different geologic architecture and facies. These wave modes were generated by nine-component vertical seismic profile. The 3-D, 9-component data were recorded using midpoint imaging concepts that are standard practice in the oil and gas industry. Three orthogonal vibrators used to generate 9C (9-component) VSP (vertical seismic profile) are vertical vibrator, inline horizontal vibrator and crossline horizontal vibrator. The geometry of the three orthogonal vibrators created stacking bins measuring 110 ft x 82.5 ft across the image space, with a stacking fold of 20 to 24 in the full-fold area of each data acquisition grid. The recording template that moved across the image space consisted of six parallel receiver lines, each spanning 96 receiver stations. Three-component geophones were deployed at each receiver station of this 3-D grid. Each receiver string deployed at a receiver station contained three 3- C geophones, and all three geophones were positioned in an area spanning 3 to 5 feet to form a point array. The geophones were planted carefully to position one horizontal element in the inline direction (the direction that the receiver line was oriented) and the second horizontal element in the crossline direction. Large (52,000 lb) vibrators were used to generate the 9-component data. Three distinct sets of vibrator units occupied each of the source stations. Vertical vibrators comprised one of these source arrays. These vertical vibrators generated a wavefield that was dominated by P-waves, and that wavefield was recorded by the rectangular grid of 3-component sensors in the recording template that was centered on the source station. S-wave dominated wavefields were generated by horizontal vibrators. One set of horizontal vibrators applied a shearing motion in the inline direction at each source station, and a second set of horizontal vibrators applied a shearing motion in the crossline direction. The wavefields produced by these two distinct polarized S-wave sources were recorded as individual records by the 6-line template of 3-C receivers centered on the active source station.
9 9 Data analysis shows that P-wave and S-wave do not always reflect from the same stratal boundaries. At inline coordinate 2100 and crossline coordinates of 10,380, 10430, and 10,520 the P-wave stratigraphy shows coherency at time slice 796 m/s and C-wave stratigraphy shows coherency at time slice 1964 m/s at the same inline coordinate and crossline coordinates of 10,400 to At inline cordinate 2800 and crossline coordinate 10,650, P-wave stratigraphy shows coherency at time slice 792 ms and C-wave stratigraphy shows coherency at time slice 1968 ms. The P and C wave are capable of imaging different stratal surfaces because P and C modes have different reflectivities at impedance boundaries. It was observed that it is possible for either P or C mode to have a zero, or near-zero reflectivity at a given stratal geologic surface while the other mode has a large reflevtivity.
10 10 EXPERIMENTAL The analysis was carried out on PCs, utilizing the software provided by the Seismic Micro- Technology, Inc; (SMT). The main service software package provided by Seismic Micro-Technology, Inc; (SMT) include 2d/3dPAK data interpretation, 2d/3d Seismic Interpretation, The Kingdom Suite SynPAK, The Kingdom Suite VuPAK, The Kingdom Suite TracePAK, The Kingdom Suite ModPAK, and the EarthPAK.
11 11 RESULTS AND DISCUSSION Conventional seismic stratigraphy is one of the major traditional tools used to detect the internal complexities and heterogeneities within oil reservoirs. But the concepts and principles of conventional seismic stratigraphy are based only on P-wave seismic data, with little or no applications of S-wave seismic data to reservoir characterization. The complete understanding of reservoir characterization can be achieved only by expanding the principles and concepts of conventional seismic stratigraphy to a new approach described as vector-wavefield seismic data in which geologic systems are interpreted using both P-wave and shear (S) wave (both fast-s, and slow-s data) images of the subsurface sequences. This is so, because, sometimes spatially coincident P and S seismic profiles do not show the same reflection sequences or the same lateral variations in seismic facies character. This observation leads to the conclusion that in complex geologic systems, the sedimentary record must be described by one set of P-wave seismic sequences (and facies) and also by a second, distinct set of S-wave seismic sequences (and facies). Figure 1 shows full-elastic, multicomponent seismic wavefield in a homogeneous earth consisting of a compressional mode P and two shear modes, SV and SH. The propagation procedures of these modes differ as indicated in figure 1. Note that each mode travels through the earth in a different direction along its propagation path. Laboratory studies of P-wave velocity (Vp) and S-wave velocity (Vs) in cores have shown that the ratio Vp/Vs has a distinct value for different types of rocks. Also, these Vp/Vs ratios are consistent over a wide range of porosities and confining pressures, whereas, each velocity (Vp or Vs) varies when either porosity or confining pressure changes. Thus the combination of P and S seismic data provides a capability to identify subsurface distributions of rock types through Vp/Vs ratios that is not available from P-wave seismic data alone. Particularly important is the phenomenon that S-wave split into fast-s and slow-s components when they encounter strata that are highly anisotropic. This petrophysical sensitivity has been utilized to detect and map fractured rocks with surface-recorded S- wave reflection data. P-waves exhibit little sensitivity to anisotropic rock properties, compared to the sensitivity of S-waves. Thus, 9-component seismic data allow seismic stratigraphy concepts to be expanded into anisotropic rocks where conventional P-wave-based seismic stratigraphy does not apply, or applies in a limited, and weak fashion.
12 12 The 3-D, 9-component data used in the study were recorded using midpoint imaging concepts that are standard practice in the oil and gas industry. Three orthogonal vibrators used to generate 9C (9- component) VSP (vertical seismic profile) are vertical vibrator, inline horizontal vibrator and crossline horizontal vibrator (figure 2). The geometry of the three orthogonal vibrators created stacking bins measuring 110 ft x 82.5 ft across the image space, with a stacking fold of 20 to 24 in the full-fold area of each data acquisition grid. The recording template that moved across the image space consisted of six parallel receiver lines, each spanning 96 receiver stations. Three-component geophones were deployed at each receiver station of this 3-D grid. Each receiver string deployed at a receiver station contained three 3-C geophones, and all three geophones were positioned in an area spanning 3 to 5 feet to form a point array. The geophones were planted carefully to position one horizontal element in the inline direction (the direction that the receiver line was oriented) and the second horizontal element in the crossline direction. Large (52,000 lb) vibrators were used to generate the 9-component data. Three distinct sets of vibrator units occupied each of the source stations. Vertical vibrators comprised one of these source arrays. These vertical vibrators generated a wavefield that was dominated by P-waves, and that wavefield was recorded by the rectangular grid of 3-component sensors in the recording template that was centered on the source station. S-wave dominated wavefields were generated by horizontal vibrators. One set of horizontal vibrators applied a shearing motion in the inline direction at each source station, and a second set of horizontal vibrators applied a shearing motion in the crossline direction. The wavefields produced by these two distinct polarized S-wave sources were recorded as individual records by the 6-line template of 3-C receivers centered on the active source station. Figure 3 shows the fundamental geometry necessary for 9C vertical seismic profile data acquisition. The source vector P indicates the force applied by the vertical vibrator. S IL is the force vector applied by the horizontal vibrator, and S XL is the force vector produced by the crossline vibrator. In this VSP data acquisition, inline is the direction from the source satation to the vertical receiver station, which is the orientation direction of the vertical plane ABCD. The crossline is the direction perpendicular to the inline, which is the direction normal to the plane ABCD. Analysis of data shows that P and C waves often image different stratal surfaces.the propagation of incident full-elastic seismic wavefield generates four different wave modes, P-wave, SH-wave (horizontal shear wave), SV-wave (vertical shear wave) and C-wave (converted shear wave) as shown in figure 4. These four wave modes reflect
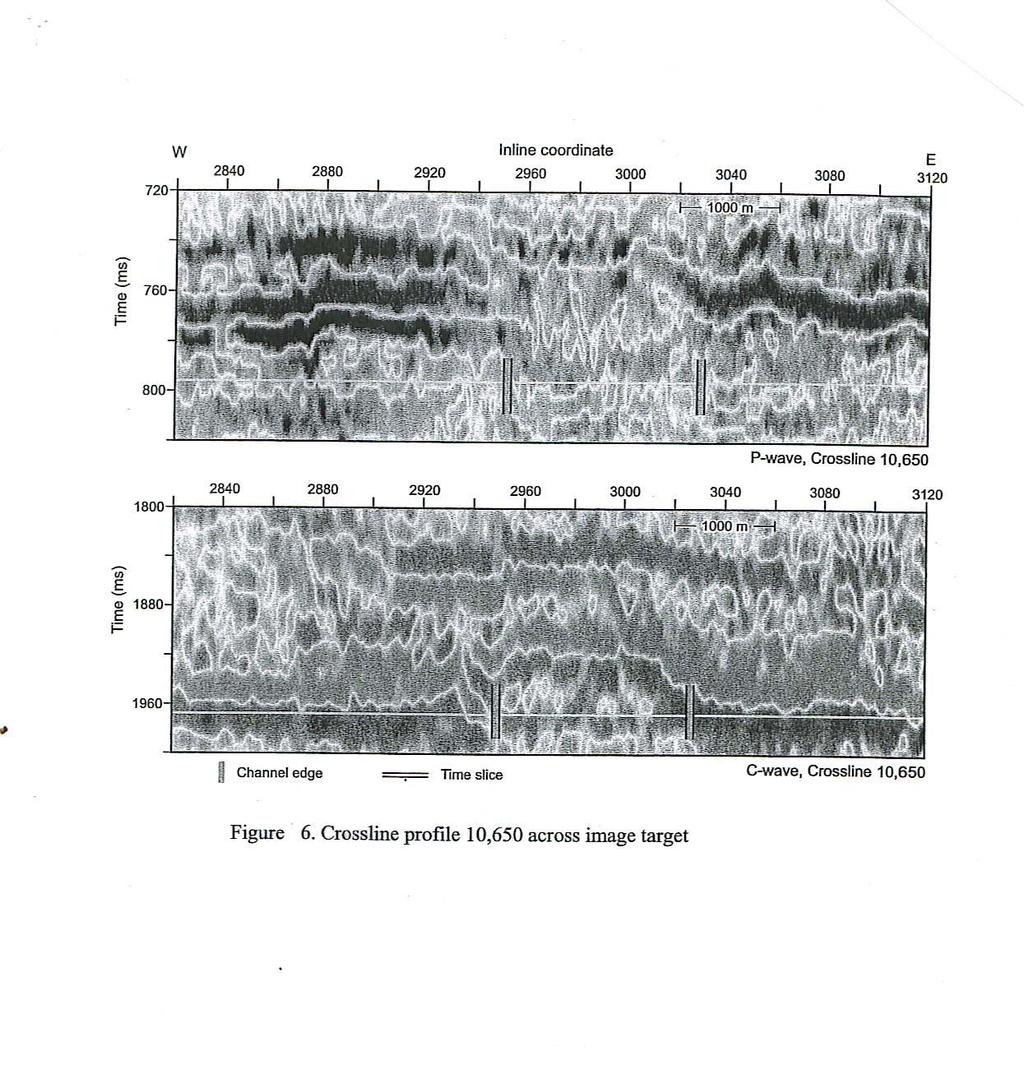
13 13 independent stratal surfaces. SH, SV, and C are three independent shear wave seismic modes. An upgoing SH mode can be produced by only a downgoing SH mode. The upgoing and downgoing modes are called SH-SH (SH down and SH up). SV is also called SV-SV, meaning SV down and SV up. C is a converted shear wave, meaning it is a special SV mode created by a downgoing P-wave. This is called P-SV, meaning P down and SV up. Futher imaging differences between P and S-wave modes are illustrated by elastic wavefield stratigraphy (figures 5 through 10). Coherency numerically measures lateral similarity of reflection waveforms in a defined data window. If the wavelet reflecting from an extensive interface has the same waveshape across the image space, the lateral coherency is high. On the other hand, if that interface is cut by a channel or incisement, for instance, the reflecting wavelet changes its waveshape at the edges of the channel. In such a case, lateral coherency is low across those narrow parts of the image space where the channel edges are. In a map of coherency, channels and incisements are shown as trends of low lateral wavelet coherency. At inline cordinate 2800 and crossline coordinate 10,650, both P and C modes show similar but not identical cross section of the incisement at each time-slice coordinate (figure 5). The white line across each seismic section indicates the position of the time slice in each data volume that is used in the image displays; the vertical black bars mark the edge of the incised feature. In figure 6 the P-wave data no longer have a distinct character, while C-wave data has a prominent characteristic. In figure 7, P-wave shows a complex system of overlapping, meandering channels but in figure 8, C-wave shows only one channel. Figure 9 compares both the P- wave and C-wave images. Basic physics of P-wave and S-wave indicates different reflection behaviors and further shows that P- wave and S-wave do not produce identical images of stratal surfaces This is expressed mathematically as shown below: Layer (i) (P i, V p, i, V s, i +1) Layer (i +1) (P i+1, V p, i +1, V s, i + 1 ) REFLECTIVITY PARAMETERS
14 14 P AND S REFLECTION COEFFICIENTS ( PV s ) i ( PV s ) i (PV p ) i (PV p ) i R i,s = R i,p = (PV s ) i +1 + ( PV s ) i (PV p ) i+1 + (PV p ) i+1 Bi (1 - R i,p ) - (1 + R i,p ) (V p /V s ) i +1 R i,s = B i = B i (1 R i,p ) + (1 + R i,p ) (V p /V s ) i These mathematical forms can be graphically expressed to relate P-wave reflectivity ( R i,p ) to S-wave reflectivity (R i,s ) (figure 10). B i is the horizontal axis. V p is the P-wave velocity, V s, the S-wave velocity, i is the upper geologic sequence, while i +1 is the underlying geologic sequence. The P-wave reflection coefficient (R i,p ) is the constant for each curve and the value is expressed on each curve. The curves show that if the P-wave reflection coefficient (R i,p ) is zero at any given geologic interface, the S-wave reflection coefficient can be zero, negative or positive, depending on the value of B i. On the other hand, if the reflection coefficient of S-wave is zero at any given geologic boundary, the P-wave reflection coefficient may be zero, negative or positive, depending on the value of B i. This implies that full science of reservoir characterization can be achieved by incorporating the principles and applications of vector-wave field seismic data in which geologic systems are interpreted using both P-wave and shear (S) wave images of subsurface stratigraphy.
15 15 CONCLUSION Since conventional seismic stratigraphy is limited when characterizing oil resevoirs because its concepts and principles have been developed and demonstrated using only P-wave seismic data, and at the same time have been verified using only P-wave technology; the complete science of reservoir characterization can be realized only by expanding its principles and applications to vector-wavefield seismic data in which geologic systems are interpreted using both P-wave and S-wave images of geologic sequences. This statement is based on the results of this study which showed that in some instances, spatially coincident P and S seismic profiles do not exhibit the same reflection sequences or the same lateral variations in seismic facies character. It is further concluded that in a complex geologic environment, it is necessary that sedimentary record be described by one set of P-wave seismic sequences(and facies) and also by a second, distinct set of S-wave seismic sequences (and facies). A full comprehension of geologic environment (reservoir architecture and heterogeneities) cannot be made until both P and S wave images are unified in seismic stratigraphy interpretations. The application of both P and S wave images to oil reservoir characterization is the current trend in most oil and gas companies and will sooner or later overtake the conventional seismic stratigraphy of only the P-wave imaging.
16 16 REFERENCES 1. Hardage, B.A., 1996, Combining P-wave and S-wave seismic data to improve prospect evaluation: Report of Investigation No. 237, Bureau of Economic Geology, The University of Texas at Austin, 47 p. 2. McCormack, M.D., Sharp, W.W., and Dunbar, J.A., 1984, A case study of stratigraphic interpretation using shear and compressional seismic data: Geophysics, v. 49, p McCormack, M.D., Justice, M.G., and Sharp, W.W., 1985, A stratigraphic interpretation of shear and compressional wave data for the Pennsylvanian Morrow Formation of southeastern New Mexico: p of AAPG Memoir 39, O.R. Berg and D.G. Woolverton, editors, Tulsa, Oklahoma, 276 pages. 4. Muller, M.C , Using shear waves to predict lateral variability in vertical fracture intensity: The Leading Edge, v. 11, no. 2, p Seismic MicroTechnology Inc., Houston, Texas. LIST OF ACRONYMS AND ABBREVIATIONS C-wave: Converted wave. A reflected SV shear wavefield produced by P- to -SV mode conversions when a downgoing P- wave propagates through a series of interfaces. 9C: 9-component P-wave: Compressional mode of a seismic wavefield. S-wave: Any shear mode (C, SH or SV) SH: Horizontal shear wave SMT: Seismic Micro-Technology V p : P-wave velocity Vs: S-wave velocity VSP: Vertical seismic profile SV: Vertical shear wave
17 17
18 18
19 19
20 20
21 21
22 22
23 23
24 24
25 25
26 26
PROJECT PROGRESS REPORT (03/lfi?lfibr-~/15/1998):
:") F?ECEVVEI) N% 05 w PROJECT PROGRESS REPORT (03/lfi?lfibr-~/15/1998): A COMPREHENSIVE STUDY OF FRACTURE PATTERNS AND DENSITIES IN THE GEYSERS GEOTHERMAL RESERVOIR USING MICROEARTHQUAKE SHEAR-WAVE SPLITTING
F?ECEVVEI) N% 05 w PROJECT PROGRESS REPORT (03/lfi?lfibr-~/15/1998): A COMPREHENSIVE STUDY OF FRACTURE PATTERNS AND DENSITIES IN THE GEYSERS GEOTHERMAL RESERVOIR USING MICROEARTHQUAKE SHEAR-WAVE SPLITTING
Quarterly Report April 1 - June 30, By: Shirley P. Dutton. Work Performed Under Contract No.: DE-FC22-95BC14936
 DE-FC22-95BC14936--18 Application of Advanced Reservoir Characterization, Simulation, and Production Optimization Strategies to Maximize Recovery in Slope, and Basin Clastic Reservoirs, West Texas (Delaware
Valley-Fill Sandstones in the Kootenai Formation on the Crow Indian Reservation, South-Central Montana
 DE-FG22-96BC14996--08 Valley-Fill Sandstones in the Kootenai Formation on the Crow Indian Reservation, South-Central Montana Quarterly Report April 1 - June 30, 1998 By David A. Lopez Work Performed Under
Valley-Fill Sandstones in the Kootenai Formation on the Crow Indian Reservation, South-Central Montana
 DE-FG22-96BC14996--06 Valley-Fill Sandstones in the Kootenai Formation on the Crow Indian Reservation, South-Central Montana Quarterly Report October 1 - December 31, 1997 By David A. Lopez Work Performed
Contractor Name and Address: Oxy USA, Inc. (Oxy), Midland, Texas OBJECTIVES
, Midland, Texas OBJECTIVES") 1 F TITLE: APPLICATION OF RESERVOIR CHARACTERIZATION AND ADVANCED TECHNOLOGY TO IMPROVE RECOVERY AND ECONOMICS IN A LOWER QUALITY SHALLOW SHELF CARBONATE RESERVOIR Cooperative Agreement No.: DE - FC22-948C14990
1 F TITLE: APPLICATION OF RESERVOIR CHARACTERIZATION AND ADVANCED TECHNOLOGY TO IMPROVE RECOVERY AND ECONOMICS IN A LOWER QUALITY SHALLOW SHELF CARBONATE RESERVOIR Cooperative Agreement No.: DE - FC22-948C14990
DISCLAIMER BASIN, WEST TEXAS AND NEW MEXICO
 TTLE: GEOSCENCE/ENGNEERNG CHARACTERZATON OF THE NTERWE'LL ENVRONMENT N CARBONATE RESERVORS BASED ON OUTCROP ANALOGS, PERMAN BASN, WEST TEXAS AND NEW MEXCO Contract No. DE-AC22-93BC14895 Contractor Name
A Geological and Geophysical Assessment of the Royal Center Gas Storage Field in North-Central Indiana, a Joint NIPSCO, DOE & GRI Case Study
 A Geological and Geophysical Assessment of the Royal Center Gas Storage Field in North-Central Indiana, a Joint NIPSCO, DOE & GRI Case Study by rne/fe7y5- -* -- 5q7255 Thomas H. Mroz, U.S.DOE/FETC, Morgantown,
Comments on the Geophysics paper Multiparameter 11norm. waveform fitting: Interpretation of Gulf of Mexico reflection
 ,..-., Comments on the Geophysics paper Multiparameter 11norm waveform fitting: Interpretation of Gulf of Mexico reflection seismograms by H. Djikp&s6 and A. Tarantola Susan E. Minkoff * t and William
BASAL CAMBRIAN BASELINE GEOLOGICAL CHARACTERIZATION COMPLETED
 BASAL CAMBRIAN BASELINE GEOLOGICAL CHARACTERIZATION COMPLETED Plains CO 2 Reduction (PCOR) Partnership Phase III Task 16 Milestone M33 Prepared for: Andrea T. McNemar National Energy Technology Laboratory
(4) How do you develop an optimal signal detection technique from the knowledge of
 How do you develop an optimal signal detection technique from the knowledge of") Signal and Noise in Global Warming Detection Final Report Gerald R. North, Principal Investigator Climate System Research Program, Texas A&M University, Texas 1. Program Objectives The specific objectives
Signal and Noise in Global Warming Detection Final Report Gerald R. North, Principal Investigator Climate System Research Program, Texas A&M University, Texas 1. Program Objectives The specific objectives
PROJECT PROGRESS REPORT (06/16/1998-9/15/1998):
:") PROJECT PROGRESS REPORT (/1/199-9/15/199): A COMPREHENSVE STUDY OF FRACTURE PATTERNS AND DENSTES N THE GEYSERS GEOTHERMAL RESERVOR USNG MCROEARTHQUAKE SHEAR-WAVE SPLTTNG TOMOGRAPHY (YEAR 2: TOMOGRAPHC
PROJECT PROGRESS REPORT (/1/199-9/15/199): A COMPREHENSVE STUDY OF FRACTURE PATTERNS AND DENSTES N THE GEYSERS GEOTHERMAL RESERVOR USNG MCROEARTHQUAKE SHEAR-WAVE SPLTTNG TOMOGRAPHY (YEAR 2: TOMOGRAPHC
Project Number (DE-FE ) Jason Rush (W. Lynn Watney, Joint PI) Kansas Geological Survey University of Kansas
 Jason Rush (W. Lynn Watney, Joint PI) Kansas Geological Survey University of Kansas") Prototyping and testing a new volumetric curvature tool for modeling reservoir compartments and leakage pathways in the Arbuckle saline aquifer: reducing uncertainty in CO 2 storage and permanence Project
Prototyping and testing a new volumetric curvature tool for modeling reservoir compartments and leakage pathways in the Arbuckle saline aquifer: reducing uncertainty in CO 2 storage and permanence Project
Prepared. PO Box 880. Scott C. Ayash. John A. Hamling Edward N. Steadman John A. Harju. University. Grand Forks,
 BELLL CREEK TEST SITE GEOLOGICAL CHARACTERIZATION DATAA COLLECTION COMPLETED Plains CO 2 Reduction (PCOR) Partnership Phase III Task 4 Milestone M14 Prepared for: Andrea T. McNemar National Energy Technology
Plasma Response Control Using Advanced Feedback Techniques
 Plasma Response Control Using Advanced Feedback Techniques by M. Clement 1 with J. M. Hanson 1, J. Bialek 1 and G. A. Navratil 1 1 Columbia University Presented at 59 th Annual APS Meeting Division of
Feasibility and design study of a multicomponent seismic survey: Upper Assam Basin
 P-276 Summary Feasibility and design study of a multicomponent seismic survey: Upper Assam Basin K.L.Mandal*, R.K.Srivastava, S.Saha, Oil India Limited M.K.Sukla, Indian Institute of Technology, Kharagpur
Delineating Karst features using Advanced Interpretation
 P-152 Asheesh Singh, Sibam Chakraborty*, Shafique Ahmad Summary We use Amplitude, Instantaneous Phase, Trace Envelope and Dip of Maximum Similarity Attributes as a tool to delineate Karst induced features
Direct Determination of the Stacking Order in Gd 2 O 3 Epi-Layers on GaAs
 Direct Determination of the Stacking Order in Gd 2 O 3 Epi-Layers on GaAs Yizhak Yacoby, Mukhles Sowwan and Ron Pindak Brookhaven National Laboratory P.O. Box 5000 Upton, NY 11973, USA Julie Cross PNC-CAT,
ADVANCED RESERVOIR CHARACTERIZATION AND EVALUATION OF CO, GRAVITY DRAINAGE IN T H E NATU RALLY FRACTU RED S P RABERRY RES ERVOl R
 ADVANCED RESERVOIR CHARACTERIZATION AND EVALUATION OF CO, GRAVITY DRAINAGE IN T H E NATU RALLY FRACTU RED S P RABERRY RES ERVOl R Contract No. DEFC22-95BC14942 Parker and Parsley Petroleum USA, Inc., 303
Special section: Multicomponent seismic interpretation. Application of 3C/3D converted mode reflections, King County, Texas
 t Special section: Multicomponent seismic interpretation Application of 3C/3D converted mode reflections, King County, Texas Michael V. DeAngelo 1 and Bob A. Hardage 1 Abstract We used a 3C/3D seismic
12/16/95-3/15/96 PERIOD MULTI-PARAMETER ON-LINE COAL BULK ANALYSIS. 2, 1. Thermal Neutron Flux in Coal: New Coal Container Geometry
 DDG/Pc/q+wl TECHNCAL PROGRESS REPORT 2/6/95-3/5/96 PEROD GRANT DE-FG22-93PC932 MULT-PARAMETER ON-LNE COAL BULK ANALYSS Scientific work VD 0 % s g; e 0% 2% -2- G? 2,. Thermal Neutron Flux in Coal: New Coal
Tell uric prof i 1 es across the Darrough Known Geothermal Resource Area, Nevada. Harold Kaufniann. Open-file Report No.
 Tell uric prof i 1 es across the Darrough Known Geothermal Resource Area, Nevada c i 4 L BY D Harold Kaufniann U.S. Geological Survey. r,. Open-file Report No. 76-286 1976 \, *\. i \ -- i 1'.- - L -.,,-.,
3D Converted Wave Data Processing A case history
 P-290 3D Converted Wave Data Processing A case history N. B. R. Prasad, ONGC Summary In recent years, there has been a growing interest in shear- wave exploration for hydrocarbons as it facilitates to
INTERMOLECULAR POTENTIAL FUNCTIONS AND HIGH RESOLUTION MOLECULAR SPECTROSCOPY OF WEAKLY BOUND COMPLEXES. Final Progress Report
 . INTERMOLECULAR POTENTIAL FUNCTIONS AND HIGH RESOLUTION MOLECULAR SPECTROSCOPY OF WEAKLY BOUND COMPLEXES Final Progress Report John S. Muenter Department of Chemistry University of Rochester Rochester,
Bulk Modulus Capacitor Load Cells
 '.\ '._,. SSCL-274. Superconducting Super Collider Labora Bulk Modulus Capacitor Load Cells C. E. Dickey April 1990 SSCL-274 BULK MODULUS CAPACITOR LOAD CELLS" C. E. Dickey Superconducting Super Cullider
Determine the Inside Wall Temperature of DSTs using an Infrared Temperature Sensor
 SUMMARY DOCUMENT Determine the Inside Wall Temperature of DSTs using an Infrared Temperature Sensor Date submitted: July 29, 2016 Prepared by: Aparna Aravelli, Ph.D. Florida International University Collaborators:
Clifford K. Ho and Michael L. Wilson Sandia National Laboratories. P.O. Box Albuquerque, NM
 1 L Calculation of Discrete Fracture Flow Paths in Dual-Continuum Models W + 0 Clifford K. Ho and Michael L. Wilson Sandia National Laboratories P.O. Box 5800 Albuquerque, NM 87 185-1324 ckho@sandia.gov,
3D time-lapse seismic monitoring of the pilot CO 2 storage site at Ketzin, Germany
 3D time-lapse seismic monitoring of the pilot CO 2 storage site at Ketzin, Germany Reflections on Seismic Acquisition, Utrecht, Feb 2017 Monika Ivandic, Christopher Juhlin and Fengjiao Zhang Department
Using Curvature to Map Faults, Fractures
 Using Curvature to Map Faults, Fractures by SATINDER CHOPRA and KURT J. MARFURT Editor s note: Chopra is with Arcis Corp., Calgary, Canada; Marfurt is with the University of Oklahoma. Both are AAPG members.
Determine the Inside Wall Temperature of DSTs using an Infrared Temperature Sensor
 SUMMARY DOCUMENT Determine the Inside Wall Temperature of DSTs using an Infrared Temperature Sensor Date submitted: April 14, 2017 Prepared by: Aparna Aravelli, Ph.D. Florida International University Collaborators:
GA A27806 TURBULENCE BEHAVIOR AND TRANSPORT RESPONSE APPROACHING BURNING PLASMA RELEVANT PARAMETERS
 GA A27806 TURBULENCE BEHAVIOR AND TRANSPORT RESPONSE APPROACHING by G.R. McKEE, C. HOLLAND, Z. YAN, E.J. DOYLE, T.C. LUCE, A. MARINONI, C.C. PETTY, T.L. RHODES, L. SCHMITZ, W.M. SOLOMON, B.J. TOBIAS, G.
GYPSY FIELD PROJECT IN RESERVOIR CHARACTERIZATION
 GYPSY FIELD PROJECT IN RESERVOIR CHARACTERIZATION Contract Number: DE-FG22-95BC14869 Contractor: Contract Date: University of Oklahoma Center for Reservoir Char act erization Norman, Oklahoma 73019 April
CENTER FOR INFRASTRUCTURE ENGINEERING STUDIES
 1 CENTER FOR INFRASTRUCTURE ENGINEERING STUDIES Acquisition of an Engineering Seismograph By Dr. Neil Anderson UTC RE116 University Transportation Center Program at The University of Missouri-Rolla 2 Disclaimer
Flowing Interval Spacing Parameter for Matrix Diffusion in the Saturated Zone
 t Flowing Interval Spacing Parameter for Matrix Diffusion in the Saturated Zone Stephanie P. Kuzio Bill W. Arnold Sandia National Laboratories Sandia National Laboratories P.O. BOX5800 P.O. BOX5800 Albuquerque,
Naturally Fractured Tight Gas Reservoir Detection Optimization. Work Performed Under Contract No.: DE-AC21-94MC3 1224
 - DOEMCB 1224 5 122 (DE96004350) Naturally Fractured Tight Gas Reservoir Detection Optimization Annual Report August 1994 - July 1995 September 1995 Work Performed Under Contract No.: DE-AC21-94MC3 1224
TITLE: MULTIDISCIPLINARY IMAGING OF ROCK PROPERTIES IN CARBONATE RESERVOIRS FOR FLOW-UNIT TARGETING SEMI-ANNUAL TECHNICAL REPORT
 TITLE: MULTIDISCIPLINARY IMAGING OF ROCK PROPERTIES IN CARBONATE RESERVOIRS FOR FLOW-UNIT TARGETING SEMI-ANNUAL TECHNICAL REPORT Reporting Period: 5/16/02 11/15/02 Author: Stephen C. Ruppel January 2003
AC dipole based optics measurement and correction at RHIC
 BNL-1132-213-CP AC dipole based optics measurement and correction at RHIC X. Shen, S. Y. Lee Indiana University of Bloomington, IN 4745, USA M. Bai, S. White, G. Robert-Demolaize, Y. Luo, A. Marusic BNL,
Analysis of Shane Telescope Aberration and After Collimation
 UCRL-ID- 133548 Analysis of Shane Telescope Aberration and After Collimation Before Don Gavel January 26,1999 This is an informal report intended primarily for internal or limited external distribution.
There is no pure P- or S-wave land seismic source André J.-M. Pugin*, Geological Survey of Canada, and Oz Yilmaz, Anatolian Geophysical
 There is no pure P- or S-wave land seismic source André J.-M. Pugin*, Geological Survey of Canada, and Oz Yilmaz, Anatolian Geophysical Summary: We conducted a field experiment at a soil site near Ottawa
Three-Dimensional Silicon Photonic Crystals
 Three-Dimensional Silicon Photonic Crystals Shawn-Yu Lin'*, J. G. Fleming', D.L. Hetherington', B.K. Smith', W. Zubrzycki', R. Biswas2, M.M. Sigalas2, and K.M. Ho2. 'Sandia National Laboratories, P.O.
MAGNETIC RESONANCE IMAGING OF SOLVENT TRANSPORT IN POLYMER NETWORKS
 * - 9 I MAGNETIC RESONANCE IMAGING OF SOLVENT TRANSPORT IN POLYMER NETWORKS Robert E. Botto and George D. Cody Chemistry Division, Argonne National Laboratory The spectroscopic technique of magnetic resonance
Illinois Industrial Carbon Capture & Storage Project
 Illinois Industrial Carbon Capture & Storage Project Eliminating CO 2 Emissions from the Production of Bio Fuels - A Green Carbon Process IEA Bio-CCUS Workshop May 10, 2016 Scott McDonald Biofuels Development
Synthesis of Methyl Methacrylate from Coal-derived Syngas
 Report Title: Synthesis of Methyl Methacrylate from Coal-derived Syngas Report Type: QUARTERLY Reporting Period Start Date: 01/01/1999 End Date: 03/31/1999 Principal Author(s): Makarand R. Gogate and James
Improving Resolution with Spectral Balancing- A Case study
 P-299 Improving Resolution with Spectral Balancing- A Case study M Fatima, Lavendra Kumar, RK Bhattacharjee, PH Rao, DP Sinha Western Offshore Basin, ONGC, Panvel, Mumbai Summary: The resolution limit
Inside Wall Temperature Measurements of DSTs Using an Infrared Temperature Sensor
 TEST PLAN Inside Wall Temperature Measurements of DSTs Using an Infrared Temperature Sensor Date submitted: December 18, 2015 Prepared by: Aparna Aravelli, Ph.D. Florida International University Collaborators:
PROCEEDINGS THIRD WORKSHOP GEOTHERMAL RESERVOIR ENGINEERING. December 14-15,1977
 SGPTR258 PROCEEDINGS THIRD WORKSHOP GEOTHERMAL RESERVOIR ENGINEERING December 1415,1977 *Conducted under Subcontract No. 16735 with Lawrence Berkeley Laboratory, Universityof California, sponsored by the
Department of Petroleum Engineering.
 DEVELOPMENT OF COSTEFFECTVE SURFACTANT FLOODNG TECHNOLOGY Quarterly Report for the Period April 1995 June 1995 BY Gary A. Pope Texaco Centennial Chair in Petroleum Engineering Kamy Sepehmoori Frank W.
DE-FG22-92PC October 1,1995 -December 31,1995. Principal Investigators. Aydin AKGERMAN Dragomir B. BUKUR
 FSCHERTROPSCH SYNTHESS N SUPERCRTCAL F'LUDS DE-FG22-92PC92545 QUARTERLY TECHNCAL PROGRESS REPORT October 1,1995 -December 31,1995 Principal nvestigators Aydin AKGERMAN Dragomir B. BUKUR Chemical Engineering
Monte Carlo Simulation of Ferroelectric Domain Structure: Electrostatic and Elastic Strain Energy Contributions
 f.... Monte Carlo Simulation of Ferroelectric Domain Structure: Electrostatic and Elastic Strain Energy Contributions o (n -+ B.G. Potter, Jr., B.A. Tuttle, and V. Tikare Sandia National Laboratories Albuquerque,
GA A23736 EFFECTS OF CROSS-SECTION SHAPE ON L MODE AND H MODE ENERGY TRANSPORT
 GA A3736 EFFECTS OF CROSS-SECTION SHAPE ON L MODE AND H MODE ENERGY TRANSPORT by T.C. LUCE, C.C. PETTY, and J.E. KINSEY AUGUST DISCLAIMER This report was prepared as an account of work sponsored by an
FUNDAMENTALS OF SEISMIC EXPLORATION FOR HYDROCARBON
 FUNDAMENTALS OF SEISMIC EXPLORATION FOR HYDROCARBON Instructor : Kumar Ramachandran 10 14 July 2017 Jakarta The course is aimed at teaching the physical concepts involved in the application of seismic
Data Comparisons Y-12 West Tower Data
 Data Comparisons Y-12 West Tower Data Used hourly data from 2007 2010. To fully compare this data to the data from ASOS sites where wind sensor starting thresholds, rounding, and administrative limits
Apache Egypt Companies. The introduction of 3D seismic techniques three decades ago greatly enhanced our
 Structure architecture interpretation of the middle Frio Formation using 3D seismic attributes and well logs: an example from the Texas Gulf Coast of the United States HAMED EL-MOWAFY 1 and KURT J. MARFURT
Synthetic Seismogram A Tool to Calibrate PP & PS Seismic Data
 P-475 Summary Synthetic Seismogram A Tool to Calibrate PP & PS Seismic P. Sugadha*, M. K. Jain, M. Singh, ONGC Conventional P wave technology will not meet all the requirements of the industry. Hence,
Lima Project: Seismic Refraction and Resistivity Survey. Alten du Plessis Global Geophysical
 Lima Project: Seismic Refraction and Resistivity Survey Alten du Plessis Global Geophysical Report no 0706/2006 18 December 2006 Lima Project: Seismic Refraction and Resistivity Survey by Alten du Plessis
GA A26686 FAST ION EFFECTS DURING TEST BLANKET MODULE SIMULATION EXPERIMENTS IN DIII-D
 GA A26686 FAST ION EFFECTS DURING TEST BLANKET MODULE SIMULATION EXPERIMENTS IN DIII-D by G.J. KRAMER, B.V. BUDNY, R. ELLIS, W.W. HEIDBRINK, T. KURKI-SUONIO, R. NAZIKIAN, A. SALMI, M.J. SCHAFFER, K. SHINOHARA,
The Impacts of Carbon Dioxide Storage in the Saline Arbuckle Aquifer on Water Quality in Freshwater Aquifers in Kansas
 The Impacts of Carbon Dioxide Storage in the Saline Arbuckle Aquifer on Water Quality in Freshwater Aquifers in Kansas Tiraz Birdie, Lynn Watney, Paul Gerlach, Michael Killion, Jennifer Raney, Eugene Holubnyak,
Curvature of a Cantilever Beam Subjected to an Equi-Biaxial Bending Moment. P. Krulevitch G. C. Johnson
 UCRL-JC-30440 PREPRINT Curvature of a Cantilever Beam Subjected to an Equi-Biaxial Bending Moment P. Krulevitch G. C. Johnson This paper was prepared for submittal to the Materials Research Society Spring
Pluto 1.5 2D ELASTIC MODEL FOR WAVEFIELD INVESTIGATIONS OF SUBSALT OBJECTIVES, DEEP WATER GULF OF MEXICO*
 Pluto 1.5 2D ELASTIC MODEL FOR WAVEFIELD INVESTIGATIONS OF SUBSALT OBJECTIVES, DEEP WATER GULF OF MEXICO* *This paper has been submitted to the EAGE for presentation at the June 2001 EAGE meeting. SUMMARY
Constant of Motion for a One- Dimensional and nth-order Autonomous System and Its Relation to the Lagrangian and Hamiltonian
 in u a, IK u SSCL-Preprint-543 December 1993 Distribution Category: 414 G. Lopez Constant of Motion for a One- Dimensional and nth-order Autonomous System and Its Relation to the Lagrangian and Hamiltonian
GA A THERMAL ION ORBIT LOSS AND RADIAL ELECTRIC FIELD IN DIII-D by J.S. degrassie, J.A. BOEDO, B.A. GRIERSON, and R.J.
 GA A27822 THERMAL ION ORBIT LOSS AND RADIAL ELECTRIC FIELD IN DIII-D by J.S. degrassie, J.A. BOEDO, B.A. GRIERSON, and R.J. GROEBNER JUNE 2014 DISCLAIMER This report was prepared as an account of work
Complex component analysis of shear-wave splitting: theory
 Geophys. J. Int. (1991) 17, 597-64 Complex component analysis of shear-wave splitting: theory Xiang-Yang Li1,2 and Stuart Crampid ' Edinburgh Anisotropy Project, British Geological Survey, Murchison House,
SECARB Phase III ANTHROPOGENIC TEST: Risk Management through Detailed Geologic Characterization and Modeling
 SECARB Phase III ANTHROPOGENIC TEST: Risk Management through Detailed Geologic Characterization and Modeling Prepared by: David Riestenberg, George Koperna, and Vello Kuuskraa, Advanced Resources International,
Walkaway Seismic Experiments: Stewart Gulch, Boise, Idaho
 Walkaway Seismic Experiments: Stewart Gulch, Boise, Idaho Lee M. Liberty Center for Geophysical Investigation of the Shallow Subsurface Boise State University Boise, Idaho 1. Summary CGISS conducted walkaway
Application of Seismic Reflection Surveys to Detect Massive Sulphide Deposits in Sediments-Hosted Environment
 IOSR Journal of Applied Geology and Geophysics (IOSR-JAGG) e-issn: 2321 0990, p-issn: 2321 0982.Volume 3, Issue 4 Ver. I (Jul - Aug. 2015), PP 46-51 www.iosrjournals.org Application of Seismic Reflection
Multi-Scale Chemical Process Modeling with Bayesian Nonparametric Regression
 Multi-Scale Chemical Process Modeling with Bayesian Nonparametric Regression Evan Ford, 1 Fernando V. Lima 2 and David S. Mebane 1 1 Mechanical and Aerospace Engineering 2 Chemical Engineering West Virginia
Improved Interpretability via Dual-sensor Towed Streamer 3D Seismic - A Case Study from East China Sea
 Improved Interpretability via Dual-sensor Towed Streamer 3D Seismic - A Case Study from East China Sea S. Rongfu (CNOOC Shanghai), C. Hua (CNOOC Shanghai), W. Yun (CNOOC Shanghai), Z. Yabin (CNOOC Shanghai),
Scaling between K+ and proton production in nucleus-nucleus collisions *
 Proc. Quark Matter 95 Monterey, CA January 9-, 9 9 5 I BNL-6 55 Scaling between K+ and proton production in nucleus-nucleus collisions * Ziping Chen and Chellis Chasman Dept. of Physics, Brookhaven National
Microseismic data illuminate fractures in the Montney
 Spectraseis White Paper August 16, 2012 2013 Spectraseis Microseismic data illuminate fractures in the Montney Brad Birkelo and Konrad Cieslik, Spectraseis High-quality data reveal fracture orientation
RECEIVED SEQ
 SHOCK HUGONOT AND RELEASE STATES N CONCRETE MXTURES WTH DFFERENT AGGREGATE SZES FROM Y 3 TO 23 GPA C. A. Hall, L. C. Chhabildas, and W. D. Reinhart Sandia National Laboratories, Albuquerque, NM 87185-1
UPGRADED CALIBRATIONS OF THE THOMSON SYSTEM AT DIII D
 GA A23440 UPGRADED CALIBRATIONS OF THE THOMSON SYSTEM AT DIII D by B. BRAY, C. HSIEH, T.N. CARLSTROM, and C.C. MAKARIOU AUGUST 2000 DISCLAIMER This report was prepared as an account of work sponsored by
technical article Satinder Chopra 1*, Kurt J. Marfurt 2 and Ha T. Mai 2
 first break volume 27, October 2009 technical article Using automatically generated 3D rose diagrams for correlation of seismic fracture lineaments with similar lineaments from attributes and well log
RICE COAL COMBUSTION: EFFECT OF PROCESS CONDITIONS ON CHAR REACTIVITY. Quarterly Technical Report Performance Period: 10/1/94 42/31/94 (Quarter #13)
") RICE COAL COMBUSTION: EFFECT OF PROCESS CONDITIONS ON CHAR REACTIVITY Quarterly Technical Report Performance Period: 1/1/94 42/31/94 (Quarter #13) Submitted to the Department of Energy Grant Number DE-FG22-91PC9137
RICE COAL COMBUSTION: EFFECT OF PROCESS CONDITIONS ON CHAR REACTIVITY Quarterly Technical Report Performance Period: 1/1/94 42/31/94 (Quarter #13) Submitted to the Department of Energy Grant Number DE-FG22-91PC9137
Final Technical Report. Department of Energy. for
 Final Technical Report to Department of Energy for Project: The Screening of the Lamb Ship in Heavy Helium-like Ions Grant No.: DE-FG04-95SF20579 submitted by Derrick J. Hylton Associate Professor of Physics
GEOPHYSICAL PROSPECTING: DYNAMIC RESERVOIR CHARACTERIZATION AND TIME-LAPSE MULTICOMPONENT SEISMOLOGY FOR RESERVOIR MONITORING UNESCO EOLSS
 GEOPHYSICAL PROSPECTING: DYNAMIC RESERVOIR CHARACTERIZATION AND TIME-LAPSE MULTICOMPONENT SEISMOLOGY FOR RESERVOIR MONITORING Steven L. Roche CGGVeritas, Multicomponent Processing & Technology Group Thomas
Alex Dombos Michigan State University Nuclear and Particle Physics
 Nuclear Science and Security Consortium September Workshop and Advisory Board Meeting The impact of prompt neutron emission from fission fragments on the final abundance pattern of the astrophysical r-process
A Case Study on Simulation of Seismic Reflections for 4C Ocean Bottom Seismometer Data in Anisotropic Media Using Gas Hydrate Model
 A Case Study on Simulation of Seismic Reflections for 4C Ocean Bottom Seismometer Data in Anisotropic Media Using Gas Hydrate Model Summary P. Prasada Rao*, N. K. Thakur 1, Sanjeev Rajput 2 National Geophysical
The temperature dependence of the C1+ propylene rate coefficient and the Arrhenius fit are shown in Figure 1.
 t ' i!, ' nfrared Absorption Measurements of the Kinetics of C1 atom Reactions with C,H, (n=4,6)unsaturated Hydrocarbons between 300550 K. John T. Farrell, Jeffrey S. Pilgrim, and Craig A. Taatjes Combustion
National Accelerator Laboratory
 Fermi National Accelerator Laboratory FERMILAB-Conf-99/278-T The Heavy Hybrid Spectrum from NRQCD and the Born-Oppenheimer Approximation K.J. Juge, J. Kuti and C.J. Morningstar Fermi National Accelerator
Seismic modeling evaluation of fault illumination in the Woodford Shale Sumit Verma*, Onur Mutlu, Kurt J. Marfurt, The University of Oklahoma
 Seismic modeling evaluation of fault illumination in the Woodford Shale Sumit Verma*, Onur Mutlu, Kurt J. Marfurt, The University of Oklahoma Summary The Woodford Shale is one of the more important resource
UTC R189 GEOPHYSICAL ASSESSMENT OF KARST ACTIVITY. Neil L. Anderson
 GEOPHYSICAL ASSESSMENT OF KARST ACTIVITY by Neil L. Anderson UTC R189 A University Transportation Center Program at Missouri University of Science & Technology Disclaimer The contents of this report reflect
PRECISION STUDIES OF NUCLEI
 .., -: PRECISION STUDIES OF NUCLEI Final Report September 1, 1994- December 31, 1996 Paul E. Ulmer, Principal Investigator Department of Physics Old Dominion University Norfolk, VA 23529 Report Date: February
LABORATORY MEASUREMENT OF PERMEABILITY UPSCALING:- R FOR THE TOPOPAH SPRING MEMBER OF THE PAINTBRUSH TUFF
 c J LABORATORY MEASUREMENT OF PERMEABILITY UPSCALING:- R FOR THE TOPOPAH SPRING MEMBER OF THE PAINTBRUSH TUFF Vincent C. Tidwell Sandia National Laboratories Geohydrology Department, MS 1324 Albuquerque,
Peak Reliability Delivering near real-time phase angle deltas using Inter-Control Center Communication Protocol (ICCP)
") Peak Reliability Delivering near real-time phase angle deltas using Inter-Control Center Communication Protocol (ICCP) NASPI meeting March 23, 2015 Dan Brancaccio 1 Peak Reliability Synchrophasor Program
Peak Reliability Delivering near real-time phase angle deltas using Inter-Control Center Communication Protocol (ICCP) NASPI meeting March 23, 2015 Dan Brancaccio 1 Peak Reliability Synchrophasor Program
GA A27857 IMPACT OF PLASMA RESPONSE ON RMP ELM SUPPRESSION IN DIII-D
 GA A27857 IMPACT OF PLASMA RESPONSE ON RMP ELM SUPPRESSION IN DIII-D by A. WINGEN, N.M. FERRARO, M.W. SHAFER, E.A. UNTERBERG, T.E. EVANS, D.L. HILLIS, and P.B. SNYDER JULY 2014 DISCLAIMER This report was
DE '! N0V ?
 "7 CONF-851174 24 DE86 004682 '! N0V26 1985? PREDICTION OF FLOW RATES THROUGH AN ORIFICE AT PRESSURES CORRESPONDING TO THE TRANSITION BETWEEN MOLECULAR AND ISENTROPIC FLOW S. F. DeMuth Fuel Recycle Division
ADM CCS Projects Experience and Lessons Learned
 ADM CCS Projects Experience and Lessons Learned CSLF Technical Workshop June 17, 2015 Scott McDonald Biofuels Development Director scott.mcdonald@adm.com Acknowledgements The Industrial Carbon Capture
GA A22722 CENTRAL THOMSON SCATTERING UPGRADE ON DIII D
 GA A22722 CENTRAL THOMSON SCATTERING UPGRADE ON DIII D by D.G. NILSON, T.N. CARLSTROM, C.L. HSIEH, B.W. STALLARD, and R.E. STOCKDALE NOVEMBER 1997 DISCLAIMER This report was prepared as an account of work
Solid Phase Microextraction Analysis of B83 SLTs and Core B Compatibility Test Units
 UCRL-JC-133766 PREPRINT Solid Phase Microextraction Analysis of B83 SLTs and Core B Compatibility Test Units David M. Chambers Steve Malcolm Jerry Ithaca Heather A. King This paper was prepared for submittal
Knott, M. May Future t r e n d s
 0.S'T 1 Knott, M. May 1 9 9 0 M. K r a h e r, and F. Lenkszus A P S CONTROL SYSTEM OPERATING SYSTEM CHOICE Contents: Introduction What i s t h e o p e r a t i n g system? A P S c o n t r o l system a r
GA A25853 FAST ION REDISTRIBUTION AND IMPLICATIONS FOR THE HYBRID REGIME
 GA A25853 FAST ION REDISTRIBUTION AND IMPLICATIONS FOR THE HYBRID REGIME by R. NAZIKIAN, M.E. AUSTIN, R.V. BUDNY, M.S. CHU, W.W. HEIDBRINK, M.A. MAKOWSKI, C.C. PETTY, P.A. POLITZER, W.M. SOLOMON, M.A.
ASTER CONF-~W OSTI MAY DISTRIBUTION OF THIS
 PLUTONIUM STABILIZATION AND STORAGE RESEARCH IN THE DNFSB 94-1 CORE TECHNOLOGY PROGRAM P. Gary Elle9, Larry R. Avensa and Gary D. Robersonb a) Advanced Technology Group Nuclear Materials Technology Division
GA A26057 DEMONSTRATION OF ITER OPERATIONAL SCENARIOS ON DIII-D
 GA A26057 DEMONSTRATION OF ITER OPERATIONAL SCENARIOS ON DIII-D by E.J. DOYLE, J.C. DeBOO, T.A. CASPER, J.R. FERRON, R.J. GROEBNER, C.T. HOLCOMB, A.W. HYATT, G.L. JACKSON, R.J. LA HAYE, T.C. LUCE, G.R.
Search and Discovery Article # (2015) Posted April 20, 2015
 Posted April 20, 2015") Considering the Vertical Variation in Rock Mechanical Properties of a Lithologic Zone Using Laboratory Derived Data Is it Time for Geomechanical Stratigraphy?* Douglas E. Wyatt 1, Jesse Hampton 1, Dandan
Considering the Vertical Variation in Rock Mechanical Properties of a Lithologic Zone Using Laboratory Derived Data Is it Time for Geomechanical Stratigraphy?* Douglas E. Wyatt 1, Jesse Hampton 1, Dandan
CQNl_" RESPONSE TO 100% INTERNAL QUANTUM EFFICIENCY SILICON PHOTODIODES TO LOW ENERGY ELECTRONS AND IONS
 I ' 4 46 Title: CQNl_"- 461123-1.2 RESPONSE TO 100% INTERNAL QUANTUM EFFICIENCY SILICON PHOTODIODES TO LOW ENERGY ELECTRONS AND IONS A uthor(s): H. 0. Funsten D. M. Suszcynsky R. Korde S. M. Ritzau Submitted
SciDAC CENTER FOR SIMULATION OF WAVE-PLASMA INTERACTIONS
 SciDAC CENTER FOR SIMULATION OF WAVE-PLASMA INTERACTIONS GA A27760 ITERATED FINITE-ORBIT MONTE CARLO SIMULATIONS WITH FULL-WAVE FIELDS FOR MODELING TOKAMAK ICRF WAVE HEATING EXPERIMENTS Final Report for
Equivalencing the Collector System of a Large Wind Power Plant
 Equivalencing the Collector System of a Large Wind Power Plant Presenter: Ed Muljadi National Wind Technology Center National Renewable Energy Laboratory Golden, Colorado USA IEEE Power Engineering Society
GA A27805 EXPANDING THE PHYSICS BASIS OF THE BASELINE Q=10 SCENRAIO TOWARD ITER CONDITIONS
 GA A27805 EXPANDING THE PHYSICS BASIS OF THE BASELINE Q=10 SCENRAIO TOWARD ITER CONDITIONS by T.C. LUCE, G.L. JACKSON, T.W. PETRIE, R.I. PINSKER, W.M. SOLOMON, F. TURCO, N. COMMAUX, J.R. FERRON, A.M. GAROFALO,
EXPLOSIVE PARTICLES PARVLENE ENCAPSUTION. lac0 b Sando v a t. Normal Process Development OCTOBER DEVEZOPMENT D I V I S I O N DEZEMBER 1971
 ENCAPSUTION OF EXPLOSIVE PARTICLES lac0 b Sando v a t DEVEZOPMENT D I V I S I O N OCTOBER - DEZEMBER 1971 Normal Process Development BY PARVLENE DISCLAIMER This report was prepared as an account of work
PLASMA MASS DENSITY, SPECIES MIX AND FLUCTUATION DIAGNOSTICS USING FAST ALFVEN WAVE
 G A-A22340 PLASMA MASS DENSITY, SPECIES MIX AND FLUCTUATION DIAGNOSTICS USING FAST ALFVEN WAVE by H. IKEZI, J.S. degrassie, R.1. PINSKER, and RET. SNIDER JUNE 1996 GENERAL ATOMICS DISCLAIMER I This report
LLNL DATA COLLECTION DURING NOAAETL COPE EXPERIMENT
 UCRL-ID-121682 LLNL DATA COLLECTION DURING NOAAETL COPE EXPERIMENT Test Plan David D. Manfrom Imaging & Detection Program September 6,1995 This is an informal report intended primarily for internal or