Seismic Characterization of Coal-Mining Seismicity in Utah for CTBT Monitoring
|
|
|
- Roy Merritt
- 5 years ago
- Views:
Transcription
1 UCRL-CR FINAL REPORT LLNL Research Agreement No. B Seismic Characterization of Coal-Mining Seismicity in Utah for CTBT Monitoring Prepared for Lawrence Livermore National Laboratory University of California Livermore, California Prepared by Walter J. Arabasz 1 and James C. Pechmann 1 with contributions from Michael K. McCarter 2 and Jefferson D. McKenzie 2 March 1, University of Utah Seismograph Stations Department of Geology and Geophysics University of Utah 135 South 1460 East, Room 705 WBB Salt Lake City, Utah Department of Mining Engineering University of Utah 135 South 1460 East, Room 313 WBB Salt Lake City, Utah 84112
2 DISCLAIMER This document was prepared as an account of work to the University of California Lawrence Livermore National Laboratory for research sponsored by an agency of the United States Government. Neither the United States Government nor the University of California nor the University of Utah nor any of their employees, makes any warranty, express or implied, or assumes any legal liability or responsibility for the accuracy, completeness, or usefulness of any information, apparatus, product, process, or process disclosed, or represents that its use would not infringe privately owned rights. Reference herein to any specific commercial product, process, or service by trade name, trademark, manufacturer, or otherwise, does not necessarily constitute or imply its endorsement, recommendation, or favoring by the United States Government or the University of California or the University of Utah. The views, opinions, and conclusions expressed herein are those of the authors and do not necessarily state or reflect those of the United States Government or the University of California or the University of Utah and shall not be used for advertising or product endorsement purposes.
3 TABLE OF CONTENTS EECUTIVE SUMMARY... i ACKNOWLEDGMENTS... v 1.0 INTRODUCTION Objectives and Scope of Work BROADBAND DIGITAL SEISMIC STATION (SRU) Installation Calibration Recording, Processing, and Archiving of Data Significance of Data for CTBT Monitoring MINING SEISMICITY AND GROUND TRUTH AN UPDATE Continuous Monitoring and Incident Reports to LLNL Developing a Homogeneous Catalog Methodology Revised Catalog Focal Depths Association of Seismicity with Mining Spatial Association Temporal Association Ground Truth for Significant Events MECHANISMS OF SIGNIFICANT SEISMIC EVENTS Overview Events Analyzed and Presentation of Results Velocity Models for Focal Mechanisms The Willow Creek Composite Velocity Model The Trail Mountain Composite Velocity Model Shear-Slip Events in the WP-BC Area The M L 4.2 Seismic Event Near the Willow Creek Mine on March 7, The M L 3.8 Seismic Event Near Willow Creek Mine on February 5, The M L 3.0 Seismic Event in the Northern Wasatch Plateau on June 2, Possible Collapse-Type Events in the WP-BC Area Event #2 M L 3.8, Gentry Mountain Area, May 14, Page
4 TABLE OF CONTENTS (cont) 4.32 Event #4 M L 3.5, East Mountain Area, July 5, Eleven Other Seismic Events Having Only Dilatational P-wave First Motions General Observations and Conclusions Three Seismic Events (M L ) in the Trona Mining District of Southwest Wyoming, January-August, REFERENCES LIST OF TABLES Table 2-1 Table 3-1 Table 3-2 Table 3-3 Table 3-4 Table 4-1 Table 4-2 Table 4-3 Table 4-4 Hardware and Calibration Information for Station SRU Correction Terms Used by Arabasz et al. (1997) for Revised Coda Magnitudes, M C, in the Wasatch Plateau-Book Cliffs Area Correction Terms Used in This Report, Following Arabasz and Wyss (1999), for Revised Coda Magnitudes, M C, in the Wasatch Plateau-Book Cliffs Area Seismic Events of Magnitude 3.0 or Greater in the WP-BC Coal-Mining Area, January 1978-June 2000, Ranked by Size Information for Sample Areas in Figure 3-15 Used to Investigate the Association of Seismicity with Mining in the WP-BC Area During the Period Focal-Mechanism and Summary Information for Seismic Events of Magnitude 3.0 or Larger in the WP-BC Coal-Mining Area, January 1978-June 2000, Ranked by Size The Willow Creek Composite Velocity Model The Trail Mountain Composite Velocity Model Data for Seismic Events in Table 4-1 Having Only Dilatational P-Wave First Motions Table 4-5 Location and Focal Mechanism Information for Seismic Events of Magnitude 3.0 or Larger in the Trona-Mining District of Southwestern Wyoming, January - August 2000
5 TABLE OF CONTENTS (cont) LIST OF FIGURES Figure 1-1 Figure 1-2 Figure 2-1 Figure 2-2 Figure 2-2 Figure 2-2 Figure 3-1. Figure 3-2 Figure 3-3 Figure 3-4 Figure 3-5 Figure 3-6 Figure 3-7 Figure 3-8 Seismicity map of the Utah region, , showing the location and setting of the Wasatch Plateau-Book Cliffs coal mining region. Location map of coal mines in the Wasatch Plateau and Book Cliffs coal fields. Installation diagram for the broadband, 3-component, Guralp CMG-3T seismometer at the digital telemetry station SRU. The four steps in the calibration procedure used to check and revise the manufacturer-supplied instrument response parameters for station SRU. (continued). (continued). Location map of seismograph stations making up the University of Utah regional seismic network, July Map showing the location of the Wasatch Plateau-Book Cliffs study area with respect to the distribution of stations in the University of Utah regional seismic network in 1994 (from Arabasz et al., 1997). Existing and planned seismograph stations in the Wasatch Plateau-Book Cliffs area, July Plots comparing values of corrected coda-duration magnitude (M C ) to measured values of local Richter magnitude (M L ). Epicenter map of all seismic events located by the University of Utah regional seismic network in the WP-BC coal mining region from January 1, 1978, through June 30, Epicenter map of mining-related seismicity in the WP-BC coal mining region for the year Epicenter map of mining-related seismicity in the WP-BC coal mining region for the year Epicenter map of mining-related seismicity in the WP-BC coal mining region for the year 1994.
6 TABLE OF CONTENTS (cont) Figure 3-9 Figure 3-10 Figure 3-11 Figure 3-12 Figure 3-13 Figure 3-14 Figure 3-15 Figure 3-16 Figure 3-17 Figure 3-18 Figure 3-19 Figure 3-20 Figure 3-21 Figure 4-1 Epicenter map of mining-related seismicity in the WP-BC coal mining region for the year Epicenter map of mining-related seismicity in the WP-BC coal mining region for the year Epicenter map of mining-related seismicity in the WP-BC coal mining region for the year Epicenter map of mining-related seismicity in the WP-BC coal mining region for the year Epicenter map of mining-related seismicity in the WP-BC coal mining region for the year Epicenter map of mining-related seismicity in the WP-BC coal mining region for January through June Index map, keyed to Table 3-4, outlining areas of concentrated mining-related seismicity for which detailed characterizations are shown in Figures 3-16 through Temporal characterization of seismicity and coal production for S. Wasatch Plateau and S. Joes Valley sample areas identified in Figure Temporal characterization of seismicity and coal production for East Mountain and Rilda Canyon sample areas identified in Figure Temporal characterization of seismicity and coal production for Lower and Upper Huntington Canyon sample areas identified in Figure Temporal characterization of seismicity and coal production for Gentry Mountain and Pleasant Valley sample areas identified in Figure Temporal characterization of seismicity and coal production for Castle Gate and W. Book Cliffs sample areas identified in Figure Temporal characterization of seismicity and coal production for Central Book Cliffs and E. Book Cliffs sample areas identified in Figure Source mechanisms of mine seismicity.
7 TABLE OF CONTENTS (cont) Figure 4-2 Figure 4-3 Figure 4-4 Figure 4-5 Figure 4-6 Figure 4-7 Figure 4-8 Figure 4-9 Figure 4-10 Epicenter map (keyed to Table 4-1) of seismic events of magnitude 3.0 or larger in the WP-BC coal mining region, January 1978 through June Plots of reduced travel time, time (sec) distance (km)/5.9 km/sec, versus distance in km for the March 7, 2000, M L 4.2 Willow Creek earthquake. Plots of reduced travel time (reducing velocity is 5.9 km/sec) versus distance for the July 5, 1992, seismic event in the East Mountain area. Focal mechanisms for the March 7, 2000, M L 4.2 Willow Creek earthquake determined for three different focal depths. Focal mechanism for the February 5, 1998, M L 3.8 Willow Creek earthquake determined for a fixed focal depth of 0.62 km. Focal mechanism for the June 2, 1996, M L 3.0 earthquake in the northern Wasatch Plateau, computed for the well-constrained focal depth of 11.0 ± 1.5 km (95% confidence limits). Focal mechanisms for the May 14, 1981, M L 3.8 earthquake in the Gentry Mountain area at three different focal depths. Focal mechanisms for the July 5, 1992, M L 3.5 earthquake in the East Mountain area at three different focal depths. Comparison of SRU broadband recordings of the three seismic events in the trona mining area of southwestern Wyoming listed in Table 4-5. APPENDICES Appendix A Appendix B Appendix C List of Mining-related Seismic Events M 2.5 in the Wasatch Plateau-Book Cliffs Coal Mining Districts, January 1, 1978 to June 30, 2000 Quarterly Coal Mine Production for Mines in the Wasatch Plateau-Book Cliffs Coal Mining Districts, Compiled by Jefferson D. McKenzie Documentation of Ground Truth for Significant Seismic Events Related to Underground Mining in Utah and Wyoming by Michael K. McCarter
8 EECUTIVE SUMMARY Underground coal mining (down to ~0.75 km depth) in the contiguous Wasatch Plateau (WP) and Book Cliffs (BC) mining districts of east-central Utah induces abundant seismicity that is monitored by the University of Utah regional seismic network. This report presents the results of a systematic characterization of mining seismicity (magnitude 4.2) in the WP-BC region from January 1978 to June 2000 together with an evaluation of three seismic events (magnitude 4.3) associated with underground trona mining in southwestern Wyoming during January-August (Unless specified otherwise, magnitude implies Richter local magnitude, M L.) The University of Utah Seismograph Stations (UUSS) undertook this cooperative project to assist the University of California Lawrence Livermore National Laboratory (LLNL) in research and development relating to monitoring the Comprehensive Test Ban Treaty (CTBT). The project, which formally began February 28, 1998, and ended September 1, 2000, had three basic objectives: 1. Strategically install a three-component broadband digital seismic station in the WP-BC region to ensure the continuous recording of high-quality waveform data to meet the long-term needs of LLNL, UUSS, and other interested parties, including the international CTBT community. 2. Determine source mechanisms to the extent that available source data and resources allowed for comparative seismic characterization of stress release in mines versus earthquakes in the WP-BC study region. 3. Gather and report to LLNL local information on mine operations and associated seismicity, including ground truth for significant events. Following guidance from LLNL s Technical Representative, the focus of Objective 2 was changed slightly to place emphasis on three mining-related events that occurred in and near the study area after the original work plan had been made, thus posing new targets of opportunity. These included: a magnitude 3.8 shock that occurred close to the Willow Creek coal mine in the Book Cliffs area on February 5, 1998 (UTC date), just prior to the start of this project; a magnitude 4.2 shock on March 7, 2000 (UTC date), in the same area as the February 5 event; and a magnitude 4.3 shock that occurred on January 30, 2000 (UTC and local date), associated with a panel collapse at the Solvay trona mine in southwestern Wyoming. This is the same mine in which an earlier collapse event of magnitude 5.2 occurred in February 1995, attracting considerable attention from the CTBT community. Objective 1 Objective 1 was successfully met with the completed installation (described in detail in section 2) of a high-quality, three-component, broadband digitally telemetered seismograph station in the San Rafael Swell, Utah (SRU) on September 9, Station SRU ( N, i
9 W, 1804 m elevation) is located at a roughly uniform distance of km from the active mines in the arcuate WP-BC coal-mining region. This distance enables good recordings of larger mine tremors (magnitude 3.0), which are of primary interest, with minimal interference from more frequent smaller-magnitude events (hundreds per day) that occur in the coal fields. Seismographic equipment at station SRU includes a Guralp CMG-3T broadband seismometer, with a flat velocity response from.01 to 50 Hz, and a 24-bit REF TEK 72A-07 data logger. The signal from the seismometer is digitized at 100 samples/sec and is continuously transmitted to the UUSS central recording laboratory in Salt Lake City where data are recorded using an Earthworm data-acquisition system. Instrumental response to ground motion was carefully calibrated, and calibration details are described in section 2. Waveform data from station SRU are made publicly available in two ways. First, the UUSS Earthworm system routinely exports triggered 40 sample/sec waveform data from station SRU and other selected stations via an Internet link to the U.S. National Seismograph Network (USNSN) data center in Golden, Colorado. These data are available from the data center via the USNSN AutoDRM system. Second, since June 19, 2000, continuous data files from station SRU and other selected UUSS stations have been converted to SEED format and sent daily via FTP to the IRIS Data Management Center in Seattle, Washington, where the data are permanently archived and made available to all interested users. Objective 3 (Background for Objective 2) Information on seismic monitoring and mining seismicity in the WP-BC region is presented in section 3. We extend and update information earlier summarized by Arabasz et al. (1997) in order to provide a useful reference for LLNL researchers as well as other interested parties. We describe the University of Utah s current monitoring capabilities and summarize incident reports communicated to LLNL during the course of this project. These reports concerned seven seismic events of magnitude 3 or larger that occurred between February 1998 and August In section 3 we also describe our methodology for creating a catalog of mining seismicity in the WP-BC region for the period January 1, 1978-June 30, 2000 with revised, homogeneous magnitudes. A complete listing of all seismic events (N=148) of magnitude 2.5 or larger in this catalog is presented in Appendix A. Using the refined catalog (6851 events; 95 percent magnitude 1.3) together with updated information on coal production (summarized in Appendix B), we present numerous plots and briefly discuss the spatial and temporal association of seismicity with mining in the WP-BC area. Figures include annual epicenter maps from 1992 through mid-2000 and composite time-series plots for 12 local areas where clustered seismicity coincides with sites of active mining. For each sample area, the timehistory plots show quarterly coal production, quarterly counts of seismic events above a threshold magnitude, and the magnitudes of individual events. ii
10 A magnitude 4.2 shock that occurred in the BC district on March 7, 2000 (more below) is the largest seismic event to have originated in the WP-BC mining region since at least mid-1962, when instrumental seismic monitoring began. Mining-related seismic events in the magnitude 3 range have occurred throughout most of the WP-BC mining region, associated with sites of both longwall and room-and-pillar mining. There is an evident spatial association of clustered epicenters with sites of active mining in the WP-BC area. Epicentral clustering in the WP mining district is generally tighter and more intense than in the BC district, due to better epicentral control and higher extraction rates at mines in the WP district during the sample period. Seismic events located in the WP-BC area by the University of Utah s regional seismic network have poorly constrained focal depths because of the relatively large station spacing. Nevertheless, combined evidence from (a) an analysis of focal-depth resolution, (b) data from local studies, and (c) the spatial and temporal association of seismicity with active mining allows and suggests that the vast majority (> 95 percent) of the observed seismicity in the WP-BC coal fields is shallow, probably occurs either at or within hundreds of meters above or below mine level, and is mining-related. Temporal variations in observed seismic activity in the WP-BC area correlate simply in some cases with the start or completion of mining. In other cases, where extraction was relatively continuous over several years, seismic activity has occurred in distinct episodes indicating the influence of other mine-specific factors, such as local geology and depth of cover. In the WP-BC area, longwall mining results in higher extraction rates and generally tends to be accompanied by higher rates of mining seismicity than room-and-pillar mining. But time series of longwall production and seismicity do not always correlate simply. Again, other mine-specific variables besides extraction rate appear to influence the generation of seismicity in the size range recorded by the regional seismic network. Information on ground truth what actually happened in or near a mine at the time of a discrete event that produced observable seismic signals was gathered with the help of Dr. M. K. McCarter of the University of Utah s Department of Mining Engineering. Groundtruth information was successfully acquired for eight seismic events, for which observational data summaries and mine sketches are provided in Appendix C. These include (a) seven events of magnitude 3.1 to 4.2 related to underground coal mining in the WP-BC area between 1981 and 2000 and (b) a trona-mining-related event of magnitude 4.3 in southwestern Wyoming in January Multiple pillar failures are documented for four of the WP-BC events, and a roof collapse involving three room-and-pillar sections is documented for the trona-mining-related event. Objective 2 Results of our investigations of source mechanisms of mining seismicity in the WP-BC region, as well as of three seismic events in the trona-mining region of southwest Wyoming, are presented in section 4. For the WP-BC mining region, we systematically investigated the 18 largest events (3.0 magnitude 4.2) since Because of the early dates and (or) relatively small size of most of the events (14 have magnitudes < 3.5), broadband waveform iii
11 data at regional distances are either sparse or of marginal signal-to-noise quality. In this study we carefully refined local velocity models and then analyzed P-wave first motions for focalmechanism information. Companion ground-truth information was successfully recovered for seven of the 18 events. Contrary to some published interpretations and our expectation, mechanisms for only three of the 18 events are unambiguously of a shear-slip type: (1) a shallow (~0.6 km), predominantly reverse-faulting event of magnitude 4.2 near the Willow Creek Mine in the BC district on March, 7, 2000; (2) a magnitude 3.8 event on February 5, 1998, in nearly the same location as event (1) and with first motions compatible with the same mechanism; and (3) a tectonic normal-faulting earthquake (11 km deep) of magnitude 3.0 on June 2, 1996, beneath the WP district. For events (1) and (2), observations in the Willow Creek Mine (< 1 km distance) indicate isolated roof falls, interpreted for each event to be the result of shaking caused by nearby shear-slip and not as the seismic source. For 13 of the other 15 events, coincident with sites of both longwall and room-and-pillar mining throughout the WP-BC region, only dilatational first motions were recorded by the University of Utah s regional seismic network (209 total observations). For the remaining two of the 18 events, first-motions are obscured by small preceding events. Collapses or partial closures of mine openings are documented for four of the events with all dilatational first motions. Based on varied evidence presented in section 4, including size considerations, we consider it highly likely that these four events were collapse-type events with implosional mechanisms. We also consider it plausible that the other events with only dilatational first motions had similar source mechanisms, with variable likelihood depending on available data. Available evidence favors the working hypothesis that the predominant mechanism of larger (magnitude 3.0) mining-induced seismic events in the WP-BC region is implosional and caused by sudden roof-floor closure, either partial or total, due to loss of pillar support. The shallow shear-slip earthquakes of magnitude 4.2 and 3.8 near the Willow Creek Mine in March 2000 and January 1998, respectively, are notable exceptions. Finally, we investigated the source mechanisms of three seismic events that occurred in the trona-mining district of southwestern Wyoming between January and August A seismic event of magnitude 4.3 on January 30, which coincided with a major roof fall at the Solvay Minerals trona mine, had an implosional collapse-type mechanism. We were unable to find any ground-truth information for shocks of magnitude 3.0 on July 16 and magnitude 3.1 on August 17. P-wave first-motion data and regional broadband waveforms indicate that the July 16 event was a shear-slip earthquake and suggest that the August 17 event was a collapse-type event. iv
12 ACKNOWLEDGMENTS We thank William Walter, Technical Representative of Lawrence Livermore National Laboratory (LLNL), for facilitating this project. We also offer special thanks to staff of the University of Utah Seismograph Stations for varied assistance in completing the project tasks. In particular, we thank Sue Nava for help with project management; Erwin McPherson for the engineering and field installation of the broadband station SRU; Dave Drobeck, Ken Whipp, and Paul Onstott for field assistance; and Julie Bernier, Jeff Fotheringham, Matt Jensen, Ali Moeinvaziri, Lorraine Nelms and Julie Bernier for technical help with data analysis, computing, and graphics. Kim McCarter and Jeff McKenzie of the University of Utah=s Department of Mining Engineering provided many useful insights from their mining engineering experience, and their contributions of Appendices B and C to this report are greatfully acknowledged. Several individuals kindly provided key information that advanced our understanding of specific seismic events within or near active mines in the Utah and southwestern Wyoming regions. For their gracious cooperation, we thank Pete Swanson of the National Institute for Occupational Safety and Health; Larry Refsdal of Solvay Minerals, Inc.; Rodger Fry of Interwest Mining Company; Tom Hurst, John Mercier, and Andy Schissler, all presently or formerly with RAG American Holding, Inc.; and Jim Case of the Wyoming Geological Survey. This project was funded by LLNL Research Agreement No. B Cooperative funding was provided by the state of Utah under a line-item appropriation to the University of Utah Seismograph Stations. Operational support for the University of Utah Regional Seismic Network, which supplied essential data for this project, was provided chiefly by the U.S. Geological Survey, the State of Utah, and the U.S. Bureau of Reclamation. v
13 1.0 INTRODUCTION Mining operations and practices have important implications for monitoring the Comprehensive Test Ban Treaty (CTBT). Seismic signals from legitimate mining operations can have the ambiguous appearance of being caused by small clandestine nuclear explosions, so confidence-building measures are needed for international treaty monitoring (Taylor, 1994; Walter et al., 1996; Richards, 1997; Committee on Seismic Signals from Mining Activities, National Research Council, 1998). There are distinct challenges, however, to understanding the causes, and discriminating the mechanisms, of seismic energy release in mining environments in the western U.S. and elsewhere. Problematic events include, for example, panel collapses in the Solvay trona mine in southwestern Wyoming in February 1995, which was associated with an M L 5.2 seismic event (Pechmann et al., 1995; Swanson and Boler, 1995), and underground failures in coal mines in Utah in 1981 (Taylor, 1994) and 1993 (Boler et al., 1997) that produced seismic events in the magnitude (M L ) 3 range. Mining seismicity is a prominent feature of seismic activity in the Utah region. Besides blasting at surface mines, intense seismic activity is associated with areas of extensive underground coal mining along the arcuate crescent of the Wasatch Plateau (WP) and Book Cliffs (BC) coal fields (Figures 1-1 and 1-2; see also review by Arabasz et al., 1997). The WP-BC region is notable as one of two areas in the western U.S. (the other, the Coeur d Alene metal mining district of northern Idaho) where mining-induced seismicity is well documented (Wong, 1993). For international monitoring, seismic signals from rockbursts, coal bumps, and mine collapses are more likely to be ambiguous than those from surface blasting (Committee on Seismic Signals from Mining Activities, National Research Council, 1998). Rockbursts and mining tremors of magnitude (M L ) 4.2 have been instrumentally recorded in the WP-BC region since the 1960s. About 27 million short tons of coal are produced annually from this region, with longwall-mining methods accounting for 75 percent of the total production (Jahanbani, 1999). Given the significant level of seismic activity associated with active underground coal mining in the WP-BC region, seismic monitoring and the characterization of seismic events in this region are of interest both to the University of Utah Seismograph Stations (UUSS), for earthquake research and mine safety, and to Lawrence Livermore National Lab (LLNL), for research and development relating to the Comprehensive Test Ban Treaty. This cooperative project was undertaken to assist LLNL researchers in the latter role. 1.1 OBJECTIVES AND SCOPE OF WORK This study had three basic objectives: 1. Strategically install a 3-component broadband digital seismic station in the WP-BC region to ensure the continuous recording of high-quality waveform data. The aim was to meet the long-term needs of various interested parties including LLNL, UUSS, mine operators and others in the state of Utah, and the international CTBT community at large. 1-1
14 2. Determine source mechanisms to the extent that available source data and resources allowed for comparative seismic characterization of stress release in mines versus earthquakes in the study region. 3. Gather and report to LLNL local information on mine operations and associated seismicity, including "ground truth" for significant events. The time period for this project was originally set for a 12-month period beginning February 28, Due to unexpected health problems affecting one of the principal investigators (JCP), no-cost extensions were agreed upon which ultimately changed the ending date of the project to September 1, Funding for Objective 1 accounted for 60 percent of the total budget; funding for Objectives 2 and 3 accounted for approximately 25 percent and 15 percent, respectively. In addition to the awarded amount of $58,960 for this study, UUSS to date has contributed more than $20,000 to this project. LLNL provided funds for more than 90 percent of the equipment costs; UUSS provided the remainder together with engineering and technical personnel for installing and operating the broadband digital seismic station as well as funds to meet ongoing costs for telemetry, maintenance, and operation of the broadband station. Thus, this project truly has been a cooperative one between LLNL and UUSS. The scope of work to meet Objective 1 involved all aspects of achieving what might be referred to as an end-to-end seismographic system variously involving: (1) engineering, site construction, and equipment installation at the field site; (2) completion of a continuous telemetry connection from the field site to the UUSS central recording laboratory in Salt Lake City, 216 km away; (3) calibration of the complete broadband station system; and (4) continuous recording, processing, and archiving of the digital data. Significant effort on the part of the Principal Investigators was required to oversee each of the above and to perform the system calibration, described in section 2.2. Following guidance from LLNL s Technical Representative for this contract, William Walter, the focus of Objective 2 was changed slightly to place emphasis on three mining-related events that occurred in and near the study area after the original work plan had been made, thus posing new targets of opportunity. These included a magnitude (M L ) 3.8 shock that occurred on February 5, 1998 (UTC date) just prior to the start of this project, and a magnitude (M L ) 4.2 shock that occurred on March 7, 2000 (UTC date). Both these events originated close to active mine workings in the Book Cliffs area. The M L 4.2 event was the largest mining-related seismic event instrumentally recorded in the WP-BC area since monitoring began in The third seismic event of special interest was a magnitude (M L ) 4.3 shock that occurred on January 30, 2000 (UTC and local date), associated with a panel collapse at the Solvay trona mine in southwestern Wyoming the same mine in which a larger and earlier collapse event in February 1995 attracted considerable attention from the CTBT community, prompting joint study by UUSS and LLNL seismologists (Pechmann et al., 1995). 1-2
15 Also following guidance from William Walter, emphasis on Objective 3 was placed on providing LLNL with information on mining seismicity in the study area that would extend and update the information published by Arabasz et al. (1997). The latter study included seismicity data through March 1996 and comparisons of seismic data with levels of coal production for the period January 1978 through December We proceed to describe results relating to the three basic objectives of this study in the following order. First, in section 2, we address Objective 1 (installation of a 3-component broadband digital seismic station. Next, in section 3, we describe results for Objective 3 (information on mine operations and associated seismicity) in order to present necessary background information before addressing Objective 2 (source mechanisms of significant seismic events) in section
16 42 Idaho trona-mine panel collapses M , M MAGNITUDES Wyoming 41 Salt Lake City Middle Rocky Mountains Basin & Range 39 Wasatch Plateau - Book Cliffs Coal Mining Region km 38 0 Colorado Plateau Utah Figure 1-1. Seismicity map of the Utah region, , showing the location and setting of the Wasatch Plateau-Book Cliffs coal mining region (Figure 1-2). Heavy lines indicate boundaries of major physiographic provinces; light lines, geologically young faults. Star in SW Wyoming marks the location of significant seismic events related to trona mining. Earthquake data from the University of Utah Seismograph Stations. 50
17 Wasatch Plateau - Book Cliffs Coal Mining Region 40 00' Soldier Summit 39 30' Skyline #1 Skyline #3 White Oak #2 White Oak #1 Crandall Canyon #1 Huntington Canyon Trail Mtn. #9 Castle Gate #5 Castle Gate #3 Pinnacle Apex Horizon Aberdeen Wasatch Plateau Star Point #2 Star Point #1 King #4,5,6 Gordon Creek #2 Gordon Creek #3 Trail Canyon Bear Canyon Deer Creek Hiawatha Cottonwood (Wilberg) Des-Bee-Dove Book Cliffs Willow Creek Price Huntington Soldier Canyon Dugout Canyon Sunnyside #1 Sunnyside #3 Horse Canyon Ferron 39 00' SUFCO Emery Emery km ' ' ' ' Figure 1-2. Location map of coal mines ('s) in the northerly-trending Wasatch Plateau (WP) and easterly-trending Book Cliffs (BC) coal fields (all mines east of and including the Castle Gate mines lie within the BC field; the remainder, within the WP field). Polygons (after Arabasz et al. 1997) bound areas within which nearly all seismicity is inferred to be mining-related. Geologically young faults are shown by light lines.
18 2.0 BROADBAND DIGITAL SEISMIC STATION (SRU) As proposed, we installed a broadband, 3-component digital telemetry station in the WP-BC region of Utah at the site of a preexisting station of the University of Utah regional seismic network, SRU (San Rafael Swell, Utah; see Figures 3-1 to 3-3). Prior to the completion of this installation on September 9, 1998, SRU was a short-period, vertical-component, analog telemetry station. We selected the SRU site because it (1) complements the azimuthal coverage of the WP-BC region provided by other broadband stations, (2) has a low seismic noise level, and (3) is at a roughly uniform distance of km from the coal mines in the area. At this distance range, SRU obtains good recordings of the M L 3.0 seismic events which are of primary interest with minimal interference from the frequent smaller-magnitude events (hundreds per day) which occur in the coal fields. 2.1 INSTALLATION The sensor at the upgraded SRU station, selected in consultation with William Walter, is a Guralp CMG-3T 3-component broadband seismometer with a flat velocity response from.01 to 50 Hz. When we started recording data from this seismometer on September 9, 1998, we discovered that there was a high level of long-period ( sec) instrumental noise on the east-west component. Consequently, the CMG-3T was removed on September 26, 1998, and sent back to Guralp Systems Limited in England for repair. In order to keep SRU operating, the CMG-3T was replaced with a Guralp CMG-40T 3-component broadband seismometer having a flat velocity response from.05 to 50 Hz. The CMG-3T was reinstalled on April 15, 1999, shortly after it was received back from Guralp. Figure 2-1 illustrates the seismometer installation at the site. The seismometer is on a concrete pad on Jurassic Navajo Sandstone bedrock inside a cylindrical steel barrel 24" high and 30" in diameter. Thermal insulation is provided by a concrete and foam insulation enclosure inside the barrel, mixed fill surrounding the barrel, and sand on top of the barrel. The installation design was modified by Erwin McPherson from the U.C. Berkeley design described by Uhrhammer et al. (1998). The signal from the seismometer is digitized at 100 samples/sec by a 24-bit REF TEK 72A-07 data logger and transmitted via FM radio to a State of Utah microwave communications facility located 10.6 km to the northwest on Cedar Mountain. From there, the data are sent via the State microwave system to a REF TEK Modem-Decoder Assembly at the UUSS central recording laboratory in Salt Lake City. The REF TEK digital telemetry system provides full two-way error correction. Time stamping is done by the 72A-07 data logger using a clock synchronized via radio to a REF TEK 111A-02 GPS Receiver/Clock at the central recording laboratory. From the REF TEK , the data are currently sent through a serial SDLC line, a router, and a local area network to our USGS-supplied Earthworm data acquisition system. 2-1
19 2.2 CALIBRATION We analyzed the observed and predicted outputs from remotely-generated step function calibration inputs to check and revise the manufacturer-supplied instrument response parameters. This simple calibration method, illustrated in Figure 2-2 (from Pechmann et al., 1999), appears to work well at periods longer than about one-twentieth of the seismometer free period. However, its absolute accuracy depends on the accuracy of the manufacturer-supplied feedback coil constants, which relate calibration input to acceleration. The software we used for our step function calibrations (a Seismic Analysis Code macro) is available via anonymous FTP to <ftp.seis.utah.edu> in the file <pub/misc/calcheck.m>. Table 2-1 lists the calibrated displacement responses at SRU for three different time periods: September 9, 1998, to September 26, 1998, 21:00 UTC, the time period immediately following the first installation of the Guralp CMG-3T; September 26, 1998, 21:00 UTC to April 15, 1999, 15:00 UTC, the time period during which the CMG-3T was out for repair and a Guralp CMG-40T was operating in its place; and April 15, 1999, 15:00 UTC to the present, the time period after the CMG-3T was reinstalled. The responses are specified as poles and zeros of a ratio of polynomials in the Laplace transform variable "s", plus a gain constant. Also listed in Table 2-1 are the calibration resistances and feedback coil constants supplied by Guralp Systems Limited, and the free periods and damping factors of the various seismometer components determined by our calibrations. Both before and after the repair work, the Guralp-supplied values for the CMG-3T gain, free period, and damping were within 2% of the values we obtained with our calibration. For the CMG-40T, the differences between the Guralp-supplied values for these parameters and our calibrated values were a bit largercup to 4%. We have found that gains, free periods, and damping factors of CMG-40T seismometers can differ by up to 15%, 9%, and 7%, respectively, from the nominal values (Pechmann et al., 1999). 2.3 RECORDING, PROCESSING, AND ARCHIVING OF DATA The data from station SRU, and the other five REF TEK broadband digital telemetry stations in the UUSS network, are recorded by the UUSS Earthworm data acquisition system (see the web documentation at < using software written at REF TEK, the University of Nevada at Reno, the University of Utah, and the U.S. Geological Survey. The Earthworm system writes the REF TEK waveform data to continuous binary disk files in Seismic Analysis Code (SAC) format. It writes the non-waveform data packets, which contain station/channel and state-of-health information, to binary disk files in REF TEK format. UUSS technicians regularly look at the state-of-health data to detect and diagnose problems with the REF TEK stations. The Earthworm system uses the waveform data from most stations in the network, including SRU, to automatically identify local seismic events and compute preliminary locations and magnitudes for them. The Earthworm system also exports triggered 40 sample/sec waveform data from selected stations, including all of the REF TEK stations, via an Internet link to the 2-2
20 U.S. National Seismograph Network (USNSN) data center in Golden, Colorado. These exported data are publicly available from the data center via the USNSN AutoDRM system. Finally, the Earthworm system creates digital "Webcorder" (simulated drum recorder) displays of the data from SRU and other selected stations in the UUSS network which may be accessed by anyone through the UUSS web site < Waveform data from selected time windows are extracted from the continuous SAC-format data files and stored in both SAC and UW-1 format. The selected time windows are those identified by the UUSS analog telemetry data acquisition system, a Masscomp 7200 computer running University of Washington HAWK software, as possibly containing seismic events. Each of these "triggers" is reviewed by a seismic analyst and classified as a local earthquake, blast, distant seismic event, or noise. The analyst attempts to determine locations and magnitudes for all local earthquakes recorded. All REF TEK data from seismic event triggers, and usable data from other stations, are archived onto optical disks and 8-mm tapes. In addition, these triggered data are periodically archived in SEED format at the IRIS Data Management Center in Seattle, Washington. The continuous SAC-format 100 sample/sec data files from the REF TEK stations are kept on-line at UUSS for five days. Since June 19, 2000, the continuous data files have been converted to SEED format and sent via FTP to the IRIS data center by an automatic background process which runs once per day. At the IRIS data center, these data are permanently archived and made available to all interested users. 2.4 SIGNIFICANCE OF DATA FOR CTBT MONITORING External users of our network waveform data have commented on the excellent quality of the data from station SRU. The seismic analyst who is primarily responsible for routine UUSS data processing, Jeff Fotheringham, judges that SRU is now the best seismic station in Utah. During its first two years of operation, SRU has recorded high-quality data from hundreds of seismic events including local earthquakes, blasts, and mining-related events in the Wasatch Plateau-Book Cliffs coal-mining region. These data, along with data from other broadband digital telemetry stations in Utah, will be extremely valuable for future research on seismic discriminants which can be used to distinguish earthquakes, mine collapses, and explosions. To date, we have used the SRU data primarily for computing Richter local magnitudes for local earthquakes and mining-related seismic events. Woods et al. (1993) have proposed using the ratio of local magnitude to seismic moment as a means for discriminating explosions from earthquakes. 2-3
21 Table 2-1 Hardware and Calibration Information for Station SRU* Component Sept. 9, 1998 to Sept. 26, 1998, 21:00 UTC Sept. 26, 1998, 21:00 UTC to April 15, 1999, 15:00 UTC April 15, 1999, 15:00 UTC to present Refraction Technology (REF TEK) Digitizer Model and Serial No. All 72A A A Digitizing Constant, volts/count All Guralp Systems Seismometer Model and Serial No. All CMG-3T T3650 CMG-40T T4182 CMG-3T T3650 Calibration Resistance, Ohms All Feedback Coil Constant, amp/(m/sec 2 ) Vertical East North Free Period, sec Vertical East North Damping Factor Vertical East North Total System Pole-Zero Response Zeros, rad/sec All All All All i i i i i i i i i i i i Seismometer Poles, rad/sec Vertical East North ±.04473i ±.04376i ±.04398i ±.2217i ±.2228i ±.2202i ±.04493i ±.04388i ±.04442i Other Poles, rad/sec All ± 193.5i i ± 193.5i Gain Constant, counts/micron Vertical East North * Values in italics are from UUSS calibrations. All others are from the equipment manufacturers. The station coordinates are N, W, 1804 m elevation.

22 SRU Broadband Seismometer Installation August 31, 2000 Open Space Foam Insulation Concrete Foam Guralp CMG3T 2" 4" 2" 1" Top View (rotated 30 degrees about vertical axis) Bedrock Overhang Sand 6" Steel Lid Insulation Steel Barrel 24" high x 30" diameter 18" Mixed Fill Open Space Foam Insulation Foam Insulation 4" Concrete Hexagon Foam Insulation Guralp CMG3T 2" 2" 18" 24" 18" Mixed Fill Rocks Steel Barrel Concrete Pad 30" CrossSectional View Bedrock (Jurassic Navajo Sandstone) Figure 2-1. Installation diagram for the broadband, 3-component, Guralp CMG-3T seismometer at the digital telemetry station SRU.
23
24
25
26 3.0 MINING SEISMICITY AND GROUND TRUTH AN UPDATE Mining seismicity generally includes both seismic events induced by underground mining and mine blasts at surface mines. Our attention here is restricted to the former and primarily focuses on the Wasatch Plateau (WP)-Book Cliffs (BC) coal-mining districts of east-central Utah with secondary attention to the trona-mining district of southwestern Wyoming (see upper right-hand corner of Figure 1-1). Ground truth in the context of mining seismicity simply means information on what actually happened in or near a mine at the time of some discrete event that produced observable seismic signals. We use the term mine tremor as synonymous with a seismic event induced by mining, and we restrict the term rockburst or coal bump to those seismic events associated with damage in accessible areas of a mine due to violent failure of rock (see Arabasz et al., 1997). One of the major challenges in studying mining seismicity in the WP-BC area is the ability to determine unambiguously the primary source of seismic energy release when material suddenly fails at a mining opening. The failure can be caused either by local static stresses in the direct vicinity of mining openings or by dynamic effects from seismic slip on a fault hundreds to thousands of meters away (e.g., Gibowicz, 1990; Knoll and Kuhnt, 1990). An overview of mining seismicity in the WP-BC area was given by Arabasz et al. (1997), including a description of available seismological data, the correlation of seismicity and mining, and outstanding issues and seismological challenges. Arabasz and Wyss (1999) reported a follow-up study on spatial variations in b-value (the slope of the frequencymagnitude distribution) in the WP-BC area. General issues posed by mine seismicity for mining engineers and seismologists, chiefly based on examples in the Utah region, were recently summarized by Arabasz and McCarter (2000). Our chief purpose in the remainder of this section is to extend and update the information summarized by Arabasz et al. (1997) for mining seismicity in the WP-BC area in order to provide a useful reference for LLNL researchers. First, we describe the University of Utah s current monitoring capabilities, and we summarize incident reports communicated to LLNL during the course of this project (section 3.1). Second, we provide background information necessary to understand our approach to developing a homogeneous catalog of mining seismicity for the period January 1, 1978-June 30, 2000 (section 3.2). Third, we update information on coal production in the WP-BC area and compare the data to observed seismicity (section 3.3). Fourth, we describe ground truth information to which we were able to gain access for significant mine tremors (section 3.4) referring the reader to Appendix C for documentation. 3.1 CONTINUOUS MONITORING AND INCIDENT REPORTS TO LLNL The University of Utah Seismograph Stations (UUSS) operates a regional seismic network, with 105 stations in July 2000 (Figure 3-1), that has continuously monitored the Utah region, with progressively evolving instrumentation, since Telemetered data from the network 3-1
27 have been centrally recorded on the University of Utah campus in Salt Lake City since Digital triggered recording of the UUSS network dates from As evident in Figure 3-1, short-period, analog-telemetry stations predominate in the UUSS regional seismic network. Broadband stations in Utah include five UUSS stations installed and calibrated during 1997 and 1998 (Pechmann et al., 1999) that strategically complement six broadband stations of the U.S. National Seismograph Network (USNSN) in and near Utah, currently resulting in a broadband station spacing of 100 to 200 km or better. UUSS network operations are cooperatively funded by the U.S. Geological Survey, the state of Utah, the U.S. Bureau of Reclamation, and (for the Yellowstone National Park area) the U.S. National Park Service. For additional details regarding the regional seismic network, see < Figure 3-2 (from Arabasz et al., 1997) shows the WP-BC study area in relation to the regional seismic network. The post-1978 distribution of stations allows fair to good map locations of seismic events in the vicinity of mines within the study area, but focal-depth control for shallow events is poor. Epicentral precision (95% bounds), on average, is about 3 km for the post-1978 data. This does not apply, however, to the eastern Book Cliffs area where poor azimuthal station control results in greater epicentral errors. Analysis of the UUSS catalog indicates that seismic monitoring of the mining areas shown in Figure 3-2 has been complete above about magnitude 1.8 since 1978 (Arabasz et al., 1997). Figure 3-3 gives a current and future view of the location of seismographic stations in the WP- BC area, updating beyond 1994 the depiction shown in Figure 3-2. Comparing with Figure 3-2, Figure 3-3 indicates: (1) the continued operation of stations EMU, which dates from October 1986, and SRU, dating from November 1990; (2) the operation of station SRU as a broadband, digitally-telemetered station (see section 2.0) beginning in September 1998; (3) the recent addition of station DBD, which earlier operated on a temporary basis in 1995 for a four-month period; (4) the location of four planned short-period vertical-component stations (open triangles); and (5) the location of a temporary special-study array of accelerographs and short-period stations (installed in late 2000) for ground-motion studies of mining-induced seismic events in the Trail Mountain area. Station SKYM (not shown on Fig. 3-3), operated at 'N, 'W, from June 29, 1995, until June 22, Based on continuous monitoring with the UUSS regional seismic network, the following incident reports were made by and/or telephone to William Walter of LLNL during the project period: 1. February 5, 1998 Report of an M L 3.7 (later revised to M L 3.8) seismic event that occurred the previous night in the vicinity of the Willow Creek Mine in the WP-BC area. (On July 14, 1998, a detailed followup report was made summarizing available information on ground truth for the February 5 seismic event.) 3-2
28 2. April 13, 1999 Confirmation that an M L 4.5 seismic event in south-central Wyoming on April 6, 1999 (UTC date) was a tectonic earthquake and not a mining-related event. 3. December 22, 1999 Report of an M L 3.9 seismic event in central Utah earlier in the day and confirmation that the event was a tectonic earthquake and not a mining-related event. 4. January 30, 2000 Report of an M L 4.4 (later revised to M L 4.3) seismic event earlier that morning near the Solvay Trona Mine in southwestern Wyoming and confirmation that this was a mining-related event. 5. March 6, 2000 Report of an M L 4.1 (later revised to M L 4.2) seismic event that occurred less than two hours earlier that evening close to the Willow Creek Mine in the WP-BC area. (Subsequent communications reported on available ground-truth information, the precise hypocentral location, a velocity model for the source, and a focal mechanism for the source.) 6. July 19, 2000 Report of an M L 3.2 (later revised to M L 3.0) seismic event three days earlier on July 16 in the trona mining district of southwestern Wyoming, west of Green River, Wyoming. Report included a refined epicentral location placing the event in the vicinity of the TG Soda Ash and FMC mines, but local observations gave no indication of a simple association with either mine. P-wave first-motion information was also reported indicating the event did not appear to be of a collapse type. 7. August 22, 2000 Report of an M L 3.3 (later revised to M L 3.1) seismic event that occurred five days earlier on August 17 in the trona mining district of southwestern Wyoming. Report included a refined epicentral location and a brief summary of waveform and firstmotion information suggestive of a collapse-type mechanism. However, no information was available to confirm that the event was associated with a specific mine. 3.2 DEVELOPING A HOMOGENEOUS CATALOG Most earthquake catalogs are heterogeneous in time, particularly in terms of non-uniform estimates of event size (e.g., Habermann, 1995; Zuniga and Wyss, 1995). Arabasz et al. (1997) made a major effort to address this issue in the case of the University of Utah s earthquake catalog, and they determined homogeneous magnitudes for mining-related seismic 3-3
29 events in the WP-BC area for the period July 1962 through March Here we extend their revised catalog through June For review, magnitude is reported in the University of Utah s earthquake catalog as either local Richter magnitude, M L, based on amplitude measurements of standard Wood-Anderson (W-A) seismograms, or coda-duration magnitude, M C, an empirical estimate of M L typically made for events smaller than about magnitude 3. Inadvertent temporal changes in the M C scale can arise variously from factors such as changes in network configuration, the type of instrumentation and its ground-motion magnification, or analysis software and procedures (Pechmann et al., 2000; Wiemer and Wyss, 1994, and references therein) Methodology Arabasz et al. (1997) did two basic things to achieve a catalog of homogeneous magnitudes for the WP-BC area. First, they used quantitative tools available in the interactive software package ZMAP (Wiemer et al., 1995) to derive time-varying correction terms for values of M C in the catalog between January 1, 1978, and March 31, 1996, designating the corrected values as M C. Their correction terms are given in Table 3-1 here. Second, in order to develop robust estimates of size anchored to the University of Utah s Wood-Anderson-based M L for the larger events in the catalog since 1962, they used empirical relations to convert all available magnitudes to an M L equivalent and then calculated a weighted average, designated M L. The practical reason for doing this was that prior to 1994, only a few W-A seismographs were in operation in the Utah region. Since early 1994, UUSS has routinely determined values of M L using synthetic W-A seismograms from several USNSN stations in the region and from five UUSS broadband digital telemetry stations in Utah installed during 1997 and 1998 (see section 3.1 and Figure 3-1). This has greatly increased the fraction of earthquakes for which M L can be robustly determined using recordings from multiple stations. With these new data in hand, a major project is under way at UUSS to review and revise, as appropriate, all magnitude estimates in the UUSS catalog since January 1981 when digital triggered recording of our network began. Here we continue the approach taken by Arabasz et al. (1997), and demonstrate its validity, but we caution that future revisions of the UUSS catalog may result in minor differences with the corrected magnitudes presented here. The revised catalog of Arabasz et al. (1997) for mining seismicity in the WP-BC area was extended from March 31, 1996, to October 31, 1999, by Arabasz and Wyss (1999) as part of a special topical study. Their correction terms, given in Table 3-2, reflect the following: First, they justified the extension of equation (4) in Table 3-1 beyond March 1996, and we have lengthened the extension from October 1999 to June Second, when they analyzed the whole revised catalog from 1978 through October 1999 using ZMAP, they discovered a small bias of 0.1 unit for values of M C prior to 1995, and they subtracted 0.1 to correct for this. (Note: Recognizing that M C also factored into some of the weighted-average estimates of M L made by Arabasz et al. [1997], those values of M L were recalculated to be consistent with the 3-4
30 adjustment of 0.1 in Mc for events before Consequently, some of the values of M L reported herein may differ from those of Arabasz et al. [1997] by 0.1 unit or less.) To test the validity of their corrected values of M C as reliable estimators of M L, Arabasz and Wyss (1999) compared M C with M L for 85 events in the WP-BC area for which an estimate of M L was available. With one exception, all estimates of M L prior to 1994 were based on one station; those for 1994 and later, on two or more stations. The results of the comparison are shown in Figure 3-4. (Note: The sample includes eight tectonic earthquakes with M L values in the range 2.5 to 4.4.) The lower panel of Figure 3-4 shows a plot of M C versus M L and the line for perfect agreement. The mean residual for the 85 data points is (one standard deviation), indicating very good correlation. The upper panel is a plot of differences between M C and M L as a function of time. The running average indicates random rather than systematic differences with time about the mean of Thus, we believe that the revised coda magnitudes, M C, together with available values of M L, provide reliable, homogeneous estimates of size for mining seismicity in the WP-BC area Revised Catalog Figure 3-5 shows an epicenter map of 6,851 seismic events in our revised catalog for the WP-BC area for the period January 1978 through June The events are restricted to two polygons, following Arabasz et al. (1997), which bound what is judged to be almost entirely mining-related seismicity located within (1) an arcuate crescent encompassing the Wasatch Plateau and Book Cliffs coal fields and (2) an isolated area of mining in the southern Wasatch Plateau. In Figure 3-5, the locations of the three largest seismic events are indicated by large stars. These include a shock of M L 4.2 on March 7, 2000, one of M L 3.8 on February 5, 1998, and another of M L 3.8 on May 14, Coincidentally, these three shocks are the largest not only since 1978 but also since systematic instrumental monitoring in this region began in July A listing of all events of magnitude 2.5 and greater (N=148) in the revised catalog for is presented in Appendix A. For special reference, a listing of all events in the revised catalog of magnitude 3.0 or greater, ordered by decreasing size, is presented in Table 3-3. We refer the reader to Table 1 of Arabasz et al. (1997) for the identification of larger miningrelated seismic events in the WP-BC area that occurred after July 1962 but before January 1978, when the revised catalog here begins. The largest event in the period was one of magnitude (M L ) 3.7 that occurred in April Focal Depths We emphasized earlier that focal-depth control in the WP-BC area based on the UUSS regional seismic network is generally poor because of the large station spacing, and computed focal depths such as included in Appendix A are not reliable. As part of the study reported by Arabasz and Wyss (1999), Arabasz investigated focal-depth control for events in the polygonal areas of Figure 3-5 to determine whether there might be a mixed sample of mining seismicity and deeper tectonic seismicity. 3-5
31 Of 5,063 events between January 1978 and October 1999, Arabasz was able to find only 15 for which the data arguably supported a focal depth greater than 6 km. None of these events was larger than magnitude 2.1. The results, combined with those of local studies (Williams and Arabasz, 1989; Wong et al., 1989) allow and suggest that virtually all the events clustering in the vicinity of the active coal mines in the WP-BC area are relatively shallow events occurring less than 6 km in depth. Because of the close spatial and temporal association of the seismicity with active mining (elaborated in section 3.3), we believe that nearly all this seismicity probably occurs at or within hundreds of meters above or below mine level and is mining-related. 3.3 ASSOCIATION OF SEISMICITY WITH MINING In this section, we present and briefly discuss data and information relevant to the spatial and temporal association of seismicity with underground coal mining in the WP-BC area. In order to provide a useful bridge between results reported by Arabasz et al. (1997) for and this report, data are presented here for an 8.5-year period beginning in January 1992 and ending in June While detailed analyses are beyond the scope of this project, the data summaries alone provide abundant information that (1) gives a useful overview and (2) can guide future studies relating to the correlation of mining activity and associated seismicity on a mine-by-mine basis. Because the seismicity data inherently lack fine spatial resolution, we purposely make only general observations. Causal relationships between mining operations and seismic energy release are highly complex, and more detailed data are needed to confidently attribute specific seismic events to a particular mining operation Spatial Association Figures 3-6 through 3-14 show the epicentral distribution, on an annual basis, for seismicity located within the WP-BC coal mining region using the University of Utah s regional seismic network. Also shown are the portal locations of all mines active in this region since Thus, each figure includes not only active mines but inactive ones as well, which in some cases may be associated with seismic failures. Because distal parts of an active mine may commonly be 5 km or more from the portal, epicentral clustering may not coincide with the plotted location of an associated mine. Another consideration in comparing observed seismicity with locations of mining, separate from epicentral precision (i.e., the relative location of one event compared to another), is the possibility of systematic bias due to network configuration and non-uniform seismic velocities. Our experience suggests, for example, that computed epicenters in the Wasatch Plateau coal field tend to lie a few kilometers westward of their true locations. A first-order feature of the annual epicenter maps, at their plotted regional scale, is the spatial clustering of seismicity in known areas of active mining. In general, one observes tighter 3-6
32 clustering in the Wasatch Plateau coal field than in the Book Cliffs field, due in part to better epicentral control. In the Sunnyside area of the eastern Book Cliffs, an area marginal to the seismic network, there is an apparent scattering of epicenters in an ENE-WSW direction (see Figures 3-6 and 3-7) due to inadequate azimuthal station control. Higher rates of seismic activity in the Wasatch Plateau coal field during the sample period generally reflect higher extraction rates compared to the Book Cliffs coal field (see, for example, Appendix B). Inspecting the series of annual epicenter maps from 1992 to 2000 (Figures 3-6 through 3-16), one can observe distinct clusters of seismic events in the vicinity of mines known to be active at the time. Temporal variations in the observed seismic clustering correlate in some cases with the start or completion of mining; in other cases, where extraction was relatively continuous over several years, seismic clustering has occurred in distinct episodes. We proceed to examine such changes with time Temporal Association Arabasz et al. (1997) cross-correlated time series of observed seismicity with tons of extracted coal, on a quarterly basis from 1978 through 1994, for nine local areas in the WP-BC region. Seismicity was measured both in terms of counts of seismic events above a threshold magnitude and seismic energy release. In order to gain an updated view, we did the following. First, we extended our database for quarterly coal mine production in the WP-BC region with tabulations for 1995 through 1998, the last year for which data were available. These data, which give a representative view of contemporary mining activity in the study area, were compiled by J. D. McKenzie and are presented in Appendix B. Second, we plotted all seismic events in our revised catalog above magnitude 1.8 for the period January 1992-June The resulting map, shown in Figure 3-15 allowed twelve areas of clustered seismicity to be isolated for special analysis, following the approach of Arabasz et al. (1997). Index data for these twelve sample areas are summarized in Table 3-4. Third, for each sample area and for the period January 1992-June 2000, we constructed composite time-series plots that show: (a) reported quarterly coal production within the sample area, (b) quarterly counts of seismic events above a magnitude threshold of uniform detection, and (c) magnitude versus time of occurrence. For (b) and (c), a magnitude threshold of 1.75 was generally adopted, except for areas 1, 8, 11, and 12 where a threshold of 1.85 was used. The resulting composite plots for the twelve sample areas are shown in Figures 3-16 through 3-21 (note changes in the vertical scales from plot to plot). Referring to the plots sequentially, we make these observations:! S. Wasatch Plateau area (Figure 3-16): Production throughout the sample period was from longwall mining. Annual tonnage progressively increased with time, but 3-7
33 seismicity was variable with some notably quiet periods longer than a few weeks duration typical of a longwall move that are not due to gaps in seismic recording.! S. Joes Valley area (Figure 3-16): Tonnage and seismicity both increased after late 1995 with the beginning of a longwall operation, and the seismicity rate later increased significantly in late Prior to 1995, minor production was from room-and-pillar mining.! East Mountain and Rilda Canyon areas (Figure 3-17): These two plots are complicated by the fact that extraction attributed to one particular mine occurred in both areas, and the partition of tonnage to each area is unclear. Thus, while we can spatially distinguish two separate clusters of seismicity in map view (Figure 3-15), we have incomplete information for reliably characterizing the time series for quarterly tonnage in each area. One of two longwalls operating in the East Mountain area ended production in late 1995, which corresponds to the timing of a marked decrease in seismicity in that area. In the plot for the Rilda Canyon area, observed seismicity increases significantly in early 1995 but does not persist continuously thereafter.! Lower Huntington Canyon area (Figure 3-18): Relatively low production in this area came from room-and-pillar mining. Most of the observed seismicity notably occurred in two episodes, one during 1995 and the other during ! Upper Huntington Canyon area (Figure 3-18): Coal production progressively increased in this area. There was a change from room-and-pillar to longwall mining about 1996, but there is no evident contrast in the observed seismicity before and after this date.! Gentry Mountain area (Figure 3-19): The cessation of a longwall operation in 1997 was accompanied by a marked decrease in seismicity, providing a good correlation between extraction and seismicity in this area.! Pleasant Valley area (Figure 3-19): Seismicity in this area is predominantly related to longwall mining that occurred throughout the entire sample period at relatively high levels of production. The marked decrease in observed seismicity after mid-1996, despite continued coal production, emphasizes that seismic energy release depends not only on rate of extraction but also on other mine-specific variables, including local geology and depth of cover.! Castle Gate area (Figure 3-20): Sparse but relatively continuous seismicity occurred in this area between 1992 and 1997 while mines in this area were inactive. The start of coal production in 1996 relates to development work in a new mine in which a longwall began operating in mid-1998, but discontinuously thereafter. The two prominent seismic events of magnitude 3.8 in 1998 and 4.2 in 2000 are discussed in sections 4.22 and 4.21, respectively. 3-8
34 ! W. Book Cliffs area (Figure 3-20): Both coal production and seismicity in this area as generally true for mining areas in the Book Cliffs are lower than for counterpart mining areas in the Wasatch Plateau. A change from room-and-pillar mining to longwall mining in mid-1994 is reflected by a step increase in the tonnage plot. The seismicity plots show at least one episode of increased seismicity in ! Central Book Cliffs area (Figure 3-21): Relatively low levels of coal production in this area were from room-and-pillar mining. Production ceased after Perhaps the most notable aspect of the observed seismicity was the occurrence of two distinct episodes of seismic energy release, one in and another in , each including a seismic event in the magnitude 3 range.! E. Book Cliffs area (Figure 3-21): Longwall mining in this area ceased in early 1994, as reflected in the tonnage graph. In , a distinct episode of seismic events occurred after the mine had closed. 3.4 GROUND TRUTH FOR SIGNIFICANT EVENTS Part of Objective 3 for this study was to gather and report available information on ground truth what actually happened in or near a mine at the time of a discrete event that produced observable seismic signals for significant mining-related seismic events. In section 1.1 we described guidance from LLNL s Technical Representative for this contract, William Walter, which indicated special interest in three particular mining-related events two in the WP-BC coal-mining region in February 1998 and March 2000, respectively, and one in the tronamining region of southwestern Wyoming in January To help acquire and organize the ground-truth information in a systematic way, we engaged the assistance of Dr. Michael K. McCarter, chair of the University of Utah s Department of Mining Engineering. Information was successfully gathered for the three events of special interest as well as for five other events. The total of eight events includes seven events (3.1 M L 4.2) related to underground coal mining in the WP-BC area between 1981 and 2000 and the January 2000 trona-mining-related event (M L = 4.3) in southwestern Wyoming. The WP-BC data include information for the four largest seismic events listed in Table 3-3 plus three other events for which information was recoverable. We refer the reader to Appendix C for a listing (Table C-1) of the seismic events for which ground-truth information was compiled and for data sheets that document the observations. 3-9
35 Table 3-1 Correction Terms Used by Arabasz et al. (1997) for Revised Coda Magnitudes, M C, in the Wasatch Plateau-Book Cliffs Area Time Period Equation /01 S /31 M C = M C (1) /01 S /31 M C = M C (2) /01 S /14 M C = 0.90 M C S 0.09 (3) /15 S /31 M C = M C (4) Table 3-2 Correction Terms Used in This Report, Following Arabasz and Wyss (1999), for Revised Coda Magnitudes, M C, in the Wasatch Plateau-Book Cliffs Area Time Period Equation /01 S /31 M C = (M C ) S 0.10 (5) /01 S /31 M C = M C S 0.10 (6) /01 S /14 M C = (0.90 M C S 0.09) S 0.10 (7) /15 S /31 M C = (0.747 M C ) S 0.10 (8) /01 S /30 M C = M C (9)
36 Table 3-3 Seismic Events of Magnitude 3.0 or Greater in the WP-BC Coal-Mining Area, January 1978-June 2000, Ranked by Size ID Yr Mo/Da (UTC) Hr:Min (UTC) Lat N Long W Depth* (km) Mag.** Closest Active Mine /07 02: ML 4.2 Willow Creek /14 05: ML 3.8 King # /05 05: ML 3.8 Willow Creek /05 12: ML 3.5 Cottonwood /21 08: ML 3.4 Sunnyside # /22 05: ML 3.3 Sunnyside # /16 17: ML 3.3 Trail Mountain /03 05: ML 3.2 Cottonwood /06 13: ML 3.1 Star Point # /25 18: ML 3.1 Soldier Canyon /14 00: ML 3.1 Soldier Canyon /23 07: ML 3.1 Cottonwood /11 13: ML 3.1 Cottonwood /21 09: ML 3.1 Soldier Canyon /22 11: ML 3.0 Sunnyside # /21 11: ML 3.0 Deer Creek /02 08: ML 3.0 (Skyline #3)*** /30 00: ML 3.0 Castle Gate #3 * Unreliable ** ML is a weighted-average estimate of local magnitude, ML (see Arabasz et al., 1997, and section 3.21 here) *** Tectonic earthquake located 7 km south of Skyline Mine (see section 4.23)
37 Table 3-4 Information for Sample Areas in Figure 3-15 Used to Investigate the Association of Seismicity with Mining in the WP-BC Area During the Period Area Coordinates of Center (degreessminutes) Radius (km) Mines Reporting Coal Production During Sample Period 1. S. Wasatch Plateau 38S S Sufco 2. S. Joes Valley 39S S Trail Mountain 3. East Mountain 39S S Deer Creek; Cottonwood 4. Rilda Canyon 39S S Deer Creek 5. Lower Huntington Canyon 6. Upper Huntington Canyon 39S S Bear Canyon #1, #2 39S S Crandall Canyon 7. Gentry Mountain 39S S Starpoint #2; King #4, #6 8. Pleasant Valley 39S S Skyline #1, #3; White Oak #1, #2 (formerly Belina #1, #2) 9. Castle Gate 39S S Willow Creek 10. W. Book Cliffs 39S S Aberdeen; Apex; Pinnacle 11. Central Book Cliffs 39S S Soldier Canyon 12. E. Book Cliffs 39S S Sunnyside #1
38 University of Utah Regional Seismic Network July Yellowstone Array COMI Idaho HVU FSU ARUT HHAI NAIU SNUT NPI BEI MLI PTU BMUT MTUT HDU WVUT LTU RSUT HONU HWUT EPU GZU MCU DUG WMUT NLU IMU NMU DWU BHU PTI GBI FLU TMI MSU MVU MOUT TCUT FPU WCU SUU LEVU BTU AHID ECRI GRRI SLC MPU SNO SGU OWUT DBD MMU IMW EMU SRU BW06 Wyoming Utah WP-BC Area km 45 00' 44 30' 44 00' 40 30' YDC CWU SAIU YGC YHH YHB YMC YCJ YJC YNR YMR YPM YPC YWB YML LKWY MCID ' ' ' ' Salt Lake Valley and Jordanelle Arrays HRU RBU BBU SLC MGU CTU NOQ MHD GRD WTU YFT YLT YPP YMV GMU YMS RCJ DCU ' ' YLA YTP YSB STATION KEY UUSS single-component, analog-telemetry, short-period UUSS multi-component, analog-telemetry, short-period UUSS multi-component, digital-telemetry, broadband USNSN multi-component, digital-telemetry, broadband km JLU KLJ WLJ HLJ LDJ km HTU DAU 37 ICU KNB EKU Figure 3-1. Location map of seismograph stations (symbols with letter codes) making up the University of Utah regional seismic network, July The network extends from Yellowstone National Park to southern Utah. Seismic data from each station are transmitted continuously by radio, telephone, and/or microwave to Salt Lake City (SLC) for central recording on the University of Utah campus. WP-BC study area outlined by dashed rectangle.
39
40 Existing and Planned Seismograph Stations in the WP-BC Area, July ' Soldier Summit UUSS existing, 3-component, broadband digital 39 30' ELU EMU WCM Price Hiawatha UUSS existing, 3-component, short-period analog UUSS existing, z-component, short-period analog UUSS planned, z-component, short-period analog SNO Huntington DBD open 6/24/95 to 10/25/95 and 1/14/00 to present Trail Mountain Special-Study Array 39 00' Emery Ferron SRU SPZ open 11/20/90 to present BB open 9/9/98 to present N km miles ' ' ' ' Figure 3-3. Map of Wasatch Plateau-Book Cliffs study area showing existing and planned seismograph stations, July 2000, for comparison with earlier instrumental coverage shown in Figure 3-2.
41
42 Mining-Related Seismicity in the WP-BC Coal Mining Region Jan Jun ' Soldier Summit M 3.8 Feb 1998 M 4.2 Mar ' Price Hiawatha M 3.8 May 1981 Huntington MAGNITUDES Mines Ferron 39 00' Emery km ' ' ' ' Figure 3-5. Epicenter map of all seismic events located by the University of Utah regional seismic network in the WP-BC coal mining region from January 1, 1978, through June 30, Polygons (after Arabasz et al., 1997) circumscribe areas within which nearly all seismicity is inferred to be mining-related. Stars (labeled) indicate the three largest mining-related seismic events in theis area instrumentally recorded since Geologically young faults are shown by light lines.
43 WP-BC Coal Mining Region Jan 1 - Dec 31, ' Soldier Summit 39 30' Skyline #1 Skyline #3 White Oak #2 White Oak #1 Crandall Canyon #1 Huntington Canyon Trail Mtn. #9 Castle Gate #5 Castle Gate #3 Pinnacle Apex Horizon Aberdeen Star Point #2 Star Point #1 King #4,5,6 Gordon Creek #2 Gordon Creek #3 Trail Canyon Bear Canyon Deer Creek Hiawatha Cottonwood (Wilberg) Des-Bee-Dove Willow Creek Price Huntington Soldier Canyon Dugout Canyon Sunnyside #1 Sunnyside #3 Horse Canyon MAGNITUDES Ferron Mines 39 00' SUFCO Emery Emery km ' ' ' ' Figure 3-6. Epicenter map of mining-related seismicity in the WP-BC coal mining region for the year Base map as in Figure 3-5, except that mines are shown by 's and are labeled.
44 WP-BC Coal Mining Region Jan 1 - Dec 31, ' Soldier Summit 39 30' Skyline #1 Skyline #3 White Oak #2 White Oak #1 Crandall Canyon #1 Huntington Canyon Trail Mtn. #9 Castle Gate #5 Castle Gate #3 Pinnacle Apex Horizon Aberdeen Star Point #2 Star Point #1 King #4,5,6 Gordon Creek #2 Gordon Creek #3 Trail Canyon Bear Canyon Deer Creek Hiawatha Cottonwood (Wilberg) Des-Bee-Dove Willow Creek Price Huntington Soldier Canyon Dugout Canyon Sunnyside #1 Sunnyside #3 Horse Canyon MAGNITUDES Ferron Mines 39 00' SUFCO Emery Emery km ' ' ' ' Figure 3-7. Epicenter map of mining-related seismicity in the WP-BC coal mining region for the year Base map as in Figure 3-5, except that mines are shown by 's and are labeled.
45 WP-BC Coal Mining Region Jan 1 - Dec 31, ' Soldier Summit 39 30' Skyline #1 Skyline #3 White Oak #2 White Oak #1 Crandall Canyon #1 Huntington Canyon Trail Mtn. #9 Castle Gate #5 Castle Gate #3 Pinnacle Apex Horizon Aberdeen Star Point #2 Star Point #1 King #4,5,6 Gordon Creek #2 Gordon Creek #3 Trail Canyon Bear Canyon Deer Creek Hiawatha Cottonwood (Wilberg) Des-Bee-Dove Willow Creek Price Huntington Soldier Canyon Dugout Canyon Sunnyside #1 Sunnyside #3 Horse Canyon MAGNITUDES Ferron Mines 39 00' SUFCO Emery Emery km ' ' ' ' Figure 3-8. Epicenter map of mining-related seismicity in the WP-BC coal mining region for the year Base map as in Figure 3-5, except that mines are shown by 's and are labeled.
46 WP-BC Coal Mining Region Jan 1 - Dec 31, ' Soldier Summit 39 30' Skyline #1 Skyline #3 White Oak #2 White Oak #1 Crandall Canyon #1 Huntington Canyon Trail Mtn. #9 Castle Gate #5 Castle Gate #3 Pinnacle Apex Horizon Aberdeen Star Point #2 Star Point #1 King #4,5,6 Gordon Creek #2 Gordon Creek #3 Trail Canyon Bear Canyon Deer Creek Hiawatha Cottonwood (Wilberg) Des-Bee-Dove Willow Creek Price Huntington Soldier Canyon Dugout Canyon Sunnyside #1 Sunnyside #3 Horse Canyon MAGNITUDES Ferron Mines 39 00' SUFCO Emery Emery km ' ' ' ' Figure 3-9. Epicenter map of mining-related seismicity in the WP-BC coal mining region for the year Base map as in Figure 3-5, except that mines are shown by 's and are labeled.
47 WP-BC Coal Mining Region Jan 1 - Dec 31, ' Soldier Summit 39 30' Skyline #1 Skyline #3 White Oak #2 White Oak #1 Crandall Canyon #1 Huntington Canyon Trail Mtn. #9 Castle Gate #5 Castle Gate #3 Pinnacle Apex Horizon Aberdeen Star Point #2 Star Point #1 King #4,5,6 Gordon Creek #2 Gordon Creek #3 Trail Canyon Bear Canyon Deer Creek Hiawatha Cottonwood (Wilberg) Des-Bee-Dove Willow Creek Price Huntington Soldier Canyon Dugout Canyon Sunnyside #1 Sunnyside #3 Horse Canyon MAGNITUDES Ferron Mines 39 00' SUFCO Emery Emery km ' ' ' ' Figure Epicenter map of mining-related seismicity in the WP-BC coal mining region for the year Base map as in Figure 3-5, except that mines are shown by 's and are labeled.
48 WP-BC Coal Mining Region Jan 1 - Dec 31, ' Soldier Summit 39 30' Skyline #1 Skyline #3 White Oak #2 White Oak #1 Crandall Canyon #1 Huntington Canyon Trail Mtn. #9 Castle Gate #5 Castle Gate #3 Pinnacle Apex Horizon Aberdeen Star Point #2 Star Point #1 King #4,5,6 Gordon Creek #2 Gordon Creek #3 Trail Canyon Bear Canyon Deer Creek Hiawatha Cottonwood (Wilberg) Des-Bee-Dove Willow Creek Price Huntington Soldier Canyon Dugout Canyon Sunnyside #1 Sunnyside #3 Horse Canyon MAGNITUDES Ferron Mines 39 00' SUFCO Emery Emery km ' ' ' ' Figure Epicenter map of mining-related seismicity in the WP-BC coal mining region for the year Base map as in Figure 3-5, except that mines are shown by 's and are labeled.
49 WP-BC Coal Mining Region Jan 1 - Dec 31, ' Soldier Summit 39 30' Skyline #1 Skyline #3 White Oak #2 White Oak #1 Crandall Canyon #1 Huntington Canyon Trail Mtn. #9 Castle Gate #5 Castle Gate #3 Pinnacle Apex Horizon Aberdeen Star Point #2 Star Point #1 King #4,5,6 Gordon Creek #2 Gordon Creek #3 Trail Canyon Bear Canyon Deer Creek Hiawatha Cottonwood (Wilberg) Des-Bee-Dove Willow Creek Price Huntington Soldier Canyon Dugout Canyon Sunnyside #1 Sunnyside #3 Horse Canyon MAGNITUDES Ferron Mines 39 00' SUFCO Emery Emery km ' ' ' ' Figure Epicenter map of mining-related seismicity in the WP-BC coal mining region for the year Base map as in Figure 3-5, except that mines are shown by 's and are labeled.
50 WP-BC Coal Mining Region Jan 1 - Dec 31, ' Soldier Summit 39 30' Skyline #1 Skyline #3 White Oak #2 White Oak #1 Crandall Canyon #1 Huntington Canyon Trail Mtn. #9 Castle Gate #5 Castle Gate #3 Pinnacle Apex Horizon Aberdeen Star Point #2 Star Point #1 King #4,5,6 Gordon Creek #2 Gordon Creek #3 Trail Canyon Bear Canyon Deer Creek Hiawatha Cottonwood (Wilberg) Des-Bee-Dove Willow Creek Price Huntington Soldier Canyon Dugout Canyon Sunnyside #1 Sunnyside #3 Horse Canyon MAGNITUDES Ferron Mines 39 00' SUFCO Emery Emery km ' ' ' ' Figure Epicenter map of mining-related seismicity in the WP-BC coal mining region for the year Base map as in Figure 3-5, except that mines are shown by 's and are labeled.
51 WP-BC Coal Mining Region Jan 1 - Jun 30, ' Soldier Summit 39 30' Skyline #1 Skyline #3 White Oak #2 White Oak #1 Crandall Canyon #1 Huntington Canyon Trail Mtn. #9 Castle Gate #5 Castle Gate #3 Pinnacle Apex Horizon Aberdeen Star Point #2 Star Point #1 King #4,5,6 Gordon Creek #2 Gordon Creek #3 Trail Canyon Bear Canyon Deer Creek Hiawatha Cottonwood (Wilberg) Des-Bee-Dove Willow Creek Price Huntington Soldier Canyon Dugout Canyon Sunnyside #1 Sunnyside #3 Horse Canyon MAGNITUDES Ferron Mines 39 00' SUFCO Emery Emery km ' ' ' ' Figure Epicenter map of mining-related seismicity in the WP-BC coal mining region for January through June Base map as in Figure 3-5, except that mines are shown by 's and are labeled.
52 WP-BC Coal Mining Region Jan 1, Jun 30, ' 8. Pleasant Valley 9. Castle Gate 10. W. Book Cliffs 11. Central Book Cliffs MAGNITUDES ' 6. Upper Huntington Canyon 7. Gentry Mountain 5. Lower Huntington Canyon Rilda Canyon 3. East Mountain 12. E. Book Cliffs S. Joes Valley ' 1. S. Wasatch Plateau km ' ' ' ' Figure Index map, keyed to Table 3-4, outlining areas of concentrated mining-related seismicity (circumscribed by large circles) for which detailed characterizations are shown in Figures 3-16 through Plotted seismicity includes events from January 1992 through June 2000 of magnitude 1.8 and greater.
53
54
55
56
57
58
59 4.0 MECHANISMS OF SIGNIFICANT SEISMIC EVENTS In this section we report results for Objective 2 relating to investigations of source mechanisms of mine seismicity primarily in the Wasatch Plateau-Book Cliffs region but also including some seismic events in the trona mining region of southwest Wyoming (see section 1.1 regarding guidance from LLNL for emphasizing some specific seismic events). Figure 4-1 gives a simplified overview of four types of source mechanisms known to be associated with mine seismicity. Given our focus on underground mining, explosional source mechanisms will not be considered. Use of explosives in underground coal and trona mines is not a routine practice, and when explosives are used in such settings the permissible amount is small and generally far below the detection threshold of regional seismic monitoring. For example, the use of explosives in the Wyoming trona mines is reportedly rare and involves only a few pounds, and rules for underground coal mines limits the permissible amount to 60 pounds unless special permission is obtained from the Mine Safety and Health Administration (M. K. McCarter, personal communication, October 2000). Of the other mechanisms depicted in Figure 4-1, our discussion will relate chiefly to shear-slip mechanisms and implosional or collapse-type mechanisms, which involve sudden roof-floor closure. Such closure can result from either tabular collapse or loss of pillar support that causes only partial roof-floor closure. The mechanism of a tensile fracture or opening crack (Figure 4-1) represents a variation of a collapse-type mechanism reported for an explosively induced mine collapse at a room-and-pillar copper mine in Michigan (Yang et al., 1998; Phillips et al., 1999). Because of constraints of available data and resources, we investigated source mechanisms by using the conventional approach of analyzing P-wave first motions. The framework we have established lays the groundwork for complementary moment-tensor analyses feasible now for only a few of the largest, relatively recent events in our data set, but increasingly feasible for future events in our study region, thanks to new broadband seismographs such as station SRU Overview Events Analyzed and Presentation of Results Table 4-1 (based on Table 3-3) lists all events of magnitude 3.0 or larger in the WP-BC area from January 1978 through June 2000; Figure 4-2 shows their map distribution. For each event, Table 4-1 also indicates the closest active mine, the inferred focal-mechanism type, and whether ground-truth information is available (Appendix C). We used this list of events as a starting point for our analysis and systematically examined P-wave first-motion data for all events in this set. We were able to distinguish two groups of events. The first group consists of shear-slip events having a clear mixture of compressional and dilatational first motions. The second consists of events for which only dilatational first motions were observed, making them possible candidates for collapse-type events. In addition to this sample of larger seismic events in the WP-BC area, we also investigated P-wave first motions and selected waveforms for three seismic events (M L ) in the trona mining district of southwestern Wyoming 4-1
60 that occurred between January and August 2000 (see section 3.1) in order to assess their likely mechanisms. We have organized the remainder of section 4.0 as follows. We begin, in section 4.1, by describing velocity modeling that was a prerequisite for constructing focal mechanisms in the WP-BC area. Next, in section 4.2, we describe and discuss three events in the WP-BC sample of larger events (Table 4-1) that have unambiguous shear-slip mechanisms. In section 4.3 we then describe and discuss 13 events in the WP-BC sample that were possible collapse-type events. Table 4-1 includes a total of 18 events, but as the table indicates the P-wave first motions for two events were obscured by small preceding events, so their mechanisms could not be evaluated from a first-motion analysis. Finally, in section 4.4, we address the three seismic events in the trona-mining district of southwestern Wyoming. 4.1 VELOCITY MODELS FOR FOCAL MECHANISMS We constructed two different sets of velocity models for our focal mechanism investigations in the WP-BC area: the Willow Creek Composite (WCC) model for the Willow Creek Mine area and the Trail Mountain Composite (TMC) model for the Trail Mountain Mine area (Tables 4-2 and 4-3; Figure 4-2). We refer to these models as composite models because each one consists of two or more one-dimensional velocity models designed for use with recording stations in different regions. We used the WCC and TMC models for seismic events north and south of N, respectively, as this latitude is halfway between the Willow Creek and Trail Mountain mines The Willow Creek Composite Velocity Model We began by examining reduced travel-time plots from the March 7, 2000, Willow Creek earthquake to evaluate the accuracy of existing velocity models. The Willow Creek earthquake was especially suitable for this purpose because its hypocenter had been accurately and independently determined using travel-time data from a dense seismic network in and above the Willow Creek Mine, as discussed in section The travel-time plots for this event showed that no single, one-dimensional velocity model could provide an adequate fit to all of the data. The East Mountain velocity model of Williams and Arabasz (1989) predicts travel times that fit reasonably well the observed travel times from the earthquake at Colorado Plateau stations out to 200 km distance (20 o to 210 o azimuth). However, at stations in the Basin and Range Province (azimuth 210 o to 355 o, the observed apparent velocity at distances of 50 to 150 km is significantly slower than that predicted by the model. The ideal solution to this problem would be to use a three-dimensional velocity model. However, there are no such models available which include the WP-BC region. To approximate the laterally-varying velocity structure in the region from which our first motion data for the Willow Creek earthquake came, we developed a set of three one-dimensional models to use with three groups of stations: (1) surface stations located along the eastern edge of the Basin and Range province in Utah (210 o to 355 o azimuth from 4-2
61 the Willow Creek event), (2) surface stations located in the Colorado Plateau Province of eastern Utah (20 o to 210 o azimuth), and (3) stations located underground in the Willow Creek Mine in the Colorado Plateau. The second model was also used for a few distant stations in easternmost Idaho and western Wyoming (355 o to 20 o azimuth). We will refer to this set of models as the Willow Creek Composite (WCC) velocity model (Table 4-2). The datum for the first two WCC models is 2400 m above sea level the mean elevation of the 7 surface stations located within 1 km of the Willow Creek epicenter. The datum for the third model, the Willow Creek Mine model, is 1900 m: 21 m above the elevation of the highest underground station and 25 m above the minimum source depth. The Willow Creek Mine model is the same as the WCC Colorado Plateau model except that the top 0.5 km of the latter has been removed. The use of two datums is necessary because the location program we used, Hypoinverse (Klein, 1978), assumes that all stations are at the elevation of the datum for the purpose of the takeoff angle calculations. For the 2000 Willow Creek earthquake, the takeoff angles for the closest stations are sensitive to the choice of the datum because the focal depth of the source is so shallow. We computed elevation corrections for the travel times using a P-wave velocity of 4.0 km/sec. This velocity was chosen because it is the velocity of the top layer in the Willow Creek Mine model and the velocity of the layer immediately beneath the 0.1-km-thick low-velocity near-surface layer in the other two models. The assumption underlying this choice is that a similar low-velocity layer is present near the surface everywhere, regardless of elevation, but is above the level of the mine stations. The uppermost 4.4 km of all three WCC velocity models is the same, except for the 0.5 km removed from the top of the Willow Creek Mine model. The top 0.9 km of the models was generalized with the assistance of Julie Bernier using sonic logs from two boreholes located near the epicenter of the M L 4.2 earthquake: (0.8 km west-northwest, surface elevation of m) and (1.4 km east-northeast, surface elevation of m). Because the datum for two of the velocity models is higher than the surface elevations of these sonic logs, it was necessary to extrapolate the sonic log velocities beyond the elevation range of the data. This was done by extending the second, 4.0 km/sec layer in these models upward, for consistency with the elevation correction calculations. The model between 0.9 km and 4.4 km below the 2400 m datum was modified from the East Mountain model of Williams and Arabasz (1989). East Mountain is located 55 km SSW of Willow Creek in an area of similar geology. Williams and Arabasz derived the relevant part of their model from sonic logs of an oil well located roughly 10 km south of East Mountain. We based the modifications to their model on a comparison between the stratigraphic column in Figure 3 of their paper and a generalized stratigraphic column for the Helper-Price- Wellington area (chart 65, p. 170 in Hintze, 1988) using the 1821 m elevation for the base of the Castlegate sandstone near the epicenter as a reference elevation (see section 4.21). The lower part of the WCC Basin and Range model is modified from model B of Keller et al. (1975). This model is from an unreversed seismic refraction profile beginning at an open-pit 4-3
62 mine near Salt Lake City and extending 245 km southward along the Basin and Range/Colorado Plateau transition zone. The lower part of the WCC Colorado Plateau model is modified from the model determined by Roller (1965) for the northern end of a 300-km-long reversed refraction line across the Colorado Plateau in southeastern Utah and northwestern Arizona. The modifications to both models are based on analyses of travel-time data from local and near-regional earthquakes and blasts recorded on the University of Utah seismic network (Loeb, 1986; Loeb and Pechmann, 1986). Figure 4-3 shows that these models provide reasonably good fits to the travel-time data for their respective regions The Trail Mountain Composite Velocity Model The Trail Mountain Composite (TMC) model (Table 4-3) consists of two different one-dimensional models for use with two different groups of stations: (1) surface stations located along the eastern edge of the Basin and Range province in Utah (approximately 210 to 360 degrees azimuth from Trail Mountain), and (2) surface stations located in the Colorado Plateau region of eastern Utah (approximately 0 to 210 degrees from Trail Mountain). The second model is also used for stations in eastern Idaho and Western Wyoming north of As discussed in section 4.11, the two separate models are needed because of the significant differences in crustal structure between the eastern Basin and Range Province and the Colorado Plateau interior. For this study, we did not need a version of the Trail Mountain model for underground stations. The datum for both of the TMC models is 2600 m above sea level the approximate elevation above the active part of the Trail Mountain Mine in As with the WCC model, we computed elevation corrections for the travel times using the P-wave velocity of the second layer in the models, which is 4.0 km/sec. The uppermost 4.14 km of both TMC velocity models is the same. The top 0.8 km is based on a stratigraphic column for the Trail Mountain area which we constructed from a geologic map (Larsen, 1997), and some average formation velocities computed from the two sonic logs obtained near the Willow Creek Mine. We used the sonic logs from the Willow Creek region because the available sonic logs from the Trail Mountain region do not sample the uppermost 0.8 km of the stratigraphic section. Williams and Arabasz (1989) used mean vertical-interval velocities from high-resolution seismic reflection profiles on East Mountain, centered ~6 km ENE of the Trail Mountain Mine, to construct the uppermost kilometer of their velocity model for the East Mountain area. However, this part of their model consists of a strong velocity gradient with a P-wave velocity increase from 2.4 to 4.04 km/sec. Sonic log data from this depth range elsewhere in the region indicate a much thinner near-surface velocity gradient. Based on these sonic logs, including those from the Willow Creek area, we decided to replace the Williams and Arabasz (1989) near-surface gradient by a 0.1-km-thick top layer with a P-wave velocity of 3.5 km/sec. The TMC model between 0.8 and 2.4 km below the 2600 m datum was generalized from sonic logs from two boreholes in the Trail Mountain Mine area (analyzed by Matthew Jensen): Indian Green , located 8 km north of the mine, and Federal 41-33, located 4-4
63 12 km southeast of the mine. The formation boundaries in both wells are estimated to be at comparable elevations, but ~0.4 km higher than their elevations in the Trail Mountain area. Consequently, we adjusted the depths of the velocities from these logs for this ~0.4 km difference in stratigraphic level. The Federal log provides velocity information to greater depths. Williams and Arabasz used this log in constructing their East Mountain model, which is a reasonable fit to the data. Therefore, to obtain the TMC model from 2.4 to 4.14 km below the datum, we modified their East Mountain model by decreasing the layer boundary elevations by 0.4 km. The TMC models below 4.14 km depth are identical to the corresponding parts of the WCC models. Figure 4-4 shows that the TMC models provide acceptable fits to the travel-time data from one of the larger seismic events to occur in the Trail Mountain vicinity the 1992 M L 3.5 seismic event in the East Mountain area. 4.2 SHEAR-SLIP EVENTS IN THE WP-BC AREA 4.21 The M L 4.2 Seismic Event Near the Willow Creek Mine on March 7, 2000 The March 7, 2000, UTC (March 6, 2000, MST) M L 4.2 Willow Creek earthquake is the largest mining-related seismic event to occur in the WP-BC region of Utah since the University of Utah seismic network began operating in 1962 (Table 4-3; Arabasz et al., 1997). This event triggered several small rock falls, one of which briefly blocked U.S. Highway 6 and the Denver and Rio Grande railroad tracks adjacent to the highway (Miller, 2000; Francis. Ashland, written communication, 2000). This event was also accompanied by seven roof falls at various locations in the nearby Willow Creek Mine (Appendix C). We report here on our determination of a focal mechanism for this event using P-wave firstmotion data from three sources: (1) a dense, 23-station temporary seismic network which Dr. Peter L. Swanson of the National Institute for Occupational Safety and Health (NIOSH) was operating in and above the Willow Creek Mine, (2) one accelerograph and two portable digital seismographs which we had temporarily deployed near this mine, and (3) the University of Utah regional seismic network. The hypocentral location which we use for this focal mechanism determination was computed by Dr. Swanson using arrival-time data from his network and a simple, preliminary velocity model based on apparent seismic velocities across this network. Dr. Swanson provided us first-motion readings from his stations, but did not provide the corresponding arrival time data because of some timing problems which he was trying to resolve. Consequently, we have not been able to recompute the hypocenter with the same velocity model which we employed for the focal mechanism determination. In the following sections, we first discuss the hypocentral location for the 2000 Willow Creek earthquake and then our focal mechanism determination. Our preferred focal mechanism indicates that the Willow Creek earthquake was caused by oblique reverse faulting on a plane dipping steeply to the south or shallowly to the north-northwest. Thus, it appears that the roof falls which occurred in the Willow Creek Mine at the time of the earthquake were a result of the earthquake and not the cause. 4-5
64 Hypocentral Location. Dr. P. L. Swanson provided the following information on the hypocentral location for the March 7, 2000, Willow Creek earthquake: (1) "The initiation point was centered right above the face (the location of active mining) at a distance we estimate at 400 to 700 feet (122 to 213 m) above the seam", (2) the seam elevation is 5450 feet (1661 m), and (3) "The location coincides with the base of the Castlegate sandstone where it is most massive." The epicentral location corresponding to this description is 39 o N, 110 o W, and the elevation above sea level is m ( ft). The source elevation is in good agreement with the elevation of the base of the Castlegate sandstone in the two nearby boreholes from which the sonic logs used in the velocity modeling were obtained: 1821 m in the closest borehole and 1859 m in the other (John Mercier, personal communication, 2000). The focal depth depends on the datum chosen. The elevation varies by hundreds of meters in the mine area, but is approximately 2475 m (8120 ft) at the epicenter and averages 2400 m at the seven surface stations within 1 km of this point. Selecting 2400 m as the datum, as noted above, the focal depth is km. The range of possible focal depths spans a discontinuity in the velocity model. At this discontinuity, which is at a depth of 0.6 km below the 2400 m datum, the P-wave velocity increases downward from 4.0 to 4.3 km/sec. The sonic logs from which this part of the velocity model was derived show good evidence for a sharp increase in average velocity of at least this magnitude near source depth. Thus, despite the excellent focal depth control for this event, it was necessary to investigate the sensitivity of the focal mechanism to the focal depth. Focal mechanism. We determined the focal mechanism for three fixed focal depths spanning the range of the focal-depth uncertainty: 0.52 km, 0.57 km, and 0.62 km. For each of these focal depths, we used the location program Hypoinverse to compute the best-fitting origin times, the station azimuths, and the takeoff angles for the surface stations and some of the stations located underground in the mine. Determination of the takeoff angles for the underground stations required special care. The elevation range of these stations is 1561 m to 1879 m, which encompasses both the source elevation of m and the 1800 m elevation of a discontinuity in the velocity model. The takeoff angles for the underground stations between 1800 m and 1900 m elevation were calculated by Hypoinverse assuming station elevations equal to a datum elevation of 1900 m. For source locations above the 1800 m discontinuity, the first arrivals at these stations are all modeled as refractions off the 1800 m discontinuity. The corresponding takeoff angles are therefore independent of the exact station elevation. For source locations below the 1800 m discontinuity, the first arrivals at these stations are modeled as direct waves. The corresponding takeoff angles are near horizontal, and are also insensitive to the exact station elevation. The takeoff angles for the underground stations below the 1800 m velocity discontinuity could not be calculated using Hypoinverse because the P-wave first arrivals at these stations 4-6
65 are all downgoing direct rays. The takeoff angles for these arrivals were calculated by hand to an accuracy of 3 degrees, which is adequate in light of the velocity model uncertainties. Fortunately, the best-fit focal mechanism turns out not to be very sensitive to focal depth over the range of depth uncertainty (Figure 4-5). The best-fit focal mechanisms for all three depths show oblique reverse faulting on a plane dipping steeply to the south or shallowly to the northwest or north-northwest. Our preferred focal mechanism is the one for the 0.62 km depth, because this is the only one of the three for which the best-fit focal mechanism fits all of the first motion data. This choice does not necessarily mean that this depth is more accurate in an absolute sense. But it does suggest that this depth is more accurate relative to the depths of the velocity model discontinuities. For our preferred focal mechanism, the strike, dip, and rake are, respectively, 88 o 4 o, 75 o 4 o and 99 o 2 o for one nodal plane and 238 o 12 o, 17 o 4 o, and 61 o 9 o for the other nodal plane. These error bars reflect only the uncertainties in fitting the nodal planes to the preferred first motion plot. They do not incorporate the uncertainties related to the focal depth or velocity model. It is not possible to identify which of the two nodal planes is the fault plane based on the information presently available to us. The second nodal plane, which dips 13 o to 21 o towards N20 o W to N44 o W, can be interpreted as subparallel to the bedding, which dips 8.5 o to the north (Richardson et al., 1996). It can also be interpreted as dipping in the opposite direction of the longwall advance at the time of the earthquake, which was toward the southeast (Appendix C). Finally, the strike of this shallowly-dipping nodal plane can be interpreted as subparallel to one of two major fracture trends in the Willow Creek Mine area mentioned in Richardson et al. 1996), N75 o E. (The other trend is N60 o W). Any one of these interpretations could be used to argue that the shallowly-dipping nodal plane is the fault plane. On the other hand, the slip direction on the steeply-dipping plane is more consistent with the maximum horizontal stress direction determined by overcoring, which is N30 o W to N60 o W (Richardson et al., 1996) The M L 3.8 Seismic Event Near Willow Creek Mine on February 5, 1998 The M L 4.2 Willow Creek earthquake of March 2000 was preceded by an M L 3.8 earthquake in nearly the same place on February 5, 1998, UTC (February 4, 2000, MST; Table 4-1). The 1998 earthquake occurred while gate-road development was underway in the nearby Willow Creek Mine in preparation for longwall mining which began in July The 1998 earthquake caused no significant damage to the mine, but triggered some rock falls in a nearby canyon (John Mercier, Willow Creek Mine geologist, personal communication, 2000). Some coal sluffed from a mine pillar during a second, smaller seismic event 48 minutes later (Appendix C). We relocated the 1998 M L 3.8 earthquake relative to the 2000 M L 4.2 earthquake and attempted to determine a focal mechanism for it from P-wave first motions. The data we used were from the University of Utah regional seismic network, the closest station of which was 4-7
66 8 km from the 1998 event. The closer NIOSH and University of Utah temporary seismic stations which we used to analyze the 2000 event had not yet been installed when the 1998 event occurred. Although we were unable to constrain the focal mechanism of the 1998 event, the first motion data clearly indicate that this event, like the 2000 event, was caused by slip on a fault and not a mine collapse. Within the constraints of our data, the fault orientations and slip directions could have been the same in both earthquakes. Hypocentral location. We located the 1998 earthquake relative to Dr. Swanson's hypocenter for the 2000 earthquake using the master event technique of Johnson and Hadley (1976) and the Willow Creek Composite velocity model discussed in Section In our implementation of this technique, we attempted to correct the arrival times of the 1998 event for velocity model inaccuracies by subtracting the travel-time residuals for the 2000 event (observed arrival time minus calculated arrival time) before locating the 1998 event with Hypoinverse. In computing this location, we used only those stations for which we had determined a station delay, and we applied no distance weighting. The first trial hypocenter for the location was the preferred hypocenter of the 2000 event at 0.62 km depth. If the focal depth is allowed to vary, then the 1998 event locates at a depth of 0.59 km. This depth falls within the depth range of km calculated by Dr. Swanson for the 2000 event. However, this depth is poorly constrained due to the lack of nearby stations. Locations computed with any fixed focal depth shallower than 2 km have root-mean-square travel-time residuals within 0.01 sec of the minimum value of 0.09 sec. Fixing the focal depth of the 1998 event at the preferred focal depth for the 2000 event, 0.62 km, gives an epicenter of 39 o N, 110 o W. This epicenter is 1.2 km WSW of the 2000 epicenter. However, the difference between these two epicenters is not significant in light of the location uncertainties. Focal mechanism. The first motion data for the 1998 event are inadequate to constrain its focal mechanism regardless of the focal depth. If the focal depth is fixed at 0.62 km, then the first motion data can be fit by the preferred nodal planes for the 2000 event (Figure 4-6). Thus, it is possible that both the 1998 and 2000 earthquakes had the same oblique-reverse faulting focal mechanism. Jochen Braunmiller obtained a "not well constrained" moment tensor solution for the 1998 earthquake by modeling regionally recorded broadband seismograms (see the Oregon State University web page <quakes.oce.orst.edu/moment-tensor>). His best-fitting double-couple solution, which is for a source depth of 4 km, shows oblique-reverse faulting on a plane dipping 31 o south or 63 o north-northeast. This focal mechanism does not fit our first-motion data distribution for a focal depth of 4 km or any other reasonable focal depth The M L 3.0 Seismic Event in the Northern Wasatch Plateau on June 2, 1996 We relocated the June 2, 1996, earthquake in the northern Wasatch Plateau and determined its focal mechanism using the Willow Creek Composite velocity model and data from the 4-8
67 University of Utah regional seismic network, supplemented by data from an accelerograph which we were temporarily operating at a site 7 km from the epicenter (the closest station). In computing the location with Hypoinverse, we downweighted the arrival times from the more distant regional network stations using a cosine taper with a weight of one at a distance dmin of 100 km and a weight of zero at a distance dmax of 200 km (see Klein, 1978). Our revised hypocenter is at 39 o N, 111 o W, with a well-constrained focal depth of km (95% confidence limits). The relatively large focal depth indicates that this earthquake is not mining related. Our focal mechanism for this event (Figure 4-7) shows normal faulting on a plane dipping moderately to the east (strike = 2 4, dip = 40 2, rake = ) or west-northwest (strike = 214 5, dip = 55 2, rake = ). The tension (T) axis of this focal mechanism is nearly horizontal and trends west-northwest, nearly parallel to the average T-axis direction found in studies of focal mechanisms in the Basin and Range Colorado Plateau transition zone of southern Utah, where this earthquake is located (Arabasz and Julander, 1986; Bjarnason and Pechmann, 1989; Patton and Zandt, 1991). Based on the focal mechanism and the depth, we interpret the June 2, 1996, M L 3.0 northern Wasatch Plateau earthquake to be a tectonic event caused by regional east-southeast/west-northwest extension in the WP-BC area. 4.3 POSSIBLE COLLAPSE-TYPE EVENTS IN THE WP-BC AREA One of the notable results of our analysis of P-wave first motions for the larger seismic events in the WP-BC area listed in Table 4-1 is that only three events had an unambiguous shear-slip mechanism. The majority were possible collapse-type events that is, only dilatational firstmotions were observed. The latter observation alone is insufficient to conclude that the focal mechanism was implosional because one must have confidence that the focal sphere was adequately sampled to preclude a double-couple, shear-slip type of mechanism (e.g., Wong and McGarr, 1990). One must have additional confidence that ubiquitous dilatations on the focal sphere are at geometrically correct positions, i.e., that true take-off angles have been plotted using a reliable source focal depth and velocity model (e.g., Williams and Arabasz, 1989, Figure 12). We discuss individually the two largest collapse-type events, for which various information including ground truth makes it highly probable that the source mechanisms were implosional. Separately, we systematically quantify available data for 11 other events in Table 4-1 having a possible collapse-type mechanism Event #2 M L 3.8, Gentry Mountain Area, May 14, 1981 The M L 3.8 seismic event on May 14, 1981 in the Gentry Mountain area was associated with a major collapse which occurred during pillar recovery operations at the U.S. Fuel Company King Mine. The collapse area may have been as large as 150 m by 150 m (Taylor, 1984; Appendix C). 4-9
68 Bjarnason (1987, Appendix B) presents an unconstrained normal-faulting focal mechanism for this event, based on his observations of 29 dilatational and no compressional P-wave first motions. In contrast, Wong and Humphrey (1989) report a reverse-faulting focal mechanism. Their first motion plot shows both compressions and dilatations, with some inconsistencies, but the dilatations are much more numerous. Finally, Taylor (1994) modeled a broadband recording of this event using a tabular collapse source mechanism. He cites the following observations as supporting evidence for this type of mechanism: the small size of the Love waves generated, the low Lg/Pg amplitude ratio, the relative lack of high frequency energy in the seismic waves, the large implosional component to Patton and Zandt s (1991) surfacewave moment-tensor solution, and the apparently contemporaneous mine collapse which he estimates is large enough to account for the size of the event. The P-wave first-motion plots for the Gentry Mountain event in Figure 4-8 illustrate the typical difficulties with using regional network first-motion data to constrain the focal mechanisms of shallow mining-related events. The first-motion data shown are from Bjarnason (1987). They include readings from both the University of Utah regional network and a network in the Canyonlands district of southeastern Utah, which Woodward-Clyde Consultants operated from 1979 to We checked Bjarnason s first-motion and arrivaltime picks from the University of Utah network, and concur that all of them are dilatational. We cannot easily check his picks from the Canyonlands network, because we do not have the waveform data he used. We note, however, that some of Wong and Humphrey s (1989) compressional first-motion picks appear to be from the University of Utah network. The azimuths and takeoff angles for the first motions in Figure 4-8 are for locations which we computed using Bjarnason s arrival-time picks, the Trail Mountain Composite velocity model, distance weighing with a dmin of 150 km and a dmax of 200 km, and fixed focal depths of 0.06, 0.6, and 6.0 km. We evaluated the focal mechanism for this set of fixed focal depths because the actual focal depth is poorly constrained by the available data, none of which is from a station closer than 56 km. The root-mean-square travel-time residuals are the same for the locations at both.06 and 0.6 km depth, and 10% larger for the location at 6 km depth. Our preferred focal depth is 0.6 km, the approximate depth of the commercial coal seams in the Trail Mountain model. (The corresponding epicenter is 39 o N, 111 o 7.11 W.) However, first-motion plots for any depth between 0.36 km and 2.48 km should be very similar, because this range of depths encompasses two layers in the Trail Mountain Composite velocity model with similar P-wave velocities of 4.3 and 4.4 km/sec (Table 4-3). The P-wave first motion data from the May 14, 1981, M L 3.8 Gentry Mountain event are consistent with a wide variety of normal and oblique-normal faulting mechanisms if the focal depth is assumed to be 0.06 or 0.6 km (Figure 4-8), or probably any depth less than 2.48 km. Figure 4-8 illustrates only one of these possible focal mechanisms. For a focal depth of 6 km, the best double-couple fit to the data is a reverse-faulting mechanism similar to that published by Wong and Humphry (1989). Of course, the collapse mechanism proposed by Taylor (1994) satisfies the first-motion data in Figure 4-8 for any focal depth. In light of Taylor s work and the in-mine observations which he reports, we agree with his conclusion that this seismic event was most likely caused by a mine collapse. 4-10
69 4.32 Event #4 M L 3.5, East Mountain Area, July 5, 1992 The M L 3.5 seismic event in the East Mountain area on July 5, 1992, occurred at about the same time as some pillar damage adjacent to active longwall mining in the nearby Cottonwood Mine. The damage consisted primarily of ~0.3 m of height reduction in nine pillars over an area of about 30 by 270 m (Appendix C). We relocated the East Mountain event and attempted to determine its focal mechanism using the Trail Mountain Composite velocity model and data from the University of Utah regional seismic network. In locating this event with Hypoinverse, we used the same distance weighting and fixed focal depths as we did in locating the previously-discussed event. The focal depth is very poorly constrained due to the lack of recording stations closer than 32 km, as evidenced by the fact that the root-mean-square travel-time residuals are the same for all three focal depths. Our revised epicenter for the 0.6 km fixed focal depth is 39 o N, 111 o 9.70 W. If the July 5, 1992, M L 3.5 East Mountain event is assumed to have a focal depth of 0.06 or 0.6 km, then our P-wave first motion data can be fit with a wide range of normal and obliquenormal faulting mechanism one of which is illustrated in Figure 4-9. If the focal depth is assumed to be 6.0 km, then all but one of the first-motion observations can be fit by a reversefaulting mechanism. Thus, the set of all dilatational first motions which we found for the East Mountain event can be explained not only by an implosional mechanism, but also by a variety of possible double-couple focal mechanisms. The available observations from the Cottonwood mine are more consistent with a collapse mechanism, but further work is needed to determine the correct focal mechanism for this event Eleven Other Seismic Events Having Only Dilatational P-wave First Motions Thirteen events in Table 4-1 have an indicated collapse-type? mechanism. Focal-sphere plots for the two largest of these (#2 and #4) have just been discussed. For each of the other 11 events, the total number of available P-wave first-motion recordings was generally fewer, due to smaller size, less favorable station coverage, or both. Nevertheless, the absence of any compressional P-wave first motions for these events seems significant and warrants documentation, which we provide in Table 4-4. Basis for Table 4-4. In scrutinizing available P-wave first-motion recordings for the 11 events, special care was taken to objectively assess the quality of the recordings. Care was also taken to accept only first motions whose arrival times were consistent with predicted first arrivals, especially beyond about 150 km where a weak P n phase might be the true first arrival but mistakenly be missed (see travel-time curves in Figures 4-3 and 4-4). Just as for the various focal-mechanism plots included in this report, we consistently used the signal-to-noise ratio (s/n) of the P-wave first motion to quantify its quality. Following Bjarnasson and Pechmann (1989), highest quality (labeled Q1 in Table 4-4) was assigned to 4-11
70 readings for which s/n was 3 or greater, and a lesser quality (labeled Q2 in Table 4-4) to readings for which s/n was between 2 and 3. Readings for which s/n was less than 2, but which still appeared valid, were recorded in this exercise (labeled Q3 in Table 4-4), even though we routinely discarded such readings in constructing focal-mechanism plots. Despite the lower quality of these readings, they were significant in that none was compressional, thus decreasing the likelihood of a shear-slip, double-couple mechanism. In lieu of a stereographic plot for each of the 11 events, the azimuthal range given in Table 4-4 conveys the relative coverage of the focal sphere by dilatational first motions. The larger the range, the less likely that a shear-slip mechanism could be accommodated. Ground-truth information is available for three of the 11 events, which we address individually. Event #7 M L 3.3, December 16, This seismic event occurred in the Wasatch Plateau coal field and was closely associated with room-and-pillar mining in the Trail Mountain Mine, prior to the beginning of longwall mining nearby in Ground-truth information that could be recovered for this event (Appendix C) is minimal, except to confirm the room-andpillar setting and problematic mining conditions. Event #8 M L 3.2, June 3, This seismic event occurred in the Wasatch Plateau coal field and was closely associated with longwall mining in the Cottonwood Mine the same source area as for event #4, the M L 3.5 event that occurred one month later in July 1992 (discussed in section 4.32). As described in Appendix C, available ground-truth information for this event indicates that approximately five pillars immediately adjacent to the longwall face were reduced in height by ~0.3 m at the time of event #8. We consider this event to be a smaller counterpart of event #4 and judge that both seismic events were likely caused by sudden roof-floor closure due to loss of pillar support. Event #14 M L 3.1, January 21, This seismic event coincided with a catastrophic pillar failure in a room-and-pillar mine in the Book Cliffs coal field. Boler et al. (1997) published a detailed report of this incident (see also Appendix C here), describing that 24 pillars were crushed out over an area of nearly 15,000 m 2. Despite this pillar loss, they report that the roof remained substantially intact and suspended above the crushed pillar array with... net roof-to-floor convergence of a few centimeters (estimated from photographs of support timbers that were broken in compression). Boler et al. include stereographic plots of first-motion distributions, assuming two different but shallow focal depths. In part because their interpreted data included three compressional first motions, Boler et al. (1997) concluded that a shear-slip focal mechanism (with normalslip displacement) was involved and that the shear-slip event precipitated the pillar failure. In our reexamination of original data for this event from the University of Utah seismic network, including recordings whose azimuths and takeoff angles would closely coincide with the compressions plotted by Boler et al. (1997, Figure 8), we found no evidence of a reliable compressional first motion (Table 4-4). Figure 4-2 shows that event #14 lies 19 km to the east of event #1, the M L 4.2 event near the Willow Creek Mine that had a reverse slip mechanism indicative of high horizontal compressive stress (see Figure 4-5). We consider the normal-slip 4-12
71 mechanism interpreted by Boler et al. (1997) to be questionable and prefer the interpretation that the catastrophic pillar collapse described by Boler et al. (1997) was the seismic source of event #14. Remainder of events. The remaining events in Table 4-4 identified as having a collapsetype? mechanism include the following: events #5, #6, and #15, all in the early 1980s, near the Sunnyside #3 Mine (longwall mining at the time); event #9 in 1991 near the Star Point #2 Mine (longwall mining); event #10 in 1996 near room-and-pillar mining in the same mine as event #14 discussed above and described by Boler et al. (1997); event #12 in 1991 near the Cottonwood Mine (longwall mining); event #16 in 1984 near the Deer Creek Mine (longwall mining); and event #18 in 1986 near the Castle Gate #3 Mine (longwall mining) General Observations and Conclusions The 13 events listed in Table 4-4 that have only dilatational first motions are distributed throughout both the WP and BC coal fields (Figure 4-2). Four can be associated with roomand-pillar mining and the other nine with longwall mining. Collapses or partial closures of mine openings are documented coincident with four of these events: #2, #4, #8, and #14 (see Appendix C and the descriptions above). For these four events, we have estimated the seismic moment and radiated seismic energy using empirical relations (developed for earthquakes) between these quantities and M L. Based on these rough source parameter estimates, and calculations analogous to those in Pechmann et al. (1995) and Taylor (1994), it appears that the sizes of these four events can be accounted for by the accompanying implosions. However, we consider this conclusion to be preliminary in the absence of direct seismic moment and/or energy measurements. In conclusion, based on ground-truth information and the data of Figure 4-8, Figure 4-9, and Table 4-4, we consider it highly likely that events #2, #4, #8, and #14 were collapse-type events with implosional focal mechanisms. We also consider it plausible that the other nine events had similar source mechanisms, with variable likelihood depending on available data. 4.4 THREE SEISMIC EVENTS (M L ) IN THE TRONA-MINING DISTRICT OF SOUTHWESTERN WYOMING, JANUARY-AUGUST 2000 On January 30, 2000, an M L 4.3 seismic event accompanied by a major roof fall occurred at the Solvay Minerals trona mine in southwestern Wyoming (Appendix C; Gearino, 2000). This event appears to be a smaller-scale counterpart to an M L 5.2 seismic event which occurred at the same mine on February 3, The M L 5.2 event was generated by the collapse of a 1 by 2 km room and pillar section of the mine, as evidenced by long-period waveform modeling and surface subsidence of 0.6 to 0.9 m above the affected area, which is enough to account for the size of the seismic event (Pechmann et al., 1995). Similarly, at the time of the January 30, 2000, event, surface subsidence of up to 0.8 m occurred in an irregularly-shaped area of ~0.65 km 2 above three room and pillar sections of the mine rendered inaccessible by the accompanying roof falls. Pillar extractions had recently been 4-13
72 completed within two of the three sections of the mine which apparently collapsed, and were underway in the third section when the collapse occurred (see Appendix C). Walter et al. (2000, and written communication) has successfully modeled the long period waveforms from this event with the same collapsing crack model that Walter used to model the data from the 1995 event (see Pechmann et al., 1995). From this modeling, they obtained a preliminary collapse moment of 3 x dyne-cm a factor of five smaller than the moment of 1.5 x dyne-cm obtained for the 1995 event. Considering that the maximum surface subsidence was similar for both the 1995 and 2000 events, but that the collapse area of the latter ( 0.65 km) is a factor of three or more smaller, it appears that the 2000 collapse was large enough to account for the M L 4.3 seismic event. A comparative analysis of subsidence maps from the two collapses would provide a more precise estimate of the expected collapse moment ratio. Two other M L 3 events occurred during 2000 in the trona-mining region of southwestern Wyoming: an M L 3.0 event on July 16 and an M L 3.1 event on August 17 (Table 4-5). To date, we have not been able to find any ground truth information for either of these two events. We relocated these two events, plus the January 30 event, relative to the 1995 event to help determine if they might be associated with any active mines. We also compared P-wave first motions and regionally-recorded broadband waveforms from these two events to those of the January 30 th event in order to evaluate their likely source mechanisms. We relocated the three trona-mining district events using the master event technique discussed in Section We began by fixing the location of the 1995 event in the center of the collapse area at a depth of 0.5 km the approximate depth of the Solvay Mine. We calculated the best-fitting origin time for this hypocenter by using Hypoinverse, the southwestern Wyoming velocity model in Table 1 of Pechmann et al. (1995), and distance weighting with dmin equal to 200 km and dmax equal to 250 km. The travel-time residuals from this fixed location were then used as travel-time corrections for the relocations of the three events which occurred during In these relocations, we used only the stations for which we had determined a travel-time correction, no distance weighting, and the center of the 1995 collapse as the starting location. The distances to the nearest station used in the relocations ranged from 121 to 136 km, and the largest azimuthal gaps between stations ranged from 182 to 199 degrees. Because of the unfavorable station distribution, we found it helpful to stabilize the locations by fixing the focal depths to 0.5 km. Our relocated epicenter for the January 30, 2000, event (Table 4-5) is near the southern end of the Solvay Mine, 1.1 km west-southwest of the center of the collapse area shown on the mine map in Appendix C (x = , y = ; 41 o N, 109 o W) and 0.5 km from its closest edge. The agreement between our collapse location and the relocated epicenter is quite good, and well within the 95% confidence limit of 4.6 km (Table 4-5). Our relocated epicenters for the other two events both lie within mining lease areas mapped by Brown (1995), but we do know how close they are to any mine workings (Table 4-5). 4-14
73 All of the discernable first motions from the January 30 event are dilatational, as expected. There are a few clear P-wave first motions from the August 17 event and they are all dilatational as well. These first motions are consistent with either a collapse mechanism or with a normal faulting earthquake. In contrast, the July 16 event had a clear compressional P-wave first motion at the U.S. National Seismic Network station BW06 (Boulder, Wyoming), and a less certain compressional first motion at another station. Compressional first motions are inconsistent with a pure collapse mechanism. We compared the waveforms from the three events recorded at three regional broadband digital telemetry stations, including SRU (Figure 4-10). The waveforms from the August 17 event are more similar to those from the January 30 Solvay mine collapse than those from the July 16 event. In particular, the waveforms from the July 16 event have more high-frequency energy, higher S/P amplitude ratios, and smaller surface waves compared to the other two events (Figure 4-10). Taylor (1994) recognized the same waveform differences between collapse-type and shear slip seismic events (see Section 4.31). Based on the waveform comparisons and the P-wave first motions, it appears that the August 17 event is probably another collapse but the July 16 event is not. 4-15
74
75 Table 4-2 The Willow Creek Composite Velocity Model Eastern Basin and Range Province Stations (Datum =2400 m) Colorado Plateau Province Stations (Datum = 2400 m) Willow Creek Mine Underground Stations (Datum = 1900 m) P-Wave Velocity (km/sec) Depth to Top of Layer (km) P-Wave Velocity (km/sec) Depth to Top of Layer (km) P-Wave Velocity (km/sec) Depth to Top of Layer (km)
76 Table 4-3 The Trail Mountain Composite Velocity Model Eastern Basin and Range Province Stations (Datum =2600 m) Colorado Plateau Province Stations (Datum = 2600 m) Stratigraphy (from this study and Williams and Arabasz, 1989) P-Wave Velocity (km/sec) Depth to Top of Layer (km) P-Wave Velocity (km/sec) Depth to Top of Layer (km) Formation at Bottom of Layer Age of Bottom Formation North Horn Tertiary Castlegate Ss Cretaceous Mancos Sh Cretaceous Morrison Jurassic Moenkopi Triassic Kaibab Ls Permian
77 Table 4-4 Data for Seismic Events in Table 4-1 Having Only Dilatational P-wave First Motions ID Yr Mo/Da (UT) Hr:Min (UTC) Observed First Motions* Q1 Q2 Q3 Azimuthal Range** (deg) /21 08: (202 to 340) /22 05: (203 to 339) /16 17: (106 to 031) /03 05: (111 to 028) /06 13: (123 to 033) /25 18: (170 to 330) /23 07: (110 to 027) /21 09: (136 to 348) /22 11: (203 to 324) /21 11: (114 to 013) /30 00: (189 to 342) * Quality (Q) based on signal-to-noise ratio (s/n) for first-motion reading: for Q1, s/n is 3 or greater; for Q2, between 2 and 3; for Q3, less than 2. ** Range of source-to-station azimuths, in degrees, within which first motions were observed (numbers in parentheses indicate azimuths at extremes of the range, beginning and ending in a clockwise direction).
78
79 SOURCE MECHANISMS OF MINE SEISMICITY TYPE EAMPLE explosion Surface mine blast implosion shear - slip Sudden roof-floor closure due to tabular collapse (or partial closure due to loss of pillar support) Shear fracture at mining opening or slip on nearby fault tensile fracture Opening crack (e.g., due to parting of roof strata along horizontal interface) Figure 4-1
80 40 00' Soldier Summit 39 30' Skyline #1 Skyline #3 White Oak #2 White Oak #1 Crandall Canyon #1 Huntington Canyon Trail Mtn. # , 3 Castle Gate #5 Willow Creek 10, 14 Castle Gate #3 Pinnacle Apex Horizon Gordon Creek #2 Aberdeen Gordon Creek # Price 5, 6 Star Point #2 Star Point #1 King #4,5,6 16 Deer Creek 2, 9 Hiawatha Trail Canyon Bear Canyon Cottonwood (Wilberg) Des-Bee-Dove 4, 8, 12, 13 Huntington Soldier Canyon Dugout Canyon 15 Sunnyside #1 Sunnyside #3 Horse Canyon MAGNITUDES Mines Ferron 39 00' SUFCO Emery Emery km ' ' ' ' Figure 4-2. Epicenter map (keyed to Table 4-1) of seismic events of magnitude 3.0 or larger in the WP-BC coal-mining region, January 1978 through June 2000.
81
82
83
84
85
86
87
88 5.0 REFERENCES Arabasz, W. J. and D. R. Julander (1986). Geometry of seismically active faults and crustal deformation within the Basin and Range-Colorado Plateau transition, in Cenozoic Tectonics of the Basin and Range Province: A Perspective on Processes and Kinematics of an Extensional Origin, L. Mayer, Editor, Geol. Soc. Am. Special Paper 208, Arabasz, W. J. and M. K. McCarter (2000). Mine seismicity and the interface between mining engineers and seismologists (abstract), Seismol. Res. Letters 71 (1), 220. Arabasz, W. J., S. J. Nava, and W. T. Phelps (1997). Mining seismicity in the Wasatch Plateau and Book Cliffs coal mining districts, Utah, USA, in Rockbursts and Seismicity in Mines, S. J. Gibowicz and S. Lasocki (eds.), Rotterdam: A. A. Balkema, Arabasz. W. J. and M. Wyss (1999). Spatially-varying b-values in coal-mining seismicity in Utah: Inferred influence of heterogeneity and stress differences on local mean magnitude (abstract), Eos, Trans. Am. Geophys. Union 80 (46), F651. Bjarnason, I. T. (1987). Contemporary tectonics of the Wasatch front region, Utah, from earthquake focal mechanisms, M.S. Thesis, University of Utah, Salt Lake City, Utah, 79 pp. Bjarnason, I. T. and J. C. Pechmann (1989). Contemporary tectonics of the Wasatch Front region, Utah, from earthquake focal mechanisms, Bull. Seism. Soc. Am. 79, Boler, F. M., S. Billington, and R. K. Zipf (1997). Seismological and energy balance constraints on the mechanism of a catastrophic bump in the Book Cliffs Coal Mining District, Utah, U.S.A., Int. J. Rock Mech. Min. Sci. 34, Brown, N. A. (1995). Union Pacific instrumental in developing Wyoming trona, Mining Engineering, February 1995, Committee on Seismic Signals from Mining Activity, National Research Council (1998). Seismic Signals from Mining Operations and the Comprehensive Test Ban Treaty: Comments on a Draft Report by a Department of Energy Working Group, National Academy Press, Washington, D.C., 68 pp., < Gearino, J. (2000). 1 injured in Solvay trona mine collapse, Casper Star Tribune, January 31, Gibowicz, S. J. (1990). Keynote lecture: The mechanism of seismic events induced by mining, in Rockbursts and Seismicity in Mines, C. Fairhurst (ed.), Rotterdam: A. A. Balkema, Habermann, R. E. (1995). Opinion [on quality issues of seismicity catalogs], Seism. Res. Letters 66 (5), 3. Hintze, L. F. (1988). Geologic History of Utah, Brigham Young University Geology Studies Special Publication 7, Department of Geology, Brigham Young University, Provo, Utah, 202 pp. Jahanbani, F. R. (1999) Annual Review and Forecast of Utah Coal Production and Distribution, State of Utah Department of Natural Resources, Salt Lake City, Utah, 37 pp. 5-1
89 Johnson, C. E. and D. M. Hadley (1976). Tectonic implications of the Brawley earthquake swarm, Imperial Valley, California, January 1975, Bull. Seism. Soc. Am. 66, Keller, G. R., R. B. Smith, and L. W. Braile (1975). Crustal structure along the Great Basin-Colorado Plateau transition from seismic refraction studies, J. Geophys. Res. 80, Klein, F. W. (1978). Hypocenter location program HYPOINVERSE, U.S. Geol. Surv., Open-File Rept , 113 pp. Knoll, P. and W. Kuhnt (1990). Seismological and technical investigations of the mechanics of rockbursts, in Rockbursts and Seismicity in Mines, C. Fairhurst (ed.), Rotterdam: A. A. Balkema, Larsen, K. (1997). Cottonwood Canyon Tract lease-by-application no. 8 spring map, Energy West Mining Company, scale 1:24,000. Loeb, D. T. (1986). The P-wave velocity structure of the crust-mantle boundary beneath Utah, M.S. Thesis, University of Utah, Salt Lake City, Utah, 126 pp. Loeb, D. T. and J. C. Pechmann (1986). The P-wave velocity structure of the crust-mantle boundary beneath Utah from network travel-time measurements, Earthquake Notes 57 (1), 10. Miller, L. (2000). 4.2 quake triggers rock slide on U.S. 6, Salt Lake Tribune, March 8, Patton, H. J. and G. Zandt (1991). Seismic moment tensors of western U.S. earthquakes and implications for the tectonic stress field, J. Geophys. Res. 96, 18,245-18,259. Pechmann, J. C., S. J. Nava, and W. J. Arabasz (1999). Installation and calibration of five new broadband digital telemetry stations in Utah, Seism. Res. Letters 70, 244. Pechmann, J. C., W. R. Walter, S. J. Nava, and W. J. Arabasz (1995). The February 3, 1995, M L 5.1 seismic event in the trona mining district of southwestern Wyoming, Seism. Res. Letters 66 (3), [minor correction, including revision of the magnitude to M L 5.2, added in 66, no. 4, 28]. Phillips, W. S., D. C. Pearson,. Yang, and B. W. Stump (1999). Aftershocks of an explosively induced mine collapse at White Pine, Michigan, Bull. Seism. Soc. Am. 89, Richards, P. G. (1997). Seismological methods of verification and the International Monitoring System, in The Comprehensive Test Ban Treaty: Issues and Answers, M. Mckinzie (ed.), New York: Cornell University Peace Studies Program Occasional Paper No. 21, Ch. 7. Richardson, A. M., L. J. Gilbride, J. Trackemas, and J. Mercier (1996). The influence of massive sandstones in the main roof on longwall support loading, in Proceedings, 15 th International Conference on Ground Control in Mining, L. Ozdemir, K. Hanna, K. Y. Haramy, and S. Peng (eds.), Colorado School of Mines, Golden, Colorado,
90 Roller, R. C. (1965). Crustal structure in the eastern Colorado Plateaus province from seismic refraction measurements, Bull. Seism. Soc. Am. 55, Taylor, S. T. (1994). False alarms and mine seismicity: An example from the Gentry Mountain mining region, Utah, Bull. Seism. Soc. Am. 84, Swanson, P. L. and F. M. Boler (1995). The magnitude 5.3 seismic event and collapse of the Solvay Trona Mine: Analysis of pillar/floor failure stability, U.S. Bureau of Mines Open File Rept. 86-9, 82 pp. Uhrhammer, R. A., W. Karavas, and B. Romanowicz (1998). Broadband seismic station installation guidelines, Seism. Res. Lett. 69, Walter, W. R., S. L. Hunter, and L. A. Glen (1996). Preliminary report on LLNL mine seismicity deployment at the Twentymile Coal Mine, Technical Report UCRL-ID , Lawrence Livermore National Laboratory, Livermore, California, 20 pp. Walter, W. R., J. Swenson, W. Foxall, P. Vincent, A. J. Rodgers, and J. Bhattacharyya (2000). Complete regional waveform modeling for source and structure: A source example using the January 30, 2000 mine collapse in Wyoming, Abstract for Poster Presentation, 12 th Annual IRIS Meeting, May 7-11, Rockport, Maine. Wiemer, S. and M. Wyss (1994). Seismic quiescence before the Landers (M = 7.5) and Big Bear (M = 6.5) 1992 earthquakes, Bull. Seism. Soc. Am. 84, Wiemer, S., R. Zuniga, and A. Allman (1995). ZMAP Version 2.1, May 1995 [interactive software program], Geophysical Institute, University of Alaska. Williams, D. J. and W. J. Arabasz (1989). Mining-related and tectonic seismicity in the East Mountain area, Wasatch Plateau, Utah, PAGEOPH 129, Wong, I. G. (1993). Tectonic stresses in mine seismicity: Are they significant?, in Rockbursts and Seismicity in Mines 93, R. P. Youngs (ed.), Rotterdam: A. A. Balkema, Wong, I. G. and J. R. Humphrey (1989). Contemporary seismicity, faulting, and the state of stress in the Colorado Plateau, Geol. Soc. Am. Bull 101, Wong, I. G., J. R. Humphrey, J. A. Adams, and W. J. Silva (1989). Observations of mine seismicity in the eastern Wasatch Plateau, U.S.A.: A possible case of implosional failure, PAGEOPH 129, Wong, I. G. and A. McGarr (1990). Implosional failure in mining-induced seismicity: A critical review, in Rockbursts and Seismicity in Mines, C. Fairhurst (ed.), Rotterdam: A. A. Balkema, Woods, B. B., S. Kedar, and D. V. Helmberger (1993). M L :M 0 as a regional seismic discriminant, Bull. Seism. Soc. Am. 83,
91 Yang,., B. W. Stump, and W. S. Phillips (1998). Source mechanism of an explosively induced mine collapse, Bull. Seism. Soc. Am. 88, Zuniga, R. and M. Wyss (1995). Inadvertent changes in magnitude reported in earthquake catalogs: Their evaluation through b-value estimates, Bull. Seism. Soc. Am. 85,
92 APPENDI A LIST OF MINING-RELATED SEISMIC EVENTS M 2.5 IN THE WASATCH PLATEAU-BOOK CLIFFS COAL MINING DISTRICTS JANUARY 1, 1978 TO JUNE 30, 2000
93 Summary and Data Explanation This appendix contains a listing of seismic events of magnitude 2.5 and greater detected and located in the Wasatch Plateau and Book Cliffs coal mining districts by the University of Utah regional seismic network for the period January 1, 1978, to June 30, The geographic bounds of the sample area coincide with the two polygons shown in Figure 3-5: (1) an arcuate crescent encompassing the Wasatch Plateau and Book Cliffs coal fields and (2) an isolated area of mining in the southern Wasatch Plateau. The computer program HYPOINVERSE (Klein, 1978) was used to process the earthquake data. For each earthquake, the following data are listed:! Date and origin time in Universal Coordinated Time (UTC). Subtract seven hours to convert to Mountain Standard Time (MST) and six hours to convert to Mountain Daylight Time (MDT).! Earthquake location coordinates in degrees and minutes of north latitude and west longitude, and depth in kilometers. Computed focal depths are unreliable because of poor focal-depth control (see section 3.23).! MAG, the local magnitude (M L ) for each earthquake. "W" indicates peak amplitude measurements from Wood-Anderson seismograms were used; Ah@ indicates a weightedaverage estimate of M L, referred to in the main body of the report as M L (see section 3.21). Otherwise, the estimate is calculated from signal durations and is an empirical estimate of M L referred to in the report as M C (also described in section 3.21).! NO, the number of P and S readings used in the solution.! GAP, the largest azimuthal separation in degrees between recording stations used in the solution.! DMN, the epicentral distance in kilometers to the closest station.! RMS, the root-mean-square of the travel-time residuals in seconds: (W i Ri ) i RMS = 2 (W i ) i where R i is the observed minus the computed arrival time for the i-th P or S reading and W i is the relative weight given to the i-th P or S arrival time (0.0 for no weight through 1.0 for full weight) A-1
94 date orig time latitude longitude depth mag no gap dmn rms * * * * * * * * * * * * 2.6W h W h h h h W h W A-2
95 date orig time latitude longitude depth mag no gap dmn rms W h h W W h W W W W W h W h h h h A-3
96 date orig time latitude longitude depth mag no gap dmn rms h h h h h W W h h W W A-4
97 date orig time latitude longitude depth mag no gap dmn rms W W W W W W W W W number of earthquakes = 148 * indicates fixed focal depth of 7.0km A-5
98 APPENDI B QUARTERLY COAL MINE PRODUCTION FOR MINES IN THE WASATCH PLATEAU-BOOK CLIFFS COAL MINING DISTRICTS, 1995S1998 compiled by Jefferson D. McKenzie Department of Mining Engineering University of Utah

99

100

101
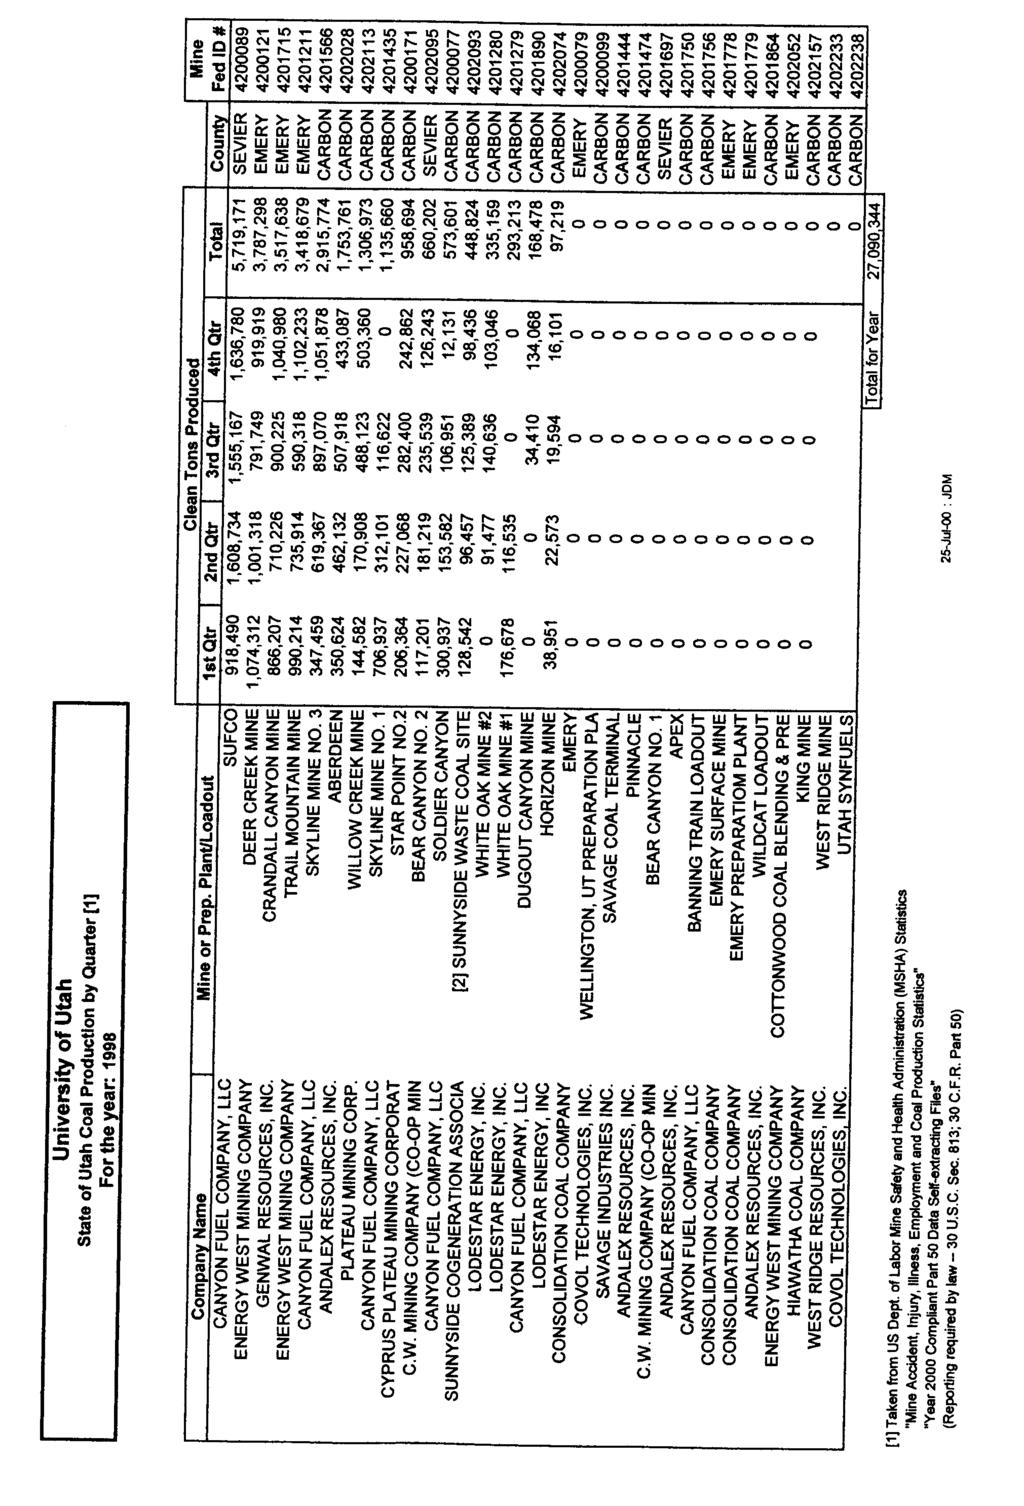
102
Quarterly Report April 1 - June 30, By: Shirley P. Dutton. Work Performed Under Contract No.: DE-FC22-95BC14936
 DE-FC22-95BC14936--18 Application of Advanced Reservoir Characterization, Simulation, and Production Optimization Strategies to Maximize Recovery in Slope, and Basin Clastic Reservoirs, West Texas (Delaware
The Unique Source Mechanism of an Explosively Induced Mine Collapse
 The Unique Source Mechanism of an Explosively Induced Mine Collapse Xiaoning Yang, Brian W. Stump, W. Scott Phillips Geophysics Group - EES-3, Los Alamos National Laboratory Contract No. W-7405-ENG-36
Low Cost Seismic Monitoring Strategies
 Low Cost Seismic Monitoring Strategies Derrick J. Chambers Mining Engineer Spokane Mining Research Division NIOSH Research Team: Shawn Boltz, Derrick Chambers, Dave Hanson, Sean Johnson, Jerry Richardson,
MONITORING ROUTINE MINE SEISMICITY IN THE CONTERMINOUS UNITED STATES
 MONITORING ROUTINE MINE SEISMICITY IN THE CONTERMINOUS UNITED STATES James W. Dewey and Alena L. Leeds Adjunct US National Data Center at U.S. Geological Survey (USGS) Sponsored by U.S. Department of Defense
Valley-Fill Sandstones in the Kootenai Formation on the Crow Indian Reservation, South-Central Montana
 DE-FG22-96BC14996--08 Valley-Fill Sandstones in the Kootenai Formation on the Crow Indian Reservation, South-Central Montana Quarterly Report April 1 - June 30, 1998 By David A. Lopez Work Performed Under
Analysis of Shane Telescope Aberration and After Collimation
 UCRL-ID- 133548 Analysis of Shane Telescope Aberration and After Collimation Before Don Gavel January 26,1999 This is an informal report intended primarily for internal or limited external distribution.
Seismic Characteristics and Mechanisms of Rockbursts
 Seismic Characteristics and Mechanisms of Rockbursts T. J. Bennett, M. E. Marshall, K. L McLaughlin, B. W. Barker and J. R. Murphy S-CUBED 11800 Sunrise Valley Dr., Suite 1212 Reston, Virginia 22091 Contract
27th Seismic Research Review: Ground-Based Nuclear Explosion Monitoring Technologies
 EVALUATION OF CROSS-CORRELATION METHODS ON A MASSIVE SCALE FOR ACCURATE RELOCATION OF SEISMIC EVENTS Won-Young Kim, Paul G. Richards, David P. Schaff, Felix Waldhauser, and Jian Zhang Lamont-Doherty Earth
Valley-Fill Sandstones in the Kootenai Formation on the Crow Indian Reservation, South-Central Montana
 DE-FG22-96BC14996--06 Valley-Fill Sandstones in the Kootenai Formation on the Crow Indian Reservation, South-Central Montana Quarterly Report October 1 - December 31, 1997 By David A. Lopez Work Performed
Improving Regional Seismic Event Location Through Calibration of the International Monitoring System
 UCRL-JC-133019 PREPRINT Improving Regional Seismic Event Location Through Calibration of the International Monitoring System C.A. Schultz S.C. Myers M. Flanagan J. Swenson W. Hanley M. Pasyanos This paper
Contemporary Tectonics and Seismicity of the Teton and Southern Yellowstone Fault Systems- Phase I
 University of Wyoming National Park Service Research Center Annual Report Volume 4 4th Annual Report, 1980 Article 16 1-1-1980 Contemporary Tectonics and Seismicity of the Teton and Southern Yellowstone
South Carolina Seismic Network Bulletin
 South Carolina Seismic Network Bulletin Volume XIII 2003 Prepared by: Pradeep Talwani Abhijit Gangopadhyay and Richard Cannon SPONSORS: Department of Energy/Westinghouse Savannah River Company United States
Seismic Observation and Seismicity of Uganda
 (Uganda, Mr. Nyago Joseph, 2012-2013S) Seismic Observation and Seismicity of Uganda 1. Seismic observation in Uganda In 1989, UNESCO and the International Programs in Physical Sciences (IPPS) donated four
External Grant Award Number 01HQAG0009 WESTERN GREAT BASIN SEISMIC NETWORK OPERATIONS. December 1, 2000 to November 30, 2001
 External Grant Award Number 01HQAG0009 WESTERN GREAT BASIN SEISMIC NETWORK OPERATIONS December 1, 2000 to November 30, 2001 Glenn P. Biasi University of Nevada Reno Seismological Laboratory MS-174 Reno,
Contractor Name and Address: Oxy USA, Inc. (Oxy), Midland, Texas OBJECTIVES
, Midland, Texas OBJECTIVES") 1 F TITLE: APPLICATION OF RESERVOIR CHARACTERIZATION AND ADVANCED TECHNOLOGY TO IMPROVE RECOVERY AND ECONOMICS IN A LOWER QUALITY SHALLOW SHELF CARBONATE RESERVOIR Cooperative Agreement No.: DE - FC22-948C14990
1 F TITLE: APPLICATION OF RESERVOIR CHARACTERIZATION AND ADVANCED TECHNOLOGY TO IMPROVE RECOVERY AND ECONOMICS IN A LOWER QUALITY SHALLOW SHELF CARBONATE RESERVOIR Cooperative Agreement No.: DE - FC22-948C14990
A BROADBAND SEISMIC EXPERIMENT IN YUNNAN, SOUTHWEST CHINA. Sponsored by Defense Threat Reduction Agency. Contract No.
 A BROADBAND SEISMIC EXPERIMENT IN YUNNAN, SOUTHWEST CHINA Wenjie Jiao, 1 Winston Chan, 1 and Chunyong Wang 2 Multimax Inc., 1 Institute of Geophysics, China Seismological Bureau 2 Sponsored by Defense
SCEK Report on Phase I ( ) Induced Seismicity Monitoring Project (ISMP) Carlos Salas, VP Oil & Gas, Geoscience BC
 Induced Seismicity Monitoring Project (ISMP) Carlos Salas, VP Oil & Gas, Geoscience BC") SCEK Report on Phase I (2012 2013) Induced Seismicity Monitoring Project (ISMP) Carlos Salas, VP Oil & Gas, Geoscience BC Contents Background... 2 Summary of Activities... 5 Additional Work... 8 References...
SCEK Report on Phase I (2012 2013) Induced Seismicity Monitoring Project (ISMP) Carlos Salas, VP Oil & Gas, Geoscience BC Contents Background... 2 Summary of Activities... 5 Additional Work... 8 References...
United States Department of the Interior
 IN KHM.Y RKKKR'IO. United States Department of the Interior GEOLOGICAL SURVEY BOX 25016 'M.S._911_ DENVER FEDERAL CENTER DENVER, COLORADO 80225 May 1A, 1981 Memorandum To: Through: From: Mr. Mr. Earl W.
BASAL CAMBRIAN BASELINE GEOLOGICAL CHARACTERIZATION COMPLETED
 BASAL CAMBRIAN BASELINE GEOLOGICAL CHARACTERIZATION COMPLETED Plains CO 2 Reduction (PCOR) Partnership Phase III Task 16 Milestone M33 Prepared for: Andrea T. McNemar National Energy Technology Laboratory
Empirical Green s Function Analysis of the Wells, Nevada, Earthquake Source
 Nevada Bureau of Mines and Geology Special Publication 36 Empirical Green s Function Analysis of the Wells, Nevada, Earthquake Source by Mendoza, C. 1 and Hartzell S. 2 1 Centro de Geociencias, Universidad
DEVELOPMENT OF AUTOMATED MOMENT TENSOR SOFTWARE AT THE PROTOTYPE INTERNATIONAL DATA CENTER
 DEVELOPMENT OF AUTOMATED MOMENT TENSOR SOFTWARE AT THE PROTOTYPE INTERNATIONAL DATA CENTER Douglas Dreger, Barbara Romanowicz, and Jeffry Stevens* Seismological Laboratory 281 McCone Hall University of
Tell uric prof i 1 es across the Darrough Known Geothermal Resource Area, Nevada. Harold Kaufniann. Open-file Report No.
 Tell uric prof i 1 es across the Darrough Known Geothermal Resource Area, Nevada c i 4 L BY D Harold Kaufniann U.S. Geological Survey. r,. Open-file Report No. 76-286 1976 \, *\. i \ -- i 1'.- - L -.,,-.,
A Study of Mine Blasts and Rockbursts in the Pacific Northwest. Abstract
 A Study of Mine Blasts and Rockbursts in the Pacific Northwest Alan Rohay and Shannon Goodwin Pacific Northwest Laboratory Richland, Washington, 99352 Contract No. DE-AC-06-76RLO 1830 Abstract We have
FULL MOMENT TENSOR ANALYSIS USING FIRST MOTION DATA AT THE GEYSERS GEOTHERMAL FIELD
 PROCEEDINGS, Thirty-Eighth Workshop on Geothermal Reservoir Engineering Stanford University, Stanford, California, February 11-13, 2013 SGP-TR-198 FULL MOMENT TENSOR ANALYSIS USING FIRST MOTION DATA AT
REGIONAL OBSERVATIONS OF MINING BLASTS BY THE GSETT-3 SEISMIC MONITORING SYSTEM
 REGIONAL OBSERVATIONS OF MINING BLASTS BY THE GSETT-3 SEISMIC MONITORING SYSTEM Brian W. Stump and D. Craig Pearson Los Alamos National Laboratory EES-3, MS-C335 Los Alamos, NM 87545 The cessation of testing
PROJECT PROGRESS REPORT (03/lfi?lfibr-~/15/1998):
:") F?ECEVVEI) N% 05 w PROJECT PROGRESS REPORT (03/lfi?lfibr-~/15/1998): A COMPREHENSIVE STUDY OF FRACTURE PATTERNS AND DENSITIES IN THE GEYSERS GEOTHERMAL RESERVOIR USING MICROEARTHQUAKE SHEAR-WAVE SPLITTING
F?ECEVVEI) N% 05 w PROJECT PROGRESS REPORT (03/lfi?lfibr-~/15/1998): A COMPREHENSIVE STUDY OF FRACTURE PATTERNS AND DENSITIES IN THE GEYSERS GEOTHERMAL RESERVOIR USING MICROEARTHQUAKE SHEAR-WAVE SPLITTING
Seismicity in Pennsylvania and the Pennsylvania State Seismic Network (PASEIS)
") Seismicity in Pennsylvania and the Pennsylvania State Seismic Network (PASEIS) Andy Nyblade Department of Geosciences, Penn State University May 19, 2017 Shale Network Workshop Introduction Review of historic
Seismicity in Pennsylvania and the Pennsylvania State Seismic Network (PASEIS) Andy Nyblade Department of Geosciences, Penn State University May 19, 2017 Shale Network Workshop Introduction Review of historic
CATALOG OF EARTHQUAKES IN DELAWARE
 State of Delaware DELAWARE GEOLOGICAL SURVEY Robert R. Jordan, State Geologist SERVICE RESEARCH DELAWARE GEOLOGICAL SURVEY EXPLORATION OPEN FILE REPORT NO. 42 CATALOG OF EARTHQUAKES IN DELAWARE by Stefanie
Determining the Earthquake Epicenter: Japan
 Practice Name: Hour: Determining the Earthquake Epicenter: Japan Measuring the S-P interval There are hundreds of seismic data recording stations throughout the United States and the rest of the world.
Flipping Bits in the James Webb Space Telescope s Cameras
 Flipping Bits in the James Webb Space Telescope s Cameras Lance Simms IEEE Life Members Talk 05/16/2018 LLNL-PRES-735208 This work was performed under the auspices of the U.S. Department of Energy by Lawrence
Seismic Recording Station AZ_PFO Summary Report
 Seismic Recording Station AZ_PFO Summary Report Thank you for hosting station AZ_PFO on your property. We hope that you find the enclosed report interesting. Your station is one of the 2000 USArray seismic
Earthquake patterns in the Flinders Ranges - Temporary network , preliminary results
 Earthquake patterns in the Flinders Ranges - Temporary network 2003-2006, preliminary results Objectives David Love 1, Phil Cummins 2, Natalie Balfour 3 1 Primary Industries and Resources South Australia
29th Monitoring Research Review: Ground-Based Nuclear Explosion Monitoring Technologies
 IMPROVING MAGNITUDE DETECTION THRESHOLDS USING MULTI-STATION, MULTI-EVENT, AND MULTI-PHASE METHODS David Schaff and Felix Waldhauser Lamont-Doherty Earth Observatory, Columbia University Sponsored by Air
August 3,1999. Stiffness and Strength Properties for Basic Sandwich Material Core Types UCRL-JC B. Kim, R.M. Christensen.
 Preprint UCRL-JC-135347 Stiffness and Strength Properties for Basic Sandwich Material Core Types B. Kim, R.M. Christensen This article was submitted to ASME IMECE 99, Nashville, TN, November 14-19, 1999
IDENTIFICATION OF ROCKBURSTS AND OTHER MINING EVENTS USING REGIONAL SIGNALS AT INTERNATIONAL MONITORING SYSTEM STATIONS
 IDENTIFICATION OF ROCKBURSTS AND OTHER MINING EVENTS USING REGIONAL SIGNALS AT INTERNATIONAL MONITORING SYSTEM STATIONS Theron J. Bennett and Margaret E. Marshall Science Applications International Corporation
SEISMIC CALIBRATION OF THE EUROPEAN ARCTIC
 SEISMIC CALIBRATION OF THE EUROPEAN ARCTIC Svein Mykkeltveit, Frode Ringdal, Conrad Lindholm, NORSAR Elena Kremenetskaya, Kola Regional Seismological Centre Sponsored by U.S. Department of Energy Office
DEVELOPMENT OF AUTOMATED MOMENT TENSOR SOFTWARE AT THE PROTOTYPE INTERNATIONAL DATA CENTER
 DEVELOPMENT OF AUTOMATED MOMENT TENSOR SOFTWARE AT THE PROTOTYPE INTERNATIONAL DATA CENTER Douglas Dreger 1, Barbara Romanowicz 1, G. Clitheroe 1, Peggy Hellweg 1, Jeffry Stevens 2 University of California,
Partial Discharge Characterization of High-Voltage Cables and Components
 UCRL-JC-123503 PREPRINT Partial Discharge Characterization of High-Voltage Cables and Components R L Druce, and R S Lee Lawrence Livermore National Laboratory This paper was prepared for submission to
Seismic Monitoring of Mine Environments
 Mapping and Monitoring the Mine Environment Paper 123 Explor97 Master Page Explor97 Contents Previous Paper G O T O Author Index Section Contents Next Paper Seismic Monitoring of Mine Environments Urbancic,
Development of a High Intensity EBIT for Basic and Applied Science
 UCRL-ID- 129832 Development of a High Intensity EBIT for Basic and Applied Science R.E. Marrs D. Schneider February 5,1998 This is an informal report intended primarily for internal or limited external
Application of Phase Matched Filtering on Surface Waves for Regional Moment Tensor Analysis Andrea Chiang a and G. Eli Baker b
 1 2 3 4 5 6 7 8 9 10 11 12 13 14 15 16 17 18 19 20 21 22 23 24 25 26 27 28 29 30 31 Application of Phase Matched Filtering on Surface Waves for Regional Moment Tensor Analysis Andrea Chiang a and G. Eli
26th Seismic Research Review - Trends in Nuclear Explosion Monitoring
 RESEARCH IN REGIONAL SEISMIC MONITORING Frode Ringdal 1, Tormod Kvaerna 1, Elena O. Kremenetskaya 2, Vladimir E. Asming 2, Sergeij Kozyrev 2, Svein Mykkeltveit 1, Steven J. Gibbons 1, and Johannes Schweitzer
One of the coldest places in the country - Peter Sinks yet again sets this year s coldest temperature record for the contiguous United States.
 One of the coldest places in the country - Peter Sinks yet again sets this year s coldest temperature record for the contiguous United States. In the early morning of February 22, 2010 the temperature
GM 1.4. SEG/Houston 2005 Annual Meeting 639
 storage recovery project in Leyden, Colorado Kristofer Davis *, Yaoguo Li, Michael Batzle, and Bob Raynolds** Center for Gravity, Electrical, and Magnetic Studies, Department of Geophysics, Colorado School
Modified Kriging: Evaluation, Modification, Recommendations
 UCRL-ID- 12873 1 Modified Kriging: Evaluation, Modification, Recommendations and C.A. Schultz S.C. Myers September 1997 This is an informal report intended primarily forinternal or limited external distribution.
Applications of Pulse Shape Analysis to HPGe Gamma-Ray Detectors
 UCRL-JC- 134555 PREPRINT Applications of Pulse Shape Analysis to HPGe Gamma-Ray Detectors GJ. Schmid D.A. Beckedahl JJ. Blair J.E. Kammeraad This paper was prepared for submittal to the American Nuclear
GA A22722 CENTRAL THOMSON SCATTERING UPGRADE ON DIII D
 GA A22722 CENTRAL THOMSON SCATTERING UPGRADE ON DIII D by D.G. NILSON, T.N. CARLSTROM, C.L. HSIEH, B.W. STALLARD, and R.E. STOCKDALE NOVEMBER 1997 DISCLAIMER This report was prepared as an account of work
Development of U. S. National Seismic Hazard Maps and Implementation in the International Building Code
 Development of U. S. National Seismic Hazard Maps and Implementation in the International Building Code Mark D. Petersen (U.S. Geological Survey) http://earthquake.usgs.gov/hazmaps/ Seismic hazard analysis
revised October 30, 2001 Carlos Mendoza
 Earthquake Sources in the circum-caribbean Region Puerto Rico Tsunami Mitigation and Warning Program Federal Emergency Management Agency Preliminary Report: Task 3 revised October 30, 2001 Carlos Mendoza
QUARTERLY TECHNICAL REPORT 78 - for HANFORD SEISMIC NETWORK. October 1 through December Geophysics Program. University of Washington
 QUARTERLY TECHNICAL REPORT 78 - for HANFOR SEISMIC NETWORK October 1 through ecember 31 1978 Geophysics Program University of Washington This report was prepared as an account of work sponsored by the
Earthquake Engineering GE / CE - 479/679
 Earthquake Engineering GE / CE - 479/679 Topic 4. Seismometry John G. Anderson Director February 4-6, 2003 1 Wood-Anderson Seismograph Important because: Principles of operation are widely used. Basis
the IRIS Consortium Collaborative, Multi-user Facilities for Research and Education Briefing NSF Business Systems Review September 9, 2008
 the IRIS Consortium Collaborative, Multi-user Facilities for Research and Education Briefing NSF Business Systems Review September 9, 2008 A facilities program for collection and distribution of seismological
24th Seismic Research Review Nuclear Explosion Monitoring: Innovation and Integration
 SEISMIC MONITORING OF BLASTING ACTIVITY IN RUSSIA Michael A.H. Hedlin University of California, San Diego Sponsored by Defense Threat Reduction Agency Contract No. DTRA01-00-C-0115 ABSTRACT Two significant
Investigation of long period amplifications in the Greater Bangkok basin by microtremor observations
 Proceedings of the Tenth Pacific Conference on Earthquake Engineering Building an Earthquake-Resilient Pacific 6-8 November 2015, Sydney, Australia Investigation of long period amplifications in the Greater
PRECISION STUDIES OF NUCLEI
 .., -: PRECISION STUDIES OF NUCLEI Final Report September 1, 1994- December 31, 1996 Paul E. Ulmer, Principal Investigator Department of Physics Old Dominion University Norfolk, VA 23529 Report Date: February
Seismic Recording Station TA_109C Summary Report
 Seismic Recording Station TA_109C Summary Report Thank you for hosting station TA_109C on your property. We hope that you find the enclosed report interesting. Your station is one of the 2000 USArray seismic
SOURCE AND PROPAGATION CHARACTERISTICS OF EXPLOSIVE AND OTHER SEISMIC SOURCES
 SOURCE AND PROPAGATION CHARACTERISTICS OF EXPLOSIVE AND OTHER SEISMIC SOURCES Xiaoxi Ni 1, Winston Chan 1, Robert Wagner 1, William Walter 2, and Eric Matzel 2 Multimax, Inc. 1 and Lawrence Livermore National
Seismic Observation and Seismicity of Zimbabwe
 Seismic Observation and Seismicity of Zimbabwe Mr. Innocent Gibbon Tirivanhu MASUKWEDZA (2016 Global Seismology course) Meteorological Services Department of Zimbabwe 1. Introduction The Seismology section
Article from: Risk Management. March 2009 Issue 15
 Article from: Risk Management March 2009 Issue 15 XXXXXXXXXXXXX RISK IDENTIFICATION Preparing for a New View of U.S. Earthquake Risk By Prasad Gunturi and Kyle Beatty INTRODUCTION The United States Geological
On May 4, 2001, central Arkansas experienced an M=4.4 earthquake followed by a
 1. Introduction On May 4, 2001, central Arkansas experienced an M=4.4 earthquake followed by a surprisingly large number of small earthquakes. We recorded about 2500 above the ambient noise level on a
Peak Reliability Delivering near real-time phase angle deltas using Inter-Control Center Communication Protocol (ICCP)
") Peak Reliability Delivering near real-time phase angle deltas using Inter-Control Center Communication Protocol (ICCP) NASPI meeting March 23, 2015 Dan Brancaccio 1 Peak Reliability Synchrophasor Program
Peak Reliability Delivering near real-time phase angle deltas using Inter-Control Center Communication Protocol (ICCP) NASPI meeting March 23, 2015 Dan Brancaccio 1 Peak Reliability Synchrophasor Program
Forces in Earth s Crust
 Name Date Class Earthquakes Section Summary Forces in Earth s Crust Guide for Reading How does stress in the crust change Earth s surface? Where are faults usually found, and why do they form? What land
RESEARCH OPPORTUNITIES AT THE CNS (Y-12 AND PANTEX) NUCLEAR DETECTION AND SENSOR TESTING CENTERS (NDSTC)
 NUCLEAR DETECTION AND SENSOR TESTING CENTERS (NDSTC)") Y / DW-2319 RESEARCH OPPORTUNITIES AT THE CNS (Y-12 AND PANTEX) NUCLEAR DETECTION AND SENSOR TESTING CENTERS (NDSTC) Carter Hull 1 Carter.Hull@cns.doe.gov Jim Tallent 4, Dennis Tollefson 2, Martin Williamson
Y / DW-2319 RESEARCH OPPORTUNITIES AT THE CNS (Y-12 AND PANTEX) NUCLEAR DETECTION AND SENSOR TESTING CENTERS (NDSTC) Carter Hull 1 Carter.Hull@cns.doe.gov Jim Tallent 4, Dennis Tollefson 2, Martin Williamson
2008 Monitoring Research Review: Ground-Based Nuclear Explosion Monitoring Technologies
 EXTENSION OF THE CAUCASUS SEISMIC INFORMATION NETWORK STUDY INTO CENTRAL ASIA Randolph Martin 1, Mary L. Krasovec 1, Eileen Vergino 2, and M. Nafi Toksöz 3 New England Research 1, Lawrence Livermore National
Data Comparisons Y-12 West Tower Data
 Data Comparisons Y-12 West Tower Data Used hourly data from 2007 2010. To fully compare this data to the data from ASOS sites where wind sensor starting thresholds, rounding, and administrative limits
A TER. Observation of Xe with the PNNL ARSA System PNNL UC-7 13
 PNNL-11654 UC-7 13 135 Observation of Xe with the PNNL ARSA System P.L. Reeder, T.W. Bowyer, K.H. Abel, C.W. Hubbard, M.E. Panisko, R.C. Thompson, R.A. Warner August 1997 Prepared for the US. Department
Please be sure to save a copy of this activity to your computer!
 Thank you for your purchase Please be sure to save a copy of this activity to your computer! This activity is copyrighted by AIMS Education Foundation. All rights reserved. No part of this work may be
Near-Field Sturgeon Monitoring for the New NY Bridge at Tappan Zee. Quarterly Report October 1 December 31, 2014
 Near-Field Sturgeon Monitoring for the New NY Bridge at Tappan Zee Quarterly Report October 1 December 31, 2014 Prepared by AKRF, Inc. 7250 Parkway Drive, Suite 210 Hanover, MD 21076 for New York State
Automatic Moment Tensor Analyses, In-Situ Stress Estimation and Temporal Stress Changes at The Geysers EGS Demonstration Project
 PROCEEDINGS, 42nd Workshop on Geothermal Reservoir Engineering Stanford University, Stanford, California, February 13-15, 2017 SGP-TR-212 Automatic Moment Tensor Analyses, In-Situ Stress Estimation and
Plasma Response Control Using Advanced Feedback Techniques
 Plasma Response Control Using Advanced Feedback Techniques by M. Clement 1 with J. M. Hanson 1, J. Bialek 1 and G. A. Navratil 1 1 Columbia University Presented at 59 th Annual APS Meeting Division of
New Findings Form Basis for Earthquake
 Page 1 of 5 enter key Advanced Se Español Français Pycckuú You Are In: USINFO > Products >Washfile 10 November 2005 New Findings Form Basis for Earthquake Warning System Tracking quake waves could give
EPICENTRAL LOCATION OF REGIONAL SEISMIC EVENTS BASED ON LOVE WAVE EMPIRICAL GREEN S FUNCTIONS FROM AMBIENT NOISE
 EPICENTRAL LOCATION OF REGIONAL SEISMIC EVENTS BASED ON LOVE WAVE EMPIRICAL GREEN S FUNCTIONS FROM AMBIENT NOISE Anatoli L. Levshin, Mikhail P. Barmin, and Michael H. Ritzwoller University of Colorado
HEAT TRANSFER AND THERMAL STRESS ANALYSES OF A GLASS BEAM DUMP
 UCRL-D-122231 HEAT TRANSFER AND THERMAL STRESS ANALYSES OF A GLASS BEAM DUMP Virginia C. Garcia September 1995 This is an informal report intended primarily for internal or limited external distribution.
LLNL DATA COLLECTION DURING NOAAETL COPE EXPERIMENT
 UCRL-ID-121682 LLNL DATA COLLECTION DURING NOAAETL COPE EXPERIMENT Test Plan David D. Manfrom Imaging & Detection Program September 6,1995 This is an informal report intended primarily for internal or
Local Magnitude Determinations for Intermountain Seismic Belt Earthquakes from Broadband Digital Data
 Bulletin of the Seismological Society of America, Vol. 97, No. 2, pp. 557 574, April 2007, doi: 10.1785/0120060114 Local Magnitude Determinations for Intermountain Seismic Belt Earthquakes from Broadband
Magnetic Measurements of the Elliptical Multipole Wiggler Prototype
 ANL/APS/TB-22 Magnetic Measurements of the Elliptical Multipole Wiggler Prototype by D. Frachon, I. Vasserman, P. M. Ivanov, E. A. Medvedko, E. Gluskin, and N. A. Vinokurov March 1995 Advanced Photon Source
Earthquakes. Earthquake Magnitudes 10/1/2013. Environmental Geology Chapter 8 Earthquakes and Related Phenomena
 Environmental Geology Chapter 8 Earthquakes and Related Phenomena Fall 2013 Northridge 1994 Kobe 1995 Mexico City 1985 China 2008 Earthquakes Earthquake Magnitudes Earthquake Magnitudes Richter Magnitude
[work in progress] Dave Harris. Tern Hauk
![[work in progress] Dave Harris. Tern Hauk](/thumbs/94/121711853.jpg "[work in progress] Dave Harris. Tern Hauk") UCRLJC- 12952 PREPRNT Can T Phases Be Used to Map Blockage? [work in progress] Dave Harris Tern Hauk Presented at the 1995 Monitoring Technologies Conference Westfields nternational Conference Center Chantilly,
UCRLJC- 12952 PREPRNT Can T Phases Be Used to Map Blockage? [work in progress] Dave Harris Tern Hauk Presented at the 1995 Monitoring Technologies Conference Westfields nternational Conference Center Chantilly,
The following information is provided for your use in describing climate and water supply conditions in the West as of April 1, 2003.
 Natural Resources Conservation Service National Water and Climate Center 101 SW Main Street, Suite 1600 Portland, OR 97204-3224 Date: April 8, 2003 Subject: April 1, 2003 Western Snowpack Conditions and
Plutonium 239 Equivalency Calculations
 LLNL-TR-490356 Plutonium 239 Equivalency Calculations J. Wen July 7, 2011 Disclaimer This document was prepared as an account of work sponsored by an agency of the United States government. Neither the
Potential Injection-Induced Seismicity Associated With Oil & Gas Development
 Potential Injection-Induced Seismicity Associated With Oil & Gas Development A primer on technical & regulatory considerations informing risk management & mitigation Second Edition September, 2017 www.statesfirstinitiative.org
Earthquakes and Earth s Interior
 - What are Earthquakes? Earthquakes and Earth s Interior - The shaking or trembling caused by the sudden release of energy - Usually associated with faulting or breaking of rocks - Continuing adjustment
Basic Seismological Characterization for Platte County, Wyoming. James C. Case Wyoming State Geological Survey July, 2002 BACKGROUND
 Basic Seismological Characterization for Platte County, Wyoming by James C. Case Wyoming State Geological Survey July, 2002 BACKGROUND Seismological characterizations of an area can range from an analysis
INTERMOLECULAR POTENTIAL FUNCTIONS AND HIGH RESOLUTION MOLECULAR SPECTROSCOPY OF WEAKLY BOUND COMPLEXES. Final Progress Report
 . INTERMOLECULAR POTENTIAL FUNCTIONS AND HIGH RESOLUTION MOLECULAR SPECTROSCOPY OF WEAKLY BOUND COMPLEXES Final Progress Report John S. Muenter Department of Chemistry University of Rochester Rochester,
EXCITATION AND PROPAGATION OF SHORT-PERIOD SURFACE WAVES IN YOUNG SEAFLOOR. Donald W. Forsyth. Department of Geological Sciences, Brown University
 EXCITATION AND PROPAGATION OF SHORT-PERIOD SURFACE WAVES IN YOUNG SEAFLOOR ABSTRACT Donald W. Forsyth Department of Geological Sciences, Brown University Sponsored by The Defense Threat Reduction Agency
IRIS Seismographs in Schools Program
 IRIS Seismographs in Schools Program www.iris.edu IRIS (the Incorporated Research Institutions for Seismology, an NSFfunded research and education consortium in seismology) announces a program for K-12
Response to Comment on "The National Ignition Facility Laser Performance Status"
 UCRL-JRNL-237304 Response to Comment on "The National Ignition Facility Laser Performance Status" C. A. Haynam, R. A. Sacks, E. I. Moses, K. Manes, S. Haan, M. L. Spaeth December 17, 2007 Applied Optics
Slope Stability Evaluation Ground Anchor Construction Area White Point Landslide San Pedro District Los Angeles, California.
 Slope Stability Evaluation Ground Anchor Construction Area White Point Landslide San Pedro District Los Angeles, California Submitted To: Mr. Gene Edwards City of Los Angeles Department of Public Works
Extending the magnitude range of seismic reservoir monitoring by Utilizing Hybrid Surface Downhole Seismic Networks
 Extending the magnitude range of seismic reservoir monitoring by Utilizing Hybrid Surface Downhole Seismic Networks Gisela Viegas*, ESG, Kingston, Ontario, Canada Gisela.Fernandes@esgsolutions.com and
Susitna-Watana Hydroelectric Project (FERC No ) Site-Specific Seismic Hazard Study Study Plan Section 16.6
 Site-Specific Seismic Hazard Study Study Plan Section 16.6") (FERC No. 14241) Site-Specific Seismic Hazard Study Study Plan Section 16.6 Initial Study Report Part A: Sections 1-6, 8-9 Prepared for Prepared by MWH / Fugro June 2014 TABLE OF CONTENTS 1. Introduction...
(FERC No. 14241) Site-Specific Seismic Hazard Study Study Plan Section 16.6 Initial Study Report Part A: Sections 1-6, 8-9 Prepared for Prepared by MWH / Fugro June 2014 TABLE OF CONTENTS 1. Introduction...
BWXT Y-12 Y-12. A BWXT/Bechtel Enterprise SMALL, PORTABLE, LIGHTWEIGHT DT NEUTRON GENERATOR FOR USE WITH NMIS
 BWXT Y-12 A BWXT/Bechtel Enterprise Report No.: Y/LB-16,078 (Paper) SMALL, PORTABLE, LIGHTWEIGHT DT NEUTRON GENERATOR FOR USE WITH NMIS J. Reichardt J. T. Mihalczo R. B. Oberer L. G. Chiang J. K. Mattingly
Final report on Task 12: Southern Great Basin seismic network operations
 Publications (YM) Yucca Mountain 10-7-2003 Final report on Task 12: Southern Great Basin seismic network operations James N. Brune University of Nevada, Reno, brune@seismo.unr.edu David von Seggern University
Forensic analysis of a rock burst event at the Kiirunavaara Mine results and implications for the future
 Forensic analysis of a rock burst event at the Kiirunavaara Mine results and implications for the future Jonny Sjöberg Christina Dahnér Lars Malmgren Fredrik Perman VATTENFALL POWER CONSULTANT Kiirunavaara
Interpretive Map Series 24
 Oregon Department of Geology and Mineral Industries Interpretive Map Series 24 Geologic Hazards, and Hazard Maps, and Future Damage Estimates for Six Counties in the Mid/Southern Willamette Valley Including
Estimation of Regional Seismic Hazard in the Korean Peninsula Using Historical Earthquake Data between A.D. 2 and 1995
 Bulletin of the Seismological Society of America, Vol. 94, No. 1, pp. 269 284, February 2004 Estimation of Regional Seismic Hazard in the Korean Peninsula Using Historical Earthquake Data between A.D.
SEISMIC-HAZARD ASSESSMENT: Conditional Probability
 Conditional Probability SEISMIC-HAZARD ASSESSMENT: Conditional Probability Supplies Needed calculator PURPOSE Previous exercises in this book have outlined methods for inferring the patterns and history
Seismological Study of Earthquake Swarms in South-Eastern Puerto Rico
 Seismological Study of Earthquake Swarms in South-Eastern Puerto Rico Principal Investigator: Lillian Soto-Cordero [1] Co-Investigators: Victor Huérfano 1, Leonardo Cano [2], Robert Watts [3], and Christa
Earthquakes. Chapter Test A. Multiple Choice. Write the letter of the correct answer on the line at the left.
 Earthquakes Chapter Test A Multiple Choice Write the letter of the correct answer on the line at the left. 1. Stress that pushes a mass of rock in two opposite directions is called a. shearing. b. tension.
Digital Research Space of Induced Seismicity for EPOS Purposes (IS-EPOS project)
") Digital Research Space of Induced Seismicity for EPOS Purposes (IS-EPOS project) The project IS-EPOS (https://tcs.ah-epos.eu/) was financed from Polish structural funds (POIG.02.03.00-14-090/13-00) in
Digital Research Space of Induced Seismicity for EPOS Purposes (IS-EPOS project) The project IS-EPOS (https://tcs.ah-epos.eu/) was financed from Polish structural funds (POIG.02.03.00-14-090/13-00) in
SpectruM ctbto Magazine issue 20 July 2013
 www.ctbto.org 20 CTBTO SpectruM ctbto Magazine issue 20 July 2013 Hoshyar Zebari IRAQ s FOREIGN MINISTER Thomas R. Pickering Former U.S. Under Secretary of State for Political Affairs Tibor Tóth CTBTO