Statistical Pattern Integration for Mineral Exploration*
|
|
|
- Asher Gibbs
- 5 years ago
- Views:
Transcription
1 From Gaal, Gabor and Merriam, Daniel F., (eds.), 1990, Computer Applications in Resource Estimation Prediction and Assessment for Metals and Petroleum, Pergamon Press, Oxford. Statistical Pattern Integration for Mineral Exploration* F.P. Agterberg, G.F. Bonham-Carter, and D.F. Wright Geological Survey of Canada, Ottawa Geological Survey of Canada Contribution No ABSTRACT The method of statistical pattern integration used in this paper consists of reducing each set of mineral deposit indicator features on a map to a pattern of relatively few discrete states. In its simplest form the pattern for a feature is binary representing its presence or absence within a small unit cell; for example, with area of 1 km 2 on a 1:250,000 map. The feature of interest need not occur within the unit cell; its "presence" may indicate that the unit cell occurs within a given distance from a linear or curvilinear feature on a geoscience map. By using Bayes rule, two probabilities can be computed that the unit cell contains a deposit. The log odds of the unit cell's posterior probability is obtained by adding weights W + or W - for presence or absence of the feature to the log odds of the prior probability. If a binary pattern is positively correlated with deposits, W+ is positive and the contrast C=W + -W - provides a measure of the strength of this correlation. Weights for patterns with more than two states also can be computed and special consideration can be given to unknown data. Addition of weights from several patterns results in an integrated pattern of posterior probabilities. This final map subdivides the study region into areas of unit cells with different probabilities of containing a mineral deposit. In this paper, statistical pattern integration is applied to occurrence of gold mineralization in Meguma Terrane, eastern mainland Nova Scotia, Canada. INTRODUCTION Geoscience maps of different types are to be integrated for target selection in mineral exploration. The geologist stacks these maps and looks for combinations of indicators favorable for occurrence of deposits of different types. The calculations required for mathematical analysis of digitized patterns for points, lines, and areas have been greatly aided by the development of microcomputer based geographic information systems for the treatment of map data (B onham-carter, Agterberg, and Wright, 1988). This has led us to develop further a new method for statistical pattern inte- gration simulating the practice of exploration geologists to combine maps for deline- ating favorable areas. This method was proposed initially by Agterberg (in press) for combining geophysical survey data with prior probabilities of occurrence of massive sulfide deposits in the Abitibi area of the Canadian Shield originally obtained in The prior probability for a massive sulfide deposit being in a small unit cell was assumed to be constant within a larger cell. The frequency of massive sulfide deposits had been estimated by regression analysis from lithological and other variables systematically coded for such larger cells. Other geoscience data for the same area (Bouguer anomalies, aeromagnetic anomalies, and boundaries between tertiary drainage basins) had been quantified later as patterns of two or more mutually exclusive states by Assad and Favini (1980). The patterns for proximity to aeromagnetic anomalies and bouinlaries between drainage basins were binary, needing only two colors (black and white) for representation. It was possible to compute weights W i + and W i - representing the states of presence and absence in the unit cell for each binary pattern i. In Assad and Favini (1980), the pattern for the Bouguer anomaly had five distinct states with different colors. In Agterberg (in press), a weight W j + was computed for each color j of this pattern with more than two states. At any point within the study area, the weights for the geophysical variables were added to the
2 log odds of the prior probability. This gave the log odds of the posterior probability. Because the patterns combined with one another all consisted of polygons, the final product was also polygonal with different colors for classes defined for the posterior probability per unit cell. The addition of weights W + or W - is perm itted only if the patte rns being integrated are conditionally independent of occurrence of deposits. In the Abitibi study it was shown that this condition is satisfied approximately for the geophysical variables. In this paper, the method will be applied to gold deposits in Meguma Terrane, Nova Scotia. An advantage of the statistical pattern integration method with respect to most existing methods in the field of regional resource evaluation (e.g., logistic regression) is that a pattern need be available only for parts of the study region. However, if one or more patterns are missing at a given place, the estimated posterior probability has less certainty than those based on more or all patterns. This type of uncertainty, the result of one or more missing patterns, will be studied later in the paper. Finally, special attention should be given to verification of the theoretical assumption of conditional independence. The simple addition of weights for different features is permitted only if this assumption is satisfied. In general, the possibility of occur rence of conditional dependence increases with an increasing number of patterns. Failure of the method in this respect would lead to discrepancies between frequencies as predicted by the posterior probability map and the corresponding observed frequencies. If the assumption of conditional independence is not satisfied, the theoretical frequencies would exceed the observed frequencies in the most favorable parts of the region. At the end of the paper, we provide a statistical test for comparing the theoretical and observed frequencies with one another. First, the method of statistical pattern integration will be explained by using a simple artificial example. Figure 1. Artificial example to illustrate concept of combining two binary pat- terns related to occurrence of mineral deposits; (A) outcrop pattern of rock type, lineaments, and mineral deposits; (B) rock type and deposits dilatated to unit cells; (C) lineaments dilatated to corridors; (D) superposition of three patterns. Figure 1 illustrates the concept of combining two binary patterns for which it may be assumed that they are related to occurrence of mineral deposits of a given type. Figure 1A shows locations of six deposits, the outcrop pattern of a rock type (B) with which several of the deposits may be associated (see Fig. 1B), and two lineaments which have been dilated in Figure 1 C to provide corridors (C). Within the corridors the likelihood of locating deposits may be greater than elsewhere in the study region. Points situated both on the rock type and within the lineament corridors may have the largest probability of containing deposits (see Fig. 1D). In Figures 1B to 1D, the deposits are surrounded by a small unit area. This allows us to estimate the unconditional probability p(d) that a unit area contains one deposit if it is located randomly
3 within the study area, and the conditional probabilities p(d b), p(d c), and p(d be) for occurrences on rock type, corridors and overlap of rock type and corridors, respectively. These probabilities are estimated by counting how many deposits occur within the areas occupied by the polygons of their patterns. The relationships between the two patterns B and C, and the deposits, D, can be represented by Venn diagrams as shown schematically in Figure 2. Figure 2. Venn diagrams corresponding to areas of binary patterns in Figure 1; (A) is for Figure 1 B; (B) is for Figure 1 C; (C) is for Figure 1 D. METHOD OF STATISTICAL PATTERN INTEGRATION For the rock type (B) and the corridors (C), the relative areas assigned to the sets and their overlap (BC) in the Venn diagrams are equal to the corresponding relative areas in the study region. The set for deposits (D) is show n as a broken line in Figure 2 to indicate that its relative area depends on size of the unit cell. In Figure 2C, D is divided into four subsets which can be written as BCD, BCD, BCD, and BCD where each bar indicates complement or "absence" of B or C. The relative areas of the subsets is equal to the relative proportions of total number of deposits belonging to the subsets. Suppose that relative area is written as Mes (for measure). Then B and C are conditionally independent of D if This is equivalent to assuming either The latter two expressions can be readily visualized by comparing Figure 2A to Figure 2C and Figure 2B to Figure 2C, respectively. Obviously, B and C are not necessarily conditionally independent of D. However, this assumption is considerably weaker than assuming that two patterns are statistically independent. For example, if B w ere independent of C, we would have exactly: In our type of application, Mes(BC) is greater than Mes(B) x Mes(C ) because both B and C are positively correlated with D.
4 The relationship betw een B, C, and D can be expressed by the following (2x2x2) table of probabilities: Here B, C, and D are regarded as random variables which are either present or absent in a unit cell. Absence is indicated by a bar. The eight probabilities in this table add up to one. If the assumption of conditional independence of B and C holds true, the eight probabilities in the table also are mutually related by: This result follows from combining the first part of Equation (2) with the identities: Equation (4) implies that all eight probabilities in the table can be determined from only five individual probabilities or functions of probabilities. In our approach we will use for these five constants, the prior probability p(d) and the weights W b +, W b -, W c + and W c - defined as: Weights of evidence W + and W - were previously used by Spiegelhalter (1986). Two binary patterns, B and C, give four posterior probabilities for D=d. These are It is convenient to work with odds (O) instead of probabilities with O=p/(l-p) and p=o/(1+o). Then:
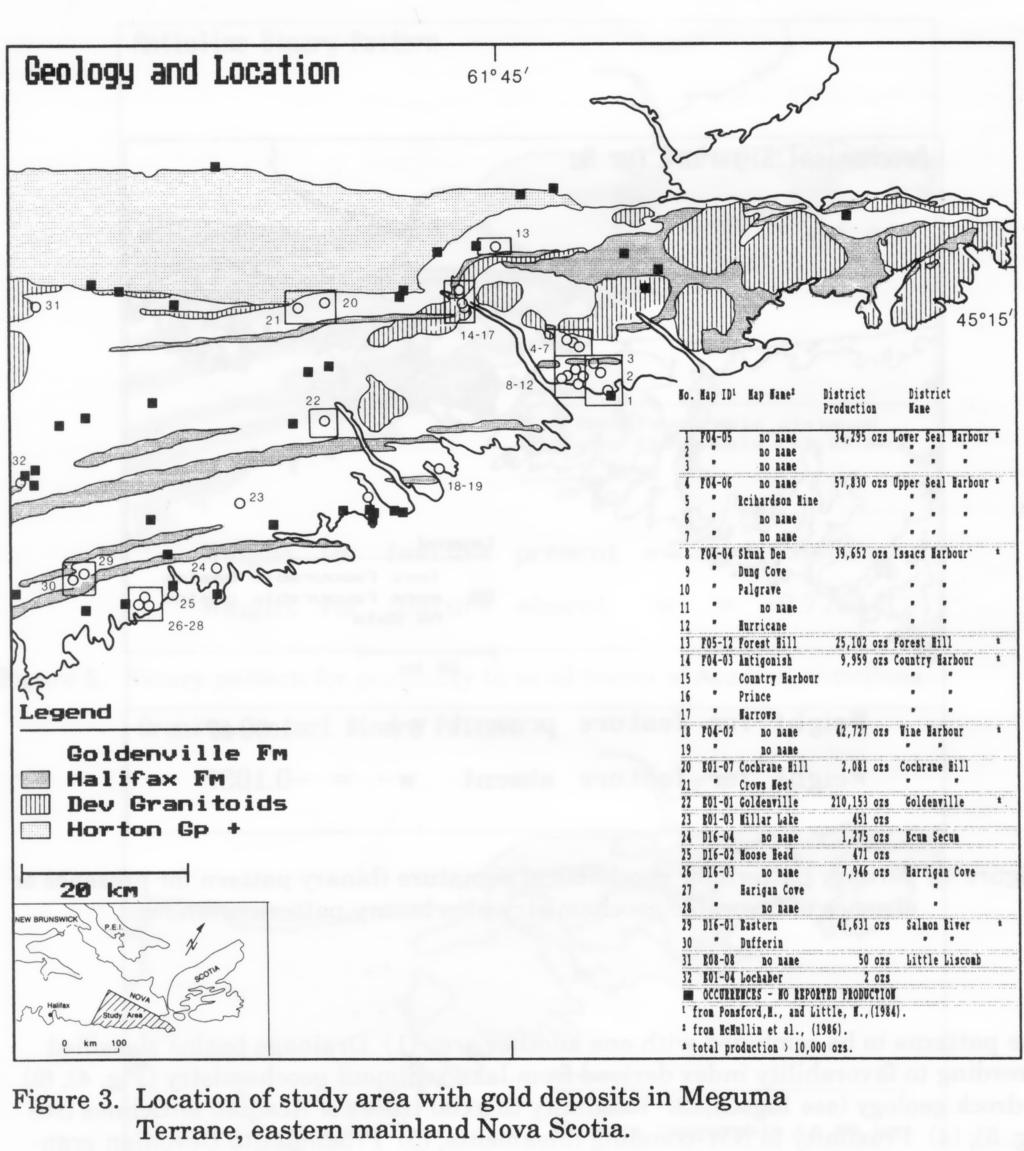
5 This is the extension of Bayes' rule which holds true only if B and C are conditionally independent with with di=d (for i=l) or d i =d (for i=o). Previous applications of the assumption of conditional independence in mineral exploration include those by Duda and others (1977) and Singer and Kouda (1988). Even if this assumption is not satisfied, we always have: and equivalent expressions for O(d b), O(d c), and O(d c). The latter are formulations of Bayes' rule which has had many previous geological applications (cf. Harbaugh, Doveton, and Davis, 1977). Extensions of Equation (7) to more than two patterns are readily made. For example, if A is conditionally independent of B and C, then: with seven equivalent expressions. Part of the usefulness of this approach for mineral exploration results from the fact that it can be assumed that weights such as W b + are independent of the prior probability p(d). For example, if there would be as many undiscovered deposits in the region as there are known deposits, then the prior probability p(d) becomes twice as large. However, weights such as W b + =loge p(b d)/p(b d) remain the same even if p(d) is changed provided that the proportion of new deposits associated with B=b would not change during exploration in future. APPLICATION TO GOLD DEPOSITS IN MEGUMA TERRANE Wright, Bonham-Carter, and Rogers, (1988) have used regression analysis to determine the multielement lake-sediment geochemical signature that best predicts the catchment basins containing gold occurrences in Meguma Terrane, eastern mainland Nova Scotia (see Fig. 3). Their geochemical signature was reduced to a ternary pattern (Fig. 4) for this study. Bonham-Carter and others (1988) have coregistered and analyzed a variety of regional geoscience data sets for this same study area using a geographic information system. A number of these data sets also are used in this paper. Bonham-Carter and others (1988) have pointed out that the mechanism of gold mineralization in the study area is not well understood. Various authors have proposed different genetic models, emphasizing stratigraphic control, structural control, or importance of the intrusive granites as a source of mineral-rich hydrothermal fluids. Different processes have played a role in the formation of some or all of the gold deposits. By the method given in this paper, the spatial relationships to gold mineralization of patterns based on different genetic models can be compared and integrated with one another.
6
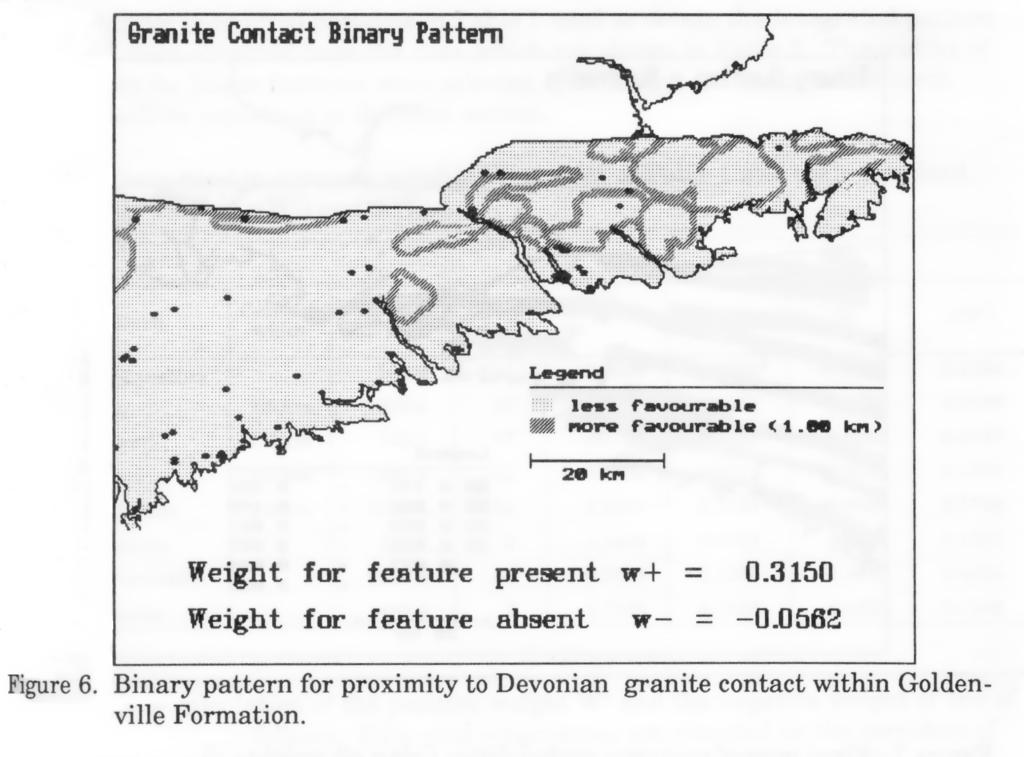
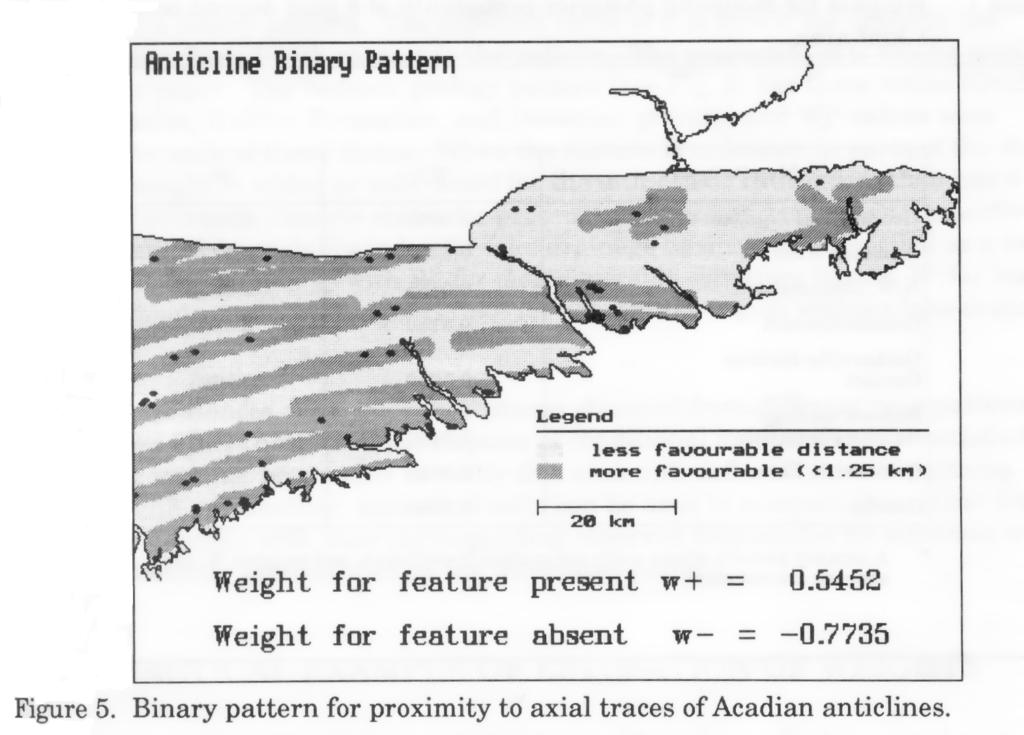
; (3) Proximity to axial traces of Acadian anticlines (see Fig. 5); (4) Proximity to NW -trending lineaments; (5) Proximity to Devonian granites (see Fig.")
7 The patterns to be combined with one another are: (1) Drainage basins classified according to favorability index derived from lake sediment geochemistry (Fig. 4); (2) Bedrock geology (see Fig. 3); (3) Proximity to axial traces of Acadian anticlines (see Fig. 5); (4) Proximity to NW -trending lineaments; (5) Proximity to Devonian granites (see Fig. 6); and (6) Proximity (within the Goldenville Formation) to the contact between Goldenville and Halifax Formations. The weights estimated for these six patterns are shown in Table 1. The final map (Fig. 7) obtained by adding the computed weights to the log prior odds delineates subareas where most or all favorable conditions exist and can be used in gold exploration. Four of the six patterns integrated with one another are for proximity to linear or curvilinear features. Binary patterns (e.g., Figs. 5 and 6) were selected in each of these situations after studying how size of neighborhood influences the contrast C=W + - W - which provides a measure of the strength of correlation between a point
8
9 Table l. Weights for modeling posterior probability of a gold deposit occuring in a 1 km 2 area. Map Pattern W + W - Geochemical Signature Anticline Axes N.W. Lineaments Granite Contact Goldenville-Halifax Contact Bedrock Geology* Halifax Formation Goldenville Formation Granite * A ternary pattern where units are mutually exclusive, and weights W - for absence are not used.
10 pattern and a binary pattern. The expected value of C is zero if the deposits are randomly distributed with respect to the pattern. The properties of C will be studied later in this paper. The bedrock geology pattern (see Fig. 3) has three states (Goldenville Formation, Halifax Formation, and Devonian granite) and W j + values were computed for each of these states. When the feature is unknown in parts of the study region, no weight is added or subtracted for the unit cells. The feature then has a ternary pattern w ith discrete states for presence, absence and unknown, respectively. The geochemical favorability index for lake drainage basins was quantified as a ter- nary pattern (see Figure 4) with W + for most favorable signature basins, W - for less favorable basins, and zero weight (W o =0) for parts of the region w ithout lake drainage basins. Weights for presences or absences of features obtained from different map patterns can be added if the theoretical assumption of conditional independence is satisfied. Although it may not be possible to verify this assumption for all pairs of patterns combined with one another, statistical tests can be used to compare theoretical frequencies of deposits with their corresponding observed frequencies for subareas with the same posterior probabilities on the integrated pattern. PRACTICAL EXAMPLE OF ESTIMATION OF WEIGHTS The weights for individual patterns in Table 1 used to obtain the integrated pattern of Figure 7 were obtained from the data which are shown in Table 2. The widths of the corridors for linear features were selected by studying contrasts for different widths as will be explained in the next section. Table 2 Data used to compute weights W + and W - of Table 1 and their standard deviations s(w + ) and s(w - ) Map Pattern Corridor width Area (in km 2 ) Gold occ. W+ s(w+) W- s(w-) Geochemical Signature Anitcline Axes 2.5 km N.W. Lineaments 1.0 km Granite Contact 1.0 km Goldenville/ Halifax 2.0 km Halifax Formation Goldenville Formation Devonian Granite An example of calculation of the positive weights W + and the negative weights of one of the features W - is as follows: Fifty gold occurrences are situated on the corridors of the anticline axes. The combined area of these corridors is km 2. The total study area contains n(d)=68 gold occurrences and measures km 2. The total number of unit cells can be set equal to n=2945. It follows that n(i)= n-n(d)=2877. Our calculations may he based on frequencies (= p n) instead of on probabilities p. Then:
11 From n(bd) = 50 and = 18, it follows that = 1226 and = Consequently, The weights reported in Table 2 differ slightly from these numbers, because they were based on slightly more precise estimates of areas. Table 2 also shows estimates of standard deviations of W + and W -. These were obtained from the variances: These formulae are consistent with the asymptotic expression for the contrast to the discussed in the next section. Spiegelhalter and Knill-Jones (1984) have used similar formula to obtain standard errors of the weights. The only difference between their formulae and ours is that Spiegelhalter and Knill-Jones (1984) applied a correction based on the theory of binary data analysis to help remove bias from their estimated weights as well as from the corresponding variances. Eight of the sixteen weights in Table 2 are more than twice as large, in absolute value, as their standard deviation. These eight weights probably are different from zero, because the 95 percent confidence interval for hypothetical zero weight is ap- proximately equal to ± 2s. We have used asymptotic maximum likelihood expressions (cf. Bishop, Fienberg, and Holland, 1975, chapter 14) for s. Such expressions are valid only if a number of conditions are satisfied including the condition that the probabilities in the (2x2) table are neither large (= close to one) nor small (= close to zero). The latter condition may have been violated during estimation of the relatively large standard deviations of negative weights for rock types in the lower part of Table 2, because these are based on relatively few deposits. For example, only two gold occurrences on Devonian granite contribute 0.5 to the variance of their weight (= ), and therefore, account for most of the value of s(w+) = (bottom line of Table 2) which is probably too large. The standard deviation of a posterior probability can he estimated as follows. The variance s 2 (p) of the prior probability p satisfies approximately p/n. For p = 68/2945 = , this yields the standard deviation s(p) = The corresponding standard deviation of log e (p/(l-p)) = is approximately equal to s/p = This follows from the approximate identity for any variable x with mean x:
12 Suppose that a unit cell has the following features: Its geochemical signature is unknown; it occurs in the Goldenville Formation not near a granite contact, and in the proximities of an anticline axis, NW lineament, and Goldenville/Halifax contact. Then the log posterior odds is as can be seen when the appropriate weights are added. The variance of the log posterior odds is derived by adding variances of weights to the variance of the log prior odds. It follows that the standard deviation of the log posterior odds amounts to The posterior probability of the unit cell containing a deposit becomes with approximate standard deviation equal to = In this way, a standard deviation can be estimated for each of the posterior probabilities on a final integrated pattern. However, it will be shown later that if one or more patterns are missing, the standard deviation of the posterior probability should be increased due to the lack of knowledge. Because no information on geochemical signature is available for the unit cell in preceding example, the final standard deviation becomes instead of (see later). Although this final value (=0.042) is greater than the standard deviation (=0.028) computed from the uncertainties associated with the prior probability and the weights of Table 2, it is less than the standard deviation (=0.087) of the posterior probability (=0.169) arising w hen the unit cell considered for example in this section would have favorable geochemical signature. CORRELATION BETWEEN PATTERN AND DEPOSITS The contrast C b =W b + -W b - for a pattern B provides a convenient measure of the strength of correlation between B and the pattern of deposits. The (2x2) table of probabilities with marginal totals for B and D is: If the deposits are randomly distributed within a study region, without preference for b or b, this table becomes By using the previous definitions of W b + and W b -, it then is readily shown that W b + = W j and C=W b + - W b - =0. Table 3 for proximity of gold occurrences to anticline axes in Meguma Terrane, Nova Scotia, shows the contrast C(x) as a function of distance x by which these linear features were dilated (in both directions) to define the binary pattern previously shown as Figure 5. Thus x is equal to one- half the width of the corridors. Inspection of C(x ) as a function of x provides a useful tool for d eciding on a good valu e of x. It should be kept in mind, that C(x) will be less precise for smaller values of x. This is because the number of deposits n(bd) from which p(bd) is estimated then may be small and subject to considerable uncertainty. If, as before, total number of unit cells is written as n, we have p(bd)=n(bd)ln with equivalent expressions for the other elements of the (2x2) table. Table 3. Weights and contrast for anticline binary patterns as function of one-half- width of corridor. Total area sampled = 2945 km 2 ; total number of gold occurrences = 68; * denotes maximum contrast.
13 CORRIDOR HALF- WIDTH (in km) CORRIDOR AREA (in km 2 ) GODL OCC. ON CONTRAST CORRIDOR W + W - C = W + - W - STANDARD DEV. OF C * Writing " = e c, the following asymptotic result for large n (see Bishop, Fienberg, and Holland, 1975, p. 377) can be used: If is small compared to ", it follows from Equation (13) that the standard deviation of C is approximately equal to In the last column of Table 3, it is shown how this asymptotic standard deviation initially decreases as a function of distance. Once the one-half-width exceeds 0.75 km, the standard deviation continually increases. An approximate 95 percent confidence interval for C is provided by ±2ô 4(C). From this it may be concluded that the values of C shown in Table 3 are significantly greater than zero. Table 4 provides another example of C(x) as a function of x. Both positive and negative values of C occur in Table 4 which is for proximity to Devonian granites. The standard deviation of C now continues to decrease for wider corridors and it is likely that none of the values of C are significantly different from zero. The maximum value of C corresponds to a proximity of 1 km and this binary pattern was selected for use (cf., Tables 1 Table 4. Weights and contrast for granite contact corridors as function of corridor width. Total area samples = 2945 km 2 ; total number of gold occurrences = 68; * denotes maximum contrast.
14 CORRIDOR WIDTH (in km) CORRIDOR AREA (in km) GOLD OCC. ON CONTRAST CORRIDOR W + W - C = W + - W - STANDARD DEV. OF C * and 2). The corresponding weights for proximity to Devonian granite (cf. Fig. 6) are relatively small and had relatively little effect on the final map (Fig. 7). In mathematical statistics, various functions of " have been proposed to express correlation between two binary variables. Yule's "measure of association" Q=("-1)/ ("+1) (see Bishop, Fienberg, and Holland, 1976, p. 3 78) is comparable to the ordinary product-moment correlation coefficient for two continuous variables in that it is confined to the interval [-1, 1] with E(Q)=0 for uncorrelated binary patterns. It is readily shown that which is always positive. Consequently, (x) as a function of x would reach its maximum at the same value of x as C(x) (cf. Table 3). It may be concluded that the contrast C=W+ -W- provides a convenient measure of strength of correlation between the patterns B and D. UNCERTAINTY BECAUSE OF ONE OR MORE MISSING PATTERNS In the Introduction, it was pointed out that posterior probabilities do not all have the same precision if some of them are based on fewer patterns than others. This situation arises when data for a pattern are missing in parts of the study region. For example, the geochemical signature based on lake drainage basins is only available for parts of our study area (Meguma Terrane, Nova Scotia). Spiegelhalter (1986, p. 37) has proposed to regard any prior probability p(d) as the expectation of the possible final probabilities p(d x) that may be obtained on observing data x
15 In general, For the relationship between B, C, and D: The corresponding variance is: If only B is unknown, the information on C can be added to the prior probability in order to obtain updated prior probabilities Pb(d) with variance: follows from: The expressions for the variances F1 2 (one pattern missing) and F2 2 (two patterns,missing) are independent of any other patterns for which data were available and ised to change the prior probability. Extensions to situations with three or more missing patterns are readily made. In our example, only one pattern is incomplete: geochemical signature for gold deposits in Meguma Terrane. The ternary pattern representing geochemical signature (Fig. 4) shows those parts of the area where this feature could not be determined. In these places, the probability p b (d) on the final map (Fig. 7) has partial uncertainty that can be expressed by the standard deviation 1[P b (d)]. This uncertainty is partial because it becomes zero in places where all patterns including the geochemical signature are available, although the posterior probabilities in these places have their own uncertainties which can be estimated by using the standard deviations of the weights (see before). The latter type of uncertainty of the posterior probability increases when the pattern for geochemical signature is added. Of course, the uncertainty because of a missing pattern decreases when information on the pattern is added. The weights W + = and W - = for the geochemical signature (cf., Table 1) were determined from likelihood ratios for the entire area. For example, W + =log e p(b d)/p(b d)= was based on (1) p(b 1 d)=p(bd)/p(d)=n(bd)/n(d) with n(bd)=10 and n(d)=68; and (2) P(b d)=p(bd)/p(d)=n(bd)/n(d) with n(bd)= =154.9 and n(d)= = As discussed before, the weight W + can be regarded as independent of the prior probability. For this example, approximately the same value of W + is obtained when (1) the calculation is based on the subarea (= km') with known geochemistry; and (2) the prior probability within the area with known geochemistry is equal to that for the total study area (= km 2 ). The second condition implies that there would be about 41 deposits within the area with known data.
16 In reality, this subarea contains only 24 gold occurrences. A revised weight based on the subarea only would amount to which is greater than W + =1.0047, because the subarea contains a larger proportion (=10124) of the deposits. The lesser weight (W + =1.0047) was used in Figure 7 and now will be employed for estimating F [p b (d)]. For example, the modified prior probability p(d), which is based on all patterns except geochemical signature, will be set equal to 0.05 and 0.10 within the area without definable lake drainage basins. The log odds of these values are and , respectively. Addition of W + and W - provides the required estimates of p(d b)and p(d b). For p(d)=0.05, these conditional probabilities are equal to and , respectively. For p(b) which also is needed to determine F1 the ratio of favorable area (=164.9 km 2 ) to known area (= km 2 ) can be used. This gives p(b)= and p(b)=1-p(b)= Consequently, F1 (0.05)= By the same method, it follows that F1 (0.10)= Previously, it was pointed out that if a unit cell in the Goldenville Formation with unknown geochemical signature is in the proximity of all linear features except granite contact, then its posterior probability is with standard deviation equal to Addition of the uncertainty because of the missing pattern results in the larger standard deviation of For both revised prior probabilities p(d)(=0.05 and 0.10), the standard deviation expressing uncertainty is the result of missing information is about one-half of p(d), or F1[p(d)].0.5 p(d). This indicates that outside the lake drainage basins where geochemical information is not available, the posterior probabilities on the final map (Fig. 5) are less precise than would follow from the uncertainties associated with the prior probability and the weights (Table 2). It is convenient to express uncertainty due to ignorance by a single statistical parameter (standard deviation a, in this section). It should be kept in mind, how ever, that this parameter is estimated from a discrete probability distribution approximating an unknown continuous frequency distribution. TEST FOR GOODNESS-OF-FIT As pointed out in the Introduction, the final posterior probability map (Fig. 7) provides expected frequencies that can be compared to observed frequencies for the known occurrences. Suppose that p, represents the posterior probability after classification. For example, p, may be set equal to the midpoints of the classes of probabilities used for constructing the map on w hich Figure 7 is based. Suppose that, in total, there are n deposits (n=68 in Fig. 7). For each pi, the expected frequency amounts to where A i is the joint area of all polygons with posterior probability p i. The corresponding observed frequency foi is obtained by counting how many deposits actually occur in the polygons with posterior probability p i. Table 5 shows that expected and observed frequencies are nearly equal to one another for the pattern of Figure 7. It is possible to apply the chi-square test with The number of degrees of freedom for the corresponding theoretical P 2 (<) is not known. Setting < equal to number of classes -1 would give P (5)=11.1 for level of significance "=0.05. The estimated value P 2 2 (=9.8) is less than 11.1 suggesting a good fit of the model. In this type of application, the theoretical frequencies were determined by assuming conditional
17 independence of all patterns. The test for goodness-of-fit used in this section would suggest that this hypothesis is approximately satisfied. Care has to be taken, however, in interpreting these results, because an upper bound for the number of degrees of freedom (<) was used. Comparison of observed and expected frequencies in Table 5 suggests that observed values tend to exceed expected values in the upper part of the table where p i is relatively large and that the reverse holds that in the lower part of Table 5. This might indicate a minor violation of the assumption Table 5. Comparison of observed and theoretical frequencies for final integrated pattern of Figure 7. Class No. Classes of posterior probabilities Observed frequency (O) Expected frequency (E) (O-E) 2 E Sum = of conditional independence. If two or more patterns are conditionally dependent with positive "partial association" (cf. Bishop, Fienberg, and Holland, 1975, p. 32), the expected frequencies would exceed the observed frequencies when p, is relatively large, whereas they would be smaller when p i is small. CONCLUDING REMARKS The application of statistical pattern integration to gold exploration in Nova Scotia was performed using SPANS-A quadtree-based GIS. SPANS runs on IBM PC compatible under DOS. The work described here was carried out on an machine with 70 mb hard drive. SPANS accepts a variety of inputs of vector and raster data and permits the user to move readily in and out of DOS, so that other DO S compatible software can be executed on mutually shared data files. This paper is concerned primarily with three problems: (1) Construction of optimum binary patterns for linear features in order to represent the relationship between these features and occurrence of mineral deposits; (2) Statistical integration of patterns for linear features and polygon patterns for areal features representing geochemistry and rock types; and (3) Development of a measure of uncertainty which is the result of missing information. In order to resolve the first problem (1), a sequence of increasingly wide corridors around the linear features was constructed using SPANS. The choice of optimum width was made on the basis of the contrast C which measures correlation betw een a binary pattern and a point pattern. An asymptotic formula was used to estimate. the standard deviation of C. Statistical pattern integration (2) was carried out by the addition of weights W + or W - representing presence or absence of features. The addition of weights is based on the assumption of conditional independence of the map patterns with respect to the mineral
18 deposits. This assumption was tested by comparing the posterior probabilities shown on the final integrated map pattern with observed frequencies of gold deposits. Uncertainty resulting from one or more missing patterns (3) was evaluated by considering that no weights for presence of absence of a feature can be added if it is unknown. A measure of uncertainty was based on differences between posterior probabilities computed without the feature, and posterior probabilities computed using the possible outcomes for the feature if its presence or absence would be known. Contrary to the propagation of uncertainty associated with the weights which increases w hen more patterns are added, the uncertainty resulting from missing information decreases when patterns are added. ACKNOWLEDGMENTS This work was supported by the Geological Survey of Canada under the Canada- Nova Scotia Mineral Development Agreement, a subsidiary to the Economic Regional Development Agreement. We acknowledge the contributions of several Nova Scotia Mines and Energy geologists, particularly Peter Rogers. Thanks to Alee Desbarats of the Geological Survey of Canada for critical reading of the manuscript. REFERENCES Agterberg, F.P., in press, Systematic approach to dealing with uncertainty of geoscience information in mineral exploration: Proc. 21st APCOM Symposium (Application of Computers in the Mineral Industry) held in Las Vegas, March 1989; Soc. Mining Engineers, New York. Assad, R., and Favini, G., 1980, Prévisions de minerai cupro-zincifère dans le nord-ouest Québecois: Ministère de l'energie et des Ressources, Quebec, DPV-670, 59 P. Bishop, M.M., Fienberg, S.E., and Holland, P.W., 1975, Discrete multivariate analysis. theory and practice: MIT Press, Cambridge, Massachusetts, 587 p. Bonham-Carter, G.F., Agterberg, F.P., and W right, D.F., 1988, Integration of mineral exploration datasets using SPANS-A quadtree-based GIS: Application to gold exploration in Nova Scotia; GIS Issue of Photogrammetric Engineering & Remote Sensing, in press. Bonham-Carter, G.F., Rencz, A.N., George, H., Wright, D.F., Watson, F.G., Dunn, C.E., and Sangster, A.L., 1988, Demonstration of a microcomputer-based spatial data integration system with examples from Nova Scotia, New Brunswick and Saskatchewan: Geol. Survey of Canada, Current Activities Forum Abstract. Duda, R.0, Hart, P.E., Nilson, N.J., Reboh, R., Slocum, J., and Sutherland, G.L., 1977, Development of a computer-based consultant for mineral exploration: Stanford Research Inst. International, Annual Rept. SRI Projects 5821 and 6915, Menlo Park, California, 202 p. Harbaugh, J.W., Doveton, J.H., and Davis, J.C., 1977, Probability methods in oil exploration: Wiley Interscience Publ., New York, 269 p. McM ullin, J., Richardson, G., and Goodwin, T., 1986, Gold compilation of the Meguma Terrane in N ova Scotia; Nova Scotia Department of Mines and Energy, Open File , 056, maps. Ponsford, M., and Lyttle, N., 1984, Metallic mineral occurrences and map data compilation, central Nova Scotia-map sheets IID, IIE; Nova Scotia Department of Mines Open File Report 599,12 p. Singer, D.A., and Koada, R., 1 988, Integrating spatial and frequency information in the search for Kuroko deposits of the Hokuroku District, Japan: Econ. Geology, v. 83, no. 1, p
19 Spiegelhalter, D.J., 1986, Uncertainty in expert systems, in W.A. Gale, ed.: Artificial intelligence and statistics: Addison-Wesley, Reading, Massachusetts, p Spiegelhalter, D.J., and Knill-Jones, R.P., 1984, Statistical and knowledge-based approaches to clinical decision-support systems, with an application in gastroenterology: Jour. R oyal Statist. Soc. A, v. 147, pt. 1, p Wright, D.F., Bonham-Carter, G.F., and Rogers, P.J., 1988, Spatial data integration of lake-sediment geochemistry, geology and gold occurrences, Meguma Terrane, eastern Nova Scotia: Proc. Can. Inst. Mining Metall. Meeting on "Prospecting in Areas of Glaciated Terrain", held in Halifax, Nova Scotia, September 1988.
Spatial modelling of phosphorite deposits in the Irece Basin, Bahia, Brazil. W. Franca-Rocha 1,2, A. Misi 2
 Spatial modelling of phosphorite deposits in the Irece Basin, Bahia, Brazil W. Franca-Rocha 1,2, A. Misi 2 1 Universidade Estadual de Feira de Santana,Km 3, Br 116, Feira de Santana, 44431-460, Brazil,
Resource Management through Machine Learning
 Resource Management through Machine Learning Justin Granek Eldad Haber* Elliot Holtham University of British Columbia University of British Columbia NEXT Exploration Inc Vancouver, BC V6T 1Z4 Vancouver,
SINGULARITY ANALYSIS FOR IMAGE PROCESSING AND ANOMALY ENHANCEMENT. Qiuming CHENG
 SINGULARITY ANALYSIS FOR IMAGE PROCESSING AND ANOMALY ENHANCEMENT Qiuming CHENG Department of Earth and Atmospheric Science, Department of Geography, York University, Toronto, 4700 Keele Street, Ont. M3J
Artificial neural networks as a tool for mineral potential mapping with GIS
 INT. J. REMOTE SENSING, 2003, VOL. 24, NO. 5, 1151 1156 Artificial neural networks as a tool for mineral potential mapping with GIS J. P. RIGOL-SANCHEZ Department of Geology, University of Jaen, 23071,
Prospectivity Modelling of Granite-Related Nickel Deposits Throughout Eastern Australia
 Prospectivity Modelling of Granite-Related Nickel Deposits Throughout Eastern Australia M P Hill 1 and A McCarthy 2 ABSTRACT Spatial modelling has been used to determine potential locations of granite-related
The Use of a Multilayer Feedforward Neural Network for Mineral Prospectivity Mapping
 The Use of a Multilayer Feedforward Neural Network for Mineral Prospectivity Mapping Warick Brown', Tamds Gedeon', and Robert Barnes' ' Centre for Strategic Mineral Deposits, Department of Geology and
A predictive GIS methodology for mapping potential mining induced rock falls
 University of Wollongong Thesis Collections University of Wollongong Thesis Collection University of Wollongong Year 006 A predictive GIS methodology for mapping potential mining induced rock falls Hani
Hybrid Fuzzy Weights-of-Evidence Model
 Chapter 5 Hybrid Fuzzy Weights-of-Evidence Model This chapter is based on a paper titled A Hybrid Fuzzy Weights of Evidence Model for Mineral Potential Mapping (Porwal et al., 2006c). The model combines
The North American Soil Geochemical Landscapes Project: Report on the 2008 Sampling Program and Preliminary 2007 Results 1
 Report of Activities 2008 45 The North American Soil Geochemical Landscapes Project: Report on the 2008 Sampling Program and Preliminary 2007 Results 1 T. A. Goodwin, E. M. McIsaac and P. W. B. Friske
Improvements on 2D modelling with 3D spatial data: Tin prospectivity of Khartoum, Queensland, Australia
 Improvements on 2D modelling with 3D spatial data: Tin prospectivity of Khartoum, Queensland, Australia C. E. Payne, F. W. Cunningham, A. J. Wilkins & G. A. Partington Kenex Ltd. Outline Prospectivity
Keywords: (Fuzzy Logic Integration, Mineral Prospectivity, Urmia-Dokhtar, Kajan, GIS)
") Mineral Prospectivity Mapping by Fuzzy Logic Data Integration, Kajan Area in Central Iran Pezhman Rasekh 1 (p.rasekh@ut.ac.ir), Farshid Kiani 1, Hooshang H. Asadi 1, Seyed Hassan Tabatabaei 1 1 Isfahan
Mineral Prospectivity Mapping by Fuzzy Logic Data Integration, Kajan Area in Central Iran Pezhman Rasekh 1 (p.rasekh@ut.ac.ir), Farshid Kiani 1, Hooshang H. Asadi 1, Seyed Hassan Tabatabaei 1 1 Isfahan
Geo-scientific Data Integration to Evaluate Geothermal Potential Using GIS (A Case for Korosi-Chepchuk Geothermal Prospects, Kenya)
") Geo-scientific Data Integration to Evaluate Geothermal Potential Using GIS (A Case for Korosi-Chepchuk Geothermal Prospects, Kenya) Levi Shako and Joseph Mutua Geothermal Development Company, P. O. Box
Geo-scientific Data Integration to Evaluate Geothermal Potential Using GIS (A Case for Korosi-Chepchuk Geothermal Prospects, Kenya) Levi Shako and Joseph Mutua Geothermal Development Company, P. O. Box
INTRODUCTION TO PATTERN RECOGNITION
 INTRODUCTION TO PATTERN RECOGNITION INSTRUCTOR: WEI DING 1 Pattern Recognition Automatic discovery of regularities in data through the use of computer algorithms With the use of these regularities to take
Mineral Exploration Using GIS
 King Fahad University of Petroleum and Minerals City and Regional Planning Department CRP 514: Introduction to GIS Term 112 Mineral Exploration Using GIS Term paper presentation By Mutasim Osman ID # g201105050
Lin Chen Robert A Creaser Daniel J Kontak Oct 29th, 2014
 FURTHER Re-Os ARSENOPYRITE GEOCHRONOLOGY FROM SELECTED MEGUMA AU DEPOSITS, MEGUMA TERRANE, NOVA SCOTIA: POSSIBLE EVIDENCE FOR A PROTRACTED GOLD-FORMING SYSTEM Lin Chen Robert A Creaser Daniel J Kontak
EXPLORATION TARGETING USING GIS: MORE THAN A DIGITAL LIGHT TABLE
 EXPLORATION TARGETING USING GIS: MORE THAN A DIGITAL LIGHT TABLE G A PARTINGTON 1 INTRODUCTION The use of computers in mineral exploration in the last twenty years has dramatically changed the way we carry
GIS modelling for Au-Pb-Zn potential mapping in Torud-Chah Shirin area- Iran
 IJMEI International Journal of Mining & Environmental Issues, Vol. 1, No.1, 2010. GIS modelling for Au-Pb-Zn potential mapping in Torud-Chah Shirin area- Iran M. Ziaii 1*, A. Abedi 1, M. Ziaei 1, A. Kamkar
In classical set theory, founded
 Fuzzy logic: Identifying areas for mineral development by Mandy Vickers and Gavin Fleming, Mintek This article looks at the application of fuzzy logic set theory in GIS to identify potential areas for
Application of Weights of Evidence Method for Assessment of Flowing Wells in the Greater Toronto Area, Canada
 Natural Resources Research, Vol. 13, No. 2, June 2004 ( C 2004) Application of Weights of Evidence Method for Assessment of Flowing Wells in the Greater Toronto Area, Canada Qiuming Cheng 1,2 Received
Basic Probabilistic Reasoning SEG
 Basic Probabilistic Reasoning SEG 7450 1 Introduction Reasoning under uncertainty using probability theory Dealing with uncertainty is one of the main advantages of an expert system over a simple decision
Predictive Modelling of Ag, Au, U, and Hg Ore Deposits in West Texas Carl R. Stockmeyer. December 5, GEO 327G
 Predictive Modelling of Ag, Au, U, and Hg Ore Deposits in West Texas Carl R. Stockmeyer December 5, 2013 - GEO 327G Objectives and Motivations The goal of this project is to use ArcGIS to create models
CHAPTER 4 POTENTIAL FIELD MODELLING
 CHAPTER 4 POTENTIAL FIELD MODELLING POTENTIAL FIELD MODELLING The reference dataset used for the potential field modelling is the Gravity anomaly map and Magnetic anomaly map of the Atlantic region of
THE DIGITAL TERRAIN MAP LIBRARY: AN EXPLORATIONIST S RESOURCE
 THE DIGITAL TERRAIN MAP LIBRARY: AN EXPLORATIONIST S RESOURCE By I.C.L. Webster, P.J. Desjardins and W.E. Kilby KEYWORDS: digital terrain maps, digital terrain stability maps, surficial geology, GIS, raster
U.S. GEOLOGICAL SURVEY ASSESSMENT MODEL FOR UNDISCOVERED CONVENTIONAL OIL, GAS, AND NGL RESOURCES THE SEVENTH APPROXIMATION
 Chapter AM U.S. GEOLOGICAL SURVEY ASSESSMENT MODEL FOR UNDISCOVERED CONVENTIONAL OIL, GAS, AND NGL RESOURCES THE SEVENTH APPROXIMATION By James W. Schmoker and Timothy R. Klett U.S. Geological Survey Bulletin
Spatial databases of the Humboldt Basin mineral resource assessment, northern Nevada
 Spatial databases of the Humboldt Basin mineral resource assessment, northern Nevada By Mark J. Mihalasky and Lorre A. Moyer Any use of trade, firm, or product names is for descriptive purposes only and
USING EXISTING, PUBLICLY-AVAILABLE DATA TO GENERATE NEW EXPLORATION PROJECTS
 USING EXISTING, PUBLICLY-AVAILABLE DATA TO GENERATE NEW EXPLORATION PROJECTS Philip M. Baker 1, Paul A. Agnew 2 and M. Hooper 1 1 Rio Tinto Exploration, 37 Belmont Ave, Belmont WA 6104. Australia 2 Rio
The Need for Regional Geological Datasets
 The Need for Regional Geological Datasets Dr. Eibhlín Doyle PGeo Geological Survey of Ireland Regional Data Why What Who Future 2006 Why? Place developments in context Land use decision making Assist policy
Radioactivity Maps of Nova Scotia
 A tlantic Geol ogy 1 Radioactivity Maps of Nova Scotia K.L. Ford, P.B. Holman, J.A. Grant and J.M. Carson Airborne Geophysics Section, Mineral Resources Division, Geological Survey of Canada, 601 Booth
Williston Basin Architecture and Hydrocarbon Potential: A Targeted Geoscience Initiative Project 1
 Williston Basin Architecture and Hydrocarbon Potential: A Targeted Geoscience Initiative Project 1 S.G. Whittaker Whittaker, S.G. (2005): Williston Basin architecture and hydrocarbon potential: A Targeted
The Hillsvale Vein System, Hants County
 Report of Activities 2004 39 The Hillsvale Vein System, Hants County R. J. Horne, R. R. Stea and D. J. Kontak Introduction A number of previously undocumented, beddingparallel quartz veins were discovered
Geologically-Constrained Fuzzy Mapping of Gold Mineralization Potential, Baguio District, Philippines 1
 Geologically-Constrained Fuzzy Mapping of Gold Mineralization Potential, Baguio District, Philippines 1 Emmanuel John M. Carranza 2 Mines and Geosciences Bureau (MGB) Regional Office No. 5, Philippines
DENR s Oil and Gas Initiative. Legislative briefing March 7, 2011 by DENR s Geological Survey Program
 DENR s Oil and Gas Initiative Legislative briefing March 7, 2011 by DENR s Geological Survey Program South Dakota DOES have exploration for and production of oil and gas Taken from http://denr.sd.gov/des/og/producti.aspx
Fletcher Junction Project Technical Update December 18, 2008
 Fletcher Junction Project Technical Update December 18, 2008 Disclaimer Warning! The business of Gold Exploration can be FUN, but it can also be hazardous to your physical, emotional, spiritual and financial
Extended Weights-of-Evidence Model
 Chapter 4 Extended Weights-of-Evidence Model Approaches to mineral potential mapping based on weights-of-evidence modeling generally use binary maps, whereas, real-world geospatial data are mostly multi-class
2011 Pearson Education, Inc
 Statistics for Business and Economics Chapter 3 Probability Contents 1. Events, Sample Spaces, and Probability 2. Unions and Intersections 3. Complementary Events 4. The Additive Rule and Mutually Exclusive
Short Note: Naive Bayes Classifiers and Permanence of Ratios
 Short Note: Naive Bayes Classifiers and Permanence of Ratios Julián M. Ortiz (jmo1@ualberta.ca) Department of Civil & Environmental Engineering University of Alberta Abstract The assumption of permanence
A review of the large Red Dragon prospect was completed following the 2011 field season, the
 ASX / MEDIA RELEASE ST GEORGE MINING LIMITED ASX: SGQ ACN 139 308 973 Level 1, 115 Cambridge Street PO Box 1305, West Leederville WA 6007 www.stgeorgemining.com.au Phone +618 9322 6600 Facsimile +618 9322
Processing Stream Sediment Geochemical Data for Geology and Dilution: An Example from Northern Vancouver Island
 Processing Stream Sediment Geochemical Data for Geology and Dilution: An Example from Northern Vancouver Island Dennis Arne, PGeo (BC), RPGeo (AIG), Principal Consultant Geochemistry, CSA Global Yao Cui,
New Discoveries Using Spatial Analysis in GIS
 New Discoveries Using Spatial Analysis in GIS Exploration in the Digital Age Acknowledging:, Auzex Resources, Aurora Minerals, HPD New Zealand, Garry Raines and Graeme Bonham-Carter Talking About Passion!!
Mineral Potential Mapping Using an Expert System and GIS
 Integrated Exploration Information Management Paper 12 Explor97 Master Page Explor97 Contents Previous Paper G O T O Author Index Section Contents Next Paper Mineral Potential Mapping Using an Expert System
Mineral Prospectivity Modelling 2010
 Mineral Prospectivity Modelling 2010 Kenex Ltd, Eastbourne, New Zealand Kenex Pty Ltd, Perth, Western Australia P: +64 4 562 6253 www.kenex.co.nz info@kenex.co.nz P: +61 8 6468 4965 www.kenex.com.au info@kenex.com.au
APPLICATION OF GEOGRAPHICALLY WEIGHTED REGRESSION ANALYSIS TO LAKE-SEDIMENT DATA FROM AN AREA OF THE CANADIAN SHIELD IN SASKATCHEWAN AND ALBERTA
 APPLICATION OF GEOGRAPHICALLY WEIGHTED REGRESSION ANALYSIS TO LAKE-SEDIMENT DATA FROM AN AREA OF THE CANADIAN SHIELD IN SASKATCHEWAN AND ALBERTA Nadia Yavorskaya 1, Stephen Amor 2 1 450 Bonner Av., Winnipeg,
Developments in the Effective Use and Interpretation of Lithogeochemistry in Regional Exploration Programs: Application of GIS Technology
 Exploration Geochemistry Paper 35 Explor97 Master Page Explor97 Contents Previous Paper G O T O Author Index Section Contents Next Paper Developments in the Effective Use and Interpretation of Lithogeochemistry
Spatial Data Modelling: The Search For Gold In Otago. Presented By Matthew Hill Kenex Knowledge Systems (NZ) Kenex. Kenex
 Kenex. Kenex") Spatial Data Modelling: The Search For Gold In Otago Presented By Matthew Hill Knowledge Systems (NZ) Acknowledgements Michelle Stokes & Greg Partington - Pty Ltd (Australia) Paul Matthews, Charlene Wildman,
Spatial Data Modelling: The Search For Gold In Otago Presented By Matthew Hill Knowledge Systems (NZ) Acknowledgements Michelle Stokes & Greg Partington - Pty Ltd (Australia) Paul Matthews, Charlene Wildman,
Chapter 22 Solving the Wrong Resource Assessment Problems Precisely
 Chapter 22 Solving the Wrong Resource Assessment Problems Precisely Donald A. Singer Abstract Samples are often taken to test whether they came from a specific population. These tests are performed at
NSERC-CMIC FOOTPRINTS
 NSERC-CMIC FOOTPRINTS Perrouty S, Linnen RL, Lypaczewski P, Gaillard N, Olivo GR, Lesher CM, Piette-Lauzière N, Crocker M, Piercey SJ, El Goumi N, Enkin RJ, Bouchard F, 2015, Footprint of the Canadian
POTENTIAL OF THE DONGWE COPPER GOLD PROJECT
 POTENTIAL OF THE DONGWE COPPER GOLD PROJECT By Nathan Sabao, P.Geo. September 2015 1 TABLE OF CONTENTS Page 1.0 EXECUTIVE SUMMARY 1 2.0 LOCATION 2 3.0 ACCESS 2 4.0 GEOLOGY 3 5.0 PREVIOUS DRILLING 5 6.0
Enhanced Subsurface Interpolation by Geological Cross-Sections by SangGi Hwang, PaiChai University, Korea
 Enhanced Subsurface Interpolation by Geological Cross-Sections by SangGi Hwang, PaiChai University, Korea Abstract Subsurface geological structures, such as bedding, fault planes and ore body, are disturbed
Application of Predictive Modeling to the Lower Cretaceous Sedimentary Sequences of the Central Scotian Basin
 Application of Predictive Modeling to the Lower Cretaceous Sedimentary Sequences of the Central Scotian Basin Christopher R. Sangster 1, Nicolas Hawie 2, Georgia Pe-Piper 1, Francky Saint-Ange 2, David
Regional GIS based exploration targeting studies in data poor environments
 Regional GIS based exploration targeting studies in data poor environments A case study of gold prospectivity mapping in Nigeria Matthew Greentree, Mathieu Lacorde and Bert De Waele Acknowledgements Australian
ANTLER GOLD HIGHLIGHTS NEW GOLD-IN-SOIL ANOMALIES, CENTRAL NEWFOUNDLAND
 ANTLER GOLD HIGHLIGHTS NEW GOLD-IN-SOIL ANOMALIES, CENTRAL NEWFOUNDLAND HALIFAX, NOVA SCOTIA (CNW October 17, 2018) Antler Gold Inc. ( Antler ) (TSX- V:ANTL) is pleased to provide an update on its successful
Magnus Copper Project exploration update
 ASX ANNOUNCEMENT 30 SEPTEMBER 2011 CODE: ALY BOARD OF DIRECTORS Mr Warwick Davies Non-Executive Chairman Mr Robert Brierley Managing Director Mr John Arbuckle Non-Executive Director Mr Jeffrey Moore Non-Executive
Scadding Property Sudbury District, Ontario
 FOR IMMEDIATE RELEASE Northern Sphere Mining Corp. optimizes mineral targets on its Sudbury Nickel Belt and Arizona Porphyry Copper properties Toronto, Ontario April 5, 2018 - Northern Sphere Mining Corp.
ANTLER GOLD EXPLORATION UPDATE, WILDING LAKE GOLD PROJECT, NEWFOUNDLAND
 ANTLER GOLD EXPLORATION UPDATE, WILDING LAKE GOLD PROJECT, NEWFOUNDLAND HALIFAX, NOVA SCOTIA (CNW May 10, 2018) Antler Gold Inc. ( Antler ) (TSX-V:ANTL) is pleased to provide an update on its upcoming
Radon Soil Gas Associated With the C2 Zone, Millet Brook Uranium District (NTS 21A/16)
") Report of Activities 2009 35 Radon Soil Gas Associated With the C2 Zone, Millet Brook Uranium District (NTS 21A/16) T. A. Goodwin, G. A. O Reilly, K. L. Ford 1 and P. W. B. Friske 1 Introduction Radon
Report of Activities 2009 35 Radon Soil Gas Associated With the C2 Zone, Millet Brook Uranium District (NTS 21A/16) T. A. Goodwin, G. A. O Reilly, K. L. Ford 1 and P. W. B. Friske 1 Introduction Radon
For personal use only
 DEEP DRILLING AT GLANDORE AND BULLOO DOWNS DEEP DRILLING AT GLANDORE AND BULLOO DOWNS HIGHLIGHTS Glandore Gold Project Successful EIS application for a deep diamond drill hole Four large-scale parallel
Weight of Evidence Allocates Mineral Depositional Zones
 American Journal of Environmental Sciences 6 (6): 484-488, 2010 ISSN 1553-345X 2010 Science Publications Weight of Evidence Allocates Mineral Depositional Zones 1 Abdullah A. Bokhari, 1 Guang Dao HU and
Sociology 6Z03 Review II
 Sociology 6Z03 Review II John Fox McMaster University Fall 2016 John Fox (McMaster University) Sociology 6Z03 Review II Fall 2016 1 / 35 Outline: Review II Probability Part I Sampling Distributions Probability
STATISTICS SYLLABUS UNIT I
 STATISTICS SYLLABUS UNIT I (Probability Theory) Definition Classical and axiomatic approaches.laws of total and compound probability, conditional probability, Bayes Theorem. Random variable and its distribution
Diversity partitioning without statistical independence of alpha and beta
 1964 Ecology, Vol. 91, No. 7 Ecology, 91(7), 2010, pp. 1964 1969 Ó 2010 by the Ecological Society of America Diversity partitioning without statistical independence of alpha and beta JOSEPH A. VEECH 1,3
Naïve Bayes classification
 Naïve Bayes classification 1 Probability theory Random variable: a variable whose possible values are numerical outcomes of a random phenomenon. Examples: A person s height, the outcome of a coin toss
Using Predictive Modelling to Aid Planning in the Mineral Exploration and Mining Sector A Case Study using the Powelliphanta Land Snail
 Using Predictive Modelling to Aid Planning in the Mineral Exploration and Mining Sector A Case Study using the Powelliphanta Land Snail C. Wildman 1 and K. Peters 2 1 Kenex Limited, PO Box 41136, Eastbourne,
Review Basic Probability Concept
 Economic Risk and Decision Analysis for Oil and Gas Industry CE81.9008 School of Engineering and Technology Asian Institute of Technology January Semester Presented by Dr. Thitisak Boonpramote Department
Prospectivity Modelling of Mineralisation Systems in Papua New Guinea Using Weights of Evidence Techniques
 Prospectivity Modelling of Mineralisation Systems in Papua New Guinea Using Weights of Evidence Techniques K Peters 1 and G Partington 2 ABSTRACT A regional scale prospectivity model was developed for
Naive Bayesian Rough Sets
 Naive Bayesian Rough Sets Yiyu Yao and Bing Zhou Department of Computer Science, University of Regina Regina, Saskatchewan, Canada S4S 0A2 {yyao,zhou200b}@cs.uregina.ca Abstract. A naive Bayesian classifier
Raster Data Enhancement and Tectonic Element Interpretation in ArcMap
 Raster Data Enhancement and Tectonic Element Interpretation in ArcMap Vsevolod Egorov ESRI Petroleum User Group Conference Houston, TX 2005 Abstract ArcMap Spatial Analyst provides quick, but powerful
TSX.V: AVU TSX.V: AVU
 Ebersbrun Mine Forward Looking Statements Some of the statements contained in this presentation are forward-looking statements. Forwardlooking statements are not historical facts and are subject to a number
Large Epithermal Quartz Veins Found in Outcrop at Shot Rock, Nova Scotia; Dozens of Large Angular Boulders Suggest Extensive System
 Large Epithermal Quartz Veins Found in Outcrop at Shot Rock, Nova Scotia; Dozens of Large Angular Boulders Suggest Extensive System Ottawa, Ontario (November 7, 2018) - Northern Shield Resources Inc. ("Northern
Probability Theory for Machine Learning. Chris Cremer September 2015
 Probability Theory for Machine Learning Chris Cremer September 2015 Outline Motivation Probability Definitions and Rules Probability Distributions MLE for Gaussian Parameter Estimation MLE and Least Squares
For personal use only
 20 16 FEBRUARY JANUARY 2017 ASX ANNOUNCEMENT OMMANEY FOLLOW-UP RC DRILLING Ommaney follow up drilling to commence in early to mid-march 2017. A 7 hole RC drilling program will follow up the intense alteration
Licensed Science Officer Benchmark
 POSITION EVALUATION RATIONALE POSITION TITLE Senior Project Geologist MINISTRY AND DIVISION Energy, Mines and Petroleum Resources: Geological Division BRANCH AND SECTION Mineral Resources UNIT OR PROGRAM
Multivariate statistical methods and data mining in particle physics
 Multivariate statistical methods and data mining in particle physics RHUL Physics www.pp.rhul.ac.uk/~cowan Academic Training Lectures CERN 16 19 June, 2008 1 Outline Statement of the problem Some general
Placer Potential Map. Dawson L and U se P lan. Jeffrey Bond. Yukon Geological Survey
 Placer Potential Map Dawson L and U se P lan By Jeffrey Bond Yukon Geological Survey Dawson Land Use Plan Placer Potential Map 1.0 Introduction Placer mining has been an important economic driver within
Intrusion-related mineral systems of north-east Queensland 3-year collaborative research project
 Intrusion-related mineral systems of north-east Queensland 3-year collaborative research project Vladimir Lisitsin (Geological Survey of Queensland) Gregg Morrison (Klondike Exploration) Simon Beams (Terra
3D Modeling for exploration
 3D Modeling for exploration Tero Niiranen Acting Division Manager Bedrock and Resources, GTK Rovaniemi office 02.05.2014 1 3D modeling supporting exploration in GTK Visualizing data in 3D world 3D geophysical
Statistics for Managers Using Microsoft Excel (3 rd Edition)
") Statistics for Managers Using Microsoft Excel (3 rd Edition) Chapter 4 Basic Probability and Discrete Probability Distributions 2002 Prentice-Hall, Inc. Chap 4-1 Chapter Topics Basic probability concepts
Statistics for Managers Using Microsoft Excel (3 rd Edition) Chapter 4 Basic Probability and Discrete Probability Distributions 2002 Prentice-Hall, Inc. Chap 4-1 Chapter Topics Basic probability concepts
For personal use only
 ASX Announcement 15 March 2017 HIGHLIGHTS Drill contractors have been engaged with drilling to commence April 2017 pending access approvals Two mineralised lodes within the oxide volcanogenic massive sulphide
Bayesian Estimation of Prediction Error and Variable Selection in Linear Regression
 Bayesian Estimation of Prediction Error and Variable Selection in Linear Regression Andrew A. Neath Department of Mathematics and Statistics; Southern Illinois University Edwardsville; Edwardsville, IL,
QUATERNARY GEOLOGY STUDIES IN CENTRAL MELVILLE PENINSULA, NUNAVUT
 QUATERNARY GEOLOGY STUDIES IN CENTRAL MELVILLE PENINSULA, NUNAVUT Tremblay, T. 1, Paulen, R. 2 and Corrigan, D. 2 (1) Canada-Nunavut Geoscience Office, Iqaluit, NU (2) Geological Survey of Canada, Ottawa,
BCGQ Mission Statement. Acquire new geoscientific knowledge in Québec within a sustainable development perspective of our mineral resources.
 BCGQ Mission Statement Acquire new geoscientific knowledge in Québec within a sustainable development perspective of our mineral resources. Financial Resources Natural Resources Fund, Mining Heritage Section
Introduction to Probability
 Introduction to Probability Content Experiments, Counting Rules, and Assigning Probabilities Events and Their Probability Some Basic Relationships of Probability Conditional Probability Bayes Theorem 2
Computer Vision Group Prof. Daniel Cremers. 2. Regression (cont.)
") Prof. Daniel Cremers 2. Regression (cont.) Regression with MLE (Rep.) Assume that y is affected by Gaussian noise : t = f(x, w)+ where Thus, we have p(t x, w, )=N (t; f(x, w), 2 ) 2 Maximum A-Posteriori
Prof. Daniel Cremers 2. Regression (cont.) Regression with MLE (Rep.) Assume that y is affected by Gaussian noise : t = f(x, w)+ where Thus, we have p(t x, w, )=N (t; f(x, w), 2 ) 2 Maximum A-Posteriori
University of Technology, Building and Construction Engineering Department (Undergraduate study) PROBABILITY THEORY
 PROBABILITY THEORY") ENGIEERING STATISTICS (Lectures) University of Technology, Building and Construction Engineering Department (Undergraduate study) PROBABILITY THEORY Dr. Maan S. Hassan Lecturer: Azhar H. Mahdi Probability
ENGIEERING STATISTICS (Lectures) University of Technology, Building and Construction Engineering Department (Undergraduate study) PROBABILITY THEORY Dr. Maan S. Hassan Lecturer: Azhar H. Mahdi Probability
Elements of probability theory
 The role of probability theory in statistics We collect data so as to provide evidentiary support for answers we give to our many questions about the world (and in our particular case, about the business
Chapter 1 (Basic Probability)
") Chapter 1 (Basic Probability) What is probability? Consider the following experiments: 1. Count the number of arrival requests to a web server in a day. 2. Determine the execution time of a program. 3.
Chapter 1 (Basic Probability) What is probability? Consider the following experiments: 1. Count the number of arrival requests to a web server in a day. 2. Determine the execution time of a program. 3.
Case study: Integration of REFLEX iogas and an Olympus PXRF analyzer with Leapfrog Geo for advanced dynamic modelling and better decision making
 LEAPFROG GEO Case study: Integration of REFLEX iogas and an Olympus PXRF analyzer with Leapfrog Geo for advanced dynamic modelling and better decision making FIRST QUANTUM MINERALS LTD KEVITSA NI-CU-PT-PD
Blox, Inc. Announces New Drilling Target Defined at Mansounia Gold Project.
 Blox, Inc. Announces New Drilling Target Defined at Mansounia Gold Project. Vancouver, British Columbia, July 6, 2018 Blox, Inc. (OTCQB: BLXX), ( Blox or the Company ) is pleased to announce that a new
Exploration Geochemistry: Updating Its Contribution to Mineral Resource Development. L. Graham Closs Colorado School of Mines.
 Exploration Geochemistry: Updating Its Contribution to Mineral Resource Development. L. Graham Closs Colorado School of Mines May 22, 2012 Geochemistry in the Exploration Process Means of Contributing
Introduction to probability
 Introduction to probability 4.1 The Basics of Probability Probability The chance that a particular event will occur The probability value will be in the range 0 to 1 Experiment A process that produces
Outline Brief Overview MapPlace Website Data Delivery & Map Themes Digital Geology
 BRITISH COLUMBIA GEOLOGICAL SURVEY Kirk Hancock Pat Desjardins Nick Massey BRITISH COLUMBIA Ministry of Energy and Mines Ward Kilby acknowledged developer of MapPlace Outline Brief Overview MapPlace Website
Naïve Bayes classification. p ij 11/15/16. Probability theory. Probability theory. Probability theory. X P (X = x i )=1 i. Marginal Probability
=1 i. Marginal Probability") Probability theory Naïve Bayes classification Random variable: a variable whose possible values are numerical outcomes of a random phenomenon. s: A person s height, the outcome of a coin toss Distinguish
Probability theory Naïve Bayes classification Random variable: a variable whose possible values are numerical outcomes of a random phenomenon. s: A person s height, the outcome of a coin toss Distinguish
An-Najah National University Faculty of Engineering Industrial Engineering Department. Course : Quantitative Methods (65211)
") An-Najah National University Faculty of Engineering Industrial Engineering Department Course : Quantitative Methods (65211) Instructor: Eng. Tamer Haddad 2 nd Semester 2009/2010 Chapter 2 Probability 2-1
An-Najah National University Faculty of Engineering Industrial Engineering Department Course : Quantitative Methods (65211) Instructor: Eng. Tamer Haddad 2 nd Semester 2009/2010 Chapter 2 Probability 2-1
TOWARDS THE USE OF GIS IN GEOTHERMAL RESOURCE MANAGEMENT- A CASE STUDY OF OLKARIA GEOTHERMAL PROJECT ABSTRACT
 TOWARDS THE USE OF GIS IN GEOTHERMAL RESOURCE MANAGEMENT- A CASE STUDY OF OLKARIA GEOTHERMAL PROJECT Fred Wekesa and Beatrice Gichini Olkaria Geothermal Project Kenya Electricity Generating Company Ltd
A B C PAD A HIGHLIGHTS
 Murchison Minerals Intercepts 12.30% Zinc, 0.70% Copper, 0.18% Lead and 42.03 g/t Silver 14.97% ZnEq over 6.37 Metres and Extends Known Limits of Brabant McKenzie VMS Deposit June 25, 2018 (Toronto, Ontario):
Incorporating Mineral Prospectivity Analysis in Quantitative Estimation of Undiscovered Mineral Resources
 VI Brazilian Symposium on Mineral Exploration Ouro Preto, Minas Gerias, Brazil 11-14 May 2014 Incorporating Mineral Prospectivity Analysis in Quantitative Estimation of Undiscovered Mineral Resources John
Naive Bayesian classifiers for multinomial features: a theoretical analysis
 Naive Bayesian classifiers for multinomial features: a theoretical analysis Ewald van Dyk 1, Etienne Barnard 2 1,2 School of Electrical, Electronic and Computer Engineering, University of North-West, South
Yukon Presentation. January 2015
 Yukon Presentation January 2015 Disclaimer This presentation contains forward looking statements. All statements, other than statements of historical fact, included herein, including without limitation,
Integration of Geological Datasets for Gold Exploration in Nova Scotia
 Integration of Geological Datasets for Gold Exploration in Nova Scotia G. F. Bonham-Carter, F. P. Agterberg, and D. F. Wright Mineral Resources Division, Geological Survey of Canada, 601 Booth Street,
SUMMARY. QUARTERLY REPORT for the Quarter Ended 31 March km uranium zone with grades up to 0.03% U 3 O 8 at Lake Seabrook.
 QUARTERLY REPORT for the Quarter Ended 31 March 2009 Magnetic Resources NL ABN 34 121 370 232 SUMMARY ASX Code: MAU 35 Outram Street West Perth WA 6005 T +61 8 9226 1777 F +61 8 9485 2840 E info@magres.com.au
Statistical Seismic Landslide Hazard Analysis: an Example from Taiwan
 Statistical Seismic Landslide Hazard Analysis: an Example from Taiwan Chyi-Tyi Lee Graduate Institute of Applied Geology, National Central University, Taiwan Seismology Forum 27: Natural Hazards and Surface