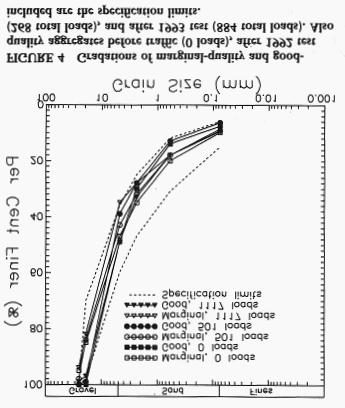
Effect of Aggregate Quality on Sediment Production from a Forest Road
|
|
|
- Virgil Higgins
- 6 years ago
- Views:
Transcription
1 Effect of Aggregate Quality on Sediment Production from a Forest Road Randy B. Foltz, USDA Forest Service, Moscow, Idaho Mark A. Truebe, USDA Forest Service, Eugene, Oregon Aggregate is placed on forest roads in wet climates to provide structural support for traffic and in dry climates to reduce sediment production caused by precipitation. In both climates aggregate of suitable quality is often not readily available. The substitution of poorer-quality aggregate can cause greater amounts of sediment than those produced by good-quality aggregate. To measure the differences in sedimentation rates, the Forest Service of the U.S. Department of Agriculture conducted a sediment study using two aggregate qualities. The study was conducted using natural rainfall and logging truck traffic on an aggregate-surfaced road during the winters of 1992 and 1993 in western Oregon and using simulated rainfall following the winter of The results showed that the quality of the aggregate made a notable difference in sediment production. When subjected to heavy logging truck traffic, a marginal-quality aggregate produced from 2.9 to 12.8 times as much sediment as that from a similar section surfaced with good-quality aggregate. The greater difference occurred in the winter with the greater rainfall. Whereas the good-quality aggregate provided the expected level of sediment mitigation, the marginal-quality aggregate did not. These results have important implications for road use and sediment production. The U.S. Department of Agriculture Forest Service road network consists of 369,000 mi of which approximately 65 percent is unsurfaced, 30 percent is aggregate surfaced, and 5 percent is paved (D. Badger, unpublished data). In wet climates such as those in western Oregon and Washington, most roads are surfaced with 200 to 400 mm (8 to 16 in.) of aggregate (surface and base courses) to provide structural support during wet weather. High-quality road surfacing aggregates are not always readily available in many localities, and marginal-quality aggregates are used to reduce road-building costs. In some instances marginalquality aggregates perform adequately from a structural reference but may generate sediment. The effects of aggregate quality on sediment production have not been adequately quantified to date. Typical constructed profiles of logging roads in wet climates consist of a 25-mm (1-in.) minus dense-graded surfacing aggregate over a larger-sized base course aggregate. Even with these relatively large thicknesses of aggregate materials, sedimentation can be a problem. In drier climates such as that of the intermountain West, placement of aggregate on the running surface is an accepted method of reducing the amount of sediment produced from unsurfaced forest roads. In these situations the aggregate thickness is less than it is in wet climates. Burroughs and King (1) developed an equation relating ground cover (i.e., aggregate layer) to reduction in sediment production. Their equation gave a 95 percent reduction in sediment for a 100 percent ground cover of aggregate. In a study (2) on the Nez Percé National Forest, Idaho, on borderzone batholith material of gneiss and schist using a 102-mm (4-in.) lift of 38-mm (1 1/2-in.) minus high-quality, gneissic, crushed rock, simulated rainfall gave a sediment reduction of 79 percent compared with an unsurfaced road of the same parent material. Swift (3) demonstrated the importance of the thickness of the aggregate layer. A Si-mm (2-in.) lift of 38-mm (1 1/2-in.) crushed rock resulted in no sediment reduction. A 152-mm (6 in.) lift of the same size gave a 92 percent reduction, and a 200-mm (8-in.) lift with a D 50 of 76 mm (3 in.) resulted in a 97 percent reduction in sediment. The Burroughs studies used high-quality aggregate. However, Burroughs and King stated that the mitigation of sediment production by the use of aggregate is a function of the erodibility of the aggregate surfacing and subgrade soil. High-quality aggregate is not always readily available at reasonable distances. National forests often have to use aggregate of lower quality that is more conveniently located. These erosion mitigation studies measured sediment production without the concurrent application of traffic. These or similar reductions in sediment production are frequently used in forest road planning and design. SPECIFYING AGGREGATES Aggregate is typically specified to meet a series of established engineering standards relating to gradation and the quality of the aggregate particles. The quality tests address both the resistance to mechanical breakdown resulting from traffic and the chemical breakdown resulting from the presence of water. Minimum standards are typically established by an agency but are primarily established considering the structural adequacy
2 for base course aggregates in pavements. Table 1 displays the quality standards generally in use by the Forest Service (4). These same tests are currently used to specify surface course materials, but the same minimum values may not apply when addressing sedimentation. Gradation Gradation (AASHTO T 11 and T 27) (5) controls specify the size distribution for an aggregate. Gradation requirements for surfacing materials need to be dense graded to provide adequate internal stability (maintain point-topoint contact for strength) and have sufficient fines to minimize water infiltration during wet weather. If too many fines are available (either during crushing or by breakdown of the aggregate), the aggregate can become unstable and produce unwanted sediments. Mechanical Durability Los Angeles Abrasion (AASHTO T 96) is a measure of an aggregate s tendency to break down from the direct pressure of traffic. The test consists of subjecting an aggregate sample to the impact of steel balls rotating in a drum. The breakdown is expressed as the percentage of wear based on the gradation change during the test. Aggregates that are susceptible to wear can become unstable because the aggregate particles are no longer in point-to-point contact.
3 Chemical Durability Chemical durability relates to the tendency of an aggregate to break down because of the presence of water. Various tests (5 8) have been used to measure this tendency, and local practice (4) utilizes the aggregate durability index (AASHTO T 210) and the accelerated dimethyl sulfoxide (DMSO) weathering test (FHWA Section 4.104). The durability index test essentially subjects a test sample of the coarse and fine fraction to an agitated source of water. It is an empirical value determined from the level of sediment produced after the material is allowed to settle for a prescribed amount of time. The DMSO test is an accelerated weathering test. An aggregate sample is submerged in DMSO, which can be absorbed into secondary minerals within the rock mass. Since these secondary minerals are clay or claylike, swelling and disintegration can occur. This effect is reported as the DMSO loss. Characteristics of Fines Gradation will provide a measure of the quantity of fines and the durability tests provide a measure of the tendency to produce more fine material, but neither is a direct measure of the characteristics of the fines. Typically, fines manufactured during crushing or silt-sized natural fines are not as susceptible to volume change (and instability) as clay fines. The Atterberg limits (AASHTO T 89 and 1 90) and the sand equivalent (AASHTO T 176) tests are measures of this tendency. The plasticity index is the measure of the claylike nature of the fines. In the sand equivalent test, a sample of material is agitated in water and the sand equivalent value is determined empirically from the quantity of sediment that settles out after a prescribed amount of time. The higher the clay content, the longer the material stays in suspension and the lower the sand equivalent value. Methodology The Intermountain Research Station and the Willamette National Forest conducted a study of how aggregate quality affects sediment production during logging truck traffic. This study, conducted during the winter months of 1992 and 1993, was a part of a larger study that included the effect of tire pressure on sediment production (9) and a study of the development of ruts with traffic. Only the aggregate-quality study will be reported in this paper. Test Site A crowned section of forest road on the Lowell District of the Willamette National Forest, Oregon, was selected for the test. The section, which was 2.25 km (1.4-mi) long by 4.27 m (14 ft) wide, was chosen to meet the requirements of length, constant grade, and the ability to control nontest traffic. Two sections 61 m (200 ft) long that had similar grades and aspects were selected. One of the test sites was surfaced with a marginal-quality aggregate obtained from the Porcupine Materials Source on the Lowell Ranger District, whereas the other site was surfaced with a good-quality aggregate obtained from a private source, Springfield Quarry in Springfield, Oregon. Table 1 presents the aggregate specifications. Geologically both sites contain igneous extrusive materials, but whereas Springfield Quarry has consistently provided high-quality aggregate, the Porcupine Materials Source contains zones of weathering that produce marginal-quality aggregate. For this study, 102 mm (4 in.) of the specified quality of aggregate was compacted as surfacing on the existing aggregate. The existing aggregate varied from 304 to 406 mm (12 to 16 in.) of a 76-mm (3-in.) minus material on a clayey silt, ML subgrade. At the lower end of each road section, a 2-rn-wide asphalt apron was installed across the width of the road, as shown in Figure 1. One-half of this asphalt apron contained a 12-mm (1/2-in.) aggregate with a high oil content to allow the apron to conform to the expected wheel ruts. The remaining half contained 19-mm (3/4-in.) aggregate. The apron ended in an open-top drain laid diagonally across the road. The drain emptied into a water and sediment measurement box. The apron and open-top drain arrangement was used to measure runoff and sediment flowing along the road grade. These measurements will be referred to as the drain source. To measure the runoff and sediment flowing laterally off the road, a sheet metal gutter 16 m (SQ ft) long by 20 mm (8 in.) wide was installed on each side of the road section, as shown in Figure 1. A 16-m segment was utilized rather than the full length to reduce construction costs. Flow from these gutters, located approximately half way down the road section, was combined near the bottom of the road section and the combined flow was measured. These measurements will be referred to as the gutter source. Using the two measurements, both the concentrated flow in wheel ruts (from the drain pipe) and the shallow sheet flow (from the gutters) could be measured.
4 Runoff and Sediment Measurements The outlet of each runoff source (drain or gutter) was directed into a 0.15-rn 3 (1.6-ft 3 ) aluminum box with a modified 22.5-degree V-notch weir at the outlet. The weir was modified by adding a slot 6 mm (1/4 in.) wide by 13 mm (1/2 in.) long at the base of the V. Without this modification, water surface tension at the base of the V made maintaining a reference level difficult. Although this design sacrificed the accurate measurement of low flows, for this application the slot was an improvement over the original V-notch design. The water levels taken at 1-mm intervals were converted to flow rates using a rating curve developed for the modified V-notch weirs. During runoff events, grab samples were taken from the weir overflow to characterize the effect of truck traffic. Sediment concentrations were determined by oven-drying the grab samples at 105 C. Sediment in the runoff was trapped in the settling box located above the weir. Sediment trapped in the settling boxes was removed three times during the 1992 test and four times during the 1993 test. All of the sediment was oven-dried at 105 C to determine the dry weight. An estimate of the runoff and sediment production from the entire road section was made using the measured gutter and drain collectors. Since one gutter collector was placed on each side of the road and extended for one-fourth of the length of the entire road section, it was assumed that they collected one-fourth of the total runoff flowing from the crown of the road. Observation of the flow during the two test periods tended to validate this assumption. The runoff rate from the gutter collector was multiplied by four and added to the drain collector for an estimate of the entire road section. Trap Efficiency The material collected in the settling boxes represented only a portion of the material eroded from the road surface even though the boxes had two vertical barriers to minimize velocity. The sand and larger-size material were trapped by the box with efficiencies increasing with sediment size. The finer sizes, such as the silts and clays, did not have sufficient residence time to settle and were not captured efficiently in the box. Flow rates also changed the turbulence in the boxes, affecting the settling of individual particles. Two methods were used to estimate the trap efficiency. One method compared runoff samples taken simultaneously at the inlet and outlet of the box. The second method compared the mass of sediment deposited in the weir with the mass of sediment calculated from the runoff flow rates and the inlet sediment concentrations. The two methods were averaged for each runoff source and used to adjust the sediment masses. When expressed as a percentage of the material remaining in the settling box, the average trap efficiency for the drain source was 35.6 percent and that for the gutter source was 40.2 percent. Truck Traffic To simulate the effects of road use from a timber harvest, loaded and unloaded trucks were driven on the test loop. During the winter of 1992, two trucks were used. One western-style logging truck with a kg (49,400-Ib) load of logs was driven downhill. A dump truck with the same axle spacing as an unloaded logging truck carrying its trailer was driven up the hill. All trucks had a tire inflation of 620 kpa (90 psi). Other test sections had traffic with lower tire pressures but are not presented in this paper. During the winter of 1993, a second loaded logging truck was added. It also had a kg load of logs and was driven downhill. The dump truck made twice as many passes as the logging trucks to maintain the desired ratio of one loaded logging truck for each unloaded truck. Tire inflation remained at 620 kpa.
 and a duration of 30 mm was used.")
5 Rainfall Simulation At the conclusion of the 1993 test, rainfall simulation was performed. A single simulated storm on each section with an intensity of 50 mm/hr (2 in./hr) and a duration of 30 mm was used. This intensity-duration storm was very rare for the Lowell area (in excess of 1,000 years), but has a reasonable return period for the intermountain regions of the Rockies. The simulator used was a modified CSU type (10). The road sections were not graded but left in rutted condition and were shortened to 42.7 m (140 ft) to not exceed the capacity of the weirs. Water levels in the settling boxes were taken at 1-mm intervals during the simulation. Grab samples were taken at 70-sec intervals to determine sediment concentration. The settling boxes were cleaned before and after the simulations. An estimate for the entire road section was made in the same manner as for the natural rainfall except the factor for the gutter sources was changed to 2.8 (140 ft/so ft). RESULTS AND ANALYSIS During the winter of 1992, the two trucks hauled the equivalent of 1.3 million board feet (268 loads) in 36 driving days between mid-february and April. During this test period of 51 days, there was 147 mm (5.8 in.) of precipitation in 20 days. The greatest 24-hr precipitation depth was 31 mm (12.9 in.). The maximum 5-mm intensity was 18 mm/hr (0.71 in./hr). During the winter of 1993, the three trucks hauled the equivalent of 3.0 million board feet (616 loads) in 25 driving days between January and April. Precipitation for the test period of 90 days was 521 mm (20.5 in.), which fell in 37 days. Of this amount, 249 mm (9.8 in.) fell as snow between January 7 and 22. The greatest 24-hr precipitation depth was 44 mm (1.7 in.) whereas the maximum 5-mm intensity was 17 mm/hr (0.67 in./hr). Natural Rainfall Table 2 presents the water yields from the natural rainfall events for the 2 years of the test. The good-quality road section had lower runoff than the marginal-quality section, indicating a higher infiltration rate. The higher infiltration rate was a result of the cleaner aggregate. In 1993 the runoff ratios were lower than the 1992 rates even though the precipitation was greater. Much of this was because 48 percent of the 1993 precipitation was snow, which slowly infiltrated into the road surface as it melted. In 1992 none of the precipitation was snow. Table 3 shows the sediment production for the 2 years of the test. The sediment mass was adjusted for the trap efficiencies and therefore represents the amount of material eroded from the road surfaces. Virtually all of the eroded material, 96 to 99 percent, was smaller than 6 mm (1/4 in.). The amount of material smaller than 200 mesh (0.047 mm) in the runoff from both road sections was typically 65 percent. The ratio of the marginal-quality to good-quality road section sediment production represents the increase in sediment resulting from the use of poorer-quality aggregate. This ratio was 2.92 for 1992, the year of 147 mm (5.78 in.) of rainfall, and increased to for 1993, the year of 521 mm (21 in.) of rainfall. The sediment ratio demonstrates the value of using the good-quality aggregate. In the year of lower precipitation, for every unit of sediment eroded from the good aggregate, nearly three units were eroded from the marginal-quality aggregate. The difference between sediment production was more pronounced in the year of higher precipitation in which, for each unit of sediment from the good-quality aggregate, the marginal quality aggregate produced 13.3 units. Two factors, aggregate quality and rut depth, contributed to the differences. The aggregate quality reflected the amount of fines and the ability to resist additional fine generation resulting from traffic. The rut depth allowed concentrated flow on the marginal-quality road section. The fact that the concentrated flow was more erosive than the overland flow caused more erosion on the marginalquality road. Of these two factors, only the rut depth was controllable. In this test the rut depth was controlled by the

.")
6 quality of the aggregate, since both sections had identical traffic. Alternatively, rut depth could be controlled by grading the road, but this approach may or may not reduce sediment production depending upon the depth of the rut removed and the amount of loose material left after grading. Grading on a road that is near saturation is difficult to recompact during wet weather. A looser surface is more susceptible to increased infiltration, the aggregate can become more unstable, and the sediment production can increase (11). Relating the timing of road maintenance to rut depth is an ongoing topic of research at the Intermountain Research Station. The cross sections shown in Figure 2 illustrate the degree of rutting that occurred. Each road section had the same number of truck loads as well as the same amount of precipitation. The lower-quality aggregate road showed a marked effect in the development of rutting. Using a peakto-peak measure of the depth of a rut, the marginal-quality aggregate resulted in a rut 133 mm (5 1/4 in.) deep as opposed to a rut 25 mm (1 in.) deep on the good-quality aggregate. The deeper rut allowed a more concentrated flow to occur, resulting in greater sediment production, as shown in Table 3. Simulated Rainfall Table 4 gives the water yield results from the rainfall simulations. The marginal-quality aggregate again resulted in a higher runoff ratio. It also illustrates that overland flow predominated on the good-quality section as evidenced by the fact that the peak flow on the gutter source (lateral flow) was higher than that on the drain source (flow in the ruts). The opposite occurred on the marginal section, indicating a predominance of flow in the ruts. From this observation, one would expect more sediment from the marginal section. Table S presents the sediment production results from the rainfall simulations. As was observed from the natural events and expected from investigation of the type of flow occurring on the road sections, greater sediment production occurred from the marginal quality section. A comparison of the sediment ratios from simulation, as shown in Table 5, and from natural events, as shown in Table 3, shows the simulation to be intermediate between the 2 test years (see Figure 3). There was no traffic during the single simulation event, so the immediate effect of the trucks during the event could not be measured. Neither was the measurement of the long-term effects of truck traffic, such as continued breakdown of the aggregate, possible during the simulation. The simulation more closely represents the effects of a single storm. Aggregate Specifications After Traffic At the end of the study, all gradations were well within the requirements for the 1-in, dense graded specifications (4), but the good-quality aggregate was closer to the coarse side of the specification requirement for the sand size and smaller material. The major differences between the goodand marginal-quality aggregates are in the durability index for the fine fraction and the sand equivalent value. The durability index (fine) for the good-quality aggregate averaged 60, whereas the durability index (fine) for the marginal averaged 31, which is out of specification. This difference indicated the tendency of the fine fraction of the marginal aggregate to break down and produce more fines. The sand equivalent value for the good-quality material was initially 56 and then averaged 38 after the first year of traffic. The sand equivalent value for the marginal aggregate, however, averaged 22 for both years, well below the

7
8 minimum value of 35. These two quality indicators are considerably different and best relate to the sediment production performance differences. Figure 4 is a summary of the gradation tests of the marginal and good aggregate throughout the study. The gradation of the marginal aggregate varied little from the initial gradation, whereas the gradation of the good-quality aggregate, initially on the coarse side of the specification requirement, became finer and approached that of the marginal-quality aggregate. This gradation is indicative of the tendency of an aggregate to alter grain size to the center of the gradation band, which represents a maximum internal stability. Comparing these sediment losses for each road section with the entire weight of the material finer than the No. 200 sieve for the 76-mm (4 in.) layer full width and length equates to 1.3 percent and 20 percent of the weights of material present. Since the gradation of the marginal material essentially did not change and the gradation of the good-quality material increased in fines, it is evident that the marginal aggregate broke down considerably to produce this quantity of sediment. These aggregates are representative of good- and marginal-quality aggregates that have been used to surface low-volume roads. Under highway tire pressures, the good-quality aggregate produced only 7 percent of the quantity of sediment, whereas the poor-quality aggregate produced the remainder. The sand equivalent and durability index appear to be the tests that best relate to this difference. The sand equivalent value is essentially an indicator of the presence of claylike fines and the durability index is an indicator of the tendency of the aggregate to break down and produce more fines. Mitigation It is possible to estimate the sediment reduction for both the marginal- and the good-quality aggregates. The gradation of the subgrade at Lowell was similar to that of a coarse silt site in central Idaho reported by Foltz (11). A road section with a length of 38.1 m and a nearly saturated water content had a sediment production of 9200 kg/ha. The good-quality aggregate in the Lowell study resulted in an estimated sediment reduction of 92 percent, which compares favorably with Burroughs and King s (1) value of 95 percent. The estimated sediment reduction from the marginal-quality aggregate was 31 percent. When Burroughs and King s value is used, this level of reduction corresponds to an application rate of 15 tons/acre of 38- mm (1.5-in.) minus stone. The calculated application rate of 42 tons/acre results in a 2-mm (0.08-in.) lift of aggregate. From a sediment reduction viewpoint, the 152- mm (6-in.) lift was reduced to a 2-mm lift because of the quality of the aggregate. The good-quality aggregate retained its full mitigation potential. Management Implications Figure 3 summarizes the sediment production ratios for both the two seasons of natural rainfall events and the simulated events. Both the low-precipitation year, 1992, and the high-precipitation year, 1993, resulted in differences in sediment production because of the quality of the aggregate. The high-intensity, single simulated storm also showed sediment production differences between the two aggregate qualities. These sediment ratios between approximately 3 and 13 combined with sediment production 1500 to 3200 kg/ha were not trivial. The lowest sediment ratio, 2.9, was under conditions of 147-mm rainfall and 268 truck loads. The highest sediment ratio, 12.9, was under conditions of 521-mm rainfall and 616 truck loads. This would suggest that the quality of the aggregate increased in importance as the traffic and the rainfall increased. The sediment ratios also demonstrated the importance of seasonal road closures during higher precipitation periods. The wetter year resulted in a sediment ratio of 12.9 whereas the drier year resulted in a sediment ratio of 2.9. For wetter climates, such as those of western Oregon and Washington, the results from 1993 would be more appropriate. For drier climates, such as those of eastern Oregon and Washington, the results from 1992 could be used as guidelines. For areas that experience high-intensity summer thunderstorms, such as the inter-mountain West, the simulation results may be more applicable. For agencies using aggregate on roads to reduce sedimentation, the implication of this study is clear. As stated by Burroughs and King (1) and as evidenced by this study, not all aggregates are equally effective in reducing sedimentation. The marginal-quality aggregate in this study at Lowell did not provide the expected mitigation. This marginal-quality aggregate used in this study was below the specification limit for the durability index (31, specification minimum 35) and considerably below the specification limit for the sand equivalent (22, specification minimum 35). This marginal aggregate clearly had lower-quality test values than the high-quality aggregate but does not represent the lowest-quality aggregate that is used as surfacing. For this reason agencies claiming sediment reduction from the use of aggregate need to ensure that the aggregate is of high quality to take full credit for the sediment reduction. If the aggregate is not of high quality, then the sediment reduction estimates need to be reduced.
9 CONCLUSIONS AND RECOMMENDATIONS A 2-year study of sediment production from aggregate- a large difference in surfaced roads with concurrent logging truck traffic demonstrated differences of 2.9 to 12.9 times as much sediment from the lower-quality aggregate. Two aggregate specification tests, the sand equivalent and durability index, were believed to be most indicative of the susceptibility to erosion. A comparison of the expected sediment mitigation from these two aggregates revealed that the good-quality aggregate performed as expected, whereas the marginal-quality aggregate failed to achieve the expected sediment reduction. Though these test values indicate performance for these materials, they do not allow predictions of intermediate performance with just two data points. In addition, these tests may not be the best predictors of sediment production especially considering other rock types. In order to better quantify sedimentation production, it would be necessary to evaluate the erosivity of various aggregate types and evaluate other test methods. ACKNOWLEDGMENTS Development Center for its financial and technical support and the loan of a logging truck. The assistance of Willamette National Forest personnel, notably John Capri and Larry Tennis of the Lowell Ranger District and Dave Katagiri and Steve Bigby of the Materials Laboratory, and the Rigdon Ranger District for the loan of a dump truck was greatly appreciated. The work of the individuals who collected samples and maintained equipment in the cold and rain of two Oregon winters was commendable. REFERENCES 1. Burroughs, E. R., Jr., and J. G. King. Reduction of Soil Erosion on Forest Roads. General Technical Report The authors would like to acknowledge the assistance of the USDA Forest Service San Dimas Technology and INT Intermountain Research Station, USDA Forest Service, Moscow, Idaho, Burroughs, E. R., Jr., F. J. Watts, J. G. King, D. F. Haber, D. Hansen, and G. Flerchinger. Relative Effectiveness of Rocked Roads and Ditches in Reducing Surface Erosion. In Proc., 21st Annual Engineering Geology and Soils Engineering Symposium, University of Idaho, Moscow, Swift, L. W., Jr. Soil Losses from Roadbeds and Cut and Fill Slopes in the Southern Appalachian Mountains. Southern Journal of Applied Forestry, Vol. 8, No. 4, pp Forest Service Specifications for Construction of Roads and Bridges. EM LL. USDA Forest Service, April S. Day, H. L. A Progress Report on Studies of Degrading Basalt Aggregate Bases. Degradation of Aggregates Used in Highway Base Construction. Bulletin 344, Highway Research Board, Washington, D.C., West, T. R., R. B. Johnson, and N. M. Smith. NCHRP Report 98: Tests for Evaluating Degradation of Base Course Aggregates. Highway Research Board, National Research Council, Washington, D.C., VanAtta, R. 0., and H. Ludowise. Microscopic and X- ray Examination of Rock for Durability Testing. Report FHWA-RD FHWA, U.S. Department of Transportation, Krebs, R. D., and R. D. Walker. Highway Materials. McGraw-Hill Book C ompany, New York, Foltz, R. B. Sediment Production Comparison Between the Use of Normal Tire Pressure and Central Tire Pressure on Forest Roads. In Proc., Planning and Implementing Future Forest Operations, College of Forest Resources, University of Washington, Seattle, Holland, M. E. Design and Testing of a Rainfall System. Experiment Station Report CER MEH 21. Colorado State University, Fort Collins, Foltz, R. B. Sediment Processes in Wheel Ruts on Unsurfaced Forest Roads. Ph.D. dissertation. University of Idaho, Moscow, The use of trade or firm names in this paper is for reader information and does not imply endorsement by the U.S. Department of Agriculture of any product or service.
10 This paper was published as: Foltz, R.B.; Trube, M.A Effect of Aggregate Quality on Sediment Production from a Forest Road. Keywords: 1995b Moscow Forestry Sciences Laboratory Rocky Mountain Research Station USDA Forest Service 1221 South Main Street Moscow, ID
Randy B. Foltz and William J. Elliot 1
 Measuring and Modeling Impacts of Tire Pressure on Road Erosion Randy B. Foltz and William J. Elliot 1 Abstract The sediment production from highway tire pressures, constant reduced tire pressures, and
Locally Available Aggregate and Sediment Production
 Transportation Research Record 1819 185 Paper No. LVR8-1050 Locally Available Aggregate and Sediment Production Randy B. Foltz and Mark Truebe Selection of suitable locally available materials to build
CITY OF BEAVER DAM SNOW & ICE REMOVAL POLICY
 CITY OF BEAVER DAM SNOW & ICE REMOVAL POLICY Revised January, 2016 Approved by Operations Committee: February 1, 2016 This snow and ice removal policy guides Public Works personnel with deicing, plowing,
FROST HEAVE. GROUND FREEZING and FROST HEAVE
 FROST HEAVE The temperature of soils near the ground surface reflects the recent air temperatures. Thus, when the air temperature falls below 0 C (32 F) for extended periods, the soil temperature drops
Flood Risk Assessment
 Flood Risk Assessment February 14, 2008 Larry Schick Army Corps of Engineers Seattle District Meteorologist General Assessment As promised, La Nina caused an active winter with above to much above normal
Linking the WEPP Model to Stability Models
 Paper No. 002150. An ASAE Meeting Presentation Linking the WEPP Model to Stability Models by W. J. Elliot S. A. Lewis Project Leader Civil Engineer Soil and Water Engineering, Rocky Mountain Research Station
EFFECTS OF TRAFFIC AND DITCH MAINTENANCE ON FOREST ROAD SEDIMENT PRODUCTION
 EFFECTS OF TRAFFIC AND DITCH MAINTENANCE ON FOREST ROAD SEDIMENT PRODUCTION Charles H. Luce, Research Hydrologist, and Thomas A. Black, Hydrologist, USDA Forest Service, Rocky Mountain Research Station,
TESTING of AGGREGATES for CONCRETE
 TESTING of AGGREGATES for CONCRETE The properties of the aggregates affect both the fresh and hardened properties of concrete. It is crucial to know the properties of the aggregates to be used in the making
Asphalt Mix Designer. Module 2 Physical Properties of Aggregate. Specification Year: July Release 4, July
 Specification Year: July 2005 Release 4, July 2005 2-1 The first step in the development of an HMA mix design is to identify the materials that will be used in the pavement. In Florida the asphalt binder
Soil Formation. Lesson Plan: NRES B2-4
 Soil Formation Lesson Plan: NRES B2-4 1 Anticipated Problems 1. What are five different factors that affect soil formation? 2. What are some different types of parent material that affect soils? 3. What
Construction Exits Rock pads
 Construction Exits Rock pads SEDIMENT CONTROL TECHNIQUE Type 1 System Sheet Flow Sandy Soils Type 2 System Concentrated Flow [1] Clayey Soils Type 3 System Supplementary Trap Dispersive Soils [1] Minor
SECTION AGGREGATE OR GRANULAR SUBBASE
 SECTION 02230 AGGREGATE OR GRANULAR SUBBASE PART 1 GENERAL 1.01 SECTION INCLUDES A. Aggregate or granular subbase as shown on the drawings. 1.02 RELATED SECTIONS A. Section 01400 Quality Requirements.
ARCH 1250 APPLIED ENVIRONMENTAL STUDIES
 John Seitz, RA, LEED AP Assistant Adjunct Professor Professor Paul C. King, RA, AIA, ARA Assistant Professor Geology Geology is the scientific study of the structure and composition of the earth s surface
Clay Robinson, PhD, CPSS, PG copyright 2009
 Engineering: What's soil got to do with it? Clay Robinson, PhD, CPSS, PG crobinson@wtamu.edu, http://www.wtamu.edu/~crobinson, copyright 2009 Merriam-Webster Online Dictionary soil, noun 1 : firm land
Rock & Aggregate Drop Inlet Protection
 Rock & Aggregate Drop Inlet Protection SEDIMENT CONTROL TECHNIQUE Type 1 System Sheet Flow Sandy Soils Type 2 System [1] Concentrated Flow Clayey Soils Type 3 System Supplementary Trap Dispersive Soils
Sediment Capture in Pervious Concrete Pavement tsystems: Effects on Hydrological Performance and Suspended Solids
 Concrete Sustainability Conference April 14 th 2010, Tempe, AZ Sediment Capture in Pervious Concrete Pavement tsystems: Effects on Hydrological l Performance and Suspended Solids Discharge Luis A. Mata,
Recent findings related to measuring and modeling forest road erosion
 18 th World IMACS / MODSIM Congress, Cairns, Australia 13-17 July 2009 http://mssanz.org.au/modsim09 Recent findings related to measuring and modeling forest road erosion W. J. Elliot 1, R. B. Foltz 1
Evaluation of Rutting Depth in Flexible Pavements by Using Finite Element Analysis and Local Empirical Model
 American Journal of Engineering and Applied Sciences, 2012, 5 (2), 163-169 ISSN: 1941-7020 2014 Abed and Al-Azzawi, This open access article is distributed under a Creative Commons Attribution (CC-BY)
Geology 229 Engineering Geology. Lecture 7. Rocks and Concrete as Engineering Material (West, Ch. 6)
") Geology 229 Engineering Geology Lecture 7 Rocks and Concrete as Engineering Material (West, Ch. 6) Outline of this Lecture 1. Rock mass properties Weakness planes control rock mass strength; Rock textures;
Geology 229 Engineering Geology Lecture 7 Rocks and Concrete as Engineering Material (West, Ch. 6) Outline of this Lecture 1. Rock mass properties Weakness planes control rock mass strength; Rock textures;
Correlation of unified and AASHTO soil classification systems for soils classification
 Journal of Earth Sciences and Geotechnical Engineering, vol. 8, no. 1, 2018, 39-50 ISSN: 1792-9040 (print version), 1792-9660 (online) Scienpress Ltd, 2018 Correlation of unified and AASHTO classification
Weathering, Erosion and Deposition
 Weathering, Erosion and Deposition Shaping the Earth s Surface Weathering the process of breaking down rocks into smaller fragments Erosion the transport of rock fragments from one location to another
Soil Mechanics. Chapter # 1. Prepared By Mr. Ashok Kumar Lecturer in Civil Engineering Gpes Meham Rohtak INTRODUCTION TO SOIL MECHANICS AND ITS TYPES
 Soil Mechanics Chapter # 1 INTRODUCTION TO SOIL MECHANICS AND ITS TYPES Prepared By Mr. Ashok Kumar Lecturer in Civil Engineering Gpes Meham Rohtak Chapter Outlines Introduction to Soil Mechanics, Soil
TECHNICAL NOTE PREDICTION OF PAVEMENT SURFACE SKID RESISTANCE AND THE EFFECT OF SMALLER CHIP SIZE
 TECHNICAL NOTE PREDICTION OF PAVEMENT SURFACE SKID RESISTANCE AND THE EFFECT OF SMALLER CHIP SIZE Authors: Birendra Kumar, MEngSt(Transportation), Bachelor(Civil), GIPENZ Senior Transportation Engineer
Background. Valley fills Sites in the Area. Construction over Mine Spoil Fills
 Construction over Mine Spoil Fills Wayne A. Karem, PhD, PE, PG, D.GE 2014 KSPE Annual Conference Background Strip mining; mountaintop and contour mining Creates huge quantities of mine spoil The mine spoil
This Specification is for the supply of sands, crushed rock and crushed scoria to Melbourne Water work sites.
 Melbourne Water SANDS, CRUSHED ROCK AND CRUSHED SCORIA SPECIFICATION 21.A.038 1 GENERAL This Specification is for the supply of sands, crushed rock and crushed scoria to Melbourne Water work sites. 2 SOURCES
The following information is provided for your use in describing climate and water supply conditions in the West as of April 1, 2003.
 Natural Resources Conservation Service National Water and Climate Center 101 SW Main Street, Suite 1600 Portland, OR 97204-3224 Date: April 8, 2003 Subject: April 1, 2003 Western Snowpack Conditions and
Stone Outlet Sediment Trap
 3.12 Sediment Control Description: A stone outlet sediment trap is a small detention area formed by placing a stone embankment with an integral stone filter outlet across a drainage swale for the purpose
Mechanistic Investigation of Granular Base and Subbase Materials A Saskatchewan Case Study
 Mechanistic Investigation of Granular Base and Subbase Materials A Saskatchewan Case Study Curtis Berthelot, P. Eng. Department of Civil and Geological Engineering University of Saskatchewan 57 Campus
Geotechnical Engineering I CE 341
 Geotechnical Engineering I CE 341 What do we learn in this course? Introduction to Geotechnical Engineering (1) Formation, Soil Composition, Type and Identification of Soils (2) Soil Structure and Fabric
Large-Scale Sediment Retention Device Testing (ASTM D 7351) SedCatch Sediment Basket Inlet Filter Exposed to 6% Sediment Load
 SedCatch Sediment Basket Inlet Filter Exposed to 6% Sediment Load") Large-Scale Sediment Retention Device Testing (ASTM D 7351) of SedCatch Sediment Basket Inlet Filter Exposed to 6% Sediment Load February 2010 Submitted to: SedCatch Environmental Products 8380 Point O
Large-Scale Sediment Retention Device Testing (ASTM D 7351) of SedCatch Sediment Basket Inlet Filter Exposed to 6% Sediment Load February 2010 Submitted to: SedCatch Environmental Products 8380 Point O
Accelerated Loading Evaluation of Base & Sub-base Layers
 Accelerated Loading Evaluation of Base & Sub-base Layers Zhong Wu, Ph.D., P.E. Louisiana Transportation Research Center (LTRC) April 2006 What is Accelerated Loading? Accelerated loading refers to Accelerated
B805 TEMPORARY EROSION AND SEDIMENT CONTROL MEASURES - OPSS 805
 B805 MEASURES - OPSS 805 805.1 GENERAL Construction activities frequently remove protective cover and expose soil to accelerated rates of erosion. Sediments generated thereby can be conveyed via runoff
Construction Exits Vibration grids
 Construction Exits Vibration grids SEDIMENT CONTROL TECHNIQUE Type 1 System Sheet Flow Sandy Soils Type 2 System Concentrated Flow Clayey Soils [1] Type 3 System Supplementary Trap Dispersive Soils [1]
3. The map below shows an eastern portion of North America. Points A and B represent locations on the eastern shoreline.
 1. Most tornadoes in the Northern Hemisphere are best described as violently rotating columns of air surrounded by A) clockwise surface winds moving toward the columns B) clockwise surface winds moving
Coefficient of Thermal Expansion of Concrete Pavements
 Coefficient of Thermal Expansion of Concrete Pavements Erwin Kohler Ramon Alvarado David Jones University of California Pavement Research Center TRB Annual Meeting, Washington D.C. January 24 th, 2007
Chapter 2. The Ideal Aggregate. Aggregates
 Chapter 2 Aggregates The Ideal Aggregate Strong and resists loads applied Chemically inert so it is not broken down by reactions with substances it comes in contact with Has a stable volume so that it
FROST Frost Protection of Roads and Railways
 ISSN 1893-1170 (online utgave) ISSN 1893-1057 (trykt utgave) www.mineralproduksjon.no Note FROST Frost Protection of Roads and Railways Elena Kuznetsova 1,*, Inge Hoff 1, Svein Willy Danielsen 2 1 Norwegian
GeoShanghai 2010 International Conference Paving Materials and Pavement Analysis
 Particle Shape, Type and Amount of Fines, and Moisture Affecting Resilient Modulus Behavior of Unbound Aggregates Debakanta Mishra 1, Erol Tutumluer 2, M. ASCE, Yuanjie Xiao 3 1 Graduate Research Assistant,
SOIL AND AGGREGATE FUNDAMENTALS STUDENT GUIDE AMRC April, 2006 AREA MANAGER ROADS CERTIFICATION PROGRAM FOR EDUCATIONAL PURPOSES ONLY
 AREA MANAGER ROADS CERTIFICATION PROGRAM AMRC 2011 SOIL AND AGGREGATE FUNDAMENTALS STUDENT GUIDE FOR EDUCATIONAL PURPOSES ONLY April, 2006 WPC #28013 07/09 2009 by British Columbia Institute of Technology
Climate changes in Norway: Factors affecting pavement performance
 Climate changes in Norway: Factors affecting pavement performance P. O. Aursand, Norwegian Public Roads Administration (NPRA), Norway R. Evensen, ViaNova Plan and traffic, Norway B. O. Lerfald, Veidekke
Large-Scale Sediment Retention Device Testing (ASTM D 7351) SedCatch Sediment Basket Inlet Filter Exposed to 1.5% Sediment Load
 SedCatch Sediment Basket Inlet Filter Exposed to 1.5% Sediment Load") Large-Scale Sediment Retention Device Testing (ASTM D 7351) of SedCatch Sediment Basket Inlet Filter Exposed to 1.5% Sediment Load February 2010 Submitted to: SedCatch Environmental Products 8380 Point
Large-Scale Sediment Retention Device Testing (ASTM D 7351) of SedCatch Sediment Basket Inlet Filter Exposed to 1.5% Sediment Load February 2010 Submitted to: SedCatch Environmental Products 8380 Point
GOING WITH THE FLOW (1 Hour)
") GOING WITH THE FLOW (1 Hour) Addresses NGSS Level of Difficulty: 3 Grade Range: 3-5 OVERVIEW In this activity, students use a stream table to model the processes of erosion and streambed formation. The
GOING WITH THE FLOW (1 Hour) Addresses NGSS Level of Difficulty: 3 Grade Range: 3-5 OVERVIEW In this activity, students use a stream table to model the processes of erosion and streambed formation. The
Deicing (Winter Operations) on Porous and Permeable Pavements. Laura Fay October 27, 2016
 on Porous and Permeable Pavements. Laura Fay October 27, 2016") Deicing (Winter Operations) on Porous and Permeable Pavements Laura Fay October 27, 2016 Permeable pavements Porous and permeable pavement (PPP) Pavement surfaces with porous, permeable or high macrotexture
Deicing (Winter Operations) on Porous and Permeable Pavements Laura Fay October 27, 2016 Permeable pavements Porous and permeable pavement (PPP) Pavement surfaces with porous, permeable or high macrotexture
Aggregates. AAPA training
 Aggregates AAPA training Topics Aggregate sources and rock types Aggregate Production Aggregate Properties Coarse and fine aggregates in Asphalt Mixes Aggregates in Sprayed Seals Filler in asphalt mixes
Weather and Climate Summary and Forecast February 2018 Report
 Weather and Climate Summary and Forecast February 2018 Report Gregory V. Jones Linfield College February 5, 2018 Summary: For the majority of the month of January the persistent ridge of high pressure
5. Which surface soil type has the slowest permeability rate and is most likely to produce flooding? A) pebbles B) sand C) silt D) clay A) B) C) D)
 pebbles B) sand C) silt D) clay A) B) C) D)") 1. During a heavy rainstorm, soil samples A and B both became saturated with water. However, 10 minutes after the storm ended, the soils appeared as shown below. Which statement best explains the observed
1. During a heavy rainstorm, soil samples A and B both became saturated with water. However, 10 minutes after the storm ended, the soils appeared as shown below. Which statement best explains the observed
GEOSYNTHETICS ENGINEERING: IN THEORY AND PRACTICE
 GEOSYNTHETICS ENGINEERING: IN THEORY AND PRACTICE Prof. J. N. Mandal Department of civil engineering, IIT Bombay, Powai, Mumbai 400076, India. Tel.022-25767328 email: cejnm@civil.iitb.ac.in Module-5 LECTURE-
The Use of Expanded Shale, Clay and Slate Lightweight Aggregates in Granular Geotechnical Fills
 Information Sheet 6660.0 January 2017 The Use of Expanded Shale, Clay and Slate Lightweight Aggregates in Granular Geotechnical Fills For over 50 years Rotary Kiln produced Expanded Shale, Clay & Slate
MAINTENANCE AND REHABILITATION OF LOW COST SURFACE DRESSING FOR LOW VOLUME ROADS EXPERIMENTAL ROAD SITES
 1 MAINTENANCE AND REHABILITATION OF LOW COST SURFACE DRESSING FOR LOW VOLUME ROADS EXPERIMENTAL ROAD SITES Pétur Pétursson, Icelandic Building Research Institute Reykjavik, Iceland e-mail: petur.p@rabygg.is
ROAD DUST SUPPRESSSANTS RESEARCH RESULTS
 ROAD DUST SUPPRESSSANTS RESEARCH RESULTS Thomas G. Sanders 1 and Jonathan Q. Addo 2 1 Department of Civil and Environmental Engineering, Colorado State University, Fort Collins, CO 80525. 2 Project Engineer,
Introduction to Soil Mechanics Geotechnical Engineering-II
 Introduction to Soil Mechanics Geotechnical Engineering-II ground SIVA Dr. Attaullah Shah 1 Soil Formation Soil derives from Latin word Solum having same meanings as our modern world. From Geologist point
INTRODUCTION TO PAVEMENT STRUCTURES
 INTRODUCTION TO PAVEMENT STRUCTURES A pavement is a structure composed of structural elements, whose function is to protect the natural subgrade and to carry the traffic safety and economically. As a wheel
Which map shows the stream drainage pattern that most likely formed on the surface of this volcano? A) B)
 B)") 1. When snow cover on the land melts, the water will most likely become surface runoff if the land surface is A) frozen B) porous C) grass covered D) unconsolidated gravel Base your answers to questions
1. When snow cover on the land melts, the water will most likely become surface runoff if the land surface is A) frozen B) porous C) grass covered D) unconsolidated gravel Base your answers to questions
Evaluating Structural Performance of Base/Subbase Materials at the Louisiana Accelerated Pavement Research Facility
 Evaluating Structural Performance of Base/Subbase Materials at the Louisiana Accelerated Pavement Research Facility Zhong Wu, Ph.D., P.E. Zhongjie Zhang, Bill King Louay Mohammad Outline Background Objectives
6. Circle the correct answer: SINK A drains faster or SINK B drains faster Why?
 NAME date ROY G BIV Water Cycle and Water Movement in the Ground Test 5. 6. Circle the correct answer: SINK A drains faster or SINK B drains faster Why? 7. Circle the correct answer: SINK A retains more
27. Running Water I (p ; )
") 27. Running Water I (p. 424-436; 440-444) Hydrosphere How much of the Earth s surface is covered by water? Earth's water is collectively called the and is stored in a number of so-called as follows: 1.
27. Running Water I (p. 424-436; 440-444) Hydrosphere How much of the Earth s surface is covered by water? Earth's water is collectively called the and is stored in a number of so-called as follows: 1.
Monitoring of Moisture Fluctuations in a Roadway over an Expansive Clay Subgrade
 Monitoring of Moisture Fluctuations in a Roadway over an Expansive Clay Subgrade Christian P. Armstrong, M.S., S.M.ASCE 1 and Jorge G. Zornberg, Ph.D., P.E., F.ASCE 2 1 Ph.D. Candidate, Department of Civil
APPENDIX G APPENDIX G SEDIMENT CONTAINMENT SYSTEM DESIGN RATIONALE
 APPENDIX G SEDIMENT CONTAINMENT SYSTEM DESIGN RATIONALE March 18, 2003 This page left blank intentionally. March 18, 2003 G-2 FIGURES Page # Figure G.1 Estimated Runoff from Precipitation Over Different
Why Geomorphology for Fish Passage
 Channel Morphology - Stream Crossing Interactions An Overview Michael Love Michael Love & Associates mlove@h2odesigns.com (707) 476-8938 Why Geomorphology for Fish Passage 1. Understand the Scale of the
Soil and Water Conservation Engineering Prof. Rajendra Singh Department of Agricultural and Food Engineering Indian Institute of Technology, Kharagpur
 Soil and Water Conservation Engineering Prof. Rajendra Singh Department of Agricultural and Food Engineering Indian Institute of Technology, Kharagpur Lecture 04 Soil Erosion - Mechanics Hello friends
CHAPTER 7 GEOLOGY AND SOILS
 CHAPTER 7 GEOLOGY AND SOILS 7.1 General Geology of the Area Based on the Geological map compiled by Cornec (2002) the area consists of Miocene/Pleistocene deposits as seen in figure 7.1. These are geologically
SIEVE ANALYSIS OF AGGREGATE (Kansas Test Method KT-2)
") 5.9.02 SIEVE ANALYSIS OF AGGREGATE (Kansas Test Method KT-2) 1. SCOPE This method of test covers procedures for the determination of the particle size distribution of aggregates using standard sieves.
5.9.02 SIEVE ANALYSIS OF AGGREGATE (Kansas Test Method KT-2) 1. SCOPE This method of test covers procedures for the determination of the particle size distribution of aggregates using standard sieves.
Preliminary Runoff Outlook February 2018
 Preliminary Runoff Outlook February 2018 Prepared by: Flow Forecasting & Operations Planning Water Security Agency General Overview The Water Security Agency (WSA) is preparing for 2018 spring runoff including
UGRC 144 Science and Technology in Our Lives/Geohazards
 UGRC 144 Science and Technology in Our Lives/Geohazards Flood and Flood Hazards Dr. Patrick Asamoah Sakyi Department of Earth Science, UG, Legon College of Education School of Continuing and Distance Education
Technical Memorandum. City of Salem, Stormwater Management Design Standards. Project No:
 Technical Memorandum 6500 SW Macadam Avenue, Suite 200 Portland, Oregon, 97239 Tel: 503-244-7005 Fax: 503-244-9095 Prepared for: Project Title: City of Salem, Oregon City of Salem, Stormwater Management
Black Gore Creek 2013 Sediment Source Monitoring and TMDL Sediment Budget
 Black Gore Creek 2013 Sediment Source Monitoring and TMDL Sediment Budget Prepared for: Prepared By: - I. Introduction The Black Gore Creek Total Maximum Daily Load (TMDL) was developed in collaboration
Weathering, Erosion, Deposition, and Landscape Development
 Weathering, Erosion, Deposition, and Landscape Development I. Weathering - the breakdown of rocks into smaller particles, also called sediments, by natural processes. Weathering is further divided into
Tikrit University College of Engineering Civil engineering Department
 Tikrit University SOIL CLASSIFICATION College of Engineering Civil engineering Department Soil Mechanics 3 rd Class Lecture notes Up Copyrights 2016 Classification of soil is the separation of soil into
How Can DOT Operations and Maintenance Prepare for Extreme Weather Events?
 How Can DOT Operations and Maintenance Prepare for Extreme Weather Events? Gregory C. Johnson, P.E. Chief Operations Officer Michigan Department of Transportation November 17, 2012 Michigan s Climate Four
B-1. Attachment B-1. Evaluation of AdH Model Simplifications in Conowingo Reservoir Sediment Transport Modeling
 Attachment B-1 Evaluation of AdH Model Simplifications in Conowingo Reservoir Sediment Transport Modeling 1 October 2012 Lower Susquehanna River Watershed Assessment Evaluation of AdH Model Simplifications
Colluvial debris: Rocks that have fallen down hills. Types of Parent Material
 Weathered Rocks from the lithosphere are the parent materials for soils Nature of the parent material will greatly influence time it takes to make soil and the nature of the soil that is formed Types of
[1] Performance of the sediment trap depends on the type of outlet structure and the settling pond surface area.
![[1] Performance of the sediment trap depends on the type of outlet structure and the settling pond surface area.](/thumbs/76/74245181.jpg "[1] Performance of the sediment trap depends on the type of outlet structure and the settling pond surface area.") Sediment Trench SEDIMENT CONTROL TECHNIQUE Type 1 System Sheet Flow Sandy Soils Type 2 System [1] Concentrated Flow Clayey Soils Type 3 System [1] Supplementary Trap Dispersive Soils [1] Performance of
Sediment Trench SEDIMENT CONTROL TECHNIQUE Type 1 System Sheet Flow Sandy Soils Type 2 System [1] Concentrated Flow Clayey Soils Type 3 System [1] Supplementary Trap Dispersive Soils [1] Performance of
Wikipedia.org BUILDING STONES. Chapter 4. Materials of Construction-Building Stones 1
 Wikipedia.org BUILDING STONES Chapter 4 Materials of Construction-Building Stones 1 What is Stone? Stone is a concretion of mineral matter. Used either as a; Construction material, Manufacture of other
NOTES ON SUBBASE AGGREGATE SPECIFICATION TNZ M/3. These notes must not be included in the Contract Documents.
 TNZ M/3 Notes : 1986 NOTES ON SUBBASE AGGREGATE SPECIFICATION TNZ M/3 These notes must not be included in the Contract Documents. 1. INTRODUCTION There is no standard TNZ M/3 Specification for subbase
SILT FENCE EFFECTIVENESS
 SILT FENCE EFFECTIVENESS Michelle G. Holloway, Department of Earth Sciences, University of South Alabama, Mobile, AL 36688. E-mail: MLG@jaguar1.usouthal.edu. Sediment is the number one pollutant in Dog
Evaluating Structural Performance of Base/Subbase Materials at the Louisiana Accelerated Pavement Research Facility
 Evaluating Structural Performance of Base/Subbase Materials at the Louisiana Accelerated Pavement Research Facility Zhong Wu, Ph.D., P.E. Louisiana Transportation Research Center 2007 Transportation Engineering
Mass Wasting. Requirements for Mass Wasting. Slope Stability. Geol 104: mass wasting
 Mass Wasting Movement of earth materials downslope, driven by Gravitational Forces. Landslides - general term for rock or soil movement. In U.S., on average, mass wasting causes 1 to 2 billion dollars
Impact : Changes to Existing Topography (Less than Significant)
") 4.2 Land Resources 4.2.1 Alternative A Proposed Action Impact 4.2.1-1: Changes to Existing Topography (Less than Significant) Development of the project site would involve grading and other earthwork as
4.2 Land Resources 4.2.1 Alternative A Proposed Action Impact 4.2.1-1: Changes to Existing Topography (Less than Significant) Development of the project site would involve grading and other earthwork as
Impact of Existing Pavement on Jointed Plain Concrete Overlay Design and Performance
 Impact of Existing Pavement on Jointed Plain Concrete Overlay Design and Performance Michael I. Darter, Jag Mallela, and Leslie Titus-Glover 1 ABSTRACT Concrete overlays are increasingly being constructed
Weather and Climate Summary and Forecast March 2018 Report
 Weather and Climate Summary and Forecast March 2018 Report Gregory V. Jones Linfield College March 7, 2018 Summary: The ridge pattern that brought drier and warmer conditions from December through most
Soil Surveys. What are the most important properties to consider in a taxonomic system used for making a soil survey?
 Soil Surveys What are the most important properties to consider in a taxonomic system used for making a soil survey? What is a Soil Survey? Inventory of soil resources Delineation of spatial distribution
Chapter 11 10/30/2013. Mass Wasting. Introduction. Factors That Influence Mass Wasting. Introduction. Factors That Influence Mass Wasting
 Introduction Chapter 11 Mass wasting - The downslope movement of material resulting from the force of gravity. Mass Wasting Mass wasting results when the force of gravity acting on a slope exceeds the
Soil. Soil in Our Environment
 Soil Soil in Our Environment What is soil? Or is it Dirt? Gold s father is dirt, yet it regards itself as noble. Yiddish Proverb Is it alive? Is it fragile? Formations of Soils How much time does it take
Effect of Environmental Factors on Free-Flow Speed
 Effect of Environmental Factors on Free-Flow Speed MICHAEL KYTE ZAHER KHATIB University of Idaho, USA PATRICK SHANNON Boise State University, USA FRED KITCHENER Meyer Mohaddes Associates, USA ABSTRACT
Laboratory Exercise #4 Geologic Surface Processes in Dry Lands
 Page - 1 Laboratory Exercise #4 Geologic Surface Processes in Dry Lands Section A Overview of Lands with Dry Climates The definition of a dry climate is tied to an understanding of the hydrologic cycle
January 25, Summary
 January 25, 2013 Summary Precipitation since the December 17, 2012, Drought Update has been slightly below average in parts of central and northern Illinois and above average in southern Illinois. Soil
EVALUATION OF VACUUM DRYING FOR DETERMINATION OF BULK SPECIFIC GRAVITY OF HMA SAMPLES
 Cross and Pokhrel 1 EVALUATION OF VACUUM DRYING FOR DETERMINATION OF BULK SPECIFIC GRAVITY OF HMA SAMPLES 6784 Equivalent Words by: Stephen A. Cross, Ph.D., P.E. Professor School of Civil and Environmental
Instream Sediment Control Systems
 Instream Sediment Control Systems INSTREAM PRACTICES Photo 1 Photo 2 Modular sediment The information contained within this series of fact sheets deals only with the design of temporary instream sediment
Testing of Hungarian aggregates for railway ballast according to MSZ EN 13450: 2003
 Central European Geology, Vol. 50/4, pp. 353 361 (2007) DOI: 10.1556/CEuGeol.50.2007.4.5 Testing of Hungarian aggregates for railway ballast according to MSZ EN 13450: 2003 Miklós Gálos, László Kárpáti
2 Aggregates in Indiana
 2 Aggregates in Indiana Origin of Aggregates Gravel and Natural Sands Crushed Stone Slag Distribution of Aggregates Glacial Deposits Bedrock Deposits Aggregate Types Natural Aggregates Artificial Aggregates
Verification of Pervious Concrete Drainage Characteristics using Instrumentation
 Verification of Pervious Concrete Drainage Characteristics using Instrumentation Vimy Henderson, Ph.D., Golder Associates Ltd. Susan L. Tighe, Ph.D., P.Eng., University of Waterloo Paper prepared for presentation
For Sale - 56 Acre Sandstone Quarry State Route 511, Oberlin/Kipton, OH 44075
 14647 State Route 511, Oberlin/Kipton, OH 44075 56 ACRES Vermilion Rd Gifford Rd Haigh Rd 44 Summary The Kipton sandstone quarry is included in 56 acre tract owned by Terry A. Johnson, of Huron, Ohio.
U-Shaped Sediment Traps
 U-Shaped Sediment Traps SEDIMENT CONTROL TECHNIQUE Type 1 System Sheet Flow Sandy Soils Type 2 System Concentrated Flow Clayey Soils [1] Type 3 System Supplementary Trap Dispersive Soils [1] Generally
Topic 6: Weathering, Erosion and Erosional-Deposition Systems (workbook p ) Workbook Chapter 4, 5 WEATHERING
 Workbook Chapter 4, 5 WEATHERING") Topic 6: Weathering, Erosion and Erosional-Deposition Systems (workbook p. 95-125) Workbook Chapter 4, 5 THE BIG PICTURE: Weathering, erosion and deposition are processes that cause changes to rock material
Topic 6: Weathering, Erosion and Erosional-Deposition Systems (workbook p. 95-125) Workbook Chapter 4, 5 THE BIG PICTURE: Weathering, erosion and deposition are processes that cause changes to rock material
C) D) 3. Which graph best represents the relationship between soil particle size and the rate at which water infiltrates permeable soil?
 D) 3. Which graph best represents the relationship between soil particle size and the rate at which water infiltrates permeable soil?") 1. Which earth material covering the surface of a landfill would permit the least amount of rainwater to infiltrate the surface? A) silt B) clay C) sand D) pebbles 2. Which graph best represents the relationship
1. Which earth material covering the surface of a landfill would permit the least amount of rainwater to infiltrate the surface? A) silt B) clay C) sand D) pebbles 2. Which graph best represents the relationship
HYDROCOMPACTION CONSIDERATIONS IN SINKHOLE INVESTIGATIONS
 HYDROCOMPACTION CONSIDERATIONS IN SINKHOLE INVESTIGATIONS Edward D. Zisman Cardno ATC, 5602 Thompson Center Court, Suite 405, Tampa, Florida 33634 Stephen West BTL Engineering Services, Inc., 5802 North
Rock Sizing for Drainage Channels
 Rock Sizing for Drainage Channels STORMWATER MANAGEMENT PRACTICES Photo 1 Rock-lined drainage channel Photo 2 Rock-lined catch drain (during construction phase) 1. Introduction Rock size is primarily dependent
2011 National Seasonal Assessment Workshop for the Eastern, Southern, & Southwest Geographic Areas
 2011 National Seasonal Assessment Workshop for the Eastern, Southern, & Southwest Geographic Areas On January 11-13, 2011, wildland fire, weather, and climate met virtually for the ninth annual National
How & Where does infiltration work? Summary of Geologic History Constraints/benefits for different geologic units
 June 26, 2007: Low Impact Development 1 Associated Earth Sciences, Inc. Associated Earth Sciences, Inc. Presented by: Matthew A. Miller, PE April 24, 2012 How & Where does infiltration work? Summary of
Mass Wasting. Revisit: Erosion, Transportation, and Deposition
 Mass Wasting Revisit: Erosion, Transportation, and Deposition While landslides are a normal part of erosion and surface processes, they can be very destructive to life and property! - Mass wasting: downslope