Petrophysical Evaluation of Otebe Field, Onshore Niger Delta, Nigeria
|
|
|
- Elfreda Lynch
- 5 years ago
- Views:
Transcription
1 Petrophysical Evaluation of Otebe Field, Onshore Niger Delta, Nigeria Anthony Odama OGIDI 1, Ogie Macaulay EKHALIALU 2 & Emmanuel Etim OKON 3 1 Schlumberger Company, Port-Harcourt, Nigeria. 2&3 Department of Geology, University of Calabar, Calabar, Nigeria. Abstract The Niger Delta is a prolific oil province within the West African subcontinent. Exploration activities have been concentrated in the onshore part of this basin but as the delta becomes better understood exploration influences are gradually being shifted to the offshore. The evaluation of petrophysical characteristics of reservoir sands in OTEBE field was carried out using geophysical wireline logs. The main petrophysical parameters evaluated were porosity, permeability, hydrocarbon saturation and water saturation. The Wireline logs employed in this work include Gamma Ray, Compensated Bulk density (CDL), Compensated Neutron log and Resistivity logs. A total of five wells were assessed and four reservoir units have been identified. The reservoir sands exhibit porosity values ranging between 20% and 30% while the estimated permeability values lie between 30md-178md. The porosity and permeability values may be considered to be moderate to good. The reservoir sands which have thickness of 70m-200m within the field show hydrocarbon saturation values between 90%- 99%. Different sub-environments (facies) were recognized based on GR-log shape. The environments include distributary channel, point bar, mouth bar and tidal channel. The overall depositional environment has been interpreted to be most likely a transitional zone that lies between the lower deltaic plain and inner deltaic front of the Niger Delta. Keywords Otebe Field, Niger Delta, Petrophysical evaluation, Reservoir, Porosity, Permeability, Hydrocarbon saturation, Water saturation. P I. INTRODUCTION etrophysical characteristics of reservoir rocks include porosity, permeability, water saturation, hydrocarbon saturation, formation water resistivity and formation factors. These properties are determined by grain size, grain shape, and degree of compaction, amount of matrix, cement composition, type of fluid present and saturation of different fluids. Among these properties porosity, permeability and fluid saturation are the most important and can be measured using standard procedures. For scientific and economic purposes, laboratory data of high accuracy and reliability for both the fluids and the rocks that contain them are extremely useful in formation evaluation. However such data cannot be acquired very quickly, hence the operators in the field need a method of acquiring the fundamental properties of the rocks and their fluid contents for a quick management decision making. This requirement is easily satisfied by the use of geophysical wireline logs. Recent reservoir evaluation involves the study of well cuttings, cores, well log data, formation micro scanner (fms) images and drill stem tests. The wireline log is basically used for this work in integration with seismic sections and core photos. The well logs used include Gamma Ray, Density, Neutron, Sonic and Resistivity logs. The main petrophysical parameters evaluated in this work are porosity, permeability, water and hydrocarbon saturation as well as sand/shale percentages of these reservoirs. A. Study objectives The objectives of the study include: To demonstrate the use of Wireline logs for the interpretation of geological phenomena. To correlate and determine reservoirs lateral extent. To estimate and compare porosity, permeability and hydrocarbon distribution within the field. Location of reservoirs vertically within the drilled section. Determination of depositional environment. B. Location of the study field The study field is known as OTEBE FIELD and it is located in OML-XYZ belonging to the Shell Petroleum Development Company of Nigeria (SPDC) in the coastal swamp of the Niger Delta in Nigeria. The Field is a large collapsed crest rollover anticline trending east-west and bounded to the north by a major bounding fault (fig.2). Fig.1: Base map of OTEBE Field showing well locations Page 30

2 Fig.2. Seismic section of OTEBE Field showing the faulting patterns C. Stratigraphy of the Niger Delta Different studies have been carried out on the Niger delta (Hospers, 1965; Short and Stauble, 1967; Burke et al, 1972; Whiteman, 1982; Doust and Omatsola, 1990; Kaplan, 1994; Petters, 1995; Klett, 1997; Ukpong and Ekhalialu, 2017; 2018; Ukpong et al. 2017a; 2017b; 2018). The Niger Delta Basin is a prolific hydrocarbon provinces that contains enormous hydrocarbon both on the onshore, shallow and deep offshore areas and it is located between Latitudes 3 and 6 N and Longitudes 5 and 8 E respectively in the Gulf of Guinea, on the margin of West Africa. The Cenozoic Niger Delta is situated at the intersection of the Benue trough and South Atlantic Ocean where a triple junction developed during separation of South America from Africa (Burke et al., 1972; Whiteman, 1982). It extends throughout the Niger Delta Province as defined by Klett and others (1997). It is made of 12 km thick Niger Delta clastic wedge spans a 75, 000 km 2 area in southern Nigeria and the Gulf of Guinea offshore Nigeria. Evamy et al. (1978), Short and Stauble (1967) and Whiteman (1982) divided the deposits of the Niger delta into three large-scale lithostratigraphic units (fig. 3): 1) the pro-delta facies of the Akata Formation (basal Paleocene to Recent ) 2) paralic facies of the Agbada Formation (Eocene to Recent) and 3) fluvial facies of the Benin Formation (Oligocene- Recent). Doust and Omatsola (1990) reported that from the Eocene to the present, the delta has prograded southwestward, forming depobelts that represent the most active portion of the delta at each stage of its development. Kulke (1995) noted that the depobelts form one of the largest regressive deltas in the world with an area of some 300,000 km 2 and a sediment volume of 500,000 km3 (Hospers, 1965), and a sediment thickness of over 10 km in the basin depocenter (Kaplan et al. 1994). Page 31
, Short and Stauble (1967), Weber(1971) Weber and Daukoru(1975), Omatsola(1982),Evamy et al(1978), Whiteman(1982), Selly(1997) etc.")

3 The regional sedimentology, stratigraphy, structural configuration and paleoenvironmental analysis of the Niger Delta have been documented in considerable detail by Reyment(1965), Frank and Cordy (1967), Short and Stauble (1967), Weber(1971) Weber and Daukoru(1975), Omatsola(1982),Evamy et al(1978), Whiteman(1982), Selly(1997) etc. All of these studies indicate that the region is favourable for the formation of good reservoir sands for hydrocarbon accumulation. the fault within the down-thrown block (Weber and Daukoru, 1975). The grain size of the reservoir sandstone is highly variable with fluvial sandstones tending to be coarser than their delta front counterparts; point bars fine upward, and barrier bars tend to have the best grain sorting. Much of this sandstone is nearly unconsolidated, some with a minor component of argillo-silicic cement (Kulke, 1995). Porosity only slowly decreases with depth because of the young age of the sediment and the coolness of the delta complex (see geothermal gradient data below). In the outer portion of the delta complex, deep-sea channel sands, low-stand sand bodies, and proximal turbidites create potential reservoirs (Beka and Oti, 1995). Burke (1972) describes three deepwater fans that have likely been active through much of the delta s history. The fans are smaller than those associated with other large deltas because much of the sand of the Niger-Benue system is deposited on top of the delta, and buried along with the proximal parts of the fans as the position of the successive depobelts moves seaward (Burke, 1972). The distribution, thickness, shalliness, and porosity/permeability characteristics of these fans are poorly understood (Kulke, 1995). Tectono-stratigraphy computer experiments show that local fault movement along the slope edge controls thickness and lithofacies of potential reservoir sands downdip (Smith- Rouch and others, 1996). The slope-edge fault simulation from these experiments is shown in fig. 4. (Smith-Rouch, 1998) states that "by extrapolating the results to other areas along the shelf margin, new potential reservoirs are identified. Fig. 3: Stratigraphic column showing the Three Formations of the Niger Delta (Modified from Shannon and Naylor, 1989) D. Reservoir of the Niger delta Petroleum in the Niger Delta is produced from sandstone and unconsolidated sands predominantly in the Agbada Formation. Characteristics of the reservoirs in the Agbada Formation are controlled by depositional environment and by depth of burial. Known reservoir rocks are Eocene to Pliocene in age, and are often stacked, ranging in thickness from less than 15 meters to 10% having greater than 45 meters thickness (Evamy and others, 1978). The thicker reservoirs likely represent composite bodies of stacked channels (Doust and Omatsola, 1990). Based on reservoir geometry and quality, Kulke (1995) describes the most important reservoir types as point bars of distributary channels and coastal barrier bars intermittently cut by sandfilled channels. Edwards and Santogrossi (1990) describe the primary Niger Delta reservoirs as Miocene parallic sandstones with 40% porosity, 2 Darcy s permeability, and a thickness of 100 meters. The lateral variation in reservoir thickness is strongly controlled by growth faults; the reservoir thickens towards Fig. 4: Slope edge normal fault simulation (2ma- present) for the Niger Delta. Bright intervals are sands. (Adapted from Smith-Rouch, 1998) E. Traps and seals Most known traps in Niger Delta fields are structural although stratigraphic traps are not uncommon (fig. 5). The Page 32
 to the south (later formed depobelts) in response to increasing instability of the under-compacted, over-pressured shale.")
4 structural traps developed during synsedimentary deformation of the Agbada parallic sequence (Evamy and others, 1978; Stacher, 1995). Structural complexity increases from the north (earlier formed depobelts) to the south (later formed depobelts) in response to increasing instability of the under-compacted, over-pressured shale. Doust and Omatsola (1990) describe a variety of structural trapping elements, including those associated with simple rollover structures; clay filled channels, structures with multiple growth faults, structures with antithetic faults, and collapsed crest structures. On the flanks of the delta, stratigraphic traps are likely as important as structural traps (Beka and Oti, 1995). In this region, pockets of sandstone occur between diapiric structures; towards the delta toe (base of distal slope), this alternating sequence of sandstone and shale gradually grades to essentially sandstone. The primary seal rock in the Niger Delta is the interbedded shale within the Agbada Formation. The shale provides three types of seals clay smears along faults, interbedded sealing units against which reservoir sands are juxtaposed due to faulting, and vertical seals (Doust and Omatsola, 1990). On the flanks of the delta, major erosional events of early to middle Miocene age formed canyons that are now clay-filled. These clays form the top seals for some important offshore fields (Doust and Omatsola, 1990). Fig. 5: Examples of Niger Delta oil field structures and associated tap types. Modified from Doust and Omatsola (1990). F. Petroleum generation and migration Evamy and others (1978) set the top of the present-day oil window in the Niger Delta at the 240 F (115 C) isotherm. In the northwestern portion of the delta, the oil window (active source-rock interval) lies in the upper Akata Formation and the lower Agbada Formation as shown in (Fig. 6). To the southeast, the top of the oil window is stratigraphically lower (up to 4000 below the upper Akata/lower Agbada sequence; Evamy and others, 1978). Some researchers (Nwachukwu and Chukwuma, 1986; Doust and Omatsola, 1990; Stacher, 1995) attribute the distribution of the top of the oil window to the thickness and sand/shale ratios of the overburden rock (Benin Fm. and variable proportions of the Agbada Fm.). The sandy continental sediment (Benin Fm.) has the lowest thermal gradient (1.3 to 1/8 C/100 m); the parallic Agbada Formation has an intermediate gradient (2.7 C/100 m); and the marine, over-pressured Akata Formation has the highest (5.5 C/100 m) (Ejedawe and others, 1984). Therefore, within any depobelts, the depth to any temperature is dependent on the gross distribution of sand and shale. If sand/shale ratios were the only variable, the distal offshore subsurface temperatures would be elevated because sand percentages are lower. To the contrary, the depth of the hydrocarbon kitchen is expected to be deeper than in the delta proper, because the depth of oil generation is a combination of factors (temperature, time, and deformation related to tectonic effects) (Beka and Oti, 1995). In the late Eocene, the Akata/Agbada formational boundary in the vicinity of this well entered the oil window at approximately 0.6 R o (Stacher, 1995). Evamy and other (1978) argue that generation and migration processes occurred sequentially in each depobelts and only after the entire belt was structurally deformed, implying that deformation in the Northern Belt would have been completed in the Late Eocene. The Akata/Agbada formational boundary in this region is currently at a depth of about 4,300 m, with the upper Akata Formation in the wet gas/condensation generating zone (vitrinite reflectance value >1.2; Tissot and Welte, 1984). The lowermost part of the Agbada Formation here entered the oil window sometime in the Late Oligocene. The Northern Belt s Ajalomi-1 well about 25 km to the south of Oben-1 shows the Akata source rock first entering the oil window in the Oligocene after reservoir rock deposition (Stacher, 1995). Stacher assumes migration overlaps in time with the burial and structure development of overlying reservoir sequences and occurs primarily across and up faults (fig. 4). Migration pathways were short as evidenced from the wax content, API gravity, and the chemistry of oils (Short and Stäuble, 1967; Reed, 1969). Migration from mature, over-pressured shales in the more distal portion of the delta may be similar to that described from over-pressured shales in the Gulf of Mexico. Hunt (1990) relates episodic expulsion of petroleum from abnormally pressured, mature source rocks to fracturing and resealing of the top seal of the over-pressured interval. In rapidly sinking basins, such as the Gulf of Mexico, the fracturing/resealing cycle occurs in intervals of thousands of years. This type cyclic expulsion is certainly plausible in the Niger Delta basin where the Akata Formation is overpressured. Beta and Oti (1995) predict a bias towards lighter hydrocarbons (gas and condensate) from the over-pressured shale as a result of down-slope dilution of organic matter as Page 33
 petroleum system is summarized in the events chart (fig. 7).")


5 well as differentiation associated with expulsion from overpressured sources. In a nut shell, the history of the formation of the Tertiary Niger Delta (Akata-Agbada) petroleum system is summarized in the events chart (fig. 7). Rocks within the petroleum system are from Paleocene to Recent in age. Most of the petroleum is sourced from the Akata Formation, with smaller amounts generated from the mature shale beds in the lower Agbada Formation. Deposition of overburden rock began in the Middle Eocene and continues to the present. Units include the Agbada and Benin Formations to the north with a transition to the Akata Formation in the deep-water portion of the basin where the Agbada and Benin Formations thin and disappear seaward. Petroleum generation within the delta began in the Eocene and continues today. Generation occurred from north to south as progressively younger depobelts entered the oil window. Reservoirs for the discovered petroleum are sandstones throughout the Agbada Formation. Reservoirs for undiscovered petroleum below currently producing intervals and in the distal portions of the delta system may include turbidite sands within the Akata. Trap and seal formation is related to gravity tectonics within the delta. Structural traps have been the most favorable exploration target; however, stratigraphic traps are likely to become more important targets in distal and deeper portions of the delta. Fig.7: Event chart of the Niger Delta (Akata/Agbada) petroleum system. Modified from Avbovbo (1978) A. Materials II. MATERIALS AND METHOD Wireline logs (Gamma Ray, Compensated Bulk Density log, Compensated Neutron porosity log, and Resistivity log from five wells), structural map of top sand, seismic section and base map of the study area were provided by Shell Petroleum Development Company (SPDC) for the study. B. Methods The following methods were applied in the study 1) Gamma Ray log The Gamma Ray log is a measurement of the natural radioactivity of the formations. In sedimentary formations the log normally reflects the shale content of the formations (fig. 8). This is because the radioactive elements tend to concentrate in clays and shales. Clean formations usually have a very low level of radioactivity, unless radioactive contaminant such as volcanic ash or granite wash is present or the formation waters contain dissolved radioactive salts. Fig 6: Subsurface depth to top of Niger Delta oil Kitchen showing where only the AkataFormation in the oil window and where a portion of the lower Agbada is in the oil window. Contours are in feet. Modified from Evamy and others (1978) Fig. 8: Sketch of typical gamma ray logs and techniques for interpretations (Modified from Schlumberger, 1985) Page 34

. Low density interstitial clays will especially result in overestimated porosity.")
, other fluid like oil or gas")
 Fig.")
6 2) Compensated formation bulk density log (cdl) The density log is a continuous record of a formation s bulk density. This is the overall density of a rock including solid matrix and fluid enclosed in the pores. Since the tool has a shallow depth of investigation, the fluid is assumed to be mud filtrate with a density of 1.0 (fresh) or 1.1 (salt) (Rider, 1986).The presence of mixed matrix leads to possible errors in the assumption of matrix density (fig. 9). Low density interstitial clays will especially result in overestimated porosity. 4) Resistivity log (laterolog) Resistivity, which is the inverse of conductivity, is the specific resistance of a material to the flow of current. The resistivity of a formation depends on the electrical conductivity of the rock materials within the formation, the nature of the formation water (fresh or salt), other fluid like oil or gas contained in it. Also the conductivity of water is a function of temperature because the lighter the temperature, the lower the resistivity. Fig.11: Application of Laterolog and Induction with their limitations. Fig. 12: the borehole environments while fig.26: Sketch showing different zones with resistivity logging. Fig.11: Application of Laterolog and Induction with their limitations. (Modified from Dresser Atlas, 1982) Fig. 9: Sketch showing reliability of density log for measurement(adapted from Schlumberger, 1985) 3) Compensated neutron porosity log The neutron log provides a continuous record of a formation reaction to fast neutron bombardment (fig. 10). It is quoted in terms of neutron porosity units, which are related to formation hydrogen index as indication of its richness in hydrogen (Rider, 1986). Fig.10: Neutron logging tool (Adapted from Schlumberger, 1985) Fig. 12: The borehole environment Page 35

7 Fig.13: Sketch showing different zones with resistivity logging (Modified from Schlumberger, 1985) C. Qualitative and quantitative interpretations of wireline logs. Well log interpretation involves choosing the best model from the given data so as to obtain results which are geologically plausible. Well log interpretation is often qualitative and quantitative. The qualitative interpretation has to do with the use of models, which represent the characteristic log responses to formation parameters. The qualitative interpretation involves the following steps namely: Identification of sand units from chosen top sand to the last hydrocarbon bearing sand using Gamma ray log Classification of reservoir sand and their depositional environments from standard log models Identification of gas bearing sands and gas/oil contact from bulk density log in combination with the neutron porosity log. Comparison of fluid characteristics as per resistivity and bulk/neutron logs response in the same reservoir sand in different wells where it occurs. The quantitative interpretation involves the use of mathematical models and relations, which give identical values of the log response to the formation 1) Porosity parameters. The following relations were employed in the estimation of reservoir sand parameters. The porosity values of reservoir of interest were estimated using readings of the compensated Bulk density and compensated Neutron porosity log. Density porosity values were calculated using the equation below. Porosity (Ø) = pma-pb/pma-pf (1) Where pma =2.65 g/cc and pf =1.0 Neutron porosity was read from the log. The effective porosity (Øe) was used in this researrch work and a combination of density and neutron porosity was adopted for accuracy (Dewan, 1983) The porosity was first corrected for shale as follows: Ødc = Ød- Vsh. Ødsh (2) Ønc=Øn- Vsh. Ønsh (3) Where; Ødc= corrected density porosity Ød=density porosity Ødsh=density porosity of a nearby shale Øn =corrected neutron porosity Ønsh=neutron porosity of a nearby shale Øn=neutron porosity Vsh= volumetric fraction of shale Øe= (Ød + Ønc)/2 (4) Where Øe=effective porosity If gas is present, Ønc will be significantly less than Ødc and it will show up a crossover. The percentage by volume of the shale, Vsh was estimated from Gamma ray log method using the formula below Volume of shale % = [GR value (log)- GR(min)]/[GR(max)- GR(min)] (5) GR (max) = 100% shale, GR (min) =0% shale (i.e. clean formation) A modification of the simple linear relationship used above has been proposed as a result of empirical correlation (Dresser Atlas, 1982). The relationship changes between younger unconsolidated rocks and older consolidated rocks For pre-tertiary consolidated rocks Vsh = Vsh-1) (6) For Tertiary Unconsolidated rocks, like those evaluated in this research Page 36
8 Vsh = (2 3.7 Vsh-1) (7) 2) Water/hydrocarbon saturation Water saturation for hydrocarbon and non-hydrocarbon bearing reservoir sands were evaluated using Archie s equation (Archie, 1942) SW n =FRw/RT In log practice, n=2 Therefore water saturation, Sw= (FRw/RT) 1/2 (8) To calculate Sw, the formation factor, F must first be determined According to Archie (1942) Formation Factor, F=a/Ø m (9) This equation is also referred to as Humble formula ( Lynch, 1964). In this research, a simplified version of F (Schlumberger, 1985) for sands was used, that is F=0.62/Ø 2.15 (10) Water resistivity of the formation, Rw was calculated based on the equation Rw=Ro/F (11) Where Ro = water saturated formation resistivity ( i.e. resistivity of the rock when it is brine field) In a reservoir that did not have Ro or where Ro could not be estimated, Rw of a nearby formation ( reservoir above or below that of interest) was adopted since water salinity changes only slowly with depth (Dewan, 1983) In a formation containing oil or gas, the resistivity is called true resistivity; RT. RT is not only a function of F and Rw but also of Sw. For water bearing formation, RT =Ro (i.e. when Sw =1) The fraction of pore volume saturation of hydrocarbon (Sh) was evaluated from the relation Hydrocarbon saturation (oil and gas) Sh= (1-Sw) (12) The Bulk Volume Water (BVW) which shows whether or not a formation is at irreducible water saturation was calculated using BVW=Sw. Ø (13) 3) Permeability The permeability values for the reservoir sands were calculated from a relationship that shows that irreducible water saturation is a function of bulk volume water, porosity and permeability. If the formation bulk volume water values are constant or nearly constant, then it is at irreducible water saturation, but if the values are widely varied, then it is not at irreducible water saturation. Several empirical relationships have been proposed in order to estimate permeability from measurements of porosity and irreducible water saturation, but that documented by Dresser Atlas (1982) was employed in the work to estimate permeability of the different reservoir sands. K (MD) = (0.136Ø 4.4 )/Swi(14) 4) Fraction of formation pore volume filled with hydrocarbon The main aim of logging is to determine the fraction of total formation pore volume filled with hydrocarbon so that the quantity and net hydrocarbon sands can be estimated. Fractional pore volume filled by hydrocarbon, Øh was calculated using the relation Øh = Ø (1-Sw) = ØSh(15) 5) Graphs Three sets of graphs will be plotted. Porosity versus permeability plots (A1-A5) were carried out to study its relationship within the reservoir units. The graphs for permeability versus depth were used to determine how permeability values varies with depth (B1- B5) while porosity versus depth graphs (C1-C5) were plotted to illustrate the lateral and vertical variations within the field under investigation. D. Log shape lithology and sedimentology In recent times, the shapes of Gamma ray logs are becoming, more important as these have been found to be very reliable. It shows greater detail and is much related to the sediment character and environment of deposition. Therefore, as the Gamma ray log is frequently an indicator of clay (shale) content as explanation of Gamma Ray logs shapes can be related to shale content. Shapes on the Gamma ray log can be interpreted as grain size trends and by sedimentological association as cycles. A decrease in gamma ray value will indicate an increase in grain size; small grain size corresponds to higher gamma ray values. The sedimentological implication of this relationship leads to a direct correlation between facies and log shape (fig. 14). A bell shape indicates a fining upward sequence, which may be an alluvial/fluvial channel or else transgressive sand. Page 37

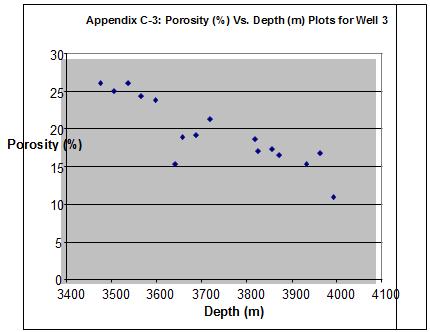
9 Fig 14: General Gamma Ray response to variations in grain size (Modified from Emery, 1996) III. RESULTS AND INTERPRETATION A. Petrophysical and dynamic properties of reservoir sands A reservoir rock is one, which by virtue of its porosity and permeability is capable of containing a reasonable quantity of hydrocarbon if entrapment conditions are right. It is an essential part of the petroleum system. The rock should be able to release the hydrocarbon at a reasonable rate when penetrated by a well. In other words, reservoir sands are rocks containing pore spaces or fractures, interconnected and allowing the circulation and accumulation of fluid within them. 1) Porosity Porosity is the percentage of the total volume of the rock that has pore spaces, whether the pores are connected or not. Porosity conventionally denoted by the Greek word phi (Ø) is given by the equation; Ø = Bulk volume Grain Volume x 100 (16) Bulk volume = Pore volume x 100 Bulk volume Effective porosity is a measured of the void space that is filled by recoverable oil or gas; the amount of pore spaces that is sufficiently interconnected to yield its oil or gas for recovery. It is therefore the ratio of the interconnected pore volume to the bulk volume of the material. The effective porosity is usually in the range 40-75% of the total pore volume, except in unconsolidated rocks, like those of the Niger Delta, where it is 5-10% less. For the common reservoir rock types under average operating conditions, porosity values may be viewed as below in table 1. Porosity is influenced by degree of sorting or uniformity of grain size, shape of grains (sphericity), manner of packing, method and rate of deposition, amount of matrix, degree of cementation and other post depositional changes, effects of compaction during and after deposition and original mineralogical composition of the rock. In clastic rocks, porosity is also governed by sand/shale ratio. The average porosity evaluated in the different reservoir sands lie between 20.05% in Well 3 sand L and M and 27.55% in well 1,sand N (Table 2). Based on these values, the reservoir sands are interpreted to be very good; hence there are therefore favourable for hydrocarbon production.the decrease in porosity with depth of burial is a function of the degree of compaction of the sediments deposited (Collins, 1978). As the rate of the sediments deposited increases, the overburden pressure also increases which in turn increases the degree of compaction of sediments. A comparison of the average porosities and percentage ratio of sand/shale (table 3) in reservoir sands show that the porosity values depend on the average percentage of sand/shale ratio: Page 38
10 The higher the sand/shale ratios, the higher the porosity and vice versa. In clastic reservoir rocks, like those encountered in this work, porosity is governed by sand/shale ratio and the higher the ratio, the higher the porosity and vice. Sand percentage evaluated in this study is in the range of 90.1% and 98.3% and this is interpreted to have good reservoir quality because high sand/shale percent increases the porosity of the sands, which in turn improves the reservoir quality. Table 1: Qualitative description of porosity values (After Dresser Atlas, 1982) Ø (%) Qualitative evaluation 0 5 Negligible 5 10 Poor Fair Good 20+ Very Good Table 2: Log-based calculated lateral and vertical porosity (ø) and permeability (k) in reservoir sands WELL 1 WELL 2 WELL 3 WELL 4 WELL5 SAND UNIT Øe (%) K (md) Øe (%) K(md) K L M N Øe (%) K (md) Øe (%) K (md) Øe (%) K (md) Table 3: Average shale and sand volume percentage in reservoir sands. UNITS WELL 1 WELL 2 WELL 3 WELL 4 WELL 5 Sh (%) Sd (%) Sh (%) Sd (%) Sh (%) Sd(%) Sh (%) Sd (%) Sh (%) Sd (%) K L M N ) Permeability Permeability is a measure of the ability of a porous medium to transmit fluid without change in the structure of the medium of displacement of its parts. In other words, permeability is a measure of the ease with which a formation permits a fluid to flow through it (table 4). To be permeable, a rock must have interconnected porosity (pores, vugs, capillaries, fissures or fractures). Greater porosity usually corresponds to greater permeability, but this is not always the case. Pore size, shape and continuity as well as the amount of porosity, influence formation permeability (Schlumberger, 1989). Other factors controlling permeability are sorting and shale content. Rocks with proper sorting and smaller grain trend to have higher shale volume and lower permeability, while cleaner sand with the same porosity may have low shale volume and higher permeability (Vernick, 2000) Permeability is defined by Darcy s law as Q = -KPA (h 2 -h 1 ) (17) Hl Where; Q = total discharge of fluid per unit time (cm 3 s -1 ) A = cross sectional area of flow path (cm 3 ) L = Length of the flow path (cm) P = density of fluid (g/cm 3 ) H = Dynamic fluid viscosity (mpas) h 2 - h 1 = Hydraulic head or pressure drop across the flow path (gcm -2 ) k = the permeability constant in Darcy. The above equation is from the stand point of experimental or practical hydraulic engineering. We may instead take the form stated by HSU (1977) which is from the standpoint of reservoir sediments. This states that: Q = (NL 2 ) (p/n) {-grad (gh)} (18) Page 39
11 Where N is a dimensionless number, which involves a group of the rock s characteristics such as grain shape and packing: It may be given as a constant for a particular rock, L is the length if the pore structure of the solid (a measure of pore size and tortuosity and hence related indirectly to grain size, sorting and compaction. Table 4: qualitative description of permeability value (After Wichtl, 1990) Qualitative description K-value (MD) Poor to fair <1 15 Moderate Good Very good Excellent >1000 {-grad (gh)} is the potential function representing the amount of work required to move the fluid through length L. However, Dresser Atlas (1982) method involving the use of porosity and irreducible water saturation was employed in this study. According to Wichtl (1990) the following descriptions are applied to permeability as stated in table 4. The permeability values encountered within the field is interpreted to be moderate to good for hydrocarbon production according Wichtl (1990) standard. Horizontally permeability is very good to excellent but varies from one sand unit to another, this maybe as a result of poor sorting, change in grain size and sometimes shale volume or clay content. Vertically, permeability is also moderate to good but decreases gradually with depth. 3) Permeability and porosity relationship Plots of permeability versus porosity show that higher porosity values correspond to higher permeability values. In other words, permeability is directly related to porosity. Their relationships are shown by regression analysis (see appendices A1-A5). 4) Fluid saturation Fluid saturation is the fluid volume expressed as a fraction of the total pore spaces. Water saturation denoted as Sw is the fraction/percentage of the pore volume of the reservoir rock that is filled with water. It is generally assumed, unless otherwise known that the pore volume not filled with water is filled with hydrocarbons. Therefore, hydrocarbon saturation denoted as Sh is the fraction or percentage of the pore volume of the rock that is filled with hydrocarbons, Sh = 1- Sw(19) Fluid saturation was evaluated for both hydrocarbon and non-hydrocarbon-bearing reservoir sands (Table 5). The evaluated water saturation (Sw) in hydrocarbon reservoir sand, which was arrived at by putting the various values of F, RW, and RT into equation (8) indicates a varying values across the wells (see table 5-11); The higher the value of Sw in the reservoir sand, the lower the hydrocarbon and vice versa. This principle is used in differentiating the sands that are hydrocarbon bearing from those that are water bearing. One of the main aims of evaluation of reservoir sands is to estimate the fraction of the total pore volume filled with hydrocarbon. This parameter depends on porosity and the amount of hydrocarbon saturating the reservoir body. The higher the amount of saturation of reservoir sand by a certain field (water, oil or gas) the higher the productivity of that fluid by the reservoir sand when a well is drilled through the sand, provided other reservoir requirements are met. B. Interpretation of geological/petrophysical properties of individual reservoir sands 1) Sand K This sand unit varies in thickness between 200m and 152m (see table 12). The shallowest top of the sand was encountered at 3452 in well 3 and the deepest top at 3581m in well 4. The shallowest base of the sand unit was encountered at 3612m in well 2 and the deepest base at 3734m in well 4. Lithology and composition The evaluation of average sand/shale percentage shows that the geologic unit is dominantly sand with its highest average sand percentage of 97.8% in well 5 and with lowest average sand percentage as 94.2% in well 1.There is an overall increase in sand percentage from well 1 towards other wells. This shows that the flanks of this sand body within the field have more sand volume than the centre. Depositional environment The GR log gives a blocky smooth to serrated shape with sharp upper and lower contact. This may indicate massive and non-graded sand. Based on the facies classification model of log shapes (Schlumberger, 1985), the sand unit is possibly interpreted as a point bar. Petrophysical properties and hydrocarbon occurence The porosity in sand K varies between 23.38% in well 2 and 28.27% in well 1. The permeability evaluated for the sand unit shows highest value of md in well 1 and lowest value of 26md in well 4.. The reservoir is considered good to very good based on the porosity and permeability values. As shown by the resistivity log sand K is hydrocarbon bearing formation in all the wells with average hydrocarbon saturation ranging from 70.94% to 93.08%. 2) Sand L This reservoir sand has thickness of 107m in well 2 and 61m in well 3.The shallowest top of the unit was seen at 3658m in well 2 and 3 and the deepest top at 3749m in well 4.The shallowest base was encountered at 3764m in well 2 and the deepest base at 37180m in well 1 and 5. Page 40
12 Lithology and composition The reservoir is dominantly sand having highest average sand percentage of 97.7% in well 5 and the lowest sand percentage in well 3 with 90.3%. Depositional environment The unit shows a GR curve with cylindrical shape with very weak serrations. The log shape also shows sharp upper and lower contacts. Based on the facies classification model shapes (Schlumberger, 1985), the sand body is interpreted as a mouth bar deposit Table 5: Average water saturation and hydrocarbon saturation in the reservoir sands Sand unit WELL 1 WELL 2 WELL 3 WELL 4 WELL 5 Sw (%) Sh (%) Sw (%) Sh (%) Sw (%) Sh (%) Sw (%) Sh (%) Sw(%) Sh(%) K L M N Table 6: Petrophysical parameters for well 1 Thickness(m) Ø (%) Sw (%) Sh (%) BVM K (md) Sand Units % K L M N Table 7: Petrophysical parameters for well 2 Thickness (m) (Ø)(%) Sw (%) Sh (%) BVM K(md) Sand units K L M N Table 8: Petrophysical parameters for well 3 thickness(m) Ø (%) Sw (%) Sh (%) BVM K (md) Sand units K L M N Table 9: Petrophysical parameters for well 4 Thickness(m) Ø (%) Sw (%) Sh (%) BVM K (md) Sand units K L M N Page 41
13 Table 10: Petrophysical parameters for well 5 thickness(m) Ø (%) Sw (%) Sh (%) BVM K (md) SAND UNITS K L M N Table 11: Depth and thickness distribution of reservoir units SAND UNITS K L M N Depth (m) WELL 1 WELL 2 WELL 3 WELL 4 WELL 5 Thickness Depth Thickness Depth Thickness Depth Thickness Depth thickness (m) (m) (m) (m) (m) (m) (m) (m) (m) Petrophysical properties and hydrocarbon occurrence Sand L has the highest porosity value of 27.98% in well 1 and lowest porosity value of in well 3. The permeability values range between 894md in well 1 and md in well 1 to in well 2.The reservoir quality is good to very good based on the mean porosity and permeability values. Based on the laterolog and neutrondensity log, the sand unit is hydrocarbon bearing in well 2 with net pay thickness of 100ft. This unit is interpreted to be gas bearing following the crossover effect seen by the neutron porosity and density log. 3) Sand M The reservoir sand has a thickness of 61m-84m as evaluated from the different wells. It has its shallowest top at the depth of 3841m in well 3 and the deepest base at the depth of 3978m in well 2. The thickness of this sand body is high at the centre and low at the flanks. In other words, the centre of the sand body within the field is thicker than the sides. Lithology and composition The sand unit has the highest sand volume of 98.16% in well 5 and lowest sand volume of 92.28% in well 1. There is an overall increase of sand percentage from the centre of the field to the north, south, east and west. That is the centre has less sand than the flanks. Depositional environment The GR log shows a blocky serrated to upward fining trend. It has an upper contact that ranges from abrupt at some place and weakly gradational at other places. Based on the aforementioned GR log shape, the depositional environment is interpreted as channel deposit. Petrophysical properties and hydrocarbon occurrence The porosity of this sand unit lies between 27.08% in well 1 to 20.25% in well 2. The porosity is seen to decrease from well 5 to the north, south, east and west within the sand unit. The permeability of this reservoir sand has highest value of 95.42md in well 1. The reservoir quality is good from the stand point of mean porosity and permeability. 4) Sand N This unit has a thickness between 76m to 91m.The shallowest top sand occurs at 3932m in well 3 and deepest base at 4039m in well 1.The sand body thins at well 5, and thickens towards the flanks of the field. Lithology and composition This unit has the highest sand volume percentage of 96.8% in well 1 and the lowest sand volume percentage of 90.2% in well 3. The flanks of this reservoir have more sand than the centre. Depositional environment The GR log gives an upward fining expression with digitate pattern, which indicates a coarsening upward sequence. It shows a sharp upper contact and a gradational lower contact. Page 42

14 On the basis of electrofacies classification of deltaic environments from Gamma ray log (Schlumberger, 1985) sand N is interpreted to be either a mouth bar or a barrier foot deposit. Petrophysical properties and hydrocarbon occurrence This sand unit has a minimum porosity of 20.52% and a maximum porosity value of 35.04% in well 5. The porosity values are higher at the flanks than the central portion. C. Correlation of reservoir sands In this work, the stratigraphic correlation to show the continuity and the pinchout of reservoir sands, and demonstration of the equivalence of stratigraphic reservoir sand unit were carried out. The reservoir lithologic units were delineated in vertical succession by surface representing the changes in lithologic characters, such as showing regressive or transgressive sequences and the different sedimentary sand type deposited in the field. In correlation process, a modified method of lateral continuous line tracing and use of broken lines for area of uncertainty of sand units was employed for accurate correlation work of closely spaced sand unit. Individual units were traced from well to well (fig. 15). Fig. 15: Correlation of well logs in OTEBE Field Page 43
15 A. Summary 1) Porosity IV. SUMMARY AND CONCLUSION The porosity values of the reservoir sands in the field lie between 28.27% in well 1, sand K, and 20.25% in well 3, sand M. The porosity value is qualitatively evaluated to be fair to very good and favourable for hydrocarbon production. Porosity decreases gradually from one reservoir to another as depth of burial increases.the decrease in porosity may be as result of increase in the degree compaction. Sand percentage of the reservoir sands evaluated in this work is high. They range between 90% and 99%. Porosity in clastic rocks is governed by sand/shale ratio, and the higher the ratio, the higher porosity. Therefore, high sand/shale percentage contributes to the overall high porosity values encountered in the field. 2) Permeability The average permeability evaluated for the various sand bodies falls between 178md in sand K for well 1 and 29.71md in sand M for well 3. Permeability values, which are moderate to good for hydrocarbon production, decrease gradually with depth due to increase in overburden pressure. This leads to compaction and change in pore size. As a result of compaction, discontinuity or interconnectivity, permeability may be reduced. Horizontally, permeability changes in value from one portion of a sand unit to another. This may as a result of poor sorting, change in grain size and clay content. Permeability and porosity values evaluated in the field are directly related. Higher porosity, in most cases, has higher permeability. According to Schlumberger (1989), higher porosity usually corresponds to greater permeability. 3) Water/hydrocarbon saturation Fluid saturation was evaluated for all the reservoir sands within the field. The evaluated water saturation (SW) values show that sand bodies are all hydrocarbon bearing. These hydrocarbon-bearing sands have water saturation values ranging between 6.26%-29.01%. The hydrocarbon saturation(sh) values of these hydrocarbon bearing sands is between 90%-99%.The principles of the higher the value of water saturation, the lower the hydrocarbon and vice-versa was adopted in identifying between water bearing and hydrocarbon bearing reservoirs. 4) Depositional environments Several environments of deposition have been identified utilizing GR-log signature and electrofacies classification for deltaic environment (Schlumberger, 1985 Garcia, 1981). These environment are point bar, mouth bar, tidal channel, distributary channel and barrier bar. The GR log signatures of these environments discussed below. Mouth bar: The GR log exhibits an upward flaring expression with digitate pattern. It also shows a coarsening upward sequence. The upper contact is very sharp and the lower contact is gradational. Point bar: The GR log of point bars show cylindrical (smooth or serrated) shape with sharp upper and lower contacts. Distributary channel: The GR log shows a bell shape trend, indicating an upward sequence. The GR log signature exhibits a sharp lower contact and a gradational upper contact. Tidal channel: The GR log shape displays a cylindrical serrated sequence with sharp lower and sharp to gradational upper contact Barrier bar: The GR log shape shows an upward coarsening sequence with sharp upper contact and gradational lower contact. Some of the barrier bars are capped with transgressive sand. Generally, the depositional environment in OTEBE field falls between the lower deltaic plain and inner deltaic front of the Niger Delta region based on the classification of depositional environments of sand bodies and their related geomorphic features (Le Blanc, 1972 and Garcia, 1981) B. Conclusion The main petrophysical parameters evaluated include porosity, permeability, hydrocarbon saturation and water saturation. These parameters were evaluated using Gamma Ray Log, Compensated Bulk Density Log, Compensated Neutron Log and Resistivity Log (Laterolog). The average sand/shale percentages indicate that the lithological composition of the reservoir sands is dominantly sand, with average sand percentage above 90%. The reservoir sands exhibit porosity distribution ranging from 20%- 30% which is considered to be very good for hydrocarbon production in the Niger Delta. The reservoir sands have moderate to good permeability regime within the field. Porosity and Permeability distribution, vertically within the sand units in the field, decreases relatively with increasing depth. Horizontally, there is not much porosity variation within the sands. Permeability varies horizontally, probably as a result of poor sorting, change in grain size and clay content. The sand bodies exhibit a wide range of hydrocarbon saturation from 90%-99%. Reservoir sand K is considered the best reservoir body for production and exploitation based on the number of hydrocarbon accumulation, porosity, permeability, pay thickness and fraction of total pore space occupied by hydrocarbon. Different sub-environments were identified on the basis of the GR log shapes of the reservoir sands and these environments include: point bar sands, distributary channel deposits, tidal channel sands and barrier bars. Based on the classification of depositional environments of sand bodies and their related Page 44
16 geomorphic features, the general environment of OTEBE Field falls most likely between the lower deltaic plain and inner deltaic front of the Niger Delta region. REFERENCES [1]. Avbovbo, A. A., (1978). Tertiary lithostratigraphy of Niger Delta: American Association of Petroleum Geologists Bulletin, 62, [2]. Beka, F. T., &Oti, M. N. (1995). The distal offshore Niger Delta: frontier prospects of a mature petroleum province, in, Oti, M.N., & Postma, G., (eds).,geology of Deltas: Rotterdam, A.A. Balkema, [3]. Burke, K., (1972). Longshore drift, submarine canyons, & submarine fans in Development of Niger Delta: American Association of Petroleum Geologists, 56, [4]. Bustin, R. M., (1988). Sedimentology & characteristics of dispersed organic matter in Tertiary Niger Delta: origin of source rocks in a deltaic environment: American Association of Petroleum Geologists Bulletin, 72, [5]. Demaison, G., & Huizinga, B.J., (1994). Genetic classification of petroleum systems using three factors: charge, migration, & entrapment, in, Magoon, L.B., & Dow, W.G., Eds. The Petroleum System--From Source to Trap, AAPG Memoir 60: Tulsa, American Association of Petroleum Geologists, [6]. Doust, H., & Omatsola, E., (1990). Niger Delta, in, Edwards, J. D., & Santogrossi, P.A., eds., Divergent/passive Margin Basins, AAPG Memoir 48: Tulsa, American Association of Petroleum Geologists, [7]. Edwards, J.D., &Santogrossi, P.A., (1990). Summary & conclusions, in, Edwards, J.D., & Santogrossi, P.A., (eds)., Divergent/passive Margin Basins, AAPG Memoir 48: Tulsa, American Association of Petroleum Geologists, [8]. Ejedawe, J.E., (1981). Patterns of incidence of oil reserves in Niger Delta Basin: American Association of Petroleum Geologists, 65, [9]. Ejedawe, J.E., Coker, S.J.L., Lambert-Aikhionbare, D.O., Alofe, K.B., &Adoh, F.O. (1984). Evolution of oil-generative window and oil & gas occurrence in Tertiary Niger Delta Basin: American Association of Petroleum Geologists, 68, [10]. Ekweozor, C. M., &Daukoru, E.M, (1984). Petroleum source bed evaluation of Tertiary Niger Delta--reply: American Association of Petroleum Geologists Bulletin, 68, [11]. Ekweozor, C. M., &Daukoru, E.M, (1994). Northern delta depobelts portion of the Akata-Agbada petroleum system, Niger Delta, Nigeria, in, Magoon, L.B., & Dow, W.G., eds., The Petroleum System--From Source to Trap, AAPG Memoir 60: Tulsa, American Association of Petroleum Geologists, [12]. Ekweozor, C. M., Okogun, J.I., Ekong, D.E.U., & Maxwell J.R., (1979). Preliminary organic geochemical studies of samples from the Niger Delta, Nigeria: Part 1, analysis of crude oils for triterpanes: Chemical Geology, 27, [13]. Ekweozor, C.M., &Okoye, N.V., (1980): Petroleum source-bed evaluation of Tertiary Niger Delta: American Association of Petroleum Geologists Bulletin, 64, [14]. Evamy, B.D., Haremboure, J., Kamerling, P., Knaap, W.A., Molloy, F.A., &Rowlands, P.H., (1978). Hydrocarbon habitat of Tertiary Niger Delta: American Association of Petroleum Geologists Bulletin, 62, [15]. Frost, B.R., (1997). A Cretaceous Niger Delta Petroleum System, in, Extended Abstracts, AAPG/ABGP Hedberg Research Symposium, Petroleum Systems of the South Atlantic Margin, [16]. Garcia, R., (1981). Depositional Systems & their Relations to Gas Accumulation in Sacramento Valley, California: American Association of Petroleum Geologists Bulletin, 65, [17]. GeoMark Research, Inc., (1998). Oil Information Library System, version 1.0: Houston, Texas, GeoMark Research, Inc., [database available from GeoMark Research, Inc., 9748 Whithorn Drive, Houston, TX 77095]. [18]. Haack, R.C., Sundararaman, P., & Dahl, J., (1997). Niger Delta petroleum System, in, Extended Abstracts, AAPG/ABGP Hedberg Research Symposium, Petroleum Systems of the South Atlantic Margin, November 16-19, 1997, Rio de Janeiro, Brazil. [19]. Hospers, J., (1965). Gravity field & structure of the Niger Delta, Nigeria, West Africa: Geological Society of American Bulletin, 76, [20]. Hunt, J.M., (1990). Generation & migration of petroleum from abnormally pressured fluid compartments: American Association of Petroleum Geologists Bulletin, 74, [21]. Kaplan, A., Lusser, C.U., Norton, I.O., (1994). Tectonic map of the world, panel 10: Tulsa, American Association of Petroleum Geologists, scale 1:10,000,000. [22]. Klett, T.R., Ahlbr&t, T.S., Schmoker, J.W., & Dolton, J.L., (1997).Ranking of the world s oil & gas provinces by known petroleum volumes: U.S. Geological Survey Open-file Report , CD-ROM. [23]. Kulke, H., (1995). Nigeria, in, Kulke, H., ed., Regional Petroleum Geology of the World. Part II: Africa, America, Australia & Antarctica: Berlin, GebrüderBorntraeger, [24]. Lambert-Aikhionbare, D. O., &Ibe, A.C., (1984). Petroleum source-bed evaluation of the Tertiary Niger Delta: discussion: American Association of Petroleum Geologists Bulletin, 68, [25]. Le Blanc, R.J., (1972). Geometry of sandstone Reservoir Bodies: American Association of Petroleum Geologists Bulletin, 18, [26]. Lehner, P., & De Ruiter, P.A.C., (1977). Structural history of Atlantic Margin of Africa: American Association of Petroleum Geologists Bulletin, 61, [27]. Lewan M.D., (1984). Factors controlling the proportionality of vanadium to nickel in the bitumen of organic sedimentary rocks: GeochimicaetCosmochimicaActa, 48, [28]. Lewan, M.D., & Maynard, J.B., (1982). Factors controlling enrichment of vanadium & nickel in the bitumen of organic sedimentary rocks: GeochimicaetCosmochimicaActa, 46, [29]. Magoon, L.B., & Dow, W.G., (1994). The petroleum System, in, Magoon, L.B., & Dow, W.G., eds., The Petroleum System--from Source to trap, AAPG Memoir 60: Tulsa, American Association of Petroleum Geologists, [30]. Nwachukwu, S.O., (1972). The tectonic evolution of the southern portion of the Benue Trough, Nigeria: Geology Magazine, 109, [31]. Nwachukwu, J.I., &Chukwura, P. I., (1986). Organic matter of Agbada Formation, Niger Delta, Nigeria: American Association of Petroleum Geologists Bulletin, 70, [32]. Nwachukwu, J.I., Oluwole, A.F., Asubiojo, O.I., Filby, R.H., Grimm, C.A., & Fitzgerald, S., (1995). A geochemical evaluation of Niger Delta crude oils, in, Oti, M.N., &Postma, G., eds., Geology of Deltas: Rotterdam, A.A. Balkema, [33]. Oluwole, A.F., Adegoke, O.S., Kehinde, L.O. et al., (1985). Chemical composition of bitumen extracts from Nigerian tar s&s, in, 3rd. International UNITAR/UNDP Heavy Crude & Tar Sand conf., Long Beach, CA, USA, , Preprints 1, [34]. Petters, S. W. (1995).Foraminiferal biofacies in the Nigerian rift & continental margin deltas.in M.N. Oti& G. Postma (Eds.), Geology of deltas (pp ). Rotterdam: Balkema. [35]. Persits, F., Ahlbrandt, T., Tuttle, M., Charpentier, R., & Brownfield, M., (1997). Map of the geology, oil & gas field, & geologic provinces of Africa, U.S. Geological Survey Open-file Report A, CD-ROM. [36]. Petroconsultants, (1996a). Petroleum exploration & production database: Houston, Texas, Petroconsultants, Inc., [database available from Petroconsultants, Inc. [37]. Petroconsultants, (1996b): PetroWorld 21, Houston, Texas, Petroconsultants, Inc., [database available from Petroconsultants, Inc., [38]. Reed, K.J., (1969). Environment of deposition of source beds of high-wax oil: American Association of Petroleum Geologists Bulletin, 53, Page 45
![[39]. Reijers, T.J.A., Petters, S.W., &Nwajide, C.S., (1997). The Niger Delta Basin, inselly, R.C., ed., African Basins--Sedimentary Basin of the World 3: Amsterdam, Elsevier Science, 151-172. [40].](/docs-images/95/123285403/images/17-0.jpg "Schlumberger (1985). Well Evaluation Conference Nigeria. Schlumberger International, Houston, Texas, 15-153. [41]. Selley, R.C., (1997). African Basin. Amsterdam: Elseveir Science, 394 [42].")
![Shannon, P. M., & Naylor N., (1989).Petroleum Basin Studies: London, Graham &Trotman Limited, 169. [43]. Short, K. C., &Stäuble, A.J., (1965).](/docs-images/95/123285403/images/17-1.jpg "Outline of geology of Niger Delta: American Association of Petroleum Geologists Bulletin, 51, 761-779. [44]. Smith-Rouch, L. S., Meisling, K.E., Hennings, P.E., &Armentrout, J.M., (1996).")
![Tectono-stratigraphic computer experiments Nigeria example: American Association of Petroleum Geologists Bulletin Abstracts, May 1996. [45]. Stacher, P., (1995).](/docs-images/95/123285403/images/17-2.jpg "Present underst&ing of the Niger Delta hydrocarbon habitat, in, Oti, M.N., &Postma, G., eds., Geology of Deltas: Rotterdam, A.A. Balkema, 257-267. [46]. Thomas, (1995).")
![Niger delta oil production, reserves, field sizes assessed: Oil & Gas Journal. 101-103. [47]. Tissot, B.P., &Welte, D.H., (1984): Petroleum Formation & Occurrence: Berlin, Springer-Verlag, 518. [48].](/docs-images/95/123285403/images/17-3.jpg "Udo, O.T., &Ekweozor C.M., (1988).")
17 [39]. Reijers, T.J.A., Petters, S.W., &Nwajide, C.S., (1997). The Niger Delta Basin, inselly, R.C., ed., African Basins--Sedimentary Basin of the World 3: Amsterdam, Elsevier Science, [40]. Schlumberger (1985). Well Evaluation Conference Nigeria. Schlumberger International, Houston, Texas, [41]. Selley, R.C., (1997). African Basin. Amsterdam: Elseveir Science, 394 [42]. Shannon, P. M., & Naylor N., (1989).Petroleum Basin Studies: London, Graham &Trotman Limited, 169. [43]. Short, K. C., &Stäuble, A.J., (1965). Outline of geology of Niger Delta: American Association of Petroleum Geologists Bulletin, 51, [44]. Smith-Rouch, L. S., Meisling, K.E., Hennings, P.E., &Armentrout, J.M., (1996).Tectono-stratigraphic computer experiments Nigeria example: American Association of Petroleum Geologists Bulletin Abstracts, May [45]. Stacher, P., (1995). Present underst&ing of the Niger Delta hydrocarbon habitat, in, Oti, M.N., &Postma, G., eds., Geology of Deltas: Rotterdam, A.A. Balkema, [46]. Thomas, (1995). Niger delta oil production, reserves, field sizes assessed: Oil & Gas Journal [47]. Tissot, B.P., &Welte, D.H., (1984): Petroleum Formation & Occurrence: Berlin, Springer-Verlag, 518. [48]. Udo, O.T., &Ekweozor C.M., (1988). Comparative source rock evaluation of Opuama Channel Complex & adjacent producing areas of Niger delta: Nigerian Association of Petroleum Explorationists Bulletin, 3 (2), [49]. Udo, O.T., Ekweozor, C.M., &Okogun, J.I., (1988). Petroleum geochemistry of an ancient clay-filled canyon in the western Niger delta, Nigeria: Nigerian Association of Petroleum Explorationists Bulletin, 3, [50]. Ukpong, A. J. & Ekhalialu, O.M. (2017). Evaluation of palaeooxygen conditions of Priabonian Rupelian sediments of the Agbada Formation, Niger Delta based on Fisher s diversity index & benthic foraminifera oxygen index. EPRA International Journal of Research & Development (IJRD), 2 (12), [51]. Ukpong A. J., Ikediasor K. C., Anyanwu, T. C., Osung E. W., & Ekhalialu O. M. (2017a). Foraminiferal Biozonation of Well K- 27, Greater Ughelli Depobelt, Niger Delta Basin, South Eastern Nigeria.EPRA International Journal of Multidisciplinary Research. 3 (10), [52]. Ukpong, A. J., Ikediasor K.C., Ekhalialu O. M., & Osung E. W.(2017b). Sequene stratigraphic analysis of Well X2 in the Niger Delta, South Eastern Nigeria.International Journal of Scientific & Technology Research, 6 (10), [53]. Ukpong, A. J., Ekhalialu, O. M. (2018). Foraminiferal Approach to Palaeoenvironmental Interpretations: Case Study of Priabonian Rupelian Sediments of the Niger Delta, Nigeria. International Journal Geology & Mining. 4 (2), [54]. Ukpong, A. J., Ekhalialu, O. M., Osung, W. E., &Omoko, E. N. (2018).Foraminiferal Biozonation & Biochronology of Priabonian Repulian sediments of the Agbada Formation, Niger Delta.International Journal of Scientific & Research Publications, 8 (1), [55]. Weber, K.J., (1987). Hydrocarbon distribution patterns in Nigerian growth fault structures controlled by structural style & Stratigraphy: Journal of Petroleum Science & Engineering, 1, [56]. Weber, K. J., &Daukoru, E.M., (1975).Petroleum geology of the Niger Delta: Proceedings of the Ninth World Petroleum Congress, volume 2, Geology: London, Applied Science Publishers, Ltd., 221. [57]. Whiteman, A., (1982). Nigeria: Its Petroleum Geology, Resources & Potential: London, Graham &Trotman, 394. [58]. Wichtl, K.F., (1982). Log Interpretation Seminar (A Course Designed for Modern Basic Log Evaluation Practice). Schlumberger International, Texas, 117. [59]. Xiao, H., &Suppe, J., (1992). Origin of rollover.american Association of Petroleum Geologists Bulletin, 76, APPENDIX A POROSITY (%) VS. PERMEABILITY (MD) PLOTS Page 46
 PLOTS APPENDIX C")
 PLOTS www.")
18 APPENDIX B PERMEABILITY (md) VS. DEPTH (m) PLOTS APPENDIX C POROSITY (%) VS. DEPTH (M) PLOTS Page 47

19 Page 48
Formation Evaluation of an Onshore Oil Field, Niger Delta Nigeria.
 IOSR Journal of Applied Geology and Geophysics (IOSR-JAGG) e-issn: 2321 0990, p-issn: 2321 0982.Volume 4, Issue 6 Ver. II (Nov-Dec. 2016), PP 36-47 www.iosrjournals.org Formation Evaluation of an Onshore
RESERVOIR CHARACTERIZATION USING SEISMIC AND WELL LOGS DATA (A CASE STUDY OF NIGER DELTA)
") RESERVOIR CHARACTERIZATION USING SEISMIC AND WELL LOGS DATA (A CASE STUDY OF NIGER DELTA) * ESHIMOKHAI, S. and AKHIREVBULU, O.E. http://dx.doi.org/10.4314/ejesm.v5i4.s20 Received 19th June 2012; accepted
RESERVOIR CHARACTERIZATION USING SEISMIC AND WELL LOGS DATA (A CASE STUDY OF NIGER DELTA) * ESHIMOKHAI, S. and AKHIREVBULU, O.E. http://dx.doi.org/10.4314/ejesm.v5i4.s20 Received 19th June 2012; accepted
FORMATION EVALUATION OF SIRP FIELD USING WIRELINE LOGS IN WESTERN DEPOBELT OF NIGER DELTA
 FORMATION EVALUATION OF SIRP FIELD USING WIRELINE LOGS IN WESTERN DEPOBELT OF NIGER DELTA 1 Obioha C, ²Adiela U. P and ³*Egesi N 1,3 Department of Geology, Faculty of Science, University of Port Harcourt,
Determination of Geothermal Gradient in the Eastern Niger Delta Sedimentary Basin from Bottom Hole Temperatures
 Journal of Earth Sciences and Geotechnical Engineering, vol. 4, no. 3, 2014, 109-114 ISSN: 1792-9040 (print), 1792-9660 (online) Scienpress Ltd, 2014 Determination of Geothermal Gradient in the Eastern
Estimation of Water Saturation Using a Modeled Equation and Archie s Equation from Wire-Line Logs, Niger Delta Nigeria
 IOSR Journal of Applied Physics (IOSR-JAP) e-issn: 2278-4861. Volume 3, Issue 4 (Mar. - Apr. 2013), PP 66-71 Estimation of Water Saturation Using a Modeled Equation and Archie s Equation from Wire-Line
Hydrocarbon Volumetric Analysis Using Seismic and Borehole Data over Umoru Field, Niger Delta-Nigeria
 International Journal of Geosciences, 2011, 2, 179-183 doi:10.4236/ijg.2011.22019 Published Online May 2011 (http://www.scirp.org/journal/ijg) Hydrocarbon Volumetric Analysis Using Seismic and Borehole
Petrophysical Charaterization of the Kwale Field Reservoir Sands (OML 60) from Wire-line Logs, Niger Delta, Nigeria. EKINE, A. S.
 from Wire-line Logs, Niger Delta, Nigeria. EKINE, A. S.") JASEM ISSN 1119-8362 All rights reserved Full-text Available Online at wwwbiolineorgbr/ja J Appl Sci Environ Manage December, 2009 Vol 13(4) 81-85 Petrophysical Charaterization of the Kwale Field Reservoir
JASEM ISSN 1119-8362 All rights reserved Full-text Available Online at wwwbiolineorgbr/ja J Appl Sci Environ Manage December, 2009 Vol 13(4) 81-85 Petrophysical Charaterization of the Kwale Field Reservoir
RESERVOIR EVALUATION OF T-X FIELD (ONSHORE, NIGER DELTA) FROM WELL LOG PETROPHYSICAL ANALYSIS
 FROM WELL LOG PETROPHYSICAL ANALYSIS") http://dx.doi.org/10.4314/bajopas.v9i2.25 Bayero Journal of Pure and Applied Sciences, 9(2): 132-140 Received: June, 2016 Accepted: December, 2016 ISSN 2006 6996 RESERVOIR EVALUATION OF T-X FIELD (ONSHORE,
http://dx.doi.org/10.4314/bajopas.v9i2.25 Bayero Journal of Pure and Applied Sciences, 9(2): 132-140 Received: June, 2016 Accepted: December, 2016 ISSN 2006 6996 RESERVOIR EVALUATION OF T-X FIELD (ONSHORE,
STRUCTURAL INTERPRETATION AND HYDROCARBON POTENTIAL OF OBUA FIELD, NIGER DELTA, SOUTHERN NIGERIA
 STRUCTURAL INTERPRETATION AND HYDROCARBON POTENTIAL OF OBUA FIELD, NIGER DELTA, SOUTHERN NIGERIA 1 Iwuoma Juliet Onyinyechukwu and 2 Minapuye I. Odigi 1 Department of Geology, University of Port Harcourt,
GEOPHYSICAL AND WELL CORELLATION ANALYSIS OF OGO FIELD: A CASE STUDY IN NIGER DELTA BASIN OF NIGERIA
 Nigerian Journal of Technology (NIJOTECH) Vol. 36, No. 3, July 2017, pp. 729 733 Copyright Faculty of Engineering, University of Nigeria, Nsukka, Print ISSN: 0331-8443, Electronic ISSN: 2467-8821 www.nijotech.com
Integration of Well Logs and Seismic Data for Prospects Evaluation of an X Field, Onshore Niger Delta, Nigeria
 International Journal of Geosciences, 2012, 3, 872-877 http://dx.doi.org/10.4236/ijg.2012.324088 Published Online September 2012 (http://www.scirp.org/journal/ijg) Integration of Well Logs and Seismic
Lithofacies Characterization of Sedimentary Succession from Oligocene to Early Miocene Age in X2 Well, Greater Ughelli Depo Belt, Niger Delta, Nigeria
 Journal of Geosciences and Geomatics, 2018, Vol. 6, No. 2, 77-84 Available online at http://pubs.sciepub.com/jgg/6/2/5 Science and Education Publishing DOI:10.12691/jgg-6-2-5 Lithofacies Characterization
Hydrocarbon Potential of the Marginal Fields in Niger Delta Oza Field, a case study*
 Hydrocarbon Potential of the Marginal Fields in Niger Delta Oza Field, a case study* J.N. Sahu 1, C.H.V. Satya Sai 1, V. Chintamani 1 and C. Vishnu Vardhan 1 Search and Discovery Article #20182 (2012)*
The Effect of Temperature on Hydrocarbon Types in Bara Oilfield, Niger Delta Basin, Gulf Of Guinea West Africa
 International Journal of Science and Technology Volume 4 No. 9, September, 2015 The Effect of Temperature on Hydrocarbon Types in Bara Oilfield, Niger Delta Basin, Gulf Of Guinea West Africa Jonathan O.
Available online Journal of Scientific and Engineering Research, 2018, 5(6): Research Article
: Research Article") Available online www.jsaer.com, 2018, 5(6):17-24 Research Article ISSN: 2394-2630 CODEN(USA): JSERBR Reservoir Characterization and Structural Mapping of UVO Field, Onshore Niger Delta using Well Logs
Available online www.jsaer.com, 2018, 5(6):17-24 Research Article ISSN: 2394-2630 CODEN(USA): JSERBR Reservoir Characterization and Structural Mapping of UVO Field, Onshore Niger Delta using Well Logs
International Journal of Petroleum and Geoscience Engineering Volume 04, Issue 01, Pages 58-65, 2016
 International Journal of Petroleum and Geoscience Engineering Volume 04, Issue 01, Pages 58-65, ISSN: 2289-4713 Pore Pressure Gradient Prediction Using Well Logs; A Case Study on Malcolm Field, Offshore
Sequence Stratigraphic Framework of the Paradise-Field Niger Delta, Nigeria.
 Sequence Stratigraphic Framework of the Paradise-Field Niger Delta, Nigeria. A.O. Anyiam, M.Sc. and A.W. Mode, Ph.D. Department of Geology, University of Nigeria, Nsukka, Enugu State, Nigeria E-mail: okwy_anyiam@yahoo.com
Formation evaluation of an onshore appraisal well KG-5, green field, Niger Delta, Nigeria
 AMERICAN JOURNAL OF SCIENTIFIC AND INDUSTRIAL RESEARCH 2010, Science Huβ, http://www.scihub.org/ajsir ISSN: 2153-649X doi:10.5251/ajsir.2010.1.2.262.270 Formation evaluation of an onshore appraisal well
Evaluation of Hydrocarbon Volume in TRH Field, Onshore Niger Delta, Nigeria
 International Journal of Geophysics and Geochemistry 2015; 2(5): 113-123 Published online October 10, 2015 (http://www.aascit.org/journal/ijgg) ISSN: 2381-1099 (Print); ISSN: 2381-1102 (Online) Evaluation
SEISMIC AND PETROPHYSICAL ATTRIBUTES OF RESERVOIRS IN EBI OIL FIELD, NIGER DELTA
 SEISMIC AND PETROPHYSICAL ATTRIBUTES OF RESERVOIRS IN EBI OIL FIELD, NIGER DELTA Adiela U.P 1, Itiowe K 2 Emudianughe J 3 1Department of Petroleum Engineering, Nigerian Agip Oil Company, Port Harcourt.
The Integrated Seismic Reservoir Characterization (ISRC), Study in Amboy Field of Niger Delta Oil Field Nigeria
, Study in Amboy Field of Niger Delta Oil Field Nigeria") Geosciences 2012, 2(3): 60-65 DOI: 10.5923/j.geo.20120203.04 The Integrated Seismic Reservoir Characterization (ISRC), Study in Amboy Field of Niger Delta Oil Field Nigeria Odoh B. I 1, Onyeji Johnbosco
Geosciences 2012, 2(3): 60-65 DOI: 10.5923/j.geo.20120203.04 The Integrated Seismic Reservoir Characterization (ISRC), Study in Amboy Field of Niger Delta Oil Field Nigeria Odoh B. I 1, Onyeji Johnbosco
Overpressure/ Depositional Analysis of Parts of Onshore (X-Field) Niger Delta Basin Nigeria, Based on Well Logs Data.
 Niger Delta Basin Nigeria, Based on Well Logs Data.") IOSR Journal of Applied Geology and Geophysics (IOSR-JAGG) e-issn: 2321 0990, p-issn: 2321 0982.Volume 4, Issue 5 Ver. III (Sep. - Oct. 2016), PP 01-13 www.iosrjournals.org Overpressure/ Depositional Analysis
IOSR Journal of Applied Geology and Geophysics (IOSR-JAGG) e-issn: 2321 0990, p-issn: 2321 0982.Volume 4, Issue 5 Ver. III (Sep. - Oct. 2016), PP 01-13 www.iosrjournals.org Overpressure/ Depositional Analysis
ONLINE FIRST(NOT Peer-Reviewed)
") ONLINE FIRST(NOT Peer-Reviewed) Title:Hydrocarbon Reservoir Evaluation: a case study of Tymot field at southwestern offshore Niger Delta Oil Province, Nigeria Author:Victor Cypren Nwaezeapu Institute/Affiliation:Nnamdi
ONLINE FIRST(NOT Peer-Reviewed) Title:Hydrocarbon Reservoir Evaluation: a case study of Tymot field at southwestern offshore Niger Delta Oil Province, Nigeria Author:Victor Cypren Nwaezeapu Institute/Affiliation:Nnamdi
MODEL COMPACTION EQUATION FOR HYDROSTATIC SANDSTONES OF THE NIGER DELTA.
 Ife Journal of Science vol. 13, no. 1 (2011) MODEL COMPACTION EQUATION FOR HYDROSTATIC SANDSTONES OF THE NIGER DELTA. Benjamin, U.K and *Nwachukwu, J.I Department of Geology, Obafemi Awolowo University,
Reservoir Property Distribution and Structural Styles Analysis of OML D Regional Line, Onshore Niger Delta Basin
 International Journal of Sciences: Basic and Applied Research (IJSBAR) ISSN 2307-4531 (Print & Online) http://gssrr.org/index.php?journal=journalofbasicandapplied ---------------------------------------------------------------------------------------------------------------------------
EVALUATION OF SEISMIC ATTRIBUTES OF APO FIELD, ONSHORE NIGER DELTA, SOUTHERN NIGERIA
 EVALUATION OF SEISMIC ATTRIBUTES OF APO FIELD, ONSHORE NIGER DELTA, SOUTHERN NIGERIA Ekpe G. A 1, Emudianughe J. E 2 and Umukoro J 3 1 Department of Geology, University of Port Harcourt, Port Harcourt,
SEISMIC ATTRIBUTES ANALYSIS FOR RESERVOIR CHARACTERIZATION; OFFSHORE NIGER DELTA
 Petroleum & Coal ISSN 1337-7027 Available online at www.vurup.sk/petroleum-coal Petroleum & Coal 57(6) 619-628, 2015 SEISMIC ATTRIBUTES ANALYSIS FOR RESERVOIR CHARACTERIZATION; OFFSHORE NIGER DELTA K.
Detecting and Predicting Over Pressure Zones in the Niger Delta, Nigeria: A Case Study of Afam Field.
 Detecting and Predicting Over Pressure Zones in the Niger Delta, Nigeria: A Case Study of Afam Field. Olatunbosun Alao 1*, William Ofuyah 2 and Ayobami Abegunrin 1 1.Department of Geology, Obafemi Awolowo
International Research Journal of Interdisciplinary & Multidisciplinary Studies (IRJIMS)
") International Research Journal of Interdisciplinary & Multidisciplinary Studies (IRJIMS) A Peer-Reviewed Monthly Research Journal ISSN: 2394-7969 (Online), ISSN: 2394-7950 (Print) Volume-II, Issue-II,
International Research Journal of Interdisciplinary & Multidisciplinary Studies (IRJIMS) A Peer-Reviewed Monthly Research Journal ISSN: 2394-7969 (Online), ISSN: 2394-7950 (Print) Volume-II, Issue-II,
Sequence Stratigraphic Analysis from Well Logs of an X- Field, Niger Delta, Nigeria
 Current Research in Geosciences Original Research Paper Sequence Stratigraphic Analysis from Well Logs of an X- Field, Niger Delta, Nigeria Godwin Omokenu Emujakporue and Alphonsus Joseph Eyo Department
Source Rock Analysis Using Well Logs In Western Niger Delta
 IOSR Journal of Applied Geology and Geophysics (IOSR-JAGG) e-issn: 2321 0990, p-issn: 2321 0982.Volume 6, Issue 2 Ver. I (Mar. Apr. 2018), PP 70-85 www.iosrjournals.org Source Rock Analysis Using Well
Applications of 3-D Structural Interpretation and Seismic Attribute Analysis to Hydrocarbon Prospecting Over X Field, Niger-Delta
 International Journal of Basic & Applied Sciences IJBAS-IJENS Vol:10 No:04 28 Applications of 3-D Structural Interpretation and Seismic Attribute Analysis to Hydrocarbon Prospecting Over X Field, Niger-Delta
Hydrocarbon Potentials of Baze Field, Onshore Niger Delta, Nigeria: Petrophysical Analysis and Structural Mapping
 Journal of Geosciences and Geomatics, 2018, Vol. 6, No. 2, 55-64 Available online at http://pubs.sciepub.com/jgg/6/2/3 Science and Education Publishing DOI:10.12691/jgg-6-2-3 Hydrocarbon Potentials of
Petrophysical evaluation of uzek well using well log and core data, Offshore Depobelt, Niger Delta, Nigeria
 Available online at www.pelagiaresearchlibrary.com Advances in Applied Science Research, 212, 3 (5):2966-2991 ISSN: 976-861 CODEN (USA): AASRFC Petrophysical evaluation of uzek well using well log and
SEISMIC AND PETROPHYSICAL CHARACTERIZATION OF SELECTED WELLS, NIGER DELTA
 SEISMIC AND PETROPHYSICAL CHARACTERIZATION OF SELECTED WELLS, NIGER DELTA Oghonyon Rorome 1, Njoku A. Felix 2 and Itiowe Kiamuke 3 1,2,3 Department of Geology, University of Port Harcourt, Port Harcourt,
Reservoir Characterization: Implications From Petrophysical Data of the Paradise-Field, Niger Delta, Nigeria
 Reservoir haracterization: Implications From Petrophysical Data of the Paradise-Field, Niger Delta, Nigeria A.W. Mode, Ph.D. and A.O. Anyiam, M.Sc. Department of Geology, University of Nigeria, Nsukka,
Integration of Well Log Analysis and 3-D Seismic in Reserve Estimation of Hydrocarbon Bearing Sands in Q-Field, Niger-Delta Nigeria
 Integration of Well Log Analysis and 3-D Seismic in Reserve Estimation of Hydrocarbon Bearing Sands in Q-Field, Niger-Delta Nigeria Bayowa O.G. 1 Mas ud Q.A. 1 Lawal A.W. 2 L.O Ademilua 3* 1.Ladoke Akintola
SEISMIC ATTRIBUTES AND PETROPHSICAL PROPERTIES OF IBA FIELD, NIGER DELTA, NIGERIA
 SEISMIC ATTRIBUTES AND PETROPHSICAL PROPERTIES OF IBA FIELD, NIGER DELTA, NIGERIA Itiowe K 1, Adiela U.P 2 and Emudianughe J 3 1 Department of Geology, University of Port Harcourt, Port Harcourt, Nigeria
VOL. 3, NO. 8, August 2013 ISSN ARPN Journal of Science and Technology All rights reserved.
 Determination of Organic Matter Richness for Agbada Formation, Osioka South Area, Western Niger Delta, Nigeria E. K. Nyantakyi, 2 T. Li, 3 W. Hu, 4 J. K. Borkloe, 5 P. A. Owusu, 6 R.D. Nagre,2,3,4 School
Petrophysical Analysis and Sequence Stratigraphy Appraisal from Well logs of Bobo field, South-Eastern, Niger Delta
 Journal of Emerging Trends in Engineering and Applied Sciences (JETEAS) 4(2): 219-225 Scholarlink Research Institute Journals, 2013 (ISSN: 2141-7016) jeteas.scholarlinkresearch.org Journal of Emerging
Geochemical Investigation of Potential Source Rocks for Agbada Formation, Osioka South Area, Western Niger Delta, Nigeria
 Geosciences 2014, 4(1): 13-22 DOI: 10.5923/j.geo.20140401.02 Geochemical Investigation of Potential Source Rocks for Agbada Formation, Osioka South Area, Western Niger Delta, Nigeria E. K. Nyantakyi 1,2,*,
Evaluation of Hydrocarbon Prospect of Amu Field, Niger-Delta, Nigeria
 International Research Journal of Geology and Mining (IRJGM) (2276-6618) Vol. 6(1) pp. 001-008, May, 2016 DOI: http://dx.doi.org/10.14303/irjgm.2016.105 Available online http://www.interesjournals.org/irjgm
LECO Analytical Study of Subsurface Tertiary Shale Offshore Niger Delta
 IOSR Journal of Applied Geology and Geophysics (IOSR-JAGG) e-issn: 2321 0990, p-issn: 2321 0982.Volume 6, Issue 5 Ver. I (Sep. Oct. 2018), PP 75-81 www.iosrjournals.org LECO Analytical Study of Subsurface
Overpressure Prediction In The North-West Niger Delta, Using Porosity Data
 IOSR Journal of Applied Geology and Geophysics (IOSR-JAGG) e-issn: 2321 0990, p-issn: 2321 0982.Volume 1, Issue 3 (Sep. Oct. 2013), PP 42-50 Overpressure Prediction In The North-West Niger Delta, Using
Verification of Archie Constants Using Special Core Analysis and Resistivity Porosity Cross Plot Using Picket Plot Method
 Int'l Journal of Computing, Communications & Instrumentation Engg. (IJCCIE) Vol. 4, Issue (207) ISSN 2349-469 EISSN 2349-477 Verification of Archie Constants Using Special Core Analysis and Resistivity
Formation evaluation of X7 field in the Niger Delta: evidence from Petrophysical data. Niger Delta, Nigeria.
 IOSR Journal of Applied Geology and Geophysics (IOSR-JAGG e-issn: 2321 0990, p-issn: 2321 0982.Volume 1, Issue 4 (Sep. Oct. 2013, PP 15-21 Formation evaluation of X7 field in the Niger Delta: evidence
Maturity Modeling of Gomin and South Gomin fields Southern Pattani Basin, Gulf of Thailand
 Maturity Modeling of Gomin and South Gomin fields Southern Pattani Basin, Gulf of Thailand Patinya Jaithan Petroleum Geoscience Program, Department of Geology, Faculty of Science, Chulalongkorn University,
APPENDIX C GEOLOGICAL CHANCE OF SUCCESS RYDER SCOTT COMPANY PETROLEUM CONSULTANTS
 APPENDIX C GEOLOGICAL CHANCE OF SUCCESS Page 2 The Geological Chance of Success is intended to evaluate the probability that a functioning petroleum system is in place for each prospective reservoir. The
Growth Fault History Analysis of an Oil Field, Niger Delta, Nigeria
 International Journal of Geophysics and Geochemistry 2015; 2(5): 105-112 Published online October 10, 2015 (http://www.aascit.org/journal/ijgg) ISSN: 2381-1099 (Print); ISSN: 2381-1102 (Online) Growth
The Effect of Facies Changes on Hydrocarbon Production in Osisioma Field, Onshore, Niger Delta, Nigeria
 Journal of Geosciences and Geomatics, 2018, Vol. 6, No. 2, 35-40 Available online at http://pubs.sciepub.com/jgg/6/2/1 Science and Education Publishing DOI:10.12691/jgg-6-2-1 The Effect of Facies Changes
Bulletin of Earth Sciences of Thailand. Evaluation of the Petroleum Systems in the Lanta-Similan Area, Northern Pattani Basin, Gulf of Thailand
 Evaluation of the Petroleum Systems in the Lanta-Similan Area, Northern Pattani Basin, Gulf of Thailand Sirajum Munira Petroleum Geoscience Program, Department of Geology, Faculty of Science, Chulalongkorn
An integrated geothermal, gravity and aeromagnetic study for possible structural feature analysis of the Eastern Niger Delta sedimentary basin
 Vol. 14, 2018 ISSN 2278 5485 EISSN 2278 5477 Science DISCOVERY An integrated geothermal, gravity and aeromagnetic study for possible structural feature analysis of the Eastern Niger Delta sedimentary basin
EGAS. Ministry of Petroleum
 EGAS Ministry of Petroleum EGAS Ministry of Petroleum About The Block Location: N. El Arish offshore block is located in the extreme eastern part of the Egypt s economic water border and bounded from the
Hydrocarbon reservoir volume estimation using 3-D seismic and well log data over an X-field, Niger Delta Nigeria
 J Petrol Explor Prod Technol (2015) 5:453 462 DOI 10.1007/s13202-015-0152-3 ORIGINAL PAPER - EXPLORATION GEOPHYSICS Hydrocarbon reservoir volume estimation using 3-D seismic and well log data over an X-field,
Well Logs 3 D Seismic Sequence Stratigraphy Evaluation of Holu Field, Niger Delta, Nigeria
 Well Logs 3 D Seismic Sequence Stratigraphy Evaluation of Holu Field, Niger Delta, Nigeria John O. Amigun 1, Olumide Adewoye 1, Temitope Olowolafe 1 and Emmanuel Okwoli 2 1 Department of Applied Geophysics,
EGAS. Ministry of Petroleum
 EGAS Ministry of Petroleum EGAS Ministry of Petroleum About The Block Location: N. Thekah offshore block is located at about 56 km to the north of the Mediterranean shore line, 85 km to the north west
Controls on clastic systems in the Angoche basin, Mozambique: tectonics, contourites and petroleum systems
 P2-2-13 Controls on clastic systems in the Angoche basin, Mozambique: tectonics, contourites and petroleum systems Eva Hollebeek, Olivia Osicki, Duplo Kornpihl Schlumberger, London, UK Introduction Offshore
Seismic stratigraphy, some examples from Indian Ocean, interpretation of reflection data in interactive mode
 Seismic stratigraphy, some examples from Indian Ocean, interpretation of reflection data in interactive mode K. S. Krishna National Institute of Oceanography, Dona Paula, Goa-403 004. krishna@nio.org Seismic
Pore Pressure Prediction Using Offset Well Logs: Insight from Onshore Niger Delta, Nigeria
 American Journal of Geophysics, Geochemistry and Geosystems Vol. 1, No. 3, 2015, pp. 77-86 http://www.aiscience.org/journal/aj3g Pore Pressure Prediction Using Offset Well Logs: Insight from Onshore Niger
Trapping Mechanisms along North Similan and Lanta Trends, Pattani Basin, Gulf of Thailand
 Trapping Mechanisms along North Similan and Lanta Trends, Pattani Basin, Gulf of Thailand Piyaporn Aukkanit Petroleum Geoscience Program, Department of Geology, Faculty of Science, Chulalongkorn University,
PETROLEUM RSERVOIR STUDIES OF X-FIELD, ONSHORE, NIGER DELTA
 PETROLEUM RSERVOIR STUDIES OF X-FIELD, ONSHORE, NIGER DELTA Adiela U.P 1 and Obi-Chidi Adaeze.I 2 1 Department of Petroleum Engineering, Nigerian Agip Oil Company, Port Harcourt, Nigeria 2 Department of
Bulletin of Earth Sciences of Thailand
 Quantitative Seismic Geomorphology of Early Miocene to Pleistocene Fluvial System of Northern Songkhla Basin, Gulf of Thailand Oanh Thi Tran Petroleum Geoscience Program, Department of Geology, Faculty
Keywords: Exploration; reservoir structure; stratigraphic trap; uncertainty; petrophysical property.
 Article Open Access INTEGRATION OF 3D SEISMIC AND WELL LOG DATA FOR THE EXPLORATION OF KINI FIELD, OFF- SHORE NIGER DELTA Adesoji O. Akanji 1, Oluseun A. Sanuade 2, SanLinn I. Kaka 2, Isaac D. Balogun
Meandering Miocene Deep Sea Channel Systems Offshore Congo, West Africa
 Meandering Miocene Deep Sea Channel Systems Offshore Congo, West Africa S. Baer* (PGS), J. E. Comstock (PGS), K. Vrålstad (PGS), R. Borsato (PGS), M. Martin (PGS), J.P. Saba (SNPC), B. Débi-Obambé (SNPC)
Relinquishment Report
 Relinquishment Report Licence P1403 Block 13/22d Chevron North Sea Limited Korean National Oil Company Chevron North Sea Limited December 2009 1 SYNOPSIS... 3 2 INTRODUCTION. 3 2.1 Licence Terms.. 3 2.2
Int. J Sci. Emerging Tech. Vol-2 No. 3 December, 2011
 Geochemical Characterization of Agbada Formation, Osioka South Area, Western Niger Delta, Nigeria Omoboriowo A Oluwatoyin# 1, Soronnadi-Ononiwu C Godfrrey* 2 Geology Department, Faculty of Science, University
Porosity- Depth Estimation in Clastic Rocks from Sonic Logs in Chad Basin, Nigeria
 Human Journals Research Article February 2017 Vol.:5, Issue:4 All rights are reserved by Leonard Nwosu et al. Porosity- Depth Estimation in Clastic Rocks from Sonic Logs in Chad Basin, Nigeria Keywords:
Rock-Physics and Seismic-Inversion Based Reservoir Characterization of AKOS FIELD, Coastal Swamp Depobelt, Niger Delta, Nigeria
 IOSR Journal of Applied Geology and Geophysics (IOSR-JAGG) e-issn: 2321 0990, p-issn: 2321 0982.Volume 5, Issue 4 Ver. III (Jul. Aug. 2017), PP 59-67 www.iosrjournals.org Rock-Physics and Seismic-Inversion
AnalyticalDeterminationofSubsurfaceTemperatureusingTwoLayersModelinPartofNigerDeltaSedimentaryBasinNigeria
 Global Journal of Science Frontier Research: A Physics and Space Science Volume 16 Issue 3 Version 1.0 Year 2016 Type : Double Blind Peer Reviewed International Research Journal Publisher: Global Journals
LITTLE ABOUT BASIC PETROPHYSICS
 LITTLE ABOUT BASIC PETROPHYSICS Author: MUHAMMAD ZAHID M.Sc (Applied Geology) Specialization in Petrophysics University of Azad Jammu & Kashmir, Muzaffarabad. ENTER Introduction - Determination of Physical
Bulletin of Earth Sciences of Thailand. Controls on Reservoir Geometry and Distribution, Tantawan Field, Gulf of Thailand.
 Controls on Reservoir Geometry and Distribution, Tantawan Field, Gulf of Thailand Atchara Praidee Petroleum Geoscience Program, Department of Geology, Faculty of Science, Chulalongkorn University, Bangkok
Derived Rock Attributes Analysis for Enhanced Reservoir Fluid and Lithology Discrimination
 IOSR Journal of Applied Geology and Geophysics (IOSR-JAGG) e-issn: 2321 0990, p-issn: 2321 0982.Volume 5, Issue 2 Ver. I (Mar. - Apr. 2017), PP 95-105 www.iosrjournals.org Derived Rock Attributes Analysis
HIGH HYDROCARBON PROSPECT IN NIGER DELTA COMPLEX, NIGERIA
 The Journal of MacroTrends in Energy and Sustainability MACROJOURNALS HIGH HYDROCARBON PROSPECT IN NIGER DELTA COMPLEX, NIGERIA Abatan O.A*.,Ojo, R.K ** *Physics/Electronics Unit, SLT, Moshood Abiola Polytechnic,
Strictly as per the compliance and regulations of :
 Global Journal of Science Frontier Research: Physics and Space Science Volume 16 Issue 1 Version 1.0 Year 2016 Type : Double Blind Peer Reviewed International Research Journal Publisher: Global Journals
An Integrated Approach to Volume of Shale Analysis: Niger Delta Example, Orire Field
 World Applied Sciences Journal 7 (4): 448-452, 2009 ISSN 1818-4952 IDOSI Publications, 2009 An Integrated Approach to Volume of Shale Analysis: Niger Delta Example, Orire Field 1 1 2 L. Adeoti, E.A. Ayolabi
Downloaded 11/20/12 to Redistribution subject to SEG license or copyright; see Terms of Use at
 AVO crossplot analysis in unconsolidated sediments containing gas hydrate and free gas: Green Canyon 955, Gulf of Mexico Zijian Zhang* 1, Daniel R. McConnell 1, De-hua Han 2 1 Fugro GeoConsulting, Inc.,
Depositional environment and reservoir quality assessment of the Bruks Field, Niger Delta
 J Petrol Explor Prod Technol (2017) 7:991 1002 DOI 10.1007/s13202-017-0346-y ORIGINAL PAPER - EXPLORATION GEOLOGY Depositional environment and reservoir quality assessment of the Bruks Field, Niger Delta
Available online Journal of Scientific and Engineering Research, 2016, 3(6): Research Article
: Research Article") Available online www.jsaer.com, 2016, 3(6):324-332 Research Article ISSN: 2394-2630 CODEN(USA): JSERBR Reservoir Modeling and Hydrocarbon Evaluation of Abi-Field, Niger Delta, Nigeria Adiela UP 1, Omoboriowo
Available online www.jsaer.com, 2016, 3(6):324-332 Research Article ISSN: 2394-2630 CODEN(USA): JSERBR Reservoir Modeling and Hydrocarbon Evaluation of Abi-Field, Niger Delta, Nigeria Adiela UP 1, Omoboriowo
Reservoir Rock Properties COPYRIGHT. Sources and Seals Porosity and Permeability. This section will cover the following learning objectives:
 Learning Objectives Reservoir Rock Properties Core Sources and Seals Porosity and Permeability This section will cover the following learning objectives: Explain why petroleum fluids are found in underground
Petroleum geology framework, West Coast offshore region
 Petroleum geology framework, West Coast offshore region James W. Haggart* Geological Survey of Canada, Vancouver, BC jhaggart@nrcan.gc.ca James R. Dietrich Geological Survey of Canada, Calgary, AB and
Trace Metals Geochemistry of Crude Oils from Umutu/Bomu Fields in South West Niger Delta Nigeria
 Trace Metals Geochemistry of Crude Oils from Umutu/Bomu Fields in South West Niger Delta Nigeria Onojake Mudiaga C. (Corresponding author) Department of Pure and Industrial Chemistry, University of Port
Evaluation of Neocomian Shale source rock In Komombo Basin, Upper Egypt
 Evaluation of Neocomian Shale source rock In Komombo Basin, Upper Egypt Abdelhady, A. 1, Darwish, M. 2, El Araby, A. 3 and Hassouba, A. 4 1 DEA Egypt, Cairo, Egypt 2 Geology Department, Faculty of Science,
SAND DISTRIBUTION AND RESERVOIR CHARACTERISTICS NORTH JAMJUREE FIELD, PATTANI BASIN, GULF OF THAILAND
 SAND DISTRIBUTION AND RESERVOIR CHARACTERISTICS NORTH JAMJUREE FIELD, PATTANI BASIN, GULF OF THAILAND Benjawan KIinkaew Petroleum Geoscience Program, Department of Geology, Faculty of Science, Chulalongkorn
Available online Journal of Scientific and Engineering Research, 2018, 5(1):1-10. Research Article
:1-10. Research Article") Available online www.jsaer.com, 2018, 5(1):1-10 Research Article ISSN: 2394-2630 CODEN(USA): JSERBR Evaluation of Reservoir Production Performance Using 3-D Seismic Mapping and Well Logs Analysis (A Case
Available online www.jsaer.com, 2018, 5(1):1-10 Research Article ISSN: 2394-2630 CODEN(USA): JSERBR Evaluation of Reservoir Production Performance Using 3-D Seismic Mapping and Well Logs Analysis (A Case
Process, Zeit Bay Fields - Gulf of Suez, Egypt*
 PS Pressure Regime Evaluation, Role, and Contribution in Well Planning and Formation Evaluation Process, Zeit Bay Fields - Gulf of Suez, Egypt* Saber Moustafa Selim 1, Khaled Mohamed Abdallah 1, and Khalaf
INTRODUCTION TO LOGGING TOOLS
 BY: MUHAMMAD ZAHID INTRODUCTION TO LOGGING TOOLS 1- SPONTANEOUS POTENTIAL (SP) The Spontaneous potential survey, (sp) was one of the first measurements, which was carried out, in a well bore. The SP log
Plane Versus Elastic Wave AVO Anisotropic Synthetic Modeling in Derby Field, Southeastern Niger Delta
 Current Research in Geosciences Original Research Paper Plane Versus Elastic Wave AVO Anisotropic Synthetic Modeling in Derby Field, Southeastern Niger Delta Chukwuemeka Ngozi Ehirim and Nnamdi Ogbonna
Ministry of Oil and Minerals Petroleum Exploration & Production Authority BLOCK 85 (Al Uqlah North)
") Ministry of Oil and Minerals Petroleum Exploration & Production Authority BLOCK 85 (Al Uqlah North) The Al Uqlah North Block (85) occupies an area of 597 km 2 in the Sabatayn Basin in the province of Shabwah
Ministry of Oil and Minerals Petroleum Exploration & Production Authority BLOCK 85 (Al Uqlah North) The Al Uqlah North Block (85) occupies an area of 597 km 2 in the Sabatayn Basin in the province of Shabwah
Steve Cumella 1. Search and Discovery Article # (2009) Posted July 30, Abstract
 Posted July 30, Abstract") AV Geology of the Piceance Basin Mesaverde Gas Accumulation* Steve Cumella 1 Search and Discovery Article #110106 (2009) Posted July 30, 2009 *Adapted from oral presentation at AAPG Annual Convention,
AV Geology of the Piceance Basin Mesaverde Gas Accumulation* Steve Cumella 1 Search and Discovery Article #110106 (2009) Posted July 30, 2009 *Adapted from oral presentation at AAPG Annual Convention,
RELINQUISHMENT REPORT FOR LICENCE P.1663, BLOCK 29/4b and 29/5e
 RELINQUISHMENT REPORT FOR LICENCE P.1663, BLOCK 29/4b and 29/5e Licence: P.1663 Blocks: 29/4b & 29/5e 25th Round Traditional Licence Operator: Ithaca Energy UK(Ltd) 100% Work Programme Summary The agreed
Ministry of Oil and Minerals Petroleum Exploration & Production Authority BLOCK 6 (Iryam)
") Ministry of Oil and Minerals Petroleum Exploration & Production Authority BLOCK 6 (Iryam) The Iryam Block (6) occupies an area of 3,911 km 2 in the Sabatayn Basin in the province of Shabwah in central
Ministry of Oil and Minerals Petroleum Exploration & Production Authority BLOCK 6 (Iryam) The Iryam Block (6) occupies an area of 3,911 km 2 in the Sabatayn Basin in the province of Shabwah in central
Well Logging Importance in Oil and Gas Exploration and Production
 Well Logging Importance in Oil and Gas Exploration and Production Dr. R. Giri Prasad 1 1 Associate Professor, Dept. of Petroleum Engineering, Aditya Engineering College, hod_pt@aec.edu.in I. INTRODUCTION
Petroleum Potential of the Application Area L12-4
 Petroleum Potential of the Application Area L12-4 The Application Area (L12-4) is underlain by the western Officer Basin, beneath the Gunbarrel Basin. The general basin architecture is outlined in Figure
Vail et al., 1977b. AAPG 1977 reprinted with permission of the AAPG whose permission is required for further use.
 Well 5 Well 4 Well 3 Well 2 Well 1 Vail et al., 1977b AAPG 1977 reprinted with permission of the AAPG whose permission is required for further use. Well 5 Well 4 Well 3 Well 2 Well 1 Vail et al., 1977b
INT 4.5. SEG/Houston 2005 Annual Meeting 821
 Kathleen Baker* and Mike Batzle, Colorado School of Mines, Richard Gibson, Texas A&M University Summary There have been many studies of how Direct Hydrocarbon Indicators (DHIs) can help or hurt us when
Main Challenges and Uncertainties for Oil Production from Turbidite Reservoirs in Deep Water Campos Basin, Brazil*
 Main Challenges and Uncertainties for Oil Production from Turbidite Reservoirs in Deep Water Campos Basin, Brazil* Carlos H. Bruhn 1, Antonio Pinto 1, and Paulo R. Johann 1 Search and Discovery Article
FACIES ANALYSIS AND DEPOSITIONAL ENVIRONMENT OF OBUA FIELD, NIGER DELTA, NIGERIA
 FACIES ANALYSIS AND DEPOSITIONAL ENVIRONMENT OF OBUA FIELD, NIGER DELTA, NIGERIA 1 Iwuoma Juliet Onyinyechukwu and 2 Minapuye I. Odigi 1 Department of Geology, University of Port Harcourt, Nigeria 2 Centre
Calibration of Gardner coefficient for density velocity relationships of tertiary sediments in Niger Delta Basin
 J Petrol Explor Prod Technol (2017) 7:627 635 DOI 10.1007/s13202-017-0313-7 ORIGINAL PAPER - EXPLORATION GEOLOGY Calibration of Gardner coefficient for density velocity relationships of tertiary sediments
Scholars Research Library. Predicting the aquifer characteristic within the major towns in Ndokwa land
 Available online at www.scholarsresearchlibrary.com Archives of Physics Research, 2011, 2 (4):1-5 (http://scholarsresearchlibrary.com/archive.html) ISSN : 0976-0970 CODEN (USA): APRRC7 Predicting the aquifer
Search and Discovery Article #20097 (2011) Posted January 31, 2011
 Posted January 31, 2011") Integrated Geological and Engineering Studies in Support of Producing Light Oil from a Frozen Reservoir: A Case Study from Umiat Oil Field, Northern Alaska* C. Hanks 1, J. Mongrain 2, A. Dandekar 2, P.
Integrated Geological and Engineering Studies in Support of Producing Light Oil from a Frozen Reservoir: A Case Study from Umiat Oil Field, Northern Alaska* C. Hanks 1, J. Mongrain 2, A. Dandekar 2, P.