WELCOME TO THE XXV FIG CONGRESS, KUALA LUMPUR, MALAYSIA, 16 TH 21 ST JUNE, 2014.
|
|
|
- Elfrieda Thompson
- 5 years ago
- Views:
Transcription
1 WELCOME TO THE XXV FIG CONGRESS, KUALA LUMPUR, MALAYSIA, 16 TH 21 ST JUNE, TS08H - Geospatial Data Processing 3 (Commission: 3) From Spot Heights to Cell Heights: the Data Structure and the Dynamics of the Digital Elevation Model BY DR. A.C. CHUKWUOCHA 1 AND MRS NGOZI AC-CHUKWUOCHA 2 1 Department of Surveying and Geoinformatics, Federal University of Technology Owerri, Nigeria 2 Department of Environmental Technology, Federal University of Technology Owerri, Nigeria 1 achukwuocha@yahoo.com; 2 chukwuochang@yahoo.com 2
2 1.0 INTRODUCTION The central place of topography in all aspects of environmental evolution and phenomena has been noted. Topography is a critical factor in soil-forming processes because it influences a number of factors including hydrological and thermal regimes of soils through climatic and meteorological characteristics. Topography is also at the base of gravity-driven lateral transportation of water and other substances both at the surface and subsurface levels. Spatial distribution of vegetation cover is influenced by topography due to the interaction of scaled endogenous and exogenous processes. 3 INTRODUCTION contd. Equally, topography of an area can be a pointer to the geological structure of the terrain.(florinsky, 2012). All these show the centrality of the topographic information as is increasingly being employed in qualitative and quantitative analyses in the geosciences. The need to improve the knowledge of how terrain features such as topography, soil type and vegetation, interact with atmospheric events to create environmental phenomena including flooding and erosion are at the foundations of the growing drive to account for the contribution of each piece oflandinitsownform. 4

3 INTRODUCTION contd. What has become of keener interest is not as much of digitalization of topographic data as it is the piecewise quantitative topographic characterization of every bit of landscape in the area of interest. The very dynamic DEM structure calls the surveyors to move the structuring of topographical information from spot heights structure to cell heights structure data formats thatmaydirectlybeusedinvarioustypesofanalysesofthe terrain topography This paper while presenting the trends of research in continuous topographical surface representations is also a call for the review of the curricula of topographical surveying, digital cartography, and GIS for surveyors to include the basic training needed for expressing topographical information in Digital Elevation Model (DEM) structures and of using the DEM in environmental analyses. 5 Commonly Associated Terms The term DEM, is increasingly being associated with grid cell representation of the bare earth terrain surface that are populated with elevation values of the ground they represent. A Digital Terrain Model (DTM) is an elevation model of the bare earth terrain surface, based on Triangulated Irregular Network (TIN) including breaklines and linework to help define edges of TIN triangles, or to enforce the downward flow of water in the drainage feature. The DEM or DTM may be employed with other measurable environmental phenomena in Digital Terrain Analyses (DTA) that leads to modelling land based phenomena. For instance the DEM or the DTM may be employed in runoff flow Digital Terrain Analysis, based on rain storm event leading to runoff flow modelling needed for delineation of drainage routes, erosion modelling, and flooding vulnerability studies, etc.
4 Some DEM based Terrain Phenomena Analyses A number of the evolving terrain phenomena analyses include: Delineation of hydrological features such as streams, drainage routes and ridges, Sediment transportation analyses Demarcation and characterization of subcatchments of watersheds, Erosion potential modelling, Flood potential modelling and their derivatives such as flood cost analyses. 7 Some DEM based Terrain Phenomena Analyses Contd. morphological analysis of landforms, site and route selection analyses in civil engineering. inter-visibility analyses Terrain analyses in soil and geological sciences Analyses for delineation of physiographic units andsoon. 8


5 2.0 TRENDS IN DIGITAL ELEVATION MODELLING Since adapting electronics in surveying, topographic data has been stored electronically as digital data in discrete x, y, z form especially as spot heights Contour lines are stored in digital forms with the identity of their elevation values and populated by sequential points of x, y coordinates and generated in computer graphics with spline (smoothening polynomial) functions. The digital contour and spot height are deficient for quantitative environmental analyses because the elevation so defined do not characterize defined land units. Two types of Digital Elevation Models are becoming established as normative. The grid Digital Elevation Model (DEM) and the Triangulated Irregular Network (TIN) are proving very useful forms of the Digital Elevation Model Study Area 2.1 The Triangulated Irregular Network(TIN) The Triangulated Irregular Network (TIN) is an irregular assemblage of planar triangles which vertexes (nodes) are formed at points known in 3 D (x, y, z). These vertexes are carefully chosen to meet triangulation and the Delaunay conditions. i) The basic figure so formed are only triangles. ii) The entire land space is completely divided into triangles iii) No edges of triangles should intersect at a point thatisnotavertex. iv) No vertex of the triangles is inside the circumcircle of any of the triangles - the Delaunay condition. 10
6 2.1.1 Conditions for Triangular IrregulatedNetworks (TIN) Fig 1: The TIN Triangulation and Delaunay Conditions The Grid Digital Elevation Model In a grid Digital Elevation Model, the land space is divided into a grid of rectangular cells, where each cell value represents the elevation of the land surface. The DEM internal data structure may be a constant elevation or an averaging function at the center point inside the square (Kreveld, 1996). Due to the efficiency of the grid DEM, the term Digital Elevation Model is increasingly being associated with the grid form only (Maidment, 2002). 12

; Wieczorek,(2007);")
7 2.2.1LAYOUT OF THE GRID DIGITAL ELEVATION MODEL Fig 2: The grid Digital XXV International Elevation Federation of Model Surveyors scheme MATHEMATICS OF REPRESENTING THE TOPOGRAPHIC SURFACE WITH DEM The mathematics of the representation of the topographic surface with a DEM could address relatively small areas so that the assumption of plane holds. Two-dimensional(piecewise) continuous functions may be used to define relatively small portions of the topographic surface (Jancaitis, 1978; Strakhov, 2007; Florinsky, 2012). For large areas, the fact of a curvilinear surface would imply that spherical functions be used to define the topography of such areas Schroder and Sweldens (2000); Wieczorek,(2007); Florinsky(2012) 14
8 2.2.3 DIGITAL ELEVATION MODEL SIZES The grid Digital Elevation Model divides the entire landscape under question into regularly sized rectangular elevation cells using grids. If the DEM cell represents a very large area in non-flat areas, the credibility of the DEM will be in question and the result of the mathematics will not match natural occurrences in the field. The choice of the size of cells should be masterfully carried out as a linearization of topographical polynomials of the morphology of land space, so that when integrated, the result of the linearization will match the result of executing the polynomial directly to a very reasonable extent. Smaller cell sizes where possible will be advised. This however places a challenge on the computer memory, and is only necessary if there is enough data to populate each cell uniquely ADVANTAGES OF GRID DEM The use of contour lines and triangulated irregular networks for delineating catchment boundaries and flow paths may provide reliable results, however, they require extensive data storage and computation time. The computational efficiency and the availability of topographic databases are making the grid cell elevation model gain widespread application for analyzing hydrological problems (Bertolo, 2000). The simplicity of the grid DEM and its adaptability makes it the most popular one considering that it has been repeatedly argued that DEMs should be generated considering critical elements of the topographic surface. Florinsky,(2012); Mark,(1979). Furthermore, gridded DEMs have been shown to produce higher accuracy than TIN-based DEMs Kumler,(1994). Since morphometric variables are usually derived from gridded DEMs, the use of plane grids is reasonable. To convert irregular grids to regular ones will require further interpolation (Florinsky, 2012). 16
9 3.0 APPLICATION ISSUES OF THE DEM The method of Digital Elevation Model assigns elevation value to each unit of horizontal area. Unlike the traditional forms of topographic representation, such as the spot height and the contour, every point in the DEM has an elevation value. These DEM cells can be attributed further with other terrain characteristics such as vegetation, soil type, erosivity, etc. These attributes may be done either as single cells or in clusters representing some geographical zones of uniform characteristics in different terrain models. Some major weaknesses of the DEM include that it generalizes the elevationofeachcellandmakestheterrainappeartobeasystem ofsteps.howeverthecellsizeofthedemcanbemadeextremely small that for all practical purposes the cell size will represent a spot relative to the size of the landscape. This will only challenge the memory space and processing speed of the computer as the number of cells increases contd. APPLICATION ISSUES OF THE DEM DEM data have become an integral part of geographic information systems(gis). Areas of terrain analyses where DEM are already being employed include: Hydrological modelling for flood simulation. Delineation and analyses of watersheds and drainage networks. Soil erosion and sediment transport modelling. Landslide hazard assessment plus delineation and study of physiographic units. 18
10 3.0 contd. APPLICATION ISSUES OF THE DEM Geomorphological evaluation of landforms plus soil and ecological studies. The DEM is also being employed in civil engineering and military applications including site and route analyses, and inter-visibility analyses. The DEM is equally being used for 3D analysis for enhancement of remotely sensed image. Digital topographic data are essential components of groundwater and climatic models. DEM has the advantage of not being blurred by land cover features which is often the case when stereoaerial photograph interpretation and remotely sensed image analysis are used in creating DTMs (Jordan, 2007) Sources and Accuracies of DEM GROUND SURVEYS o Ground survey methods produce only heights of spots to mm accuracies which may then be interpolated to get the DEM. o It is limited in the area it can cover. Global Navigational Satellite Systems (GNSS) and photogrammetric surveys are useful in this regard as the GNSS provide for faster production of highly accurate ground controls while the photogrammetric methods using the established ground controls provide for a far wider coverage of the land space with elevation accuracies comparable to purely ground survey methods. REMOTELY SENSED DATA o The Remote sensing data sources make it possible to determine heightsofeachcellofthedemdirectly. oin this case then the elevation of each cell is determined theoretically by aggregating all the heights possible in each cell. o However the remotely sensed data sources have their own accuracy issues and will definitely affect the accuracy of the DEM derivative. 20
11 3.1 contd. Sources and Accuracies of DEM ACCURACIES o Ground Survey methods have achieved DEM of 0.60m over a very wide area(author s lab result). o For heights from SPOT images standard deviations of 2.97m for flat and open terrain and 3.66m for forest areas have been achieved. ofor heights from SRTM X-band 3.97m for open and 4.49m for forest areas have been achieved. owhile for SRTM C-band, 4.25m for open and 6.14m for forest areas have been achieved and for ASTER 7.29mforopenand8.08mforforestareashavebeen achieved(sefercik et al, 2007) A Sample Application of Digital Elevation Model in Delineating Drainage Routes A sample use of the DEM in environmental phenomenon analyses was carried out in Owerri South East Nigeria to determine the storm water runoff natural flow routes using a DEMoftheprojectarea. 22


12 Fig. 3.1a Map of Nigeria with XXV LGAs, International showing Federation Imo of Surveyors State South East Nigeria in deep red colour Orsu Ideato North Okigwe Legend Orlu Ideato South Unuimo Study area boundary imo state <all other values> LGAS Aboh-Mbaise Ahazu Mbaise Oru West Nkwere Ehime Mbano Ezinihitte Mbaise Oru East Mjaba Isu Nwangele Ideato North Ideato South Ikeduru Isiala Mbano Isu Oguta Isiala Mbano Ehime Mbano Mbaitolu Mjaba Ngor-Okpala Nkwere Nwangele Obowo Oguta Mbaitolu Obowo Ohaji/Egbema Okigwe Orlu Ikeduru Ahazu Mbaise Orsu Oru East Oru West Owerri Municipal Owerri North Owerri West Unuimo Subcatchments Owerri West Owerri Municipal Text Owerri North Aboh-Mbaise Ezinihitte Mbaise <all other values> Area Ohaji/Egbema Ngor-Okpala Scale: 1:250, Kilometers Fig. 3.1b Map of Imo State with LGAs, showing the project area in red 24
13 Fig 3c: Map of the Project Area 25 A FLOW CHART OF THE Delineation of Drainage Routes and Sub-catchments INPUT DATA Topographical data of the project area DIGITAL DATA CAPTURE Scanning, Georeferencing and Digitizing of topographical maps, ground survey data, photogrammetric data, Satellite images, SRTM, ASTER, LIDAR data etc DATA PROCESSING Conversion of Topo Data to Digital Elevation Model (DEM) Check for Adequacy of Topo Data, Errors and Sinks in the Digital Elevation Model (DEM) Processing the DEM to produce Flow Direction Grid Processing the Flow Direction Grid to produce Flow Accumulation Grid Processing the Flow Direction & Flow Accumulation Grids to produce the Stream Segmentation Grid (Stream Link Grid) Processing the Flow Direction Grid and the Stream Link Grid to produce the Drainage Line Feature Class DELINEATED RUNOFF FLOW ROUTE OF THE PROJECT AREA Fig. 4 Flow Chart of the DEM based delineation of drainage routes and sub-catchments 26
14 3.2.1 DATA ACQUISITION The research essentially involved the analysis of topographic data of the about Sq. Km,(18, Ha) project area. Thankfully topographic maps of the wide area of coverage of Owerri Nucleus area were made available by the Imo State Surveyor General and the Head of the Survey Department, Owerri Capital Development Authority Scale: 1:100, Kilometers Fig. 5 Georeferenced Topo Maps of the Project Area in mosaic 28
15 THE RESULTING DIGITAL CONTOUR OF THE PROJECT AREA Contours Legend Scale: 1:100, Kilometers Congress, Kuala Lumpur, Malaysia, Fig. 6 Resulting Contour of the Project Area THE RESULTING DIGITAL SPOT HEIGHT OF THE PROJECT AREA Kilometers Scale: 1:100,000 Fig. 7 Resulting Congress, SpotKuala Height of 16the Lumpur, Malaysia, 21 Project Area 30


16 3.2.2 DATA PROCESSING AND ANALYSIS DEMThe Digital Elevation Model (DEM) created in ArcGISusing the contour features. The DEM is a digital grid in which each cell holds the elevation value of the land space the cell represents. 31 Fig. 8 Screen Print ofdemof the Project Area DEM VALIDATION The DEM was validated using orthometric heights derived from GPS surveys of random points across the project area. The full details are in the paper proper. But Table 1 shows the statistics Table 1: Statistics of the Validation: GPS orthometric height value minus DEM value Only Points All Points Range Average RMSE XXV International Federation of Surveyors
17 COMPARING WITH OTHER POSSIBLE SOURCES OF DEM SOURCES RMSE Open Areas OF DEMRMSE Forest Areas SPOT -flat terrain 2.97m 3.66m SRTM X-band 3.97m 4.49m SRTM C-band 4.25m 6.14m ASTER 7.29m 8.08m Validated Topo Map Without and outlier distorted site 0.598m With 2% outlier of badly distorted site 1.947m NW 64 N 128 NE 16 W 1 E 8 SW 4 S 2 SE Fig. 9 Flow Direction Scheme 34

18 DIGITAL ELEVATION MODEL FLOW DIRECTION SCHEME Fig. 10 Digital Flow Direction Scheme 35 Figure 11 Flow Accumulation Grid Figure 12 Drainage Route Cells 36
19 Runoff Flow Routes Figure 13 Drainage Route cell Stream Definition Grid Scheme Legend OwDrainageLine Scale: 1:82, Kilometers Fig. 14 Stream Definition XXV International Grid Federation of the of Surveyors project area using 20 cell accumulation threshold 38
20 140-cell Stream Definition Grid Contd. The resulting Stream Definition Grid is shown hereunder Legend OwDrainageLine Scale: 1:82, Kilometers Fig. 15 Stream XXV International Definition Federation of Surveyors Grid of 140 cell accumulation threshold Drainage Line Processing Legend OwDrainageLine Scale: 1:82, Kilometers Fig. 16 Owerri Drainage Network. 40
21 Manually generated drainage area polygons with the drainage lines creates the drainage map Legend OwDrainageLine Subcatchments <all other values> Area Scale: 1:82, Kilometers Fig. 17 Drainage Map of Owerri SITE VALIDATION OF DRAINAGE AREAS On 6 th October 2011 and 20 th July 2012 visits weretakento 3 ofthesitesdelineatedinthe analyses to be drainage lines to check their state of flooding or otherwise after the rains. It was discovered that they were heavily flooded. The photographs presented hereunder are those of the visited sites.. 42


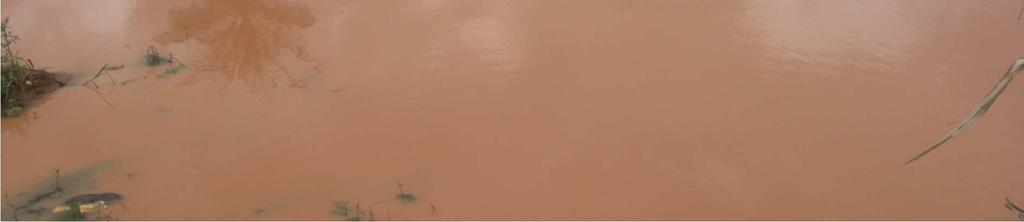
22 Works Layout Area 6 th October 2011 : Conduit C11 series. Fully developed pond now due to high runoff coefficient of a developed urban area. Plate 1 43 Works Layout Area6 th October 2011 : Conduit C11 series. Plate 2 44


23 Works Layout Area, 6 th October 2011: Conduit C11 series. Congress, Kuala Plate Lumpur, Malaysia, Federal Housing Estate 20 th July 2012: C14 series Plate 4 46


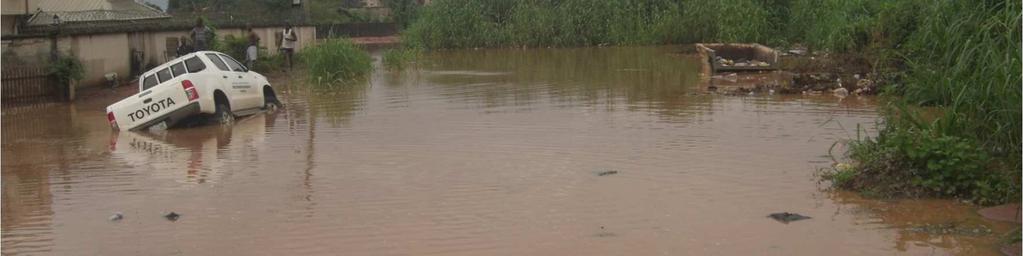
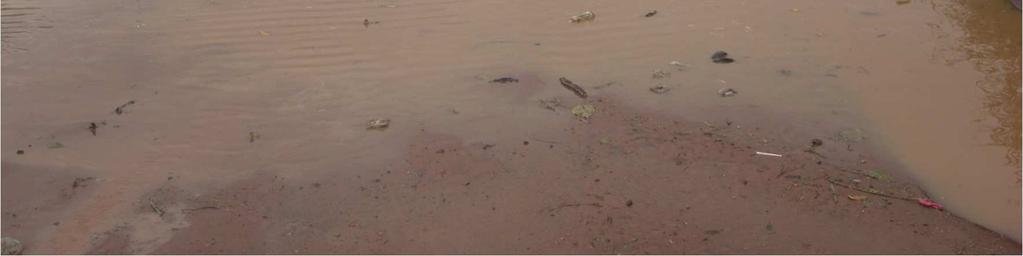
24 Federal Housing Estate: 20th July 2012 C14 series Congress, Kuala Lumpur, Malaysia, Plate 5 47 Federal Housing Estate: 20th July 2012 C14 series Congress, Kuala Lumpur, Malaysia, Plate 6 48


25 Federal Housing Estate:20 th July 2012 C14 series Plate 7 49 Chukwuma Nwoha Road Area 20 July, 2012: C14 series Plate 8 50
26 3.2.6 Results and Discussion The demarcation of the natural flow routes holds an advantage in selecting best drainage routes for the drainage network design of the city. This is very useful both in designing the main network of a virgin area for future development, or when responding to drainage needs of an already existing urban area. The demarcated flow routes are of high advantage in drainage design since the slope of the routes, their lengths and their end coordinates are extracted as resultsoftheresearchonagisplatform. The results of the research also include the delineation and characterization of the straight units of the flow routes and the determined 23 sub-catchments of the project area of Owerri Results and Discussion Contd. These are very important tools in flood mitigation, erosion control, urban area planning, urban development monitoring and management, engineering design of drainage facilities, the studies of distribution of water borne diseases, sediment transportation and agriculture. The results of the research demonstrate the importance of the DEM in the analyses of flow environmental phenomena such as erosion, sediment transportation and flooding analyses andmodellingandsoon. 52
27 4.0 SURVEYOR -EDUCATION ISSUES FOR DEM DEVELOPMENT Training curricula of Colleges and Universities in the developing world are reviewed relatively slowly. The need to develop curricula that equip students of Surveying and Geoinformatics in Nigeria and possibly other parts with the necessary skills required for the processing and application of the highly dynamic topographical data structures of the Digital Elevation Models is obvious. It has been suggested elsewhere that the need to continually developing and improving efficient algorithms on terrains is an interesting area of research. It notes that the GIS developers, GIS researchers, and computational geometers can work together to develop a number of elegant and efficient solutions to practical problems on terrains. The analysis of efficiency of these solutions should be based on realistic assumptions on terrains Kreveld(1996) CONCLUSION AND RECOMMENDATION 54
28 4.1 CONCLUSION It is obvious that the Digital Elevation Model (DEM) is the way forward for quantitative and qualitative oriented topographical and environmental analyses. In the entire field of the geosciences the use of the DEM for terrain phenomenon characterizing and modelling and Digital Terrain Analysis (DTA) is obviously unlimited. The DEM has been shown to be the most important factor in the Digital Terrain Model and this is an indicator of the central position of properly skilled surveyors across the field of the geosciences RECOMMENDATIONS DEM development as a computational science is being driven by computational geometry. The need however remains for the role of the surveyors given the complex issues of datum transformations, geoidal models, accurate geospatial measurements and georeferencing or geolocation for all geospatial analyses. The call for the development of curricula of the institutions that train surveyors to include training for skills needed for expressing topographic data in the Digital Elevation Data Structure and for effective application of the DEM is inevitable. 56
29 THANK YOU 57 References 1. Bertolo, F., 2000,Catchment Delineation and Characterization,EC-JRC, (EUR EN), Space Applications Institute, Joint Research Center, European Commission, Ispra(VA), Italy 2. Florinsky, I. V., 2012, Digital Terrain Analysis in Soil Science and Geology, Elsevier, Oxford. W51/paper/Sefercik_jac_oruc_maramgoz.pdf 3. Jancaitis, J. R., 1978, Elevation Data Compaction by Polynomial Modeling. Report No. ETL-0140, p. 42, Fort Belvoir, VA: U.S., Army Engineer Topographic Laboratories. 4. Jordan, G., 2007, Digital Terrain Analysis in a GIS Environment: Concepts and Development: Digital Terrain Modeling. pp 1-43, Berlin Heidelberg, Springer- Verlag 5. Kreveld, M.V., 1996, Digital Elevation Models: Overview and Selected TIN Algorithms, In Course Notes for the CISM Advanced School on Algorithmic Foundations of Geographic Information Systems Kumler, M. P., 1994, An Intensive Comparison of Triangulated Irregular Networks (TINs) and Digital Elevation Models(DEMs). Cartographica, 31, 1_99. 58
30 References Contd. 7. Lo, C. P. andyeung, A.K.W., 2002, Concepts and Techniques of Geographic Information Systems, New Jersey, Prentice Hall, Inc. 8. Maidment, D.R. ed., 2002, Arc Hydro: GIS for Water Resources, California, ESRI.. 8. Mark, D. M., 1979, Phenomenon-Based Data-Structuring and Digital Terrain Modelling. Geo-Processing, 1, 27_ Mark, D. M., 1984, Automated Detection of Drainage Networks from Digital Elevation Models. Cartographica, 21, 1_ Schroder, P., & Sweldens, W., 2000, Spherical Wavelets: Efficiently Representing Functions on a Sphere. Lecture Notes in Earth Sciences, 90, 158_ Sefercik, U., Jacobsen, K., Oruc, M., Marangoz, A., 2007, Comparison of SPOT, SRTM, and ASTER DEMs, Proc. International Society of Photogrammetry and Remote SensingXXXVI-1/W Strakhov, V. N., 200, Change of epochs in Earth sciences. Russian Journal of Earth Sciences, 9, ES1001, doi: /2007es Wieczorek, M. A., 2007, Gravity and Topography of the Terrestrial Planets, In T. Spohn(ed.), Treatise on Geophysics, Vol. 10, pp. 165_206, Amsterdam Elsevier. 59
MAPPING POTENTIAL LAND DEGRADATION IN BHUTAN
 MAPPING POTENTIAL LAND DEGRADATION IN BHUTAN Moe Myint, Geoinformatics Consultant Rue du Midi-8, CH-1196, Gland, Switzerland moemyint@bluewin.ch Pema Thinley, GIS Analyst Renewable Natural Resources Research
ENGRG Introduction to GIS
 ENGRG 59910 Introduction to GIS Michael Piasecki March 17, 2014 Lecture 08: Terrain Analysis Outline: Terrain Analysis Earth Surface Representation Contour TIN Mass Points Digital Elevation Models Slope
ENGRG Introduction to GIS
 ENGRG 59910 Introduction to GIS Michael Piasecki November 17, 2017 Lecture 11: Terrain Analysis Outline: Terrain Analysis Earth Surface Representation Contour TIN Mass Points Digital Elevation Models Slope
HYDROLOGIC AND WATER RESOURCES EVALUATIONS FOR SG. LUI WATERSHED
 HYDROLOGIC AND WATER RESOURCES EVALUATIONS FOR SG. LUI WATERSHED 1.0 Introduction The Sg. Lui watershed is the upper part of Langat River Basin, in the state of Selangor which located approximately 20
MODULE 7 LECTURE NOTES 5 DRAINAGE PATTERN AND CATCHMENT AREA DELINEATION
 MODULE 7 LECTURE NOTES 5 DRAINAGE PATTERN AND CATCHMENT AREA DELINEATION 1. Introduction Topography of the river basin plays an important role in hydrologic modelling, by providing information on different
EMERGENCY PLANNING IN NORTHERN ALGERIA BASED ON REMOTE SENSING DATA IN RESPECT TO TSUNAMI HAZARD PREPAREDNESS
 EMERGENCY PLANNING IN NORTHERN ALGERIA BASED ON REMOTE SENSING DATA IN RESPECT TO TSUNAMI HAZARD PREPAREDNESS Barbara Theilen-Willige Technical University of Berlin, Institute of Applied Geosciences Department
An Introduction to Geographic Information System
 An Introduction to Geographic Information System PROF. Dr. Yuji MURAYAMA Khun Kyaw Aung Hein 1 July 21,2010 GIS: A Formal Definition A system for capturing, storing, checking, Integrating, manipulating,
Introduction to GIS I
 Introduction to GIS Introduction How to answer geographical questions such as follows: What is the population of a particular city? What are the characteristics of the soils in a particular land parcel?
Application of Remote Sensing and GIS in Seismic Surveys in KG Basin
 P-318 Summary Application of Remote Sensing and GIS in Seismic Surveys in KG Basin M.Murali, K.Ramakrishna, U.K.Saha, G.Sarvesam ONGC Chennai Remote Sensing provides digital images of the Earth at specific
Remote Sensing and GIS Applications for Hilly Watersheds SUBASHISA DUTTA DEPARTMENT OF CIVIL ENGINEERING IIT GUWAHATI
 Remote Sensing and GIS Applications for Hilly Watersheds SUBASHISA DUTTA DEPARTMENT OF CIVIL ENGINEERING IIT GUWAHATI Deciding Alternative Land Use Options in a Watershed Using GIS Source: Anita Prakash
Digital Elevation Models. Using elevation data in raster format in a GIS
 Digital Elevation Models Using elevation data in raster format in a GIS What is a Digital Elevation Model (DEM)? Digital representation of topography Model based on scale of original data Commonly a raster
Determination of flood risks in the yeniçiftlik stream basin by using remote sensing and GIS techniques
 Determination of flood risks in the yeniçiftlik stream basin by using remote sensing and GIS techniques İrfan Akar University of Atatürk, Institute of Social Sciences, Erzurum, Turkey D. Maktav & C. Uysal
Multi-sourced 3D Geospatial Terrain Modelling: Issues and Challenges
 10th Conference on Cartography and Geoinformation, Zagreb, Croatia Multi-sourced 3D Geospatial Terrain Modelling: Issues and Challenges Prof. Dr. Yerach Doytsher Mapping and Geo-Information Engineering,
Dr. S.SURIYA. Assistant professor. Department of Civil Engineering. B. S. Abdur Rahman University. Chennai
 Hydrograph simulation for a rural watershed using SCS curve number and Geographic Information System Dr. S.SURIYA Assistant professor Department of Civil Engineering B. S. Abdur Rahman University Chennai
Applied Cartography and Introduction to GIS GEOG 2017 EL. Lecture-2 Chapters 3 and 4
 Applied Cartography and Introduction to GIS GEOG 2017 EL Lecture-2 Chapters 3 and 4 Vector Data Modeling To prepare spatial data for computer processing: Use x,y coordinates to represent spatial features
Graduate Courses Meteorology / Atmospheric Science UNC Charlotte
 Graduate Courses Meteorology / Atmospheric Science UNC Charlotte In order to inform prospective M.S. Earth Science students as to what graduate-level courses are offered across the broad disciplines of
13 Watershed Delineation & Modeling
 Module 4 (L12 - L18): Watershed Modeling Standard modeling approaches and classifications, system concept for watershed modeling, overall description of different hydrologic processes, modeling of rainfall,
Integrating Geographical Information Systems (GIS) with Hydrological Modelling Applicability and Limitations
 with Hydrological Modelling Applicability and Limitations") Integrating Geographical Information Systems (GIS) with Hydrological Modelling Applicability and Limitations Rajesh VijayKumar Kherde *1, Dr. Priyadarshi. H. Sawant #2 * Department of Civil Engineering,
Integrating Geographical Information Systems (GIS) with Hydrological Modelling Applicability and Limitations Rajesh VijayKumar Kherde *1, Dr. Priyadarshi. H. Sawant #2 * Department of Civil Engineering,
PROANA A USEFUL SOFTWARE FOR TERRAIN ANALYSIS AND GEOENVIRONMENTAL APPLICATIONS STUDY CASE ON THE GEODYNAMIC EVOLUTION OF ARGOLIS PENINSULA, GREECE.
 PROANA A USEFUL SOFTWARE FOR TERRAIN ANALYSIS AND GEOENVIRONMENTAL APPLICATIONS STUDY CASE ON THE GEODYNAMIC EVOLUTION OF ARGOLIS PENINSULA, GREECE. Spyridoula Vassilopoulou * Institute of Cartography
Hazard Mapping Along the Dead Sea Shoreline
 FIG Working Week in Marrakech, Morocco 18-22 May 2011 Hazard Mapping Along the Dead Sea Shoreline Rami Al-Ruzouq, Abdullah Al-Zuobi, AbdEl-Rahman Abueladas, Emad Akkawi Department of Surveying and Geomatics
4. GIS Implementation of the TxDOT Hydrology Extensions
 4. GIS Implementation of the TxDOT Hydrology Extensions A Geographic Information System (GIS) is a computer-assisted system for the capture, storage, retrieval, analysis and display of spatial data. It
Popular Mechanics, 1954
 Introduction to GIS Popular Mechanics, 1954 1986 $2,599 1 MB of RAM 2017, $750, 128 GB memory, 2 GB of RAM Computing power has increased exponentially over the past 30 years, Allowing the existence of
Hydrologic Engineering Applications of Geographic Information Systems
 Hydrologic Engineering Applications of Geographic Information Systems Davis, California Objectives: The participant will acquire practical knowledge and skills in the application of GIS technologies for
DEM-based Ecological Rainfall-Runoff Modelling in. Mountainous Area of Hong Kong
 DEM-based Ecological Rainfall-Runoff Modelling in Mountainous Area of Hong Kong Qiming Zhou 1,2, Junyi Huang 1* 1 Department of Geography and Centre for Geo-computation Studies, Hong Kong Baptist University,
Application of high-resolution (10 m) DEM on Flood Disaster in 3D-GIS
 DEM on Flood Disaster in 3D-GIS") Risk Analysis V: Simulation and Hazard Mitigation 263 Application of high-resolution (10 m) DEM on Flood Disaster in 3D-GIS M. Mori Department of Information and Computer Science, Kinki University, Japan
Risk Analysis V: Simulation and Hazard Mitigation 263 Application of high-resolution (10 m) DEM on Flood Disaster in 3D-GIS M. Mori Department of Information and Computer Science, Kinki University, Japan
Introduction-Overview. Why use a GIS? What can a GIS do? Spatial (coordinate) data model Relational (tabular) data model
 data model Relational (tabular) data model") Introduction-Overview Why use a GIS? What can a GIS do? How does a GIS work? GIS definitions Spatial (coordinate) data model Relational (tabular) data model intro_gis.ppt 1 Why use a GIS? An extension
Introduction-Overview Why use a GIS? What can a GIS do? How does a GIS work? GIS definitions Spatial (coordinate) data model Relational (tabular) data model intro_gis.ppt 1 Why use a GIS? An extension
SUB CATCHMENT AREA DELINEATION BY POUR POINT IN BATU PAHAT DISTRICT
 SUB CATCHMENT AREA DELINEATION BY POUR POINT IN BATU PAHAT DISTRICT Saifullizan Mohd Bukari, Tan Lai Wai &Mustaffa Anjang Ahmad Faculty of Civil Engineering & Environmental University Tun Hussein Onn Malaysia
Basin characteristics
 Basin characteristics From hydrological processes at the point scale to hydrological processes throughout the space continuum: point scale à river basin The watershed characteristics (shape, length, topography,
1/28/16. EGM101 Skills Toolbox. Map types. Political Physical Topographic Climate Resource Road. Thematic maps (use one of the above as backdrop)
") EGM101 Skills Toolbox Map types Political Physical Topographic Climate Resource Road Thematic maps (use one of the above as backdrop) Map Types Deriving information from maps Hydrographic Geological Soils
EGM101 Skills Toolbox Map types Political Physical Topographic Climate Resource Road Thematic maps (use one of the above as backdrop) Map Types Deriving information from maps Hydrographic Geological Soils
Creating Watersheds and Stream Networks. Steve Kopp
 Creating Watersheds and Stream Networks Steve Kopp Workshop Overview Demo Data Understanding the tools Elevation Data Types DEM : Digital Elevation Model bare Earth DSM : Digital Surface Model Data Structure
Planning Road Networks in New Cities Using GIS: The Case of New Sohag, Egypt
 Planning Road Networks in New Cities Using GIS: The Case of New Sohag, Egypt Mostafa Abdel-Bary Ebrahim, Egypt Ihab Yehya Abed-Elhafez, Kingdom of Saudi Arabia Keywords: Road network evaluation; GIS, Spatial
A GIS-based Subcatchments Division Approach for SWMM
 Send Orders for Reprints to reprints@benthamscience.ae The Open Civil Engineering Journal, 2015, 9, 515-521 515 A GIS-based Subcatchments Division Approach for SWMM Open Access Shen Ji and Zhang Qiuwen
Governing Rules of Water Movement
 Governing Rules of Water Movement Like all physical processes, the flow of water always occurs across some form of energy gradient from high to low e.g., a topographic (slope) gradient from high to low
a system for input, storage, manipulation, and output of geographic information. GIS combines software with hardware,
 Introduction to GIS Dr. Pranjit Kr. Sarma Assistant Professor Department of Geography Mangaldi College Mobile: +91 94357 04398 What is a GIS a system for input, storage, manipulation, and output of geographic
Introduction to GIS. Dr. M.S. Ganesh Prasad
 Introduction to GIS Dr. M.S. Ganesh Prasad Department of Civil Engineering The National Institute of Engineering, MYSORE ganeshprasad.nie@gmail.com 9449153758 Geographic Information System (GIS) Information
Amitava Saha Research scholar IIT, Roorkee India
 Amitava Saha Research scholar IIT, Roorkee India amitava6@gmail.com Abstract Ponds are important sources of fresh water in the world. Ponds store surface runoff produced by the storms. Demarcation of the
Online Publication Date: 20 December, 2011 Publisher: Asian Economic and Social Society
 Online Publication Date: 20 December, 2011 Publisher: Asian Economic and Social Society Topographic Information System As A Tool For Environmental Management E.O. Oriola (Department of Geography & Environmental
Characterization of Catchments Extracted From. Multiscale Digital Elevation Models
 Applied Mathematical Sciences, Vol. 1, 2007, no. 20, 963-974 Characterization of Catchments Extracted From Multiscale Digital Elevation Models S. Dinesh Science and Technology Research Institute for Defence
Generation and analysis of Digital Elevation Model (DEM) using Worldview-2 stereo-pair images of Gurgaon district: A geospatial approach
 using Worldview-2 stereo-pair images of Gurgaon district: A geospatial approach") 186 Generation and analysis of Digital Elevation Model (DEM) using Worldview-2 stereo-pair images of Gurgaon district: A geospatial approach Arsad Khan 1, Sultan Singh 2 and Kaptan Singh 2 1 Department
186 Generation and analysis of Digital Elevation Model (DEM) using Worldview-2 stereo-pair images of Gurgaon district: A geospatial approach Arsad Khan 1, Sultan Singh 2 and Kaptan Singh 2 1 Department
8.9 Geographical Information Systems Advantages of GIS
 8.9 Geographical Information Systems A Geographic Information System (GIS) is a computer-based system that is used in input, storage, analysis manipulation, retrieval, and output, of spatial data. These
UPDATING AND REFINEMENT OF NATIONAL 1: DEM. National Geomatics Center of China, Beijing
 UPDATING AND REFINEMENT OF NATIONAL 1:500000 DEM Jian-jun LIU a, Dong-hua WANG a, Yao-ling SHANG a, Wen-hao ZHAO a Xi KUAI b a National Geomatics Center of China, Beijing 100830 b School of Resources and
GIS Techniques for Floodplain Delineation. Dean Djokic
 GIS Techniques for Floodplain Delineation Dean Djokic (ddjokic@esri.com) Content What is a floodplain? How to get a floodplain? What can GIS do for floodplain modeling? Simple GIS techniques for floodplain
COMPARISON OF DIGITAL ELEVATION MODELLING METHODS FOR URBAN ENVIRONMENT
 COMPARISON OF DIGITAL ELEVATION MODELLING METHODS FOR URBAN ENVIRONMENT Cahyono Susetyo Department of Urban and Regional Planning, Institut Teknologi Sepuluh Nopember, Indonesia Gedung PWK, Kampus ITS,
THE DIGITAL TERRAIN MAP LIBRARY: AN EXPLORATIONIST S RESOURCE
 THE DIGITAL TERRAIN MAP LIBRARY: AN EXPLORATIONIST S RESOURCE By I.C.L. Webster, P.J. Desjardins and W.E. Kilby KEYWORDS: digital terrain maps, digital terrain stability maps, surficial geology, GIS, raster
ABSTRACT The first chapter Chapter two Chapter three Chapter four
 ABSTRACT The researches regarding this doctoral dissertation have been focused on the use of modern techniques and technologies of topography for the inventory and record keeping of land reclamation. The
Hydrological and surface analysis using remote sensing & GIS techniques in parts of Nalgonda district, Telangana, India
 2017; 3(7): 1272-1276 ISSN Print: 2394-7500 ISSN Online: 2394-5869 Impact Factor: 5.2 IJAR 2017; 3(7): 1272-1276 www.allresearchjournal.com Received: 18-05-2017 Accepted: 20-06-2017 Shankaraiah Katla Praveen
ESRI GIS For Mining Seminar, 10 th August, 2016, Nairobi, Kenya. Spatial DATA Solutions for Mining
 ESRI GIS For Mining Seminar, 10 th August, 2016, Nairobi, Kenya Spatial DATA Solutions for Mining Spatial Data Solutions for Mining Spatial - Data that identifies the geographic location of features &
GIS feature extraction tools in diverse landscapes
 CE 394K.3 GIS in Water Resources GIS feature extraction tools in diverse landscapes Final Project Anna G. Kladzyk M.S. Candidate, Expected 2015 Department of Environmental and Water Resources Engineering
Yrd. Doç. Dr. Saygın ABDİKAN Öğretim Yılı Güz Dönemi
 Yabancı Dil III (YDL285) Introduction to Geomatics Yrd. Doç. Dr. Saygın ABDİKAN 2017-2018 Öğretim Yılı Güz Dönemi 1 géomatique Geo (Earth) + informatics Geodesy + Geoinformatics Geomatics: The mathematics
CREATING AND EVALUATING HIGH RESOLUTION DEM S FOR AN URBAN ENVIRONMENT FROM DIGITAL CARTOGRAPHIC PRODUCTS
 CREATING AND EVALUATING HIGH RESOLUTION DEM S FOR AN URBAN ENVIRONMENT FROM DIGITAL CARTOGRAPHIC PRODUCTS Carter, J.R. 1 and Tripathy, D. 2 1 Geography-Geology Department, Illinois State University, Normal,
FLOOD HAZARD AND RISK ASSESSMENT IN MID- EASTERN PART OF DHAKA, BANGLADESH
 FLOOD HAZARD AND RISK ASSESSMENT IN MID- EASTERN PART OF DHAKA, BANGLADESH Muhammad MASOOD MEE07180 Supervisor: Prof. Kuniyoshi TAKEUCHI ABSTRACT An inundation simulation has been done for the mid-eastern
SPATIAL AND TEMPORAL ANALYSIS OF THE DEGRADATION OF NATURAL RESOURCES IN RIVER LIKODRA WATERSHED
 Soil Erosion Modelling JRC Ispra 20-21-22 March 2017 University of Belgrade, Faculty of Forestry Department for Ecological Engineering in Protection of Soil and Water Resources SPATIAL AND TEMPORAL ANALYSIS
USING GIS CARTOGRAPHIC MODELING TO ANALYSIS SPATIAL DISTRIBUTION OF LANDSLIDE SENSITIVE AREAS IN YANGMINGSHAN NATIONAL PARK, TAIWAN
 CO-145 USING GIS CARTOGRAPHIC MODELING TO ANALYSIS SPATIAL DISTRIBUTION OF LANDSLIDE SENSITIVE AREAS IN YANGMINGSHAN NATIONAL PARK, TAIWAN DING Y.C. Chinese Culture University., TAIPEI, TAIWAN, PROVINCE
Landform Classification in Raster Geo-images
 Landform Classification in Raster Geo-images Marco Moreno, Serguei Levachkine, Miguel Torres, and Rolando Quintero Geoprocessing Laboratory-Centre for Computing Research-National Polytechnic Institute,
Hydrologic Modelling of the Upper Malaprabha Catchment using ArcView SWAT
 Hydrologic Modelling of the Upper Malaprabha Catchment using ArcView SWAT Technical briefs are short summaries of the models used in the project aimed at nontechnical readers. The aim of the PES India
USING 3D GIS TO ASSESS ENVIRONMENTAL FLOOD HAZARDS IN MINA
 King Fahd University of Petroleum & Minerals College of Environmental Design Geographical Information system USING 3D GIS TO ASSESS ENVIRONMENTAL FLOOD HAZARDS IN MINA Prepared by : Ali AL-Zahrani OUTLINE
General Overview and Facts about the Irobland
 Using Geoinformation Science to Reveal the Impact of the Eritrea-Ethiopia Boundary Commission s Decision on Irobland and People By Alema Tesfaye, Washington DC, USA Part I General Overview and Facts about
ENV208/ENV508 Applied GIS. Week 1: What is GIS?
 ENV208/ENV508 Applied GIS Week 1: What is GIS? 1 WHAT IS GIS? A GIS integrates hardware, software, and data for capturing, managing, analyzing, and displaying all forms of geographically referenced information.
Watershed Delineation in GIS Environment Rasheed Saleem Abed Lecturer, Remote Sensing Centre, University of Mosul, Iraq
 Watershed Delineation in GIS Environment Rasheed Saleem Abed Lecturer, Remote Sensing Centre, University of Mosul, Iraq Abstract: The management and protection of watershed areas is a major issue for human
GIS and Remote Sensing
 Spring School Land use and the vulnerability of socio-ecosystems to climate change: remote sensing and modelling techniques GIS and Remote Sensing Katerina Tzavella Project Researcher PhD candidate Technology
Appendix C. Questionnaire Summary of Responses Geographic Information Systems
 Appendix C Questionnaire Summary of Responses Geographic Information Systems 1. Is your agency using or planning use of GIS for: a. general mapping (e.g. highway routes, political boundaries, etc.) b.
ACCURACY ASSESSMENT OF ASTER GLOBAL DEM OVER TURKEY
 ACCURACY ASSESSMENT OF ASTER GLOBAL DEM OVER TURKEY E. Sertel a a ITU, Civil Engineering Faculty, Geomatic Engineering Department, 34469 Maslak Istanbul, Turkey sertele@itu.edu.tr Commission IV, WG IV/6
2013 Esri Europe, Middle East and Africa User Conference October 23-25, 2013 Munich, Germany
 2013 Esri Europe, Middle East and Africa User Conference October 23-25, 2013 Munich, Germany Environmental and Disaster Management System in the Valles Altos Region in Carabobo / NW-Venezuela Prof.Dr.habil.Barbara
Automatic Change Detection from Remote Sensing Stereo Image for Large Surface Coal Mining Area
 doi: 10.14355/fiee.2016.05.003 Automatic Change Detection from Remote Sensing Stereo Image for Large Surface Coal Mining Area Feifei Zhao 1, Nisha Bao 2, Baoying Ye 3, Sizhuo Wang 4, Xiaocui Liu 5, Jianyan
GIS Geographic Information System
 GIS Geographic Information System Andrea Petroselli Tuscia University, Italy petro@unitus.it SUMMARY Part 1: Part 2: Part 3: Part 4: What is a GIS? Why do we need a GIS? Which are the possibilities of
Test Bank Chapter 2: Representations of Earth
 Multiple Choice Test Bank Chapter 2: Representations of Earth 1. A rhumb line on a Mercator projection is a line of. a. true size b. true shape c. true compass bearing d. true location 2. Maximum longitude
Chapter 1 Overview of Maps
 Chapter 1 Overview of Maps In this chapter you will learn about: Key points when working with maps General types of maps Incident specific maps Map legend and symbols Map sources A map is a navigational
International Journal of Advance Engineering and Research Development
 Scientific Journal of Impact Factor (SJIF): 4.72 International Journal of Advance Engineering and Research Development Volume 4, Issue 5, May -2017 Watershed Delineation of Purna River using Geographical
Digital Elevation Model
 Digital Elevation Model DEM, DSM, DTM? DSM: digital surface model. Height of the earth s surface, including houses, trees, boulders...etc. DTM: digital terrain model. Bare-earth earth surface model. Filtered
Geo-hazard Potential Mapping Using GIS and Artificial Intelligence
 Geo-hazard Potential Mapping Using GIS and Artificial Intelligence Theoretical Background and Uses Case from Namibia Andreas Knobloch 1, Dr Andreas Barth 1, Ellen Dickmayer 1, Israel Hasheela 2, Andreas
MONITORING AND MODELING NATURAL AND ANTHROPOGENIC TERRAIN CHANGE
 MONITORING AND MODELING NATURAL AND ANTHROPOGENIC TERRAIN CHANGE Spatial analysis and simulations of impact on landscape processess Helena MITASOVA, Russell S. HARMON, David BERNSTEIN, Jaroslav HOFIERKA,
IJESRT INTERNATIONAL JOURNAL OF ENGINEERING SCIENCES & RESEARCH TECHNOLOGY
 IJESRT INTERNATIONAL JOURNAL OF ENGINEERING SCIENCES & RESEARCH TECHNOLOGY Use of Digital Elevation Model to compute Storm Water Drainage Network Manisha Desai *1, Dr. J. N. Patel 2 *1 Ph. D. Student of
INTERNATIONAL JOURNAL OF PURE AND APPLIED RESEARCH IN ENGINEERING AND TECHNOLOGY
 INTERNATIONAL JOURNAL OF PURE AND APPLIED RESEARCH IN ENGINEERING AND TECHNOLOGY A PATH FOR HORIZING YOUR INNOVATIVE WORK SPECIAL ISSUE FOR NATIONAL LEVEL CONFERENCE "SUSTAINABLE TECHNOLOGIES IN CIVIL
USING LIDAR MEASUREMENTS FOR IMPROVING OR UP-DATING A DEM
 JAES_1(14)_3_2011 VAIS M. et. all, pp.123-128 SECTION Geodesic Engineering USING LIDAR MEASUREMENTS FOR IMPROVING OR UP-DATING A DEM VAIS Manuel*, IOSIF Gheorghe, Bucharest University, *e-mail: manuel.vais@sipg.ro
Scientific registration n : 2180 Symposium n : 35 Presentation : poster MULDERS M.A.
 Scientific registration n : 2180 Symposium n : 35 Presentation : poster GIS and Remote sensing as tools to map soils in Zoundwéogo (Burkina Faso) SIG et télédétection, aides à la cartographie des sols
DATA SOURCES AND INPUT IN GIS. By Prof. A. Balasubramanian Centre for Advanced Studies in Earth Science, University of Mysore, Mysore
 DATA SOURCES AND INPUT IN GIS By Prof. A. Balasubramanian Centre for Advanced Studies in Earth Science, University of Mysore, Mysore 1 1. GIS stands for 'Geographic Information System'. It is a computer-based
GEO-DATA INPUT AND CONVERSION. Christos G. Karydas,, Dr. Lab of Remote Sensing and GIS Director: Prof. N. Silleos
 Christos G. Karydas,, Dr. xkarydas@agro.auth.gr http://users.auth.gr/xkarydas Lab of Remote Sensing and GIS Director: Prof. N. Silleos School of Agriculture Aristotle University of Thessaloniki, GR 1 0.
A GENERALIZATION OF CONTOUR LINE BASED ON THE EXTRACTION AND ANALYSIS OF DRAINAGE SYSTEM
 A GENERALIZATION OF CONTOUR LINE BASED ON THE EXTRACTION AND ANALYSIS OF DRAINAGE SYSTEM Tinghua Ai School of Resource and Environment Sciences Wuhan University, 430072, China, tinghua_ai@tom.com Commission
URBAN WATERSHED RUNOFF MODELING USING GEOSPATIAL TECHNIQUES
 URBAN WATERSHED RUNOFF MODELING USING GEOSPATIAL TECHNIQUES DST Sponsored Research Project (NRDMS Division) By Prof. M. GOPAL NAIK Professor & Chairman, Board of Studies Email: mgnaikc@gmail.com Department
Topographic Maps and Landforms Geology Lab
 Topographic Maps and Landforms Geology Lab Ray Rector: Instructor Today s Lab Activities 1) Discussion of Last Week s Lab 2) Lecture on Topo Maps and Elevation Contours 3) Construct Topographic Maps and
Hendra Pachri, Yasuhiro Mitani, Hiro Ikemi, and Ryunosuke Nakanishi
 21 2nd International Conference on Geological and Civil Engineering IPCBEE vol. 8 (21) (21) IACSIT Press, Singapore DOI: 1.7763/IPCBEE. 21. V8. 2 Relationships between Morphology Aspect and Slope Failure
Positional accuracy of the drainage networks extracted from ASTER and SRTM for the Gorongosa National Park region - Comparative analysis
 Positional accuracy of the drainage networks extracted from ASTER and SRTM for the Gorongosa National Park region - Comparative analysis Tiago CARMO 1, Cidália C. FONTE 1,2 1 Departamento de Matemática,
NR402 GIS Applications in Natural Resources
 NR402 GIS Applications in Natural Resources Lesson 1 Introduction to GIS Eva Strand, University of Idaho Map of the Pacific Northwest from http://www.or.blm.gov/gis/ Welcome to NR402 GIS Applications in
Topographical Change Monitoring for Susceptible Landslide Area Determination by Using Multi-Date Digital Terrain Models and LiDAR
 Topographical Change Monitoring for Susceptible Landslide Area Determination by Using Multi-Date Digital Terrain Models and Chanist PRASERTBURANAKUL 1, Parkorn SUWANICH 2, Kanchana NAKHAPAKORN 3, and Sukit
Regionalization Methods for Watershed Management - Hydrology and Soil Erosion from Point to Regional Scales
 This paper was peer-reviewed for scientific content. Pages 1062-1067. In: D.E. Stott, R.H. Mohtar and G.C. Steinhardt (eds). 2001. Sustaining the Global Farm. Selected papers from the 10th International
Welcome to NetMap Portal Tutorial
 Welcome to NetMap Portal Tutorial Potential Applications What Can you do with the Portal? At least 25 things! 1) Locate the best potential fish habitats. 2) Identify biological hotspots. 3) Map floodplain
Use of Geospatial data for disaster managements
 Use of Geospatial data for disaster managements Source: http://alertsystemsgroup.com Instructor : Professor Dr. Yuji Murayama Teaching Assistant : Manjula Ranagalage What is GIS? A powerful set of tools
CS 350 A Computing Perspective on GIS
 CS 350 A Computing Perspective on GIS What is GIS? Definitions A powerful set of tools for collecting, storing, retrieving at will, transforming and displaying spatial data from the real world (Burrough,
Lab 1: Importing Data, Rectification, Datums, Projections, and Coordinate Systems
 Lab 1: Importing Data, Rectification, Datums, Projections, and Coordinate Systems Topics covered in this lab: i. Importing spatial data to TAS ii. Rectification iii. Conversion from latitude/longitude
ENVIRONMENTAL MONITORING Vol. II - Applications of Geographic Information Systems - Ondieki C.M. and Murimi S.K.
 APPLICATIONS OF GEOGRAPHIC INFORMATION SYSTEMS Ondieki C.M. and Murimi S.K. Kenyatta University, Kenya Keywords: attribute, database, geo-coding, modeling, overlay, raster, spatial analysis, vector Contents
Geospatial Data, Services, and Products. National Surveying, mapping and geospatial conference
 Geospatial Data, Services, and Products Federal Programs -- USDA NRCS National Surveying, mapping and geospatial conference March 15, 2016 NRCS Applications using Geosaptial Products & Services Field
WERENSKIOLD GLACIER (SW SPITSBERGEN) MORPHOMETRIC CHARACTERISTICS
 MORPHOMETRIC CHARACTERISTICS") WERENSKIOLD GLACIER (SW SPITSBERGEN) MORPHOMETRIC CHARACTERISTICS Abstract Małgorzata Wieczorek Instytut Geografii I Rozwoju Regionalnego Uniwersytet Wrocławski pl. Uniwersytecki 1 50-137 Wrocław POLAND
WERENSKIOLD GLACIER (SW SPITSBERGEN) MORPHOMETRIC CHARACTERISTICS Abstract Małgorzata Wieczorek Instytut Geografii I Rozwoju Regionalnego Uniwersytet Wrocławski pl. Uniwersytecki 1 50-137 Wrocław POLAND
Lidar-derived Hydrography as a Source for the National Hydrography Dataset
 Lidar-derived Hydrography as a Source for the National Hydrography Dataset Lidar-Derived Hydrography, Bathymetry, and Topobathymetry in the National Hydrography Dataset and 3-Dimensional Elevation Program
What is GIS? Introduction to data. Introduction to data modeling
 What is GIS? Introduction to data Introduction to data modeling 2 A GIS is similar, layering mapped information in a computer to help us view our world as a system A Geographic Information System is a
CONVERTING A NEXRAD MAP TO A FLOODPLAIN MAP. Oscar Robayo, Tim Whiteaker, and David Maidment*
 CONVERTING A NEXRAD MAP TO A FLOODPLAIN MAP Oscar Robayo, Tim Whiteaker, and David Maidment* ABSTRACT: Using ArcGIS 9.0 ArcObjects and the new ModelBuilder environment, a methodology for converting a NEXRAD
Multicriteria GIS Modelling of Terrain Susceptibility to Gully Erosion, using the Example of the Island of Pag
 14th International Conference on Geoinformation and Cartography Zagreb, September 27-29, 2018. Multicriteria GIS Modelling of Terrain Susceptibility to Gully Erosion, using the Example of the Island of
CATCHMENT AND OVERLAND FLOW PATHWAY DELINEATION USING LIDAR AND GIS GRID BASED APPROACH IN URBAN STORMWATER AND SEWER NETWORK MODELS
 CATCHMENT AND OVERLAND FLOW PATHWAY DELINEATION USING LIDAR AND GIS GRID BASED APPROACH IN URBAN STORMWATER AND SEWER NETWORK MODELS Thomas Joseph (AWT) ABSTRACT This paper presents specific examples comparing
Introduction to Geographic Information Systems (GIS): Environmental Science Focus
: Environmental Science Focus") Introduction to Geographic Information Systems (GIS): Environmental Science Focus September 9, 2013 We will begin at 9:10 AM. Login info: Username:!cnrguest Password: gocal_bears Instructor: Domain: CAMPUS
Introduction to Geographic Information Systems (GIS): Environmental Science Focus September 9, 2013 We will begin at 9:10 AM. Login info: Username:!cnrguest Password: gocal_bears Instructor: Domain: CAMPUS
Submitted to. Prepared by
 Prepared by Tim Webster, PhD Candace MacDonald Applied Geomatics Research Group NSCC, Middleton Tel. 902 825 5475 email: tim.webster@nscc.ca Submitted to Harold MacNeil Engineering Manager Halifax Water
INTEGRATION OF HIGH RESOLUTION QUICKBIRD IMAGES TO GOOGLEEARTH
 INTEGRATION OF HIGH RESOLUTION QUICKBIRD IMAGES TO GOOGLEEARTH M. Alkan a, *, U.G. Sefercik a, M. Oruç a a ZKU, Engineering Faculty, 67100 Zonguldak, Turkey - (mehmetalkan44@yahoo.com) Interactive Sessions,