A METHODOLOGY FOR ASSESSING OPENSTREETMAP DEGREE OF COVERAGE FOR PURPOSES OF LAND COVER MAPPING
|
|
|
- Sophia Kelley
- 6 years ago
- Views:
Transcription
1 A METHODOLOGY FOR ASSESSING OPENSTREETMAP DEGREE OF COVERAGE FOR PURPOSES OF LAND COVER MAPPING A. Ribeiro a, b *, C.C. Fonte c a Civil Engineering Department, Coimbra Institute of Engineering, Coimbra, Portugal alexr@isec.pt b Centre for Informatics and Systems (CISUC), University of Coimbra, Coimbra, Portugal c Department of Mathematics, University of Coimbra / INESC Coimbra, Coimbra, Portugal cfonte@mat.uc.pt Commission II, WG II/4 KEY WORDS: Volunteered Geographic Information (VGI), OpenStreetMap (OSM), Coverage, Land Cover Map Creation, Land Cover Map Validation ABSTRACT: The data available in the collaborative project OpenStreetMap (OSM) is in some locations so detailed and complete that it may provide useful data for Land Cover Map creation and validation. However, this degree of detail is not uniform along space. Therefore, one of the first requirements that needs to be assessed to determine if the creation and validation of Land Cover Maps using data available in OSM may be feasible, is the availability of data to provide a relatively complete coverage of the region of interest. To provide a fast and automatic quantitative assessment of this requirement a methodology is presented and tested in this article. Four study areas are considered, all located in Europe. The results show that the four regions presented very different coverages at the time of data download and its spatial distribution was not uniform. This approach enabled the identification of the most problematic regions for land cover mapping, where low levels of data coverage are available. Since the proposed methodology can be automated, it enables a fast identification of the regions that, in a preliminary analysis, may be considered fit for further analysis to assess fitness for use for Land Cover Map creation and/or validation. 1.! INTRODUCTION Land Cover Maps (LCM) are fundamental for many applications, such as environmental planning, climate change analysis or hydrologic modelling (Foody, 2002; Verburg et al. 2011; Nie et al. 2011). These maps are usually created through the classification of satellite imagery and are validated using reference databases that are created either through photointerpretation of satellite or aerial images and/or field visits. However, alternative approaches both for LCM creation and validation have been tried, using alternative data sources (e.g. Fritz et al, 2012, See, et al., 2013, Foody and Boyd, 2013, Jokar Arsanjani et al., 2013, Estima et al., 2014). The term Volunteer Geographical Information (VGI) is a term proposed by Goodchild (2007) that refers to geographical information provided voluntarily by individuals. This type of data can be also referred to as, for example, Collaboratively Contributed Geospatial Information (Birsh and Kuhn, 2007; Keßler et al., 2009), or Contributed Geographical Information (Harvey, 2013). OpenStreetMap (OSM) is one of the most well-known VGI projects. It includes vector data about a large diversity of features, such as Buildings, Highways, Waterways, Landuse, Natural features and Points of Interest (OSM Wiki, 2014). The data created is open and can be copied, distributed and changed as long as credit is given to OSM. The data is created and edited continuously by the volunteers, and therefore the available information has a dynamic nature, which has the potential to enable a fast adaptation to the changing world. However, the data available at OSM presents very heterogeneous characteristics, regarding both the amount of data available and its quality (Mooney et al. 2010). This heterogeneity goes from regions with an impressive quantity and quality of information, which can even be more complete than authoritative data (Neis et al., 2011), to regions with no data at all. The data available in OSM is so detailed in some regions that it enables the creation of LCM (Jokar Arsanjani et al., 2013). Its use for LCM validation was already made as auxiliary information (Bontemps et al., 2011; Fonte et al., 2015). Its potential use as the only source of data was also already analyzed and tested (Martinho and Fonte, 2015; Estima and Painho, 2013). However, the use of OSM for these applications requires that the data available has enough quality; which can be assessed in its several aspects, such as positional and thematic quality, completeness, currency and logical consistency. Since the assessment of data quality in all these dimensions is not an easy and fast process, before starting the assessment of the traditional data quality aspects, a preliminary analysis may be done to determine if enough data is available. Therefore, a first step to determine the fitness for use of OSM data for LCM purposes may be to assess its availability. To make this initial assessment, since LCM are spatially exhaustive, and therefore no empty space is supposed to exist, the degree of spatial coverage (used in this article to express the percentage of space with available data) is the aspect used to determine if the data may be considered or not as potentially usable for LCM creation and/or validation. In this article an automated methodology is presented to determine the OSM data coverage for a grid of cells with user defined size. The proposed operator is applied to several case * Corresponding author 297

2 studies, the obtained results are presented and conclusions are drawn. 2.! METHODOLOGY The diversity of features available in OSM enables the classification of the majority of phenomena occurring at the earth surface. Therefore, the aim of the operator developed is to assess the proportion of space occupied by the spatial elements available in OSM for a grid of cells chosen by the user, providing the here called degree of coverage of the earth surface for each cell. The data available in OSM is in a vector format, consisting of points, lines and polygons. Since point and linear features do not occupy any area in the terrain, those that represent phenomena that in reality have area extents and are relevant for land cover, such as roads and waterways, need to be assigned to an area feature. Therefore, some pre-processing of this type of data is necessary to assess the degree of coverage. This is done considering buffer regions around these features, with an extent dependent on the type of feature and local characteristics (Jokar Arsanjani et al., 2013). The proposed operator to assess OSM data coverage was developed for data downloaded using the methodology adopted by Geofabrik for freely available shapefiles, consisting of the following levels: Roads (which is a sub-feature of Highway), Railways, Waterways, Landuse, Natural and Buildings. The proposed methodology includes the following steps, indicated in Figure 1: 1.! Extract data from the considered OSM levels; 2.! Create buffers around the linear features that should have an area extent, namely roads, railways and water lines. The buffer widths applied to roads and water lines are based on their category. For the roads different widths are considered for primary roads, secondary and residential roads and for the water features different widths are associated to rivers, streams and canals; 3.! Merge OSM features (polygons) of all levels; 4.! Create a grid of rectangular cells and compute the area of each cell; 5.! Overlay the grid and the OSM map layers, identifying the intersection of the grid cells with the OSM features; 6.! Dissolve OSM features boundaries by cell ID; 7.! Compute the area of the OSM generated feature included in each cell and join this information to the grid, using the cell ID; 8.! For each grid cell compute the coverage index (CI) given by Equation (1). Figure 1. Workflow of the methodology used to assess OSM data degree of coverage. 3.! CASE STUDIES The proposed operator was applied to four regions. The chosen regions are all located in Europe, namely in the United Kingdom (UK), France, Ireland and Portugal. Regions were considered where different degrees of coverage were expected to exist, according to the data provided by Geofabrik ( 3.1! Study Areas The studied areas were: Greater London in the UK; the city of Dublin in Ireland; the city of Paris in France; and the municipality of Coimbra in Portugal. Figure 2 shows the OSM data available for the four regions. For the Greater London and the municipality of Coimbra, the spatial extent given by the bounding box was cut by the administrative boundary. For Dublin, the bounding box was cut with the coastline. 3.2! OSM Data Processing (1) The datasets were obtained from the Geofabrik website ( and consist of the free version of shapefiles of the levels roads, railways, waterways, landuse, natural and buildings. These files were pre-processed by Geofabrik from XML OSM file (.osm). Table 1 summarizes the main characteristics of the datasets used. 298
 1867 Paris (France) 18/11/2014 (2.161 W/48.941 N, 2.533 E/8.777 N) 500 Dublin (Ireland) (6.584 W/53.493 N, 28/10/2014 6.050 W/53.")
 The original OSM data are in the WGS84 geographic reference system.")


3 ISPRS Annals of the Photogrammetry, Remote Sensing and Spatial Information Sciences, Volume II-3/W5, 2015 Study area Date Bounding box1 Area (km2) Greater London (UK) 21/10/2014 (0.525 W/ N, E/ N) 1867 Paris (France) 18/11/2014 (2.161 W/ N, E/8.777 N) 500 Dublin (Ireland) (6.584 W/ N, 28/10/ W/ N) 1057 Municipality of Coimbra (Portugal) 25/11/2014 a) (8.592 W/ N, W/ N) 372 Table 1. Main characteristics of the datasets b) The original OSM data are in the WGS84 geographic reference system. The grids created in the fourth step of the workflow were also created in this reference system. For each case study two grids of square cells were generated, with dimensions of 0.01 and degrees, respectively, which were overlaid with the OSM data. The geodesic cell s area was computed (in km2) and therefore there are some area variations for the regions located in different regions of the Earth and also among cells of the same region, when the region is relatively large, as for the London area. Table 2 shows the number of cells considered for all study areas for both grid sizes as well as their mean and total area. c) Grids used per Number of study area cells 2367 London Paris Dublin Coimbra 1507 Total grid area (km2) Cell s mean area (km2) Table 2. Characteristics of the grids used for each study area. d) The buffers width, used is step 2 of the workflow to generate areas from the linear features, were estimated by visual inspection over an image layer. Equal values were used for features with the same characteristics in the four study areas. 3.3! Results and Discussion The application of the presented methodology identifies the percentage of each grid cell that is covered with OSM data. Figure 3 and Figure 4 show the results obtained per cell for the four considered regions for grids 1 and 2, respectively. Figure 5 shows the number of cells with the percentage of coverage in each of the bins, with a range of 10%, for the study areas for both grids. Table 3 and Table 4 show some statistical indicators obtained for the regions under analysis, namely the mean coverage, standard deviation, maximum and minimum values, as well as the 25%, 50% and 75% quartiles for each study area, respectively for grids 1 and 2. Figure 2. Study areas: a) London, United Kingdom; b) Paris, France; c) Dublin, Ireland; d) Coimbra, Portugal. 1 (upper left latitude/longitude, lower right latitude/longitude) 299


 Paris; France, c) Dublin,")


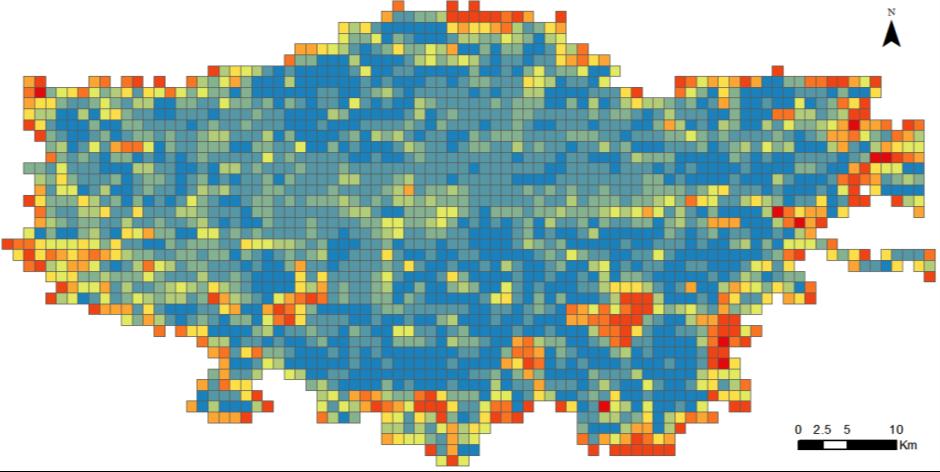
4 a) a) b) b) c) c) d) d) Units: Percentage Figure 3. Maps representing the percentage of OSM data coverage for grid 1 for: a) London; United Kingdom, b) Paris; France, c) Dublin, Ireland; d) Coimbra, Portugal. Units: Percentage Figure 4. Maps representing the percentage of OSM data coverage for grid 2 for: a) London; United Kingdom, b) Paris; France, c) Dublin, Ireland; d) Coimbra, Portugal. 300
5 therefore most of the coverage comes from the streets that were already inserted in OSM. However, a closer analysis of the OSM data shows that there are landuse features of the type residential available that were not in the data downloaded using Geofabrik, since they are represented as a relation, and the free shapefiles generated by Geofabrick do not support this type of data (Geofabrick, 2015). The results obtained for the two grids considered present in general low differences, except larger differences for the 80%, 90% and 100% bins. For the 100% bin the cell s coverage increased from 27% to 38 % with the decrease of the grid size. Statistical indicators London Paris Dublin Coimbra Mean coverage (%) Standard deviation (%) Maximum (%) Minimum (%) % Quartile (%) % Quartile (%) % Quartile (%) Table 3. Statistical analysis of the OSM coverage in the study areas obtained for grid 1. Statistical indicators London Paris Dublin Coimbra Mean coverage (%) Standard deviation (%) Maximum (%) Minimum (%) % Quartile (%) % Quartile (%) % Quartile (%) Table 4. Statistical analysis of the OSM coverage in the study areas obtained for grid 2. Figure 5. Histograms representing the number of cells by percentage of coverage for: a) London, United Kingdom, b) Paris, France, c) Dublin, Ireland, d) Coimbra, Portugal. The results show that the region with larger coverage of OSM data is the region of Greater London, where the 25% quartile corresponds to a coverage of 65% and 66% for grids 1 and 2 respectively and the 75% quartile to a coverage of 91% an 95% (Tables 3 and 4). The 90% and 100% bins contain more than 50% of the cells for both grid sizes and only a few regions within the study area show very low levels of coverage (Figure 5a)). An analysis over a satellite image of what exists in those regions indicates that they correspond to low density residential areas, whose buildings are not represented in OSM and For the region of Paris, from Figure 5b) and Tables 3 and 4, it can be seen that lower levels of coverage exist, when compared to the results obtained for London. The percentage of cells with coverage between 90% and 100% is much lower (9% for grid 1 and 12% for grid 2 Figure 5b)) and the 25% quartile corresponds to a coverage of 42% for grid 1 and 39% for grid 2, while the 50% and 75% quartile are respectively 56% and 70% for grid 1 and 54% and 73% for grid 2. It can also be seen that most cells have percentage of cover around 50%, which is very different from what was observed in the London area, where most cells have high levels of coverage. From Figures 2b), 3b) and 4b), it can be seen that the regions with better coverage in Paris correspond to vegetated areas. An analysis of the regions with less coverage also showed that some features available in OSM for the type leisure are missing from the data extracted from Geofabrick, such as golf-courses, even though they are available in the original OSM data. Since these features usually correspond to relatively large regions their omission generates some cells with low coverage. For the Dublin region there is a great number of cells with no information, corresponding mainly to cells that are further away from the city of Dublin (Figure 2c), 3c) and 4c)). The 25% quartile corresponds only to 4% and 2% respectively for grids 1 and 2. Cells with larger percentage of coverage do not correspond to the city centre but to some regions where there is more detailed land-use and natural information. The percentage of cells in all bins, except the first one, is relatively evenly distributed; with a small increase for higher levels of coverage percentage and a considerable increase for the 90% to 100% bin 301
6 for grid 2 (see Figure 5c)), which was also observed for the bin 0% to 10%. For this reason, the 75% quartile corresponds to a coverage value of 73% and 80% for grids 1 and 2 respectively, which is slightly larger than the one obtained for Paris. For the Coimbra region, the results show (Tables 3 and 4 and Figure 5d)) that the degree of coverage is very low. The 25%, 50% and 75% quartiles only take values of respectively 1%, 3% and 8% for both grids. The cells with larger coverage values are natural regions, corresponding most of them to rice fields along the Mondego river. These results show clearly that the data in most of Coimbra municipality is not enough to use for LCM purposes. The results obtained for both grid cell s size provide similar information, showing that the analysis may be started with larger cell sizes. If more refined information is needed the cell size may be decreased, providing more resolution on the spatial variability of the coverage. 4.! CONCLUSIONS The proposed approach enables to assess the degree of coverage of OSM data for a grid of cells with user defined dimensions. The approach is easily automated, requiring only the choice of the cell size and the prior identification of the typical width of the linear features that need to be converted to area features. In this study these values were chosen using a previous visual inspection for each region, but pre-defined values can be used for a full automation of the process. It should be stressed that this procedure raises problems of accuracy, since the real width of the elements represented by linear features may change considerably within the same area and from region to region. However, for this initial analysis of the percentage of coverage with OSM data, the errors generated by this lack of accuracy have in general low influence over the degree of coverage when the cells size is larger than the order of magnitude of the typical error committed with this approach, and therefore are not relevant. The results obtained with the proposed operator do not provide information about the accuracy of the OSM data but are useful to identify the regions where the data available may provide enough land cover information, and especially those that are not appropriate for further analysis, since too much data is missing. Therefore, it may be used as a rough indicator of data completeness to assess if OSM may be fit for use for LCM purposes. However, the fitness for use will then need to be analysed with additional methods to assess, for example, completeness in its traditional meaning and positional accuracy. Thus, the level of coverage acceptable to proceed to the next step of analysis needs to be identified for each application. The data used in the study areas presented in this analysis were freely downloaded using Geofabrick. A more detailed analysis of the regions showing less coverage than their surrounding showed that in some cases there was data missing from the downloaded shapefiles that is available in the original OSM data. This aspect should be taken in consideration when using OSM data for LCM, and the herein proposed approach showed to be useful to identify missing features from the data. Some studies showed that the use of OSM data for LCM creation or validation may be possible (Jokar Arsanjani et al., 2013, Martinho and Fonte, 2015), but this type of application of OSM data still presents many chalenges and several developments are necessary. One of the main problems is the conversion of OSM features to the LCM classes, particularly because of the diversity of attributes and attribute s values the volunteers can use in OSM. An additional problem is the positional accuracy of the data and the existence of overlapping features, which need to be transformed into only one feature class to produce traditional Land Cover information. Therefore, the approach proposed in this article represents only a contribution to the several developments that are still needed to enable the use of OSM data for LCM purposes. ACKNOWLEDGEMENTS This work was partially supported by Fundação para a Ciência e a Tecnologia (FCT) under the project grant UID/MULTI/00308/2013. REFERENCES Bontemps, S., et al., GLOBCOVER 2009: products description and validation report. European Space Agency. Report_2.2.pdf Estima, J. and Painho, M., Exploratory analysis of OpenStreetMap for land use classification. In: Proceedings of the Second ACM SIGSPATIAL International Workshop on Crowdsourced and Volunteered Geographic Information. New York, NY, USA: ACM, Estima, Jacinto, C.C. Fonte, and Marco Painho Comparative Study of Land Use/Cover Classification Using Flickr Photos, Satellite Imagery and Corine Land Cover Database. In 17th AGILE International Conference on Geographic Information Science. Castellon, Spain. Fonte, C.C., Bastin, L., See, L., Foody, G., Lupia, F., Usability of VGI for validation of land cover maps. International Journal of Geographical Information Science. Accepted. doi: / Foody, G. M "Status of land cover classification accuracy assessment." Remote Sensing of Environment 80: Foody, G.M., and D.S. Boyd Using Volunteered Data in Land Cover Map Validation: Mapping West African Forests. IEEE Journal of Selected Topics in Applied Earth Observations and Remote Sensing 6 (3): Fritz, Steffen, Ian McCallum, Christian Schill, Christoph Perger, Linda See, Dmitry Schepaschenko, Marijn van der Velde, Florian Kraxner, and Michael Obersteiner Geo- Wiki: An Online Platform for Improving Global Land Cover. Environmental Modelling & Software 31 (May): Geofabrick, Geofabrick Data Extracts Technical Details. Accessed 14th April Jokar Arsanjani, J., Helbich, M., Bakillah, M., Hagenauer, J., and Zipf, A., Toward mapping land-use patterns from volunteered geographic information. International Journal of Geographical Information Science, 27 (12),
7 Martinho, N., Fonte, C.C., Assessing the applicability of OpenStreetMap data to validate Land Use/Land Cover Maps. INESC Coimbra research report. Mooney, Peter, Padraig Corcoran, and Adam C. Winstanley Towards Quality Metrics for OpenStreetMap. In Proceedings of the 18th SIGSPATIAL International Conference on Advances in Geographic Information Systems, New York, NY, USA: ACM. Neis, P., Zielstra, D., and Zipf, A., The street network evolution of crowdsourced maps: OpenStreetMap in Germany Future Internet, 4 (4), Nie, W., et al., Assessing impacts of landuse and landcover changes on hydrology for the upper San Pedro watershed. Journal of Hydrology, 407 (1 4), OSM Wiki Map Features, accessed in 23rd December See, Linda, Ian McCallum, Steffen Fritz, Christoph Perger, Florian Kraxner, Michael Obersteiner, Ujjal Deka Baruah, Nitrashee Mili, and Napendra Ram Kalita Mapping Cropland in Ethiopia Using Crowdsourcing. International Journal of Geosciences 4 (6A1): Verburg, P. H., Neumann, K. and Nol, L., Challenges in Using Land Use and Land Cover Data for Global Change Studies. Global Change Biology 17 (2):
Instituto de Engenharia de Sistemas e Computadores de Coimbra Institute of Systems Engineering and Computers INESC - Coimbra
 Instituto de Engenharia de Sistemas e Computadores de Coimbra Institute of Systems Engineering and Computers INESC - Coimbra Nuno Martinho, Cidália C. Fonte Assessing the applicability of OpenStreetMap
Assessing OSM Road Positional Quality With Authoritative Data
 Assessing OSM Road Positional Quality With Authoritative Data Francisco ANTUNES 1, Cidália C. FONTE 1, Maria Antonia BROVELLI 2, Marco MINGHINI 2, Monia MOLINARI 2 and Peter MOONEY 3 1 Universidade de
LACO-WIKI: AN OPEN ACCESS ONLINE PORTAL FOR LAND COVER VALIDATION
 LACO-WIKI: AN OPEN ACCESS ONLINE PORTAL FOR LAND COVER VALIDATION L. See a, *, C. Perger a, M. Hofer b, J. Weichselbaum b, C. Dresel c, S. Fritz a a Ecosystems Services and Management Program, International
ASSESSING THE QUALITY OF OPEN SPATIAL DATA FOR MOBILE LOCATION-BASED SERVICES RESEARCH AND APPLICATIONS
 Archives of Photogrammetry, Cartography and Remote Sensing, Vol. 22, 2011, pp. 105-116 ISSN 2083-2214 ASSESSING THE QUALITY OF OPEN SPATIAL DATA FOR MOBILE LOCATION-BASED SERVICES RESEARCH AND APPLICATIONS
A conceptual model for quality assessment of VGI for the purpose of flood management
 A conceptual model for quality assessment of VGI for the purpose of flood management Lívia Castro Degrossi University of São Paulo São Carlos, Brazil Heidelberg University degrossi@icmc.usp.br João Porto
Generating WUDAPT s Specific Scale-dependent Urban Modelling and Activity Parameters: Collection of Level 1 and Level 2 Data
 ICUC9, Toulouse, France, 2015 Generating WUDAPT s Specific Scale-dependent Urban Modelling and Activity Parameters: Collection of Level 1 and Level 2 Data Linda See, Jason Ching 2, Valéry Masson 3, Johannes
AN AUTOMATED METHODOLOGY FOR CONVERTING OSM DATA INTO A LAND USE/COVER MAP
 AN AUTOMATED METHODOLOGY FOR CONVERTING OSM DATA INTO A LAND USE/COVER MAP Cidália Fonte (1,2), Marco Minghini (3), Vyron Antoniou (4), Linda See (5), Joaquim Patriarca (2), Maria Antonia Brovelli (3),
Employing Incremental Outlines for OpenStreetMap Data Updating
 Article Employing Incremental Outlines for OpenStreetMap Data Updating Hanfa Xing 1, *, Yuan Meng 2, *, Jun Chen 3, Jie Song 2 and Kaixuan Fan 2 1 School of Geography, South China Normal University, Guangzhou
Quality Evaluations on Canadian OpenStreetMap Data
 Quality Evaluations on Canadian OpenStreetMap Data Matthew Tenney 1 1 McGill University, Montreal, QC, Matthew.Tenney@mail.mcgill.ca Abstract The OpenStreetMap (OSM) project represents one of the more
Harmonizing Level of Detail in OpenStreetMap Based Maps
 Harmonizing Level of Detail in OpenStreetMap Based Maps G. Touya 1, M. Baley 1 1 COGIT IGN France, 73 avenue de Paris 94165 Saint-Mandé France Email: guillaume.touya{at}ign.fr 1. Introduction As OpenStreetMap
UNCERTAINTIES OF COMPLETENESS MEASURES IN OPENSTREETMAP A CASE STUDY FOR BUILDINGS IN A MEDIUM-SIZED GERMAN CITY
 UNCERTAINTIES OF COMPLETENESS MEASURES IN OPENSTREETMAP A CASE STUDY FOR BUILDINGS IN A MEDIUM-SIZED GERMAN CITY T. Törnros a,, H. Dorn a, S. Hahmann a, A. Zipf a a Chair of GIScience, Institute of Geography,
Usage of VGI for Validation of Land Cover Maps
 Usage of VGI for Validation of Land Cover Maps 1,2 Cidália C. Fonte, 3 Lucy Bastin, 4 Linda See, 5 Giles Foody, 6 Favio Lupia 1 Department of Mathematics, University of Coimbra, Coimbra, Portugal 2 Institute
INTERNATIONAL JOURNAL OF GEOMATICS AND GEOSCIENCES Volume 2, No 1, 2011
 INTERNATIONAL JOURNAL OF GEOMATICS AND GEOSCIENCES Volume 2, No 1, 2011 Copyright 2010 All rights reserved Integrated Publishing services Research article ISSN 0976 4380 Spatio-Temporal changes of Land
An outlook for OpenStreetMap
 An outlook for OpenStreetMap Peter Mooney This volume has presented OpenStreetMap in GIScience: experiences, research and applications with a collection of experiences and research carried out with OpenStreetMap
INTRODUCTION. 13 th AGILE International Conference on Geographic Information Science 2010 Page 1 of 15 Guimarães, Portugal
 13 th AGILE International Conference on Geographic Information Science 2010 Page 1 of 15 A Comparative Study of Proprietary Geodata and Volunteered Geographic Information for Germany Dennis Zielstra 1,
Positional accuracy of the drainage networks extracted from ASTER and SRTM for the Gorongosa National Park region - Comparative analysis
 Positional accuracy of the drainage networks extracted from ASTER and SRTM for the Gorongosa National Park region - Comparative analysis Tiago CARMO 1, Cidália C. FONTE 1,2 1 Departamento de Matemática,
Collecting a Ground Truth Dataset for OpenStreetMap
 Collecting a Ground Truth Dataset for OpenStreetMap Carsten Keßler Institute for Geoinformatics, University of Münster soon: Hunter College, CUNY http://carsten.io @carstenkessler Background Study: Can
Validation and verification of land cover data Selected challenges from European and national environmental land monitoring
 Validation and verification of land cover data Selected challenges from European and national environmental land monitoring Gergely Maucha head, Environmental Applications of Remote Sensing Institute of
Grant Agreement No. EIE/07/595/SI BEn
 Biomass energy register for sustainable site development for European regions Grant Agreement No. EIE/07/595/SI2.499697 BEn Biomass energy register for sustainable site development for European regions
Utilization of Global Map for Societal Benefit Areas
 Utilization of Global Map for Societal Benefit Areas The Fourth GEOSS AP Symposium Bali Indonesia, 11th March 2010 Shuhei Kojima Geographical Survey Institute Ministry of Land, Infrastructure, Transport
choice have on a particular application? For example, Fritz et al. (2010a) have shown that comparing global land cover (GLC-2000) with the equivalent
 have shown that comparing global land cover (GLC-2000) with the equivalent") Improving Global Land Cover through Crowd-sourcing and Map Integration L. See 1, S. Fritz 1, I. McCallum 1, C. Schill 2, C. Perger 3 and M. Obersteiner 1 1 International Institute for Applied Systems Analysis
Improving Global Land Cover through Crowd-sourcing and Map Integration L. See 1, S. Fritz 1, I. McCallum 1, C. Schill 2, C. Perger 3 and M. Obersteiner 1 1 International Institute for Applied Systems Analysis
UK Contribution to the European CORINE Land Cover
 Centre for Landscape andwww.le.ac.uk/clcr Climate Research CENTRE FOR Landscape and Climate Research UK Contribution to the European CORINE Land Cover Dr Beth Cole Corine Coordination of Information on
Can Volunteered Geographic Information be a participant in eenvironment and Spatial Data Infrastructures?
 Can Volunteered Geographic Information be a participant in eenvironment and Spatial Data Infrastructures? Peter Mooney and Padraig Corcoran National University of Ireland, Maynooth (NUIM) Email: peter.mooney@nuim.ie
Cross-Linkage Between Mapillary Street Level Photos and OSM Edits
 Cross-Linkage Between Mapillary Street Level Photos and OSM Edits Levente Juhász and Hartwig H. Hochmair Abstract Mapillary is a VGI platform which allows users to contribute crowdsourced street level
EO Information Services. Assessing Vulnerability in the metropolitan area of Rio de Janeiro (Floods & Landslides) Project
 Project") EO Information Services in support of Assessing Vulnerability in the metropolitan area of Rio de Janeiro (Floods & Landslides) Project Ricardo Armas, Critical Software SA Haris Kontoes, ISARS NOA World
EO Information Services in support of Assessing Vulnerability in the metropolitan area of Rio de Janeiro (Floods & Landslides) Project Ricardo Armas, Critical Software SA Haris Kontoes, ISARS NOA World
STEREO ANALYST FOR ERDAS IMAGINE Stereo Feature Collection for the GIS Professional
 STEREO ANALYST FOR ERDAS IMAGINE Stereo Feature Collection for the GIS Professional STEREO ANALYST FOR ERDAS IMAGINE Has Your GIS Gone Flat? Hexagon Geospatial takes three-dimensional geographic imaging
The Road to Data in Baltimore
 Creating a parcel level database from high resolution imagery By Austin Troy and Weiqi Zhou University of Vermont, Rubenstein School of Natural Resources State and local planning agencies are increasingly
Automated Assessment and Improvement of OpenStreetMap Data
 Automated Assessment and Improvement of OpenStreetMap Data Musfira Jilani 1, Padraig Corcoran 1, Michela Bertolotto 1 1 School of Computer Science and Informatics, University College Dublin, Ireland Tel.
Data Creation and Editing
 11.520:A Workshop on Geographical Information Systems 1.188: Urban Planning and Social Science Laboratory Data Creation and Editing Based in part on notes by Prof. Joseph Ferreira and Michael Flaxman Lulu
VGI and formal data. EEO / AGI (Scotland) seminar. David Fairbairn Newcastle University School of Civil Engineering & Geosciences
 seminar. David Fairbairn Newcastle University School of Civil Engineering & Geosciences") VGI and formal data EEO / AGI (Scotland) seminar David Fairbairn Newcastle University School of Civil Engineering & Geosciences VGI and formal data Investigating the possible interaction between informal
VGI and formal data EEO / AGI (Scotland) seminar David Fairbairn Newcastle University School of Civil Engineering & Geosciences VGI and formal data Investigating the possible interaction between informal
An Introduction to Geographic Information System
 An Introduction to Geographic Information System PROF. Dr. Yuji MURAYAMA Khun Kyaw Aung Hein 1 July 21,2010 GIS: A Formal Definition A system for capturing, storing, checking, Integrating, manipulating,
USING OPENSTREETMAP DATA TO GENERATE BUILDING MODELS WITH THEIR INNER STRUCTURES FOR 3D MAPS
 USING OPENSTREETMAP DATA TO GENERATE BUILDING MODELS WITH THEIR INNER STRUCTURES FOR 3D MAPS Zhiyong Wang, Alexander Zipf Heidelberg university, Im Neuenheimer Feld 368, 69120 Heidelberg, Germany - (zhiyong.wang,
Annotating Spatial Features in OpenStreetMap. Peter Mooney and Padraig Corcoran
 Annotating Spatial Features in OpenStreetMap Peter Mooney and Padraig Corcoran Department of Computer Science, National University of Ireland Maynooth, Maynooth,Co. Kildare. Ireland. email {peter.mooney,padraig.corcoran}@nuim.ie
Geo-spatial Analysis for Prediction of River Floods
 Geo-spatial Analysis for Prediction of River Floods Abstract. Due to the serious climate change, severe weather conditions constantly change the environment s phenomena. Floods turned out to be one of
Land cover validation game
 Land cover validation game Maria Antonia Brovelli1, Irene Celino2, Monia Elisa Molinari1, Vijaycharan Venkatachalam1 1 2 Politecnico di Milano, Como Campus, Via Valleggio 11, 22100, Como, Italy CEFRIEL
TRANSFORMATION THROUGH CLC WITH THE CONTINUOUS RESEARCH TECHNIQUES - GIS (OPEN CODE) AND RS (GEO-WEB SERVICES)
 AND RS (GEO-WEB SERVICES)") DOI 10.2478/pesd-2018-0036 PESD, VOL. 12, no. 2, 2018 TRANSFORMATION THROUGH CLC WITH THE CONTINUOUS RESEARCH TECHNIQUES - GIS (OPEN CODE) AND RS (GEO-WEB SERVICES) Florim Isufi 1, Shpejtim Bulliqi 2,
DOI 10.2478/pesd-2018-0036 PESD, VOL. 12, no. 2, 2018 TRANSFORMATION THROUGH CLC WITH THE CONTINUOUS RESEARCH TECHNIQUES - GIS (OPEN CODE) AND RS (GEO-WEB SERVICES) Florim Isufi 1, Shpejtim Bulliqi 2,
Multi agent Evacuation Simulation Data Model for Disaster Management Context
 Multi agent Evacuation Simulation Data Model for Disaster Management Context Mohamed Bakillah, Alexander Zipf, J. Andrés Domínguez, Steve H. L. Liang GI4DM 2012 1 Content Context Requirements for Enhanced
Display data in a map-like format so that geographic patterns and interrelationships are visible
 Vilmaliz Rodríguez Guzmán M.S. Student, Department of Geology University of Puerto Rico at Mayagüez Remote Sensing and Geographic Information Systems (GIS) Reference: James B. Campbell. Introduction to
International Journal of Intellectual Advancements and Research in Engineering Computations
 ISSN:2348-2079 Volume-5 Issue-2 International Journal of Intellectual Advancements and Research in Engineering Computations Agricultural land investigation and change detection in Coimbatore district by
An open source approach for the intrinsic assessment of the temporal accuracy, up-todateness and lineage of OpenStreetMap
 An open source approach for the intrinsic assessment of the temporal accuracy, up-todateness and lineage of OpenStreetMap Marco Minghini 1,2, Maria Antonia Brovelli 2, Francesco Frassinelli 2 1 European
USING GIS CARTOGRAPHIC MODELING TO ANALYSIS SPATIAL DISTRIBUTION OF LANDSLIDE SENSITIVE AREAS IN YANGMINGSHAN NATIONAL PARK, TAIWAN
 CO-145 USING GIS CARTOGRAPHIC MODELING TO ANALYSIS SPATIAL DISTRIBUTION OF LANDSLIDE SENSITIVE AREAS IN YANGMINGSHAN NATIONAL PARK, TAIWAN DING Y.C. Chinese Culture University., TAIPEI, TAIWAN, PROVINCE
New Land Cover & Land Use Data for the Chesapeake Bay Watershed
 New Land Cover & Land Use Data for the Chesapeake Bay Watershed Why? The Chesapeake Bay Program (CBP) partnership is in the process of improving and refining the Phase 6 suite of models used to inform
Louisiana Transportation Engineering Conference. Monday, February 12, 2007
 Louisiana Transportation Engineering Conference Monday, February 12, 2007 Agenda Project Background Goal of EIS Why Use GIS? What is GIS? How used on this Project Other site selection tools I-69 Corridor
Towards indicators of proximity to services in Europe's major cities
 Towards indicators of proximity to services in Europe's major cities Enhancing the analytical use of the GMES Urban Atlas in combination with population distribution data Hugo Poelman European Commission
USING OSM, GEO-TAGGED FLICKR PHOTOS AND AUTHORITATIVE DATA: A QUALITY PERSPECTIVE
 USING OSM, GEO-TAGGED FLICKR PHOTOS AND AUTHORITATIVE DATA: A QUALITY PERSPECTIVE Vyron Antoniou 1, Andriani Skopeliti 2, Cidália Fonte 3,4, Linda See 5, Seraphim Alvanides 6 1 Hellenic Army Academy, Leof.
Introduction to GIS I
 Introduction to GIS Introduction How to answer geographical questions such as follows: What is the population of a particular city? What are the characteristics of the soils in a particular land parcel?
Enhancing Crowdsourced Classification on Human Settlements Utilizing Logistic Regression Aggregation and Intrinsic Context Factors
 Enhancing Crowdsourced Classification on Human Settlements Utilizing Logistic Regression Aggregation and Intrinsic Context Factors Benjamin Herfort GIScience Chair Heidelberg University Im Neuenheimer
International Conference Analysis and Management of Changing Risks for Natural Hazards November 2014 l Padua, Italy
 Abstract Code: B01 Assets mapping products in support of preparedness and prevention measures (examples from Germany, Italy and France) Marc Mueller, Thierry Fourty, Mehdi Lefeuvre Airbus Defence and Space,
Compact guides GISCO. Geographic information system of the Commission
 Compact guides GISCO Geographic information system of the Commission What is GISCO? GISCO, the Geographic Information System of the COmmission, is a permanent service of Eurostat that fulfils the requirements
Characteristics of Heavily Edited Objects in OpenStreetMap
 Future Internet 2012, 4, 285-305; doi:10.3390/fi4010285 OPEN ACCESS future internet ISSN 1999-5903 www.mdpi.com/journal/futureinternet Article Characteristics of Heavily Edited Objects in OpenStreetMap
Geographic Knowledge Discovery Using Ground-Level Images and Videos
 This work was funded in part by a DOE Early Career award, an NSF CAREER award (#IIS- 1150115), and a PECASE award. We gratefully acknowledge NVIDIA for their donated hardware. Geographic Knowledge Discovery
LUIZ FERNANDO F. G. DE ASSIS, TÉSSIO NOVACK, KARINE R. FERREIRA, LUBIA VINHAS AND ALEXANDER ZIPF
 A discussion of crowdsourced geographic information initiatives and big Earth observation data architectures for land-use and land-cover change monitoring LUIZ FERNANDO F. G. DE ASSIS, TÉSSIO NOVACK, KARINE
Quality and Coverage of Data Sources
 Quality and Coverage of Data Sources Objectives Selecting an appropriate source for each item of information to be stored in the GIS database is very important for GIS Data Capture. Selection of quality
Volunteered Geographic Information and the Future of Geospatial Data
 Volunteered Geographic Information and the Future of Geospatial Data Cláudio Elízio Calazans Campelo Federal University of Campina Grande, Brazil Michela Bertolotto University College Dublin, Ireland Padraig
Assessment of Logical Consistency in OpenStreetMap Based on the Spatial Similarity Concept
 Assessment of Logical Consistency in OpenStreetMap Based on the Spatial Similarity Concept Peyman Hashemi and Rahim Ali Abbaspour Abstract The growth in the number of users and the volume of information
DATA SOURCES AND INPUT IN GIS. By Prof. A. Balasubramanian Centre for Advanced Studies in Earth Science, University of Mysore, Mysore
 DATA SOURCES AND INPUT IN GIS By Prof. A. Balasubramanian Centre for Advanced Studies in Earth Science, University of Mysore, Mysore 1 1. GIS stands for 'Geographic Information System'. It is a computer-based
Spatial Data Analysis with ArcGIS Desktop: From Basic to Advance
 Spatial Data Analysis with ArcGIS Desktop: From Basic to Advance 1. Course overview Modern environmental, energy as well as resource modeling and planning require huge amount of geographically located
Calculating the Natura 2000 network area in Europe: The GIS approach
 Calculating the Natura 2000 network area in Europe: The GIS approach 1. INTRODUCTION A precise area calculation is needed to check to what extent member states have designated Natura 2000 sites of their
Smart Citizens. Maria Antonia Brovelli Politecnico di Milano, Italy
 Smart Citizens Maria Antonia Brovelli Politecnico di Milano, Italy UN-GGIM Academic Network Forum Secure Land Rights and Smart Cities: Making It Work for Sustainable Development New York, 31 July 2017
Preparation of LULC map from GE images for GIS based Urban Hydrological Modeling
 International Conference on Modeling Tools for Sustainable Water Resources Management Department of Civil Engineering, Indian Institute of Technology Hyderabad: 28-29 December 2014 Abstract Preparation
Spanish national plan for land observation: new collaborative production system in Europe
 ADVANCE UNEDITED VERSION UNITED NATIONS E/CONF.103/5/Add.1 Economic and Social Affairs 9 July 2013 Tenth United Nations Regional Cartographic Conference for the Americas New York, 19-23, August 2013 Item
Introduction-Overview. Why use a GIS? What can a GIS do? Spatial (coordinate) data model Relational (tabular) data model
 data model Relational (tabular) data model") Introduction-Overview Why use a GIS? What can a GIS do? How does a GIS work? GIS definitions Spatial (coordinate) data model Relational (tabular) data model intro_gis.ppt 1 Why use a GIS? An extension
Introduction-Overview Why use a GIS? What can a GIS do? How does a GIS work? GIS definitions Spatial (coordinate) data model Relational (tabular) data model intro_gis.ppt 1 Why use a GIS? An extension
Abstract: Contents. Literature review. 2 Methodology.. 2 Applications, results and discussion.. 2 Conclusions 12. Introduction
 Abstract: Landfill is one of the primary methods for municipal solid waste disposal. In order to reduce the environmental damage and to protect the public health and welfare, choosing the site for landfill
This is trial version
 Journal of Rangeland Science, 2012, Vol. 2, No. 2 J. Barkhordari and T. Vardanian/ 459 Contents available at ISC and SID Journal homepage: www.rangeland.ir Full Paper Article: Using Post-Classification
GEOGRAPHIC INFORMATION SYSTEMS Session 8
 GEOGRAPHIC INFORMATION SYSTEMS Session 8 Introduction Geography underpins all activities associated with a census Census geography is essential to plan and manage fieldwork as well as to report results
Data Aggregation with InfraWorks and ArcGIS for Visualization, Analysis, and Planning
 Data Aggregation with InfraWorks and ArcGIS for Visualization, Analysis, and Planning Stephen Brockwell President, Brockwell IT Consulting, Inc. Join the conversation #AU2017 KEYWORD Class Summary Silos
Development of a server to manage a customised local version of OpenStreetMap in Ireland
 Development of a server to manage a customised local version of OpenStreetMap in Ireland BłaŜej Ciepłuch 1, Jianghua Zheng 1, Peter Mooney 1,2, Adam C. Winstanley 1 1 Department of Computer Science, National
Fundamental Geospatial Datasets in Africa. Andre Nonguierma New York, 03 August 2015
 Fundamental Geospatial Datasets in Africa United Nations Economic Commission for Africa Geoinformation & Spatial Statistics Andre Nonguierma New York, 03 August 2015 Core Data : Lack of consistency Infrastructure
POLIMI ACTIVITIES urban data collection and preprocessing
 Project Meeting, 22 January 2018, Rome PRIN PROJECT: URBAN GEOmatics for Bulk Information Generation, Data Assessment and Technology Awareness POLIMI ACTIVITIES urban data collection and preprocessing
Spatial Data Science. Soumya K Ghosh
 Workshop on Data Science and Machine Learning (DSML 17) ISI Kolkata, March 28-31, 2017 Spatial Data Science Soumya K Ghosh Professor Department of Computer Science and Engineering Indian Institute of Technology,
Software for Landuse Management: Modelling with GIS
 O. R. SODEINDE, Nigeria Key words: ABSTRACT Land use management has been a very important issue in the planning and maintenance of environmental and economic development of a geographic area. Therefore,
THE OVERALL EAGLE CONCEPT
 Sentinel Hub THE OVERALL EAGLE CONCEPT GEBHARD BANKO, 30. MAY 2018, COPENHAGEN ISO TC 211, STANDARDS IN ACTION SEMINAR CONTENT Background and Motivation Criteria and Structure of Data Model Semantic decomposition
A GIS-based Approach to Watershed Analysis in Texas Author: Allison Guettner
 Texas A&M University Zachry Department of Civil Engineering CVEN 658 Civil Engineering Applications of GIS Instructor: Dr. Francisco Olivera A GIS-based Approach to Watershed Analysis in Texas Author:
Citizen-generated spatial data and information: Risks and Opportunities
 Citizen-generated spatial data and information: Risks and Opportunities Peter Mooney, Huabo Sun, Padraig Corcoran and Lei Yan Institute of Remote Sensing and GIS, Beijing Key Lab of Spatial Information
A General Framework for Conflation
 A General Framework for Conflation Benjamin Adams, Linna Li, Martin Raubal, Michael F. Goodchild University of California, Santa Barbara, CA, USA Email: badams@cs.ucsb.edu, linna@geog.ucsb.edu, raubal@geog.ucsb.edu,
Quality analysis of the Parisian OSM toponyms evolution
 CHAPTER 8 Quality analysis of the Parisian OSM toponyms evolution Vyron Antoniou*, Guillaume Touya and Ana-Maria Raimond *Hellenic Military Academy, Greece, v.antoniou@ucl.ac.uk Laboratoire COGIT, Institut
Geography 38/42:376 GIS II. Topic 1: Spatial Data Representation and an Introduction to Geodatabases. The Nature of Geographic Data
 Geography 38/42:376 GIS II Topic 1: Spatial Data Representation and an Introduction to Geodatabases Chapters 3 & 4: Chang (Chapter 4: DeMers) The Nature of Geographic Data Features or phenomena occur as
GIS Level 2. MIT GIS Services
 GIS Level 2 MIT GIS Services http://libraries.mit.edu/gis Email: gishelp@mit.edu TOOLS IN THIS WORKSHOP - Definition Queries - Create a new field in the attribute table - Field Calculator - Add XY Data
Road & Railway Network Density Dataset at 1 km over the Belt and Road and Surround Region
 Journal of Global Change Data & Discovery. 2017, 1(4): 402-407 DOI:10.3974/geodp.2017.04.03 www.geodoi.ac.cn 2017 GCdataPR Global Change Research Data Publishing & Repository Road & Railway Network Density
SPATIAL-TEMPORAL ANALYSIS OF OPENSTREETMAP DATA AFTER NATURAL DISASTERS: A CASE STUDY OF HAITI UNDER HURRICANE MATTHEW
 SPATIAL-TEMPORAL ANALYSIS OF OPENSTREETMAP DATA AFTER NATURAL DISASTERS: A CASE STUDY OF HAITI UNDER HURRICANE MATTHEW Jin Xu, Longxi Li, Qi Zhou* Faculty of Information Engineering, China University of
Understanding Community Mapping as a Socio-Technical Work Domain
 Understanding Community Mapping as a Socio-Technical Work Domain Mark Iliffe 1, Robert J. Houghton 2 and Jeremy Morley 3 1 Horizon Doctoral Training Centre, The University of Nottingham Tel. (0115) 8232316
SOLUTIONS ADVANCED GIS. TekMindz are developing innovative solutions that integrate geographic information with niche business applications.
 ADVANCED GIS SOLUTIONS TekMindz are developing innovative solutions that integrate geographic information with niche business applications. TEK INDZ TM GIS Services Overview At the leading edge of geospatial
Introduction to Geographic Information Systems (GIS): Environmental Science Focus
: Environmental Science Focus") Introduction to Geographic Information Systems (GIS): Environmental Science Focus September 9, 2013 We will begin at 9:10 AM. Login info: Username:!cnrguest Password: gocal_bears Instructor: Domain: CAMPUS
Introduction to Geographic Information Systems (GIS): Environmental Science Focus September 9, 2013 We will begin at 9:10 AM. Login info: Username:!cnrguest Password: gocal_bears Instructor: Domain: CAMPUS
DATA INTEGRATION FOR PAN EUROPEAN LAND COVER MONITORING. Victor van KATWIJK Geodan IT
 DATA INTEGRATION FOR PAN EUROPEAN LAND COVER MONITORING Victor van KATWIJK Geodan IT victor@geodan.nl Wideke BOERSMA CSO, The Netherlands w.boersma@bunnik.cso.nl Sander MÜCHER Alterra, the Netherlands
Methodological Chain for Hydrological Management with Web-GIS Applications
 Advances in Geosciences Konstantinos Perakis & Athanasios Moysiadis, Editors EARSeL, 2012 Methodological Chain for Hydrological Management with Web-GIS Applications Alexandros Konstantinidis 1, Eleni Tzanou
I&CLC2000 in support to new policy initiatives (INSPIRE, GMES,..)
") I&CLC2000 in support to new policy initiatives (INSPIRE, GMES,..) Manfred Grasserbauer, Director Joint Research Centre Institute for Environment and Sustainability 1 IMAGE 2000 European mosaic of satellite
I&CLC2000 in support to new policy initiatives (INSPIRE, GMES,..) Manfred Grasserbauer, Director Joint Research Centre Institute for Environment and Sustainability 1 IMAGE 2000 European mosaic of satellite
Geographical Information System GIS
 Geographical Information System GIS LOOM.02.331 anto.aasa@ut.ee Scale GIS and spatial planning National Regional Local Strategic (National Dev. Plan) National Goals and development policy Tactical (Regional
ACCURACY ASSESSMENT OF ASTER GLOBAL DEM OVER TURKEY
 ACCURACY ASSESSMENT OF ASTER GLOBAL DEM OVER TURKEY E. Sertel a a ITU, Civil Engineering Faculty, Geomatic Engineering Department, 34469 Maslak Istanbul, Turkey sertele@itu.edu.tr Commission IV, WG IV/6
Huron Creek Watershed 2005 Land Use Map
 Huron Creek Watershed 2005 Land Use Map Created By: Linda Kersten, 12/20/06 Created For: MTU Introduction to GIS Class (FW 5550) The Huron Creek Watershed Advisory Committee Michigan Technological University,
Bentley Map Advancing GIS for the World s Infrastructure
 Bentley Map Advancing GIS for the World s Infrastructure Presentation Overview Why would you need Bentley Map? What is Bentley Map? Where is Bentley Map Used? Why would you need Bentley Map? Because your
7.1 INTRODUCTION 7.2 OBJECTIVE
 7 LAND USE AND LAND COVER 7.1 INTRODUCTION The knowledge of land use and land cover is important for many planning and management activities as it is considered as an essential element for modeling and
The Annotation Process in OpenStreetMap[Not for distribution]
![The Annotation Process in OpenStreetMap[Not for distribution]](/thumbs/78/78706019.jpg "The Annotation Process in OpenStreetMap[Not for distribution]") The Annotation Process in OpenStreetMap[Not for distribution] Peter Mooney 1 and Padraig Corcoran 2 1. Department of Computer Science, National University of Ireland Maynooth, Maynooth,Co. Kildare. Ireland.
The Annotation Process in OpenStreetMap[Not for distribution] Peter Mooney 1 and Padraig Corcoran 2 1. Department of Computer Science, National University of Ireland Maynooth, Maynooth,Co. Kildare. Ireland.
PC ARC/INFO and Data Automation Kit GIS Tools for Your PC
 ESRI PC ARC/INFO and Data Automation Kit GIS Tools for Your PC PC ARC/INFO High-quality digitizing and data entry Powerful topology building Cartographic design and query Spatial database query and analysis
GIS = Geographic Information Systems;
 What is GIS GIS = Geographic Information Systems; What Information are we talking about? Information about anything that has a place (e.g. locations of features, address of people) on Earth s surface,
Access to global land cover reference datasets and their suitability for land cover mapping activities
 Access to global land cover reference datasets and their suitability for land cover mapping activities Brice Mora, N.E.Tsendbazar, M.Herold LPVE meeting, Frascati, January 29, 2014 Outlook 1. Background
An Internet-based Agricultural Land Use Trends Visualization System (AgLuT)
") An Internet-based Agricultural Land Use Trends Visualization System (AgLuT) Prepared for Missouri Department of Natural Resources Missouri Department of Conservation 07-01-2000-12-31-2001 Submitted by
An Internet-based Agricultural Land Use Trends Visualization System (AgLuT) Prepared for Missouri Department of Natural Resources Missouri Department of Conservation 07-01-2000-12-31-2001 Submitted by
Development and operation of GIS exercise materials for undergraduate students
 Development and operation of GIS exercise materials for undergraduate students Since around 2000, GIS researchers in Japan have collaborated to provide materials for GIS lecture classes for university
v WMS Tutorials GIS Module Importing, displaying, and converting shapefiles Required Components Time minutes
 v. 11.0 WMS 11.0 Tutorial Importing, displaying, and converting shapefiles Objectives This tutorial demonstrates how to import GIS data, visualize it, and convert it into WMS coverage data that could be
Comparison in terms of accuracy of DEMs extracted from SRTM/X-SAR data and SRTM/C-SAR data: A Case Study of the Thi-Qar Governorate /AL-Shtra City
 International Journal of Current Engineering and Technology E-ISSN 2277 4106, P-ISSN 2347 5161 2016 INPRESSCO, All Rights Reserved Available at http://inpressco.com/category/ijcet Research Article Comparison
GIS Quick Facts. CIVL 1101 GIS Quick Facts 1/5.
 CIVL 1101 1/5 What is GIS? Geographic Information Systems (GIS) provide a platform for displaying and analyzing spatial data. GIS systems allow you to view multiple layers of data simultaneously. GIS is