Luminescent water-soluble quantum dots: Improved stability through surface functionalization
|
|
|
- Erica Cummings
- 5 years ago
- Views:
Transcription

1 Graduate Theses and Dissertations Iowa State University Capstones, Theses and Dissertations 2008 Luminescent water-soluble quantum dots: Improved stability through surface functionalization Manuela Aseye Ayele Ayee Iowa State University Follow this and additional works at: Part of the Biological Engineering Commons, and the Chemical Engineering Commons Recommended Citation Ayee, Manuela Aseye Ayele, "Luminescent water-soluble quantum dots: Improved stability through surface functionalization" (2008). Graduate Theses and Dissertations This Thesis is brought to you for free and open access by the Iowa State University Capstones, Theses and Dissertations at Iowa State University Digital Repository. It has been accepted for inclusion in Graduate Theses and Dissertations by an authorized administrator of Iowa State University Digital Repository. For more information, please contact
2 Luminescent water-soluble quantum dots: Improved stability through surface functionalization by Manuela Aseye Ayele Ayee A thesis submitted to the graduate faculty in partial fulfillment of the requirements for the degree of MASTER OF SCIENCE Major: Chemical Engineering Program of Study Committee: Aaron R. Clapp, Major Professor Malika Jeffries-El Andrew C. Hillier Iowa State University Ames, Iowa 2008 Copyright Manuela Aseye Ayele Ayee, All rights reserved.
3 ii To my precious parents, Dr. & Mrs. Emmanuel and Alberta Ayee, to my sister Gloria, and brothers Joel and Jonathan; You are, and always have been, my inspiration. Thank you for being the best!
4 iii TABLE OF CONTENTS List of Figures... vii List of Tables... xi Abstract... xii Chapter 1. Introduction General Introduction Motivation/Objectives Organization of Thesis References... 3 Chapter 2. Background and Literature Review Introduction Band Gaps and Quantum Confinement Properties of Quantum Dots Colloidal Quantum Dots Crystalline Core Synthesis Organic Coordinating Ligands Shell Overcoating Alternative Synthetic Routes Water Solublization Encapsulation Ligand Exchange Biological Applications of Quantum Dots Fluorescence Resonance Energy Transfer (FRET) References Chapter 3. Quantum Dot Synthesis... 30
5 iv 3.0 Introduction Apparatus and Experimental Setup Coordinating Solvents and Precursors Cadmium Precursors Selenium Precursor Synthesis Zinc Sulfide Shell Overcoating Purification and Size Selection Characterization References Chapter 4. Ligand Exchange Methods Introduction Dihydrolipoic Acid (DHLA) Ligand Exchange Procedure Characterization of DHLA-Capped Quantum Dots Amine-Terminated Dihydrolipoic Acid Purification of TA/DAP Filtration Column Chromatography Acetylation Reduction of Disulfide Bond Ligand Exchange Tris(3-hydroxypropyl)phosphine (THPP) Alternative Ligands α-lipoamide... 61
6 v ,3-Diaminopropane (DAP) DHLA and Diaminopropane Mixture γ-aminobutyric acid (GABA) Surfactant Encapsulation Amino Acid Modification of Thioctic Acid References Chapter 5. Embedding Quantum Dots in Polymer Microspheres Introduction QD Tagged Carboxyl Terminated Polystyrene Beads Double-Emulsion Solid-Oil-Oil Microsphere Fabrication Frozen Heptane Precipitation Method Petroleum Ether Precipitation Method Diblock Copolymer QD Encapsulation References Chapter 6. Fluorescence Resonance Energy Transfer (FRET) Introduction FRET with Quantum Dots and Proteins FRET with Modified Influenza Haemagglutinin FRET with Modified SNARE Complex References Chapter 7. Conclusions and Future Work Conclusions Future Work Appendix I Supplementary TEM Images of Quantum Dots Appendix II Supplementary SEM Images of Polymer Microspheres
7 vi Appendix III Supplementary FRET Fluorescence Spectra Acknowledgements
8 vii LIST OF FIGURES Figure 2-1: Quantum dot absorption spectrum showing absorption onset at 510 nm... 9 Figure 2-2: Quantum dot emission spectrum with narrow size distribution and peak at 560 nm Figure 2-3: Schematic representation of a layer of TOPO molecules on the outer surface of a quantum dot : Schematic representation of FRET occurring between a quantum dot and Cy3 dye on a protein molecule Figure 3-1: Schematic representation of quantum dot synthesis apparatus setup Figure 3-2: Growth curve of the peak absorption and emission wavelengths of CdSe nanocrystals over time Figure 3-3: Different sized QD samples emitting fluorescence while being illuminated by a UV-lamp Figure 3-4: Average absorption, emission peak wavelengths, and fluorescence colors of thirty QD samples Figure 3-5: TEM image and electron diffraction pattern of colloidally prepared CdSe/ZnS core-shell nanocrystals Figure 4-1: DHLA formation by the reduction of thioctic acid using sodium borohydride in a sodium bicarbonate solution Figure 4-2: Schematic representation of a layer of DHLA molecules on the outer surface of a quantum dot Figure 4-3: Absorption and emission spectra of a DHLA-coated water-soluble QD sample compared to the core and core/shell absorption profiles Figure 4-4: Amine-terminated DHLA synthesized by carbodiimide coupling chemistry Figure 4-5: Carbodiimide coupling reactions for the formation of amine-terminated thioctic acid Figure 4-6: 1 H NMR spectra of TA/DAP and some of the compounds used for the synthesis... 53
9 viii Figure 4-7: 1 H NMR spectra of DAP and the white crystalline precipitate recovered from reaction.. 54 Figure 4-8: 1 H NMR spectra of acetylated TA/DAP compared to the non-acetylated product Figure 4-9: 1 H NMR spectra of reduced TA/DAP compared to the non-reduced product Figure 4-10: Structure of tris(hydroxypropyl)phosphine (THPP) Figure 4-11: Absorption spectra of THPP-coated QDs in neutral, acidic, and basic solutions Figure 4-12: Emission spectra of THPP-coated QDs in neutral, acidic, and basic media, showing the red-shift of the basic solution Figure 4-13: Absorption spectra of DHLA/THPP-coated QDs in neutral, acidic, and basic solutions 60 Figure 4-14: Structure of α-lipoamide Figure 4-15: Structure of γ-aminobutyric acid Figure 4-16: Structures of the surfactants SDS (top) and CTAB (bottom) Figure 4-17: Absorption and emission spectra of an SDS-encapsulated water-soluble QD sample Figure 4-18: Emission spectrum of a CTAB-encapsulated water-soluble QD sample compared to that of the TOP/TOPO covered core/shell QD sample Figure 4-19: Structures of the amino acids L-Lysine (left) and L-Glutamine (right) used in the modification process Figure 5-1: Chemical structures of poly(cph) (left) and poly(sa) (right) Figure 5-2: SEM images of aggregated polyanhydride microspheres fabricated by frozen heptane method Figure 5-3: SEM images showing individual polyanhydride microspheres within an aggregate Figure 5-4: SEM images of QD-embedded poly(cph) microspheres Figure 5-5: SEM images of QD-embedded poly(sa) microspheres Figure 5-6: SEM images of inactivated DHLA-capped QD-embedded poly(sa) microspheres... 76
10 ix Figure 5-7: TIRF images of fluorescence from DHLA-capped QDs embedded in microspheres in (a) a dry sample, (b) water, and (c) methanol. Image (d) is a sample of TOP/TOPO QDs in microspheres Figure 5-8: Intensity (left) and mass (right) particle size distributions by DLS of 508 nm emitting QD polymer spheres made by turbulent mixing with PLGA-PEG copolymer Figure 5-9: Intensity (left) and mass (right) particle size distributions by DLS of unsonicated 508 nm emitting QD polymer spheres made by turbulent mixing with PLGA-PEG copolymer Figure 5-10: Intensity (left) and mass (right) particle size distributions by DLS of 608 nm emitting QD polymer spheres made by turbulent mixing with PLGA-PEG copolymer Figure 5-11: SEM image and mass particle size distribution by DLS of 506 nm emitting QD polymer spheres made by turbulent mixing with PS-PEG copolymer Figure 5-12: SEM image and mass particle size distribution by DLS of 546 nm emitting QD polymer spheres made by turbulent mixing with PS-PEG copolymer Figure 5-13: SEM image and mass particle size distribution by DLS of 611 nm emitting QD polymer spheres made by turbulent mixing with PS-PEG copolymer Figure 5-14: 12-bit camera image of QD-tagged polystyrene beads illuminated by a pulsed laser Figure 6-1: Schematic representation of a protein-covered quantum dot Figure 6-2: Structure of influenza haemagglutinin Figure 6-3: Fluorescence spectra of Cy3 dye-labeled protein excited at 390 nm (left) and at 500 nm (right) Figure 6-4: Influenza haemagglutinin (HA) on QDs in borate buffer with 8 total protein molecules. 88 Figure 6-5: Influenza haemagglutinin (HA) on QDs in borate buffer with 12 total protein molecules 89 Figure 6-6: Influenza haemagglutinin (HA) on QDs in HEPES buffer with 12 total protein molecules... 89
11 x Figure 6-7: Influenza haemagglutinin (HA) on QDs in ph 5 Citrate-Phosphate buffer with 12 total protein molecules Figure 6-8: Influenza haemagglutinin (HA) on QDs in ph 7 Citrate-Phosphate buffer with 12 total protein molecules Figure 6-9: Structure of a SNARE complex consisting of syntaxin 1a, SNAP 25, and VAMP Figure 6-10: Schematic representation of the modified SNARE complex attached to a quantum dot 92 Figure 6-11: Single SNARE complex on QDs in HEPES buffer with 12 total protein molecules Figure 6-12: Binary SNARE complex on QDs in HEPES buffer with 12 total protein molecules Figure 6-13: Ternary SNARE complex on QDs in HEPES buffer with 12 total protein molecules Figure I-1: Electron diffraction patterns of colloidally prepared CdSe/ZnS core-shell nanocrystals. 100 Figure I-2: TEM images of colloidally prepared CdSe/ZnS core-shell nanocrystals Figure II-1: SEM images of QD embedded poly(cph) microspheres (sample 1) Figure II-2: SEM images of QD embedded poly(cph) microspheres (sample 2) Figure II-3: SEM images of QD embedded poly(sa) microspheres Figure II-4: SEM images of inactivated DHLA-capped QD embedded poly(sa) microspheres Figure II-5: SEM images 506 nm emitting QD polymer spheres made by turbulent mixing with PS- PEG copolymer Figure II-6: SEM images 546 nm emitting QD polymer spheres made by turbulent mixing with PS- PEG copolymer Figure II-7: SEM images 611 nm emitting QD polymer spheres made by turbulent mixing with PS- PEG copolymer Figure III-1: Single SNARE complex on QDs in HEPES buffer with 4 total protein molecules Figure III-2: Binary SNARE complex on QDs in HEPES buffer with 4 total protein molecules Figure III-3: Ternary SNARE complex on QDs in HEPES buffer with 4 total protein molecules
12 xi LIST OF TABLES Table 2-1: Important constants for common semiconductors 1, Table 2-2: Common organic molecules used as coordinating solvents for quantum dot synthesis Table 2-3: Alternative coordinating solvents used for quantum dot synthesis Table 2-4: Common molecules used in cap exchange Table 3-1: Approximate breakdown of sizes, colors and emission wavelengths of quantum dots 13, 14 40
13 xii ABSTRACT Colloidally prepared semiconductor nanocrystal quantum dots (QDs) are inherently incompatible with biological systems because of the native hydrophobic molecules that coat their surfaces. Post-synthetic techniques such as ligand exchange and encapsulation are therefore employed to make them soluble in aqueous media while preserving their valuable properties such as bright photoluminescence and stability. Small hydrophilic organic molecules like dihydrolipoic acid and tris(hydroxypropyl)phosphine are used to displace the hydrophobic surface ligands, and derivatization by carbodiimide bioconjugation can enhance ph stability. Several QD encapsulation methods in polymer shells are covered, with the most promising one involving the use of a four-stream vortex mixer to create QD-embedded polymer microspheres with a small size distribution and high fluorescence intensity. The ability of polyhistidine tags to self assemble onto QDs via metal coordination interactions is also exploited to attach dye-labeled protein molecules onto QD surfaces so as to perform fluorescence resonance energy transfer investigations.
14 1 CHAPTER 1. INTRODUCTION 1.0 General Introduction Quantum dots (QDs) are semiconductor nanocrystals that emit electromagnetic radiation in the form of visible light. The optical and electronic properties of QDs are quite different from those of the bulk semiconductor materials; hence they have many different applications. Luminescent QDs are potentially very useful in biological systems, including live cell and tissue imaging, acting as substrates for active sensing (e.g. using FRET) and targeted delivery, and visualization of intracellular and protein interactions 1-4. Inherently, colloidal QDs are incompatible with biological systems because of the native hydrophobic molecules that coat their surfaces, so several different post-synthetic techniques are employed to make them soluble in aqueous media 5. These techniques need to maintain the desirable properties such as keeping the sizes of the particles relatively small, maintaining a high photoluminescence quantum yield, and ensuring broad ph stability 1. Changing the outer layer of the QDs by exchanging the surface-coating molecules or encapsulating the whole nanocrystal in some sort of shell are the ways in which water solubility is achieved. 1.1 Motivation/Objectives Water solublization of quantum dots by exchanging the surface coating has most often been accomplished using the hydrophilic organic molecule, dihydrolipoic acid (DHLA). However, the water solubility of the QDs prepared by this method depends on the ionization state of the carboxyl functional group, so DHLA capped quantum dots are unstable in slightly acidic
15 2 solutions 1. For this reason, there is a need to develop alternative surface coatings that enhance the solution properties of the QDs. The motivation for all the ligand exchange and encapsulation investigations presented in the following chapters is to preserve the valuable properties of semiconductor nanocrystal quantum dots, while changing their solution properties to render them useful for biological applications by passivating their surfaces to keep the photoluminescence bright with surface modification that remains stable over a long period of time. Simultaneously, multifunctionality and ph stability are sought by combining organic molecules with varied functional groups on the same QD surface. 1.2 Organization of Thesis This thesis begins in Chapter 2 with a discussion of most of the literature that is pertinent to understanding the nature of quantum dots and the importance of their surface modification. The properties that make them particularly useful to biological systems are also covered. The preparation of high quality, luminescent cadmium selenide (CdSe) quantum dots overcoated with a zinc sulfide (ZnS) shell is detailed in Chapter 3. Chapter 4 mainly focuses on the methods used to displace hydrophobic surface ligands using small hydrophilic organic molecules, some of which are derivatizable using general bioconjugation techniques. These new water-soluble quantum dots are capable of being used in various ways for biological applications. Encapsulating quantum dots in polymer shells is a good way to functionalize their surfaces and manipulate their solution properties. By embedding QDs in polymer microspheres, their unique optical properties such as simultaneous excitation and size-tunable emission can be
16 3 utilized for applications such as multiplexing 6 and controlled drug delivery Several polymer encapsulation methods are discussed in Chapter 5. In fluorescence resonance energy transfer (FRET), energy is nonradiatively transferred from a donor to an acceptor fluorophore which are relatively close together 4. Dipole-dipole interactions between the two fluorophores are the driving force of FRET and these interactions depend heavily on the distance of separation between them 4, 11. FRET investigations between two different engineered proteins and quantum dots are covered in Chapter References 1. Liu, W.; Howarth, M.; Greytak, A. B.; Zheng, Y.; Nocera, D. G.; Ting, A. Y.; Bawendi, M. G., Compact biocompatible quantum dots functionalized for cellular imaging. J Am Chem Soc 2008, 130, (4), Susumu, K.; Uyeda, H. T.; Medintz, I. L.; Pons, T.; Delehanty, J. B.; Mattoussi, H., Enhancing the stability and biological functionalities of quantum dots via compact multifunctional ligands. J Am Chem Soc 2007, 129, (45), Clapp, A. R.; Medintz, I. L.; Mauro, J. M.; Fisher, B. R.; Bawendi, M. G.; Mattoussi, H., Fluorescence resonance energy transfer between quantum dot donors and dye-labeled protein acceptors. J. Am. Chem. Soc. 2004, 126, (1), Clapp, A. R.; Medintz, I. L.; Mattoussi, H., Forster resonance energy transfer investigations using quantum-dot fluorophores. Chemphyschem 2006, 7, (1), Clapp, A. R.; Goldman, E. R.; Mattoussi, H., Capping of CdSe-ZnS quantum dots with DHLA and subsequent conjugation with proteins. Nat Protoc 2006, 1, (3),
17 4 6. Han, M.; Gao, X.; Su, J. Z.; Nie, S., Quantum-dot-tagged microbeads for multiplexed optical coding of biomolecules. Nature Biotech. 2001, 19, (7), Kipper, M. J.; Shen, E.; Determan, A.; Narasimhan, B., Design of an injectable system based on bioerodible polyanhydride microspheres for sustained drug delivery. Biomaterials 2002, 23, (22), Berkland, C.; Kipper, M. J.; Narasimhan, B.; Kim, K. K.; Pack, D. W., Microsphere size, precipitation kinetics and drug distribution control drug release from biodegradable polyanhydride microspheres. J Control Release 2004, 94, (1), Determan, A. S.; Trewyn, B. G.; Lin, V. S.; Nilsen-Hamilton, M.; Narasimhan, B., Encapsulation, stabilization, and release of BSA-FITC from polyanhydride microspheres. J Control Release 2004, 100, (1), Kipper, M. J.; Wilson, J. H.; Wannemuehler, M. J.; Narasimhan, B., Single dose vaccine based on biodegradable polyanhydride microspheres can modulate immune response mechanism. J Biomed Mater Res A 2006, 76, (4), Clapp, A. R., T. Pons, I. L. Medintz, J. B. Delehanty, J. S. Melinger, T. Tiefenbrunn, P. E. Dawson, B. R. Fisher, B. O'Rourke, H. Mattoussi, Two-Photon Excitation of Quantum- Dot-Based Fluorescence Resonance Energy Transfer and Its Applications. Advanced Materials 2007, 19, (15),
18 5 CHAPTER 2. BACKGROUND AND LITERATURE REVIEW 2.0 Introduction In this chapter, most of the literature that is pertinent to understanding the nature of quantum dots and the importance of their surface modification is discussed. Section 2.1 gives a general overview of the quantum mechanical concepts that explain the confinement effects experienced by semiconductor nanocrystals. Section 2.2 summarizes the quantum dot properties that make them important in biological applications. The most commonly used synthesis and shell overcoating methods are described in Section 2.3 as well as some of the organic molecules used as coordinating solvents for synthesis. Some alternative synthetic routes are discussed in Section 2.4. Water solublization techniques that enable biological use of quantum dots are detailed in Section 2.5 and some biological applications are outlined in Section Band Gaps and Quantum Confinement A band gap/electronic energy level spacing (E g ) is the region where electron energy levels cannot exist. In semiconductors, it is the energy difference/interval between the top of the valence band (E v ) and the bottom of the conduction band (E c ). E E E If E g is less than 3 or 4 ev, the conduction band has a non-negligible population at higher temperatures, and this type of crystal is called a semiconductor. Electrons are confined to the
19 6 energy bands but are able to jump from one to another using a specific amount of energy, which differs according to the material type 1. Table 2-1: Important constants for common semiconductors 1, 2 Bulk Band Gap Energy - E g Exciton Bohr Radius - a B Lattice Constant - a L Semiconductor (ev) (nm) (nm) Ge Si GaAs CdTe CdSe CdS ZnSe AgBr CuBr CuCl ZnS In bulk semiconductor crystals, the band gap has an average fixed value as illustrated in Table 2-1, and the wavelength associated with (i.e. the de Broglie wavelength of) an electron (λ e ), a hole (λ h ), and the exciton Bohr radius (a B ) can be much larger than the lattice constant (a L ) of the crystal. Therefore, the size of a nanocrystal can be equal to or less than λ e, λ h, and a B, but larger than a L. It is thus possible to fabricate low-dimensional structures with sizes restricted to a few nanometers. In these nanocrystals, the band gap depends on the size of the
20 7 crystal, and can be altered to produce a series of energies that lie between the conduction and the valence band of the material 1, 3. Semiconductor nanocrystals have been described as quantum dots, nanoparticles, or nanoclusters 4, 5. These nanocrystals are clusters of semiconductor molecules that are structurally identical to the bulk material. They can be made from group II-VI semiconductors (e.g. CdS, CdSe, CdTe, ZnSe), group III-V semiconductors (e.g. InP, GaAs, InAs) and group IV-VI semiconductors (e.g. CuCl, CuBr), among others 5. The band gaps of nanocrystals increase as the size of the material decreases 6. The size of the nanocrystals also directly affects electrical transport because of the differences in energy needed to add charges or remove them 5. The band gap energy is the minimum amount of energy needed to create one free electronhole pair or an exciton, which is a quasiparticle formed by the Coulomb potential interactions between electrons and holes. A semiconductor crystal transitions from the ground to the first excited state when a photon is absorbed, with an electron being stimulated to cross the band gap into the conduction band and leave a hole in the valence band. For this to occur, the energy of the photon has to be greater than or equal to the band gap energy of the crystal. The energy and momentum of the photon are conserved, so, as the electron falls back down to the valence band, the crystal ideally emits radiation in the form of visible light 1. To understand the absorption and emission of light in nanocrystals, consider the quantum confinement approach in which a nanocrystal is considered to be a three-dimensional box. If a photon is absorbed or emitted, elementary excitations are created or destroyed. These elementary excitations can be electrons, holes, or excitons and will experience quantum confinement resulting in finite motion along the confinement axis and infinite motion in
21 8 other directions. If the size is restricted in only one dimension, a two-dimensional structure called a quantum well results. If two-dimensional quantum confinement occurs, a onedimensional structure called a quantum wire results. If the motion of the electrons, holes, and excitons is restricted in all three dimensions, a quasi-zero-dimensional system called a quantum dot results. Thus quantum dots are in a state of complete quantum confinement 1. The exciton Bohr radius is the physical separation between an electron in the conduction band and a hole in the valence band, which varies depending on the material being considered. In a bulk semiconductor, this radius is small compared to the size of the semiconductor so the exciton is free to move around in the material. Since the size of a quantum dot is on the order of the exciton Bohr radius, the exciton becomes confined in the box, so the electronic energy levels can be treated as discrete instead of continuous as seen in bulk semiconductor materials. The energy levels in the bulk are separated by very small amounts of energy so they are assumed to be continuous. Due to the small size of quantum dots, the addition or removal of just one atom changes the energy of the band gap noticeably, because the energy levels are separated by larger amounts of energy than in the bulk. One of the physical effects of quantum confinement is the shift of electronic excitations to higher energies as the size of the particle is reduced so depending on the number of atoms present, a specific wavelength of radiation is emitted when the electron drops back into the valence band, making quantum dot band gaps size tunable 5.
22 9 2.2 Properties of Quantum Dots Quantum dot nanocrystals are clusters of atoms with an interior that is indistinguishable structurally from the bulk solid, but the majority of the total number of atoms are on the surface of the cluster 5. The surface therefore plays an important role in the properties of the crystal. The properties of semiconductor quantum dots make them very useful biologically for optical imaging and labeling 7. Some of these properties include high quantum yields, brightness, narrow emission spectra, large molar extinction coefficients, photostability, and the ability of the band gaps to be tuned over most of the visible spectrum wavelengths This band gap tunability arises because the positions of the initial absorption peaks can be shifted over a big portion of the band gap of the bulk material 5. Absorbance Wavelength (nm) Figure 2-1: Quantum dot absorption spectrum showing absorption onset at 510 nm What is most observable about quantum dots is the large change in their optical properties with respect to cluster size, since this directly influences the optical excitations across the
23 10 gap. This occurs in clusters even as large as atoms, but not in the bulk material 5. By reducing the diameter of the semiconductor cluster of CdSe, for example, from 20 to 2 nm, the band gap can be tuned from deep red at 1.7 ev to green at 2.4 ev 13. The absorption spectra of quantum dots exhibit a succession of overlapping peaks that decrease in size as the wavelength increases. Each of the peaks corresponds to an energy transition between the aforementioned discrete electronic energy levels. The peak with the largest wavelength serves as the absorption limit of the quantum dot, also known as the absorption onset. The position of the absorption onset peak depends on the type and size of the semiconductor nanocrystal being considered. For smaller quantum dots, the first peak occurs at shorter wavelengths. The broad absorption spectra enable quantum dots to be excited over a wide range of wavelengths, whilst producing a narrow emission profile. Intensity 2.00E E E E E E E E E E E Wavelength (nm) Figure 2-2: Quantum dot emission spectrum with narrow size distribution and peak at 560 nm The emission spectra of quantum dots demonstrate a Gaussian (bell-shaped) distribution with the peak at a wavelength slightly higher than the absorption onset peak of the absorption
24 11 spectra. The separation between the absorption and emission peaks is called the Stokes shift and is quite large for quantum dots. This is especially valuable in applications involving multiplexing because several different QD samples can be excited at the same time with a single wavelength distant from the emission wavelengths of any of the samples 10, 14, 15. The size distribution of the quantum dot sample determines the width of the emission curve with a narrower curve indicating that the size distribution is smaller. A smaller distribution is more favorable and can be achieved by growing or size-selecting monodisperse nanocrystals (nearly identical in size and shape). 2.3 Colloidal Quantum Dots Crystalline Core Synthesis The crystalline core of colloidal quantum dots can contain about 100 to atoms of the semiconductor material 5 and can range in diameter from about 1 to 20 nm 16. Successful synthesis should produce highly crystalline nanocrystals, a monodisperse size distribution, the ability to vary the size and shape, and control over the optical and other properties 3. In order to accomplish this, the crystallization process must be strictly controlled by forming a supersaturated solution at about 250 to 360 C in which nucleation occurs and subsequent crystal growth over the initial nuclei 4, 17. For monodisperse crystals to result, the nucleation period needs to be very short 18. Up until the year 2000, the best synthesis was an organometallic approach using Cd(CH 3 ) 2 (dimethyl cadmium) in technical grade trioctylphosphine oxide (TOPO) as a coordinating solvent with other additives 13, Selenium metal was combined with an organophosphine compound such as trioctylphosphine or tributylphosphine before being used for synthesis.
25 12 The disadvantages of this approach included the fact that some of the raw materials and precursors were extremely toxic, expensive, unstable, explosive, and even pyrophoric so expensive equipment with an inert atmosphere (such as a glove box) was required. The reactions were also difficult to control and reproduce and other types of semiconductor nanocrystals of comparable quality to CdSe had not been produced by this approach 3, 17. The need for a shift towards somewhat safer and less expensive raw materials as well as simpler equipment and procedures was felt. Different cadmium precursors were used, including inorganic and organic cadmium salts (e.g. cadmium carbonate, cadmium acetate) 3. The newer synthetic routes were able to produce nanocrystals in a broad range sizes from 1.5 to 25 nm 17 that were nearly monodisperse since 5 to 10% relative standard deviation was achievable. A photoluminescence (PL) quantum efficiency of up to 85% was also reached 23. Other semiconductor nanocrystals such as CdTe and CdS were also produced by these safer routes 12. During synthesis, a 100% conversion of raw materials to nanocrystals is impossible since some excess precursors (e.g. cadmium molecular species) and monomers must exist in the growth solution to suppress Ostwald and intraparticle ripening during the crystal growth process 19, 24. To induce the supersaturation required to form quantum dots, the organometallic precursors are injected swiftly into a flask holding the vigorously stirring coordinating solvents at a high temperature 4. The synthesis of cadmium selenide (CdSe) quantum dots has been developed most and several sources of Cd have been used including dimethyl cadmium (Cd(CH 3 ) 2 ) 4, cadmium oxide (CdO) 12, and cadmium acetylacetonate (Cd(acac) 2 ) 14, 17.
26 Organic Coordinating Ligands To prevent colloidal nanocrystals from aggregating and to make them soluble, their surfaces are derivatized with organic molecules 16. Derivatization is a reaction used to transform a material into a derivative which has a similar chemical structure but new chemical properties. The organic molecules are attached to the quantum dot surface by metal coordination interactions and provide passivation, thus making them soluble without aggregation. It has been suggested that they do not provide good electronic passivation so the use of inorganic molecules instead has been proposed 5. Some molecules used as ligands include thiols, fatty acids, amines, phosphonic acids, phosphine oxides, nitriles, phosphines, and carboxylic acids 3. By carefully selecting the functional groups appended to the quantum dots it is possible to control the types of environments they can disperse in. The most commonly used ligands are trioctylphosphine (TOP) and trioctylphosphine oxide (TOPO). The use of hexadecylamine (HDA) as a passivating ligand in addition to TOP/TOPO has been shown to provide better control over the growth dynamics of quantum dots and to produce very monodisperse samples as well 25. As discussed previously in the case using dimethyl cadmium (Cd(CH 3 ) 2 ) as a precursor, metallic Cd precipitated immediately out of pure TOPO at high temperatures. Adding an equal or greater molar amount of hexylphosphonic acid (HPA) was found to stabilize the (Cd(CH 3 ) 2 ). This is because a soluble Cd-HPA complex was formed, resulting in a clear solution 19. This same complex was also formed when CdO was introduced into a high temperature mixture of HPA and TOPO. The addition of a selenium-organophosphine solution (e.g. TOP/Se) into the Cd-HPA complex solution was shown to produce high quality
27 14 Table 2-2: Common organic molecules used as coordinating solvents for quantum dot synthesis Organic Molecule Structure Trioctylphosphine (TOP) Trioctylphosphine oxide (TOPO) Hexadecylamine (HDA) Hexylphosphonic acid (HPA) nanocrystals 2 nm or smaller in size, but larger ones were difficult to produce using this method 3, 17.
28 Shell Overcoating The positions of the atoms at the surfaces of tetrahedral inorganic semiconductors become greatly restructured, resulting in surface states, which are energy levels that are within the forbidden gap of the bulk solid. Electrons and holes get trapped in this forbidden gap, thus degrading the material s optical and electrical properties. Nonradiative recombination can also occur where an electron recombines with a hole but the energy generated is released in the form of heat instead of light. To prevent these surface states and nonradiative recombination from occurring, a chemical process that bonds the surface atoms of the Figure 2-3: Schematic representation of a layer of TOPO molecules on the outer surface of a quantum dot 26
29 16 crystalline core to another material with a much larger band gap is carried out. This process, termed passivation, eradicates the surface states that are within the forbidden gap and instead produces an increase in the chemical potential. Since particles move from regions of high chemical potential to lower ones, the electrons and holes at the interface of the two materials become confined within the semiconductor cluster because the passivating material has a higher chemical potential 5. Several layers of atoms of a wider band gap semiconductor are required to successfully overcoat the core of the quantum dot. Emission becomes brighter because of the absence of the surface states and nonradiative recombination. Overcoating also makes the quantum dot more robust and able to endure harsher conditions. The quantum yield of a quantum dot is the percentage of photons absorbed that result in photons emitted, so better overcoating results in a higher quantum yield 8. For CdSe quantum dots, the most common materials used for overcoating include ZnS 8, CdS 24, and ZnSe 27. During the overcoating process, the precursors are added very slowly to the coordinating solvents and quantum dots to ensure uniform growth over the surface of the QDs. 2.4 Alternative Synthetic Routes Solvents such as fatty acids, amines (e.g. dodecylamine), and phosphonic acids (e.g. tetradecyl phosphonic acid TDPA), have been used as coordinating solvents for quantum dot synthesis, most often in conjunction with TOPO 17. Some syntheses of CdSe in water/aqueous solutions have also been described using inorganic cadmium salts. Some of the syntheses use L-cysteine in the reaction mixture to cap the quantum dots. The quality of
30 17 Table 2-3: Alternative coordinating solvents used for quantum dot synthesis Organic Molecule Structure Dodecylamine (DDA) Tetradecylphosphonic acid (TDPA) Cysteine 1-Octadecene Oleic Acid
31 18 the nanocrystals produced is poor presumably because high temperatures cause better crystallinity and the reaction temperature for aqueous synthesis cannot be raised to C as in the organometallic approach 3, 28, 29. Sapra et al. 30 describe a method of quantum dot synthesis that utilizes olive oil as a coordinating solvent instead of TOP/TOPO. The crystals produced ranged in size from 2.3 to 6.0 nm and emit radiation over the range 485 to 640 nm. Synthesis using non-coordinating solvents such as 1-octadecene (ODE) has also been reported. Oleic acid was used as a ligand to stabilize the precursors and nanocrystals and was found to influence the growth kinetics depending on its concentration. CdS, ZnSe, and CdSe were successfully synthesized using this method. The CdSe nanocrystals ranged in size from 1.5 to 20 nm Water Solublization After most synthetic procedures, the nanocrystals used are covered in hydrophobic surface ligands. For biological applications, the quantum dots need to be water soluble. The nature of the surface ligands determines the types of solutions the nanocrystal will be stable in; therefore the ease of derivatization is very important. Concurrently, the nanocrystal s small size, ph stability, and high quantum yield must be preserved 7. Water solublization can be achieved by either encapsulating the nanocrystal in some hydrophilic material or exchanging the hydrophobic ligands with hydrophilic ones Encapsulation To produce a hydrophilic surface, the quantum dots may be encapsulated in amphiphilic polymers, silica shells, micelles, or phospholipids Although these encapsulated quantum
32 19 dots have high quantum yields, their diameters are greatly increased by the polymer shells. This can make the nanocrystals larger than some of the sub-cellular structures being labeled, and hinder their movement through the cell. The diameter has been observed by Smith et al. 40 to increase from about 4 6 nm (for non-encapsulated quantum dots) to nm. Polymer shells also tend to possess an electrostatic charge and so add to non-specific binding of the nanocrystals to cell membranes Ligand Exchange To reduce the diameters of water soluble quantum dots, the native hydrophobic ligands can be displaced by small organic molecules that are able to bind to the ZnS shell. Some examples of ligands used for exchange include dihydrolipoic acid (DHLA), PEG-appended DHLA 11, 41, 42, thiol-alkyl-cooh, amine-alkyl-cooh 9, cysteine ligands 43, and phytochelatin-related R-peptides 44. Dihydrolipoic acid (DHLA) is a carboxylic acid that contains a pair of thiols that are able to bind to the quantum dot surface. It has been used in place of monothiol molecules such as mercaptoacetic acid because of the enhanced stability and stronger interaction to the quantum dot surface provided by the two sulfur atoms 11, 45, 46. DHLA-capped quantum dots, however, are unstable in acidic conditions, not easily derivatizable, and bind non-specifically to cells 7, 11 so modifications to DHLA by appending various lengths of poly(ethylene glycol) (PEG) using ester bonds have been done. Quantum dots possessing these DHLA-PEG ligands are very water soluble and therefore useful for biological applications.
33 20 Table 2-4: Common molecules used in cap exchange Ligand Structure Dihydrolipoic Acid (DHLA) PEG-appended DHLA Histidine Unfortunately, just like DHLA, these ligands provide only a hydroxyl group, so further derivatization is difficult and the ester bond between the DHLA and PEG groups is easily hydrolysable 7, 41, 47. They also cause a large increase in the size of the quantum dots. Stable aqueous solutions of quantum dots have been formed using peptides containing cysteine residues but the size of the quantum dots becomes quite large (approximately 15 nm) because of the large size of the peptides 44. Metal-affinity interactions are also employed using polyhistidine-tags (His-tags) engineered onto biomolecules which are able to self-
34 21 assemble onto quantum dots through interactions between the His-tag and metal ions on the nanocrystal surface 35, 48. This process provides control over the quantum dot to protein ratio. It is also possible to covalently modify the nanocrystal surface using carbodiimide bioconjugation techniques such as amide coupling reactions between amino and carboxyl groups Biological Applications of Quantum Dots Compared to traditional dyes and fluorescent proteins, quantum dots are much more useful for imaging cells at a molecular level because of their advanced photostability and brightness 49. They have been used in biological systems as probes and sensors that are much more robust and stable than dyes. Their broad absorption and narrow emission spectra also make quantum dots ideal for multiplexing applications. This is because several different nanocrystals can be excited at the same wavelength but will emit different colors 10, 15. Relative to organic dyes, the larger size of quantum dots enables them to act as platforms for attaching different molecules and thus providing diverse functionality. An example of the use of quantum dots in vivo is the study done by Stroh et al. 50 in which the nanocrystals were used to differentiate between cancerous tumor cells and host cells in transgenic mice Fluorescence Resonance Energy Transfer (FRET) Fluorescence resonance energy transfer (FRET) is a mechanism by which energy is transferred from a fluorescent donor molecule to a fluorescent acceptor molecule 51. The transfer is driven by dipole-dipole interactions and is highly dependent on the distance between the two molecules, which makes it useful for monitoring biological phenomena
35 22 FRET has been shown to occur between quantum dots and organic dyes attached to proteins with an increase in the FRET signal as the number of proteins attached to the nanocrystal is increased : Schematic representation of FRET occurring between a quantum dot and Cy3 dye on a protein molecule Due to its distance-dependent nature, FRET is a useful method for measuring distances in the angstrom to nanometer range. This is very helpful for applications such as deriving the structure of complex molecules like proteins by measuring the distances between amino acids. FRET is also valuable for detecting enzymatic activity. After a dye-labeled peptide has been attached to a quantum dot, FRET occurs between the nanocrystal and the dye, so the emission of the nanocrystal becomes quenched. The emission increases again only after the peptide has been cleaved by the enzyme
36 References 1. Gaponenko, S. V., Optical properties of semiconductor nanocrystals. Cambridge University Press: Cambridge, UK; New York, NY, USA, Lattice Constants. (12 September, 2008), 3. Peng, X., Green chemical approaches toward high-quality semiconductor nanocrystals. Chemistry--A European Journal 2002, 8, (2), Murray, C. B.; Kagan, C. R.; Bawendi, M. G., Synthesis and characterization of monodisperse nanocrystals and close-packed nanocrystal assemblies. Ann. Rev. Mater. Sci. 2000, 30, Alivisatos, A. P., Semiconductor Clusters, Nanocrystals, and Quantum Dots. Science, New Series 1996, 271, (5251), Vossmeyer, T., et al., CdS Nanoclusters: Synthesis, Characterization, Size Dependent Oscillator Strength, Temperature Shift of the Excitonic Transition Energy, and Reversible Absorbance Shift. J. Phys. Chem. 1994, 98, Liu, W.; Howarth, M.; Greytak, A. B.; Zheng, Y.; Nocera, D. G.; Ting, A. Y.; Bawendi, M. G., Compact biocompatible quantum dots functionalized for cellular imaging. J Am Chem Soc 2008, 130, (4), Dabbousi, B. O.; Rodriguez-Viejo, J.; Mikulec, F. V.; Heine, J. R.; Mattoussi, H.; Ober, R.; Jensen, K. F.; Bawendi, M. G., (CdSe)ZnS Core-Shell Quantum Dots: Synthesis and Optical and Structural Characterization of a Size Series of Highly Luminescent Materials. J. Phys. Chem. B. 1997, 101, (46),
37 24 9. Chan, W. C. W.; Nie, S., Quantum dot bioconjugates for ultrasensitive nonisotopic detection. Science 1998, 281, (5385), Bruchez, M., Jr.; Moronne, M.; Gin, P.; Weiss, S.; Alivisatos, A. P., Semiconductor nanocrystals as fluorescent biological labels. Science 1998, 281, (5385), Mattoussi, H.; Mauro, J. M.; Goldman, E. R.; Anderson, G. P.; Sundar, V. C.; Mikulec, F. V.; Bawendi, M. G., Self-Assembly of CdSe-ZnS Quantum Dot Bioconjugates Using an Engineered Recombinant Protein. J. Am. Chem. Soc. 2000, 122, (49), Peng, Z. A.; Peng, X., Formation of high-quality CdTe, CdSe, and CdS nanocrystals using CdO as precursor. Journal of the American Chemical Society 2001, 123, (1), Murray, C. B.; Norris, D. J.; Bawendi, M. G., Synthesis and characterization of nearly monodisperse CdE (E = sulfur, selenium, tellurium) semiconductor nanocrystallites. J. Am. Chem. Soc. 1993, 115, (19), Clapp, A. R.; Goldman, E. R.; Mattoussi, H., Capping of CdSe-ZnS quantum dots with DHLA and subsequent conjugation with proteins. Nat Protoc 2006, 1, (3), Han, M.; Gao, X.; Su, J. Z.; Nie, S., Quantum-dot-tagged microbeads for multiplexed optical coding of biomolecules. Nature Biotech. 2001, 19, (7), Murray, C. B.; Kagan, C. R.; Bawendi, M. G., Self-organization of CdSe nanocrystallites into three-dimensional quantum dot superlattices. Science (Washington, D. C.) 1995, 270, (5240), Qu, L.; Peng, Z. A.; Peng, X., Alternative Routes toward High Quality CdSe Nanocrystals. Nano Letters 2001, 1, (6), Howard, R., The Growth of Uniform Colloidal Dispersions. The Journal of Chemical Physics 1951, 19, (4),
38 Peng, Z. A.; Peng, X., Mechanisms of the Shape Evolution of CdSe Nanocrystals. Journal of the American Chemical Society 2001, 123, (7), Peng, X.; Manna, U.; Yang, W.; Wickham, J.; Scher, E.; Kadavanich, A.; Alivisatos, A. P., Shape control of CdSe nanocrystals. Nature (London) 2000, 404, (6773), Peng, X.; Wickham, J.; Alivisatos, A. P., Kinetics of II-VI and III-V Colloidal Semiconductor Nanocrystal Growth: \"Focusing\" of Size Distributions. Journal of the American Chemical Society 1998, 120, (21), Steigerwald, M. L.; Brus, L. E., Semiconductor crystallites: a class of large molecules. Acc. Chem. Res. 1990, 23, (6), Qu, L.; Peng, X., Control of Photoluminescence Properties of CdSe Nanocrystals in Growth. Journal of the American Chemical Society 2002, 124, (9), Peng, X.; Schlamp, M. C.; Kadavanich, A. V.; Alivisatos, A. P., Epitaxial Growth of Highly Luminescent CdSe/CdS Core/Shell Nanocrystals with Photostability and Electronic Accessibility. J. Am. Chem. Soc. 1997, 119, (30), Talapin, D. V.; Rogach, A. L.; Kornowski, A.; Haase, M.; Weller, H., Highly Luminescent Monodisperse CdSe and CdSe/ZnS Nanocrystals Synthesized in a Hexadecylamine-Trioctylphosphine Oxide-Trioctylphosphine Mixture. Nano Letters 2001, 1, (4), Hermanson, G. T., Bioconjugate Techniques. Academic Press: San Diego, Danek, M.; Jensen, K. F.; Murray, C. B.; Bawendi, M. G., Synthesis of Luminescent Thin-Film CdSe/ZnSe Quantum Dot Composites Using CdSe Quantum Dots Passivated with an Overlayer of ZnSe. Chemistry of Materials 1996, 8, (1),
39 He. R., e. a., Synthesis of CdTe colloidal quantum dots (QDs) in water. Frontiers of Chemistry in China 2008, 3, (3), Wuister, S. F., Van Driel, F., Meijerink, A., Luminescence of CdTe nanocrystals. Journal of Luminescence 2003, , (SPEC), Sapra, S., Rogach, A.L., Feldmann, J., Phosphine-free synthesis of monodisperse CdSe nanocrystals in olive oil. J. Mater. Chem. 2006, 16, Yu, W. W.; Peng, X., Formation of high-quality CdS and other II-VI semiconductor nanocrystals in noncoordinating solvents: Tunable reactivity of monomers. Angewandte Chemie, International Edition 2002, 41, (13), Fogg, D. E.; Radzilowski, L. H.; Dabbousi, B. O.; Schrock, R. R.; Thomas, E. L.; Bawendi, M. G., Fabrication of Quantum Dot-Polymer Composites: Semiconductor Nanoclusters in Dual-Function Polymer Matrixes with Electron-Transporting and Cluster- Passivating Properties. Macromolecules 1997, 30, (26), Wu, X.; Liu, H.; Liu, J.; Haley, K. N.; Treadway, J. A.; Larson, J. P.; Ge, N.; Peale, F.; Bruchez, M. P., Immunofluorescent labeling of cancer marker Her2 and other cellular targets with semiconductor quantum dots. Nature Biotech. 2003, 21, (1), Dubertret, B.; Skourides, P.; Norris, D. J.; Noireaux, V.; Brivanlou, A. H.; Libchaber, A., In vivo imaging of quantum dots encapsulated in phospholipid micelles. Science (Washington, D. C.) 2002, 298, (5599), Medintz, I. L.; Uyeda, H. T.; Goldman, E. R.; Mattoussi, H., Quantum dot bioconjugates for imaging, labelling and sensing. Nat Mater 2005, 4, (6),
40 Zhou, M.; Nakatani, E.; Gronenberg, L. S.; Tokimoto, T.; Wirth, M. J.; Hruby, V. J.; Roberts, A.; Lynch, R. M.; Ghosh, I., Peptide-labeled quantum dots for imaging GPCRs in whole cells and as single molecules. Bioconjug Chem 2007, 18, (2), Dahan, M.; Levi, S.; Luccardini, C.; Rostaing, P.; Riveau, B.; Triller, A., Diffusion dynamics of glycine receptors revealed by single-quantum dot tracking. Science (Washington, D. C.) 2003, 302, (5644), Courty, S.; Luccardini, C.; Bellaiche, Y.; Cappello, G.; Dahan, M., Tracking individual kinesin motors in living cells using single quantum-dot imaging. Nano Lett 2006, 6, (7), Parak, W. J.; Gerion, D.; Zanchet, D.; Woerz, A. S.; Pellegrino, T.; Micheel, C.; Williams, S. C.; Seitz, M.; Bruehl, R. E.; Bryant, Z.; Bustamante, C.; Bertozzi, C. R.; Alivisatos, A. P., Conjugation of DNA to silanized colloidal semiconductor nanocrystalline quantum dots. Chem. Mater. 2002, 14, (5), Smith, A. M., et al., A systematic examination of surface coatings on the optical and chemical properties of semiconductor quantum dots. Phys. Chem. Chem. Phys. 2006, 8, Uyeda, H. T.; Medintz, I. L.; Jaiswal, J. K.; Simon, S. M.; Mattoussi, H., Synthesis of compact multidentate ligands to prepare stable hydrophilic quantum dot fluorophores. Journal of the American Chemical Society 2005, 127, (11), Susumu, K.; Uyeda, H. T.; Medintz, I. L.; Pons, T.; Delehanty, J. B.; Mattoussi, H., Enhancing the stability and biological functionalities of quantum dots via compact multifunctional ligands. J Am Chem Soc 2007, 129, (45),
41 Liu, W.; Choi, H. S.; Zimmer, J. P.; Tanaka, E.; Frangioni, J. V.; Bawendi, M., Compact cysteine-coated CdSe(ZnCdS) quantum dots for in vivo applications. J Am Chem Soc 2007, 129, (47), Pinaud, F.; King, D.; Moore, H.-P.; Weiss, S., Bioactivation and Cell Targeting of Semiconductor CdSe/ZnS Nanocrystals with Phytochelatin-Related Peptides. J. Am. Chem. Soc. 2004, (126), Aldana, J.; Wang, Y. A.; Peng, X., Photochemical Instability of CdSe Nanocrystals Coated by Hydrophilic Thiols. J. Am. Chem. Soc. 2001, 123, (36), Algar, W. R.; Krull, U. J., Adsorption and hybridization of oligonucleotides on mercaptoacetic acid-capped CdSe/ZnS quantum dots and quantum dot-oligonucleotide conjugates. Langmuir 2006, 22, (26), Zimmer, J. P.; Kim, S. W.; Ohnishi, S.; Tanaka, E.; Frangioni, J. V.; Bawendi, M. G., Size series of small indium arsenide-zinc selenide core-shell nanocrystals and their application to in vivo imaging. Journal of the American Chemical Society 2006, 128, (8), Medintz, I. L.; Clapp, A. R.; Mattoussi, H.; Goldman, E. R.; Fisher, B.; Mauro, J. M., Self-assembled nanoscale biosensors based on quantum dot FRET donors. Nature Materials 2003, 2, (9), Michalet, X.; Pinaud, F. F.; Bentolila, L. A.; Tsay, J. M.; Doose, S.; Li, J. J.; Sundaresan, G.; Wu, A. M.; Gambhir, S. S.; Weiss, S., Quantum dots for live cells, in vivo imaging, and diagnostics. Science 2005, 307, Stroh, M.; Zimmer, J. P.; Duda, D. G.; Levchenko, T. S.; Cohen, K. S.; Brown, E. B.; Scadden, D. T.; Torchilin, V. P.; Bawendi, M. G.; Fukumura, D.; Jain, R. K., Quantum dots
42 29 spectrally distinguish multiple species within the tumor milieu in vivo. Nature Medicine 2005, 11, (6), Clapp, A. R.; Medintz, I. L.; Mattoussi, H., Forster resonance energy transfer investigations using quantum-dot fluorophores. Chemphyschem 2006, 7, (1), Clapp, A. R.; Medintz, I. L.; Mauro, J. M.; Fisher, B. R.; Bawendi, M. G.; Mattoussi, H., Fluorescence resonance energy transfer between quantum dot donors and dye-labeled protein acceptors. J. Am. Chem. Soc. 2004, 126, (1), Kagan, C. R.; Murray, C. B.; Nirmal, M.; Bawendi, M. G., Electronic energy transfer in CdSe quantum dot solids. Physical Review Letters 1996, 76, (9), Crooker, S. A.; Hollingsworth, J. A.; Tretiak, S.; Klimov, V. I., Spectrally resolved dynamics of energy transfer in quantum-dot assemblies: towards engineered energy flows in artificial materials. Phys Rev Lett 2002, 89, (18), Medintz, I. L.; Clapp, A. R.; Brunel, F. M.; Tiefenbrunn, T.; Uyeda, H. T.; Chang, E. L.; Deschamps, J. R.; Dawson, P. E.; Mattoussi, H., Proteolytic activity monitored by fluorescence resonance energy transfer through quantum-dot-peptide conjugates. Nature Materials 2006, 5, Shi, L.; Rosenzweig, N.; Rosenzweig, Z., Luminescent quantum dots fluorescence resonance energy transfer-based probes for enzymatic activity and enzyme inhibitors. Anal Chem 2007, 79, (1), Gill, R.; Freeman, R.; Xu, J. P.; Willner, I.; Winograd, S.; Shweky, I.; Banin, U., Probing biocatalytic transformations with CdSe-ZnS QDs. J Am Chem Soc 2006, 128, (48),
43 30 CHAPTER 3. QUANTUM DOT SYNTHESIS 3.0 Introduction The preparation of high quality, luminescent cadmium selenide (CdSe) quantum dots is described in this chapter following general procedures previously described 1-5. The size of these nanocrystals is relatively easy to control and by capping CdSe with the higher band gap semiconductor material with similar lattice constants, ZnS, greater stability and improved luminescence is realized 4, 5. Precursors were reacted in coordinating solvents at high temperatures to produce crystalline cores (Sections ), which were overcoated with a thin layer of ZnS to produce very luminescent CdSe-ZnS core-shell quantum dots (Section 3.4). Purification and size selection methods of the QDs are described in Section 3.5 and the nanocrystals are characterized by various methods in Section Apparatus and Experimental Setup A relatively simple setup was required for quantum dot synthesis (Figure 3-1). The reaction was carried out in a three/four-neck Erlenmeyer bulb (round-bottom flask) connected by one neck and a condenser to a dual manifold inert/vacuum Schlenk line. Nitrogen (N 2 ) was used as the inert gas with a pressure of 2-4 psi, and a positive displacement rotary vane vacuum pump was usually able to pull a vacuum of about 10 Pa. Another neck allowed a thermocouple temperature sensor, encased in a glass rod and connected to a heating mantle, to read the temperature of the solution. The third and fourth necks were covered with septum
44 31 stoppers and tightly secured, enabling solutions to be injected into the air-free flask when a reaction was proceeding. Figure 3-1: Schematic representation of quantum dot synthesis apparatus setup An inert atmosphere glove box (MBRAUN Unilab) with a cooler was used to handle all the air-sensitive materials. 3.2 Coordinating Solvents and Precursors Modifying procedures previously outlined 1-3, 6, a 100 ml three-neck Erlenmeyer bulb, covered with glass wool to retain heat, was filled with 20 g trioctylphosphine oxide (TOPO),
45 32 10 g hexadecylamine (HDA), and 5 ml of 90 or 97% tech. grade trioctylphosphine (TOP). The bulb was heated to C for 1 2 hours under vacuum to dry and degas the coordinating solvents. A coordinating solvent mixture of TOP/TOPO/HDA has been found to narrow the size distribution of CdSe nanocrystals during synthesis, eliminating the need for extensive post-synthetic size selection 6. The ratio of TOPO to HDA was varied occasionally 7 and TOP was no longer used in the reaction vessel but added to the cadmium precursor instead. A 1:1 molar ratio of TOPO to HDA changed the starting amounts to 19.2 g TOPO and 12 g HDA. HDA seemed to play a role in the QD sizes produced, so in attempts to synthesize smaller (bluer) quantum dots, only 16 g TOPO was used with 14 g HDA and 4 5 ml TOP was again added. The amount of HDA was gradually increased, with 15 g each of TOPO and HDA used until finally, 12 g TOPO and 18 g HDA with 5 ml TOP was found to produce the smallest QDs Cadmium Precursors Previously described procedures were used to prepare the cadmium precursors 1. For most syntheses the organometallic cadmium acetylacetonate [Cd(CH 3 COCHCOCH 3 ) 2 xh 2 O] (Cd(acac) 2 ) was used. Generally, 0.62 g of Cd(acac) 2, 1.2 g of 1,2-hexadecanediol (HDDO), and 10 ml of 90 or 97% TOP were heated to C in a scintillation vial in an oil bath. The system was evacuated and refilled with N 2 gas a few times then placed under vacuum. Just before being injected into the coordinating solvent solution, the environment was switched to N 2 gas and cooled to 80 C. To cover the visible spectrum, a range of mmol Cd(acac) 2 has been suggested 7 with solvent amounts remaining the same. Therefore, only the ratios of Cd to HDDO and Se
46 33 needed to remain constant at 1:2.3:5. So g Cd(acac) 2, 0.3 g HDDO, and 10 ml TOP were used with 2.5 ml TOP:Se (1M stock solution) for synthesis. When attempting to make smaller quantum dots, 0.8 g of hexylphosphonic acid (HPA) or 1.4 g of tetradecylphosphonic acid (TDPA) was added to 0.62 g Cd(acac) 2 and 10 ml TOP, and then heated to C. HPA and TDPA were able to convert the cadmium precursor into a Cd/HPA or Cd/TDPA complex when the cadmium to phosphonic acid ratio was lower than one, and addition of the selenium precursor generated high quality, small nanocrystals 2. Besides Cd(acac) 2, cadmium oxide (CdO) has also been shown to produce monodisperse CdSe nanocrystals with phosphonic acids because its instability in relation to these acids causes the Cd/acid complex to form readily 2. The use of dodecylamine (DDA) for synthesis of CdTe nanocrystals was previously described 8, so a CdSe synthesis was carried out using 0.13 g CdO, 0.78 g TDPA, 7.4 g DDA, and 5.14 g TOPO. The solution began to boil at 274 C since DDA has a boiling point of C. Therefore the synthesis was carried out with 9 g of HDA instead and heated to 140 C. Before addition of the selenium precursor, the temperature was raised to 280 C, and at 240 C the solution became clear Selenium Precursor According to the procedure described by Murray et al. 3, a 1M stock solution of trioctylphosphine selenide (TOP:Se) was prepared inside the MBRAUN Unilab glove box by dissolving 7.9 g of Se powder in 100 ml of 90 or 97% TOP. For QD synthesis, 10 ml of the solution was removed from the glove box with a syringe. Selenium shot was originally finely ground by a mortar and pestle before use to ensure smooth and rapid injection into the
47 34 coordinating solvent solution, but we found that using 99.5% selenium powder was just as, if not more, effective. 3.3 Synthesis Before the reaction commenced, the cadmium and selenium precursors were drawn up into syringes. It was important to do this only right before injection into the coordinating solvents because of the tendency of the cadmium precursor to solidify when its temperature dropped below 80 C. The Erlenmeyer bulb containing the coordinating solvents was switched to a nitrogen atmosphere and the temperature was raised to C depending on the size of nanocrystals desired. The temperature control was always set slightly high so that the flask did not fall too far below the desired injection temperature when the heating mantle was removed. The set point was raised in small increments because of the tendency of the thermocouple to overshoot if the range was too wide. Before injection, the heating mantle was quickly removed from the coordinating solvent flask and the precursors were rapidly injected in. If injection is not instantaneous, different sized nanocrystals will be formed. A visible color change from clear to deep orange/ brown indicated immediate reaction between the precursors. The flask was rapidly cooled to below 200 C using ethanol sprayed directly onto flask and the cool setting of a heat gun. The thermostat was set to 80 C because the nanocrystals grew and their emission increased by about 10 nm even at 150 C. The heating mantle was replaced, and the solution left to stir for a few hours or overnight. To remove any unreacted metal salts or impurities in the solution, toluene, butanol, and hexane were added and the solution was centrifuged. The impurities remained on the bottom of the vials. The nanocrystals were then purified.
48 35 When attempting to make smaller nanocrystals, the Cd precursor mixture was injected into the coordinating solvents immediately after they were degassed, but the TOP:Se was added after raising the temperature. The reaction proceeded very slowly so quenching it faster resulted in smaller nanocrystals. It was found that even after the reaction had been quenched, the nanocrystals continued to grow at 80 C. We postulated that injection temperatures around 250 C possibly did not enable all the Cd and Se to react, so the size increased over time because of the large amount of unreacted precursors remaining in the solution. Therefore, for smaller nanocrystals, leaving the flask at 80 C for several hours is undesirable because the QDs tend to grow larger. Purification should be done immediately after synthesis Wavelength (nm) Absorption Emission Time (minutes) Figure 3-2: Growth curve of the peak absorption and emission wavelengths of CdSe nanocrystals over time When larger nanocrystals were desired, the flask was not cooled below 200 C after injection, but left at the injection temperature over a period of time. Every five to ten minutes, the
49 36 fluorescence spectra of samples taken from the flask were obtained. The growth curve was steep over the first few minutes but began to level off over time, indicating the maximum QD size had been reached (Figure 3-2). A phosphine-free synthesis was carried out using olive oil as the coordinating solvent according to a procedure described by Sapra et al. In this method, cadmium oxide (CdO) is stabilized by oleic acid (OA) 9, 10 which is found naturally at about 70 80% in olive oil 11. Oleic acid is also able to dissolve selenium at higher temperatures ml of extra virgin olive oil was used to dissolve g CdO under N 2 gas at 300 C g Se was dissolved in 8 ml of oil at 200 C under N 2 gas for 2 3 hours, and then cooled to room temperature. The Se solution was injected swiftly into the hot Cd solution at C. The crystals could be grown further at C depending on the injection temperature. Highly luminescent red QDs resulted with emissions ranging from 638 to 650 nm, but their crystal structure was cubic zinc-blende instead of the hexagonal wurtzite structure typical of organometallic syntheses of CdSe QDs Zinc Sulfide Shell Overcoating The precursors used to create a zinc sulfide shell over the surface of CdSe nanocrystals are diethyl zinc (ZnEt 2 ), which is pyrophoric, and hexamethyldisilathiane (TMS 2 S), which possesses a strong sulfur smell. Therefore, both precursors require an inert atmosphere (glove box) to be used. The procedure outlined by Clapp et al. 1 was followed. In a 100 ml Erlenmeyer bulb fitted with a pressure-equalizing addition funnel, g of TOPO was melted under N 2 gas at 70 C. In a few instances, 3 4 ml of TOP was added as well. In others, 8 10 g of HDA was added to a batch of QDs and 16 40g TOPO and
50 37 degassed at 140 C for 3 hours. It appeared as though HDA caused the QDs to stick to the uncoordinated ligand molecules during purification, so HDA was no longer used for overcoating. The system was switched from the N 2 atmosphere to vacuum and degassed for 2 3 hours to remove water and air, a purified QD solution was added, and the toluene evaporated. To prevent letting air into the solution when adding QDs, in one system, the QDs were first dried by evaporating toluene off, then TOPO and TOP were added and degassed. Raising the temperature far above 70 C (e.g. 128 C) before adding the purified QD solution caused the toluene to boil violently due to the low pressure and elevated temperature. TOPO was pushed up into the Schlenk line where it solidified and clogged the glass tubing. After all the toluene boiled off, the system was switched back to N 2 and the temperature was raised to C depending on the initial core radius. If the temperature is too high, the size distribution of the QD sample broadens 1. To a scintillation vial containing 5 ml TOP in the glove box, equimolar amounts of ZnEt 2 and TMS 2 S were added, corresponding to the number of overcoating layers required for the particular core radius being used (usually 5 or 6 layers). The solution was loaded into a syringe inside the glove box and transferred quickly into the addition funnel to avoid exposure to air. Slowly, the solution was added into the TOPO/QD mixture at a rate of about ½ drop per second. The temperature was lowered to 80 C and the solution stirred overnight, which improved the quality of the shell. Qu et al. describe a procedure in which the synthesis and overcoating take place successively without a purification step between them 12. In one process, the Cd and Se precursors were injected into coordinating solvents at 325 C and after 1 ½ hour, the Zn and S precursors were added as well. In another process, butanol was added to the newly synthesized QDs without
51 38 purification and set aside. 20g TOPO was degassed and the QD/butanol solution was added at 70 C. The overcoating precursors were then added, but by the next day, the TOPO had solidified. The final one-step synthesis/overcoating involved using 10 g HDA with 30 g TOPO and degassing at 140 C for 2 hours, before adding unpurified QDs in butanol. The butanol was evaporated at C and the temperature was raised before addition of the Zn and S precursors. 3.5 Purification and Size Selection The temperature of the solution was kept above 60 C before being diluted to prevent TOPO from solidifying. Dilution with equal volumes (about 4 ml each) of toluene, butanol, and hexane was found to be best to prevent solidification. When hexane was used alone, the solution solidified, probably forming irreversible aggregates. Placing the vials in the refrigerator also caused solidification and aggregation. When butanol was used alone, aggregation seemed to occur, but at a slower rate than with hexane. Using too much solvent on the other hand made the solution overly dilute, so QDs could not be recovered from solution. The QD/solvent solution was poured into several 20 ml scintillation vials (with each having about 5 ml) and methanol was added until the QDs began to precipitate. If precipitation did not occur, each solution was split into more portions since they may be too concentrated. The vials were centrifuged at 3500 rpm for 10 minutes and the QDs dropped out of solution. The solvents were decanted and discarded. The QDs were dried by spreading around carefully on the bottom of each vial using a spatula, placing the vials uncovered at the back of a fume
52 39 hood, and leaving them to dry by evaporation of the methanol. They were then resuspended in a small volume of toluene using a sonic bath. On the rare occasion that a monodisperse sample was not produced, size-selection was carried out. When the QDs were freshly synthesized, the solution was diluted with butanol, divided into 5 ml portions in scintillation vials and topped off with butanol and about 30 drops of methanol. Centrifugation resulted in two sizes of QDs emerging larger ones dropped out of solution and smaller ones remained suspended. The solution was decanted, divided into 5 ml portions again and 10 ml methanol added. The QDs remaining in the first vials were resuspended in toluene and the second vials were centrifuged to drop the remainder of the QDs out. 3.6 Characterization A handheld ultraviolet fluorescent lamp (UV lamp) is used to initially check the color of QDs after synthesis and overcoating (Figure 3-3). This gives a general indication of the size and emission wavelength of nanocrystals produced (Table 3-1). A Varian Cary 50 Bio Ultraviolet-visible (UV/Vis) spectrophotometer was used to measure the absorption profile of each QD sample. Briefly, the same solvent used to dissolve the QD sample was used to create a blank in a plastic cuvette. About 3 5 drops of QD solution was added to the blank and mixed with a pipette. The spectrophotometer was used to collect the spectrum.
 was prepared.")
53 40 Figure 3-3: Different sized QD samples emitting fluorescence while being illuminated by a UV-lamp An Horiba Jobin Yvon Fluoromax -4 spectrofluorometer was used to measure the emission profile of each QD sample. A cuvette with a very dilute sample of QD solution (such that the color of the solution was barely visible in normal light) was prepared. The fluorescence spectra were obtained using an excitation wavelength of 350 nm and 2 nm as the monochromator slit width. The literature values for the fluorescence wavelengths emitted by QDs relative to size are given in Table , 14 Table 3-1: Approximate breakdown of sizes, colors and emission wavelengths of quantum dots Size (nm) Color Emission Wavelength (nm) 2 Blue Green Yellow Orange Red
54 41 Figure 3-4 contains the absorption and emission data for a population of thirty QD samples prepared with the methods described in Sections 3.2 to 3.5. The average absorption and emission peak wavelengths are plotted against the fluorescence color observed using a handheld UV lamp. These results closely follow the colors and wavelengths predicted in the literature 13, 14 as evidenced in Table 3-1. The difference between the absorption and emission peak wavelengths is the Stokes shift which averaged approximately 25 nm over the thirty sample population. 600 Wavelength (nm) Absorbance Emission 0 Fluorescence Color Observed Figure 3-4: Average absorption, emission peak wavelengths, and fluorescence colors of thirty QD samples The crystallinity of the QDs was determined using transmission electron microscopy (TEM) of CdSe/ZnS core/shell nanocrystals at the Ames Laboratory at Iowa State University. A 2007 JEOL kv scanning and transmission electron microscope (STEM) was used.
55 42 A carbon grid was spotted with a pure sample of concentrated QDs and the excess was blotted. The sample was too concentrated so several layers were initially seen. The sample was diluted with toluene in a Petri dish unt until very dilute and much uch less dense coverage of QDs on the carbon grid was observed observed. Lattice fringes, an approximately monodisperse size distribution, and the size of the nanocrystals (about 6 nm) were observed (Figure 3-5). 3 Supplementary TEM images can be found in Appendix I. Figure 3-5: TEM image and electron diffraction pattern of colloidally prepared CdSe/ZnS core core-shell shell nanocrystals nano The photoluminescence (PL) quantum yield (QY) is basically a measure of the fluorescence brightness of a QD sample15, however it is not stable or reproducible12, but can be improved by passivation of the core through overcoating and surface ligands. To measure the PL QY of a sample, an organic dye with an emission spectrum that overlaps that of the QD sample
56 43 considerably was chosen as a standard, in this case fluorescein. A quartz cuvette was filled with 1M sodium hydroxide solution (NaOH) and 1 2 drops of fluorescein was added (just enough to see a visible color). The absorption spectra of both the fluorescein and QD samples were taken. An absorbance on the fluorescein graph was chosen that corresponded to a wavelength on the graph occurring before the peak wavelength. This absorbance needed to be less than 0.1 but preferably less than The corresponding wavelength was recorded. The fluorescein emission spectrum was then taken for both the dye and the QD samples with the excitation wavelength set to the wavelength chosen from the absorption profile and a 1 nm monochromator slit width. The wavelength to start collecting emission was set at a point about 10 nm greater than the excitation wavelength and the spectrum was taken. The area under the emission curve was calculated by integration and the following equation used to calculate the quantum yield: Φ Φ Grad n Grad Where Φ X is the fluorescence quantum yield of the QD sample, Φ ST is the fluorescence quantum yield of the standard (fluorescein), Grad is the gradient of a plot of integrated fluorescence intensity versus absorbance of each sample, and n is the refractive index of each n solvent. The Grad values can be calculated from for both the sample and the standard, using the absorption value chosen before emission spectra were taken. PL QY values for the core CdSe nanocrystals were found to range from 13 48% in most syntheses we performed. For the ZnS overcoated QDs the values ranged from 7 35%, with lower values resulting when the overcoating process was flawed.
57 References 1. Clapp, A. R.; Goldman, E. R.; Mattoussi, H., Capping of CdSe-ZnS quantum dots with DHLA and subsequent conjugation with proteins. Nat Protoc 2006, 1, (3), Peng, Z. A.; Peng, X., Formation of high-quality CdTe, CdSe, and CdS nanocrystals using CdO as precursor. Journal of the American Chemical Society 2001, 123, (1), Murray, C. B.; Norris, D. J.; Bawendi, M. G., Synthesis and characterization of nearly monodisperse CdE (E = sulfur, selenium, tellurium) semiconductor nanocrystallites. J. Am. Chem. Soc. 1993, 115, (19), Dabbousi, B. O.; Rodriguez-Viejo, J.; Mikulec, F. V.; Heine, J. R.; Mattoussi, H.; Ober, R.; Jensen, K. F.; Bawendi, M. G., (CdSe)ZnS Core-Shell Quantum Dots: Synthesis and Optical and Structural Characterization of a Size Series of Highly Luminescent Materials. J. Phys. Chem. B. 1997, 101, (46), Hines, M. A.; Guyot-Sionnest, P., Synthesis and characterization of strongly luminescing ZnS-Capped CdSe nanocrystals. J. Phys. Chem. 1996, 100, (2), Talapin, D. V.; Rogach, A. L.; Kornowski, A.; Haase, M.; Weller, H., Highly Luminescent Monodisperse CdSe and CdSe/ZnS Nanocrystals Synthesized in a Hexadecylamine-Trioctylphosphine Oxide-Trioctylphosphine Mixture. Nano Letters 2001, 1, (4), Jarosz, M. V.; Stott, N. E.; Drndic, M.; Morgan, N. Y.; Kastner, M. A.; Bawendi, M. G., Observation of Bimolecular Carrier Recombination Dynamics in Close-Packed Films of Colloidal CdSe Nanocrystals. Journal of Physical Chemistry B 2003, 107, (46),
58 45 8. Wuister, S. F., Van Driel, F., Meijerink, A., Luminescence of CdTe nanocrystals. Journal of Luminescence 2003, , (SPEC), Sapra, S., Rogach, A.L., Feldmann, J., Phosphine-free synthesis of monodisperse CdSe nanocrystals in olive oil. J. Mater. Chem. 2006, 16, Yu, W. W.; Peng, X., Formation of high-quality CdS and other II-VI semiconductor nanocrystals in noncoordinating solvents: Tunable reactivity of monomers. Angewandte Chemie, International Edition 2002, 41, (13), Terés, S.; Barceló-Coblijn, G.; Benet, M.; Álvarez, R.; Bressani, R.; Halver, J. E.; Escribá, P. V., Oleic acid content is responsible for the reduction in blood pressure induced by olive oil. Proceedings of the National Academy of Sciences 2008, 105, (37), Qu, L.; Peng, Z. A.; Peng, X., Alternative Routes toward High Quality CdSe Nanocrystals. Nano Letters 2001, 1, (6), Hermanson, G. T., Bioconjugate Techniques. Academic Press: San Diego, Bruno, T. J.; Svoronos, P. D. N., CRC handbook of fundamental spectroscopic correlation charts. CRC Press: Boca Raton, FL, Qu, L.; Peng, X., Control of Photoluminescence Properties of CdSe Nanocrystals in Growth. Journal of the American Chemical Society 2002, 124, (9),
59 46 CHAPTER 4. LIGAND EXCHANGE METHODS 4.0 Introduction The native hydrophobic surface ligands (e.g. TOP/TOPO/HDA) present a challenge when attempting to use quantum dots for single-molecule imaging in live cells, in vivo imaging, and other biological applications. This is because the surface ligands need to be changed or the whole QD has to be encapsulated to enable solubility in aqueous media and provide biocompatibility, while maintaining the desirable properties such as small size, high quantum yield, and ph stability. At the same time, biomolecules and receptors must be easily appended to the QD to facilitate sensing applications 1, 2. For these reasons, surface modification plays an essential role as QDs are applied to biological systems. One of the advantages of compact hydrophilic QDs is that targeted studies can be carried out such as efficient FRET-based sensing with small QD to acceptor ratios and use in cellular uptake and imaging 2-4. This chapter mainly focuses on methods used to displace the hydrophobic ligands using small hydrophilic organic molecules, some of which are derivatizable using general bioconjugation techniques. In Section 4.1, the most commonly used hydrophilic surface ligand in the literature (dihydrolipoic acid DHLA) is discussed. Section 4.2 focuses on the synthesis, purification, and characterization of one modification to DHLA by appending a diamine molecule to the carboxylic end. An organophosphine derivative that is similar to trioctylphosphine (TOP) and that provides ph stability to QDs in acidic media is covered in
60 47 Section 4.3. Finally, various surfactants, amino acids, and amine-containing molecules are attempted as ligands in Section Dihydrolipoic Acid (DHLA) Dihydrolipoic acid (DHLA) is a very stable dithiol molecule because of the strong interactions of the two sulfur groups with the QD surface, but it is not very easily derivatizable. Water solubility of the QDs also depends on the ionization state of the carboxylic acid group, so DHLA capped quantum dots are unstable and tend to slowly aggregate in slightly acidic solutions 1, 2. DHLA-capped QDs in basic media can be stable for at least a year 2. DHLA is formed by the reduction of the 1,2-dithiolane ring of thioctic acid (also called α-lipoic acid) using sodium borohydride (NaBH 4 ) (Figure 4-1). Figure 4-1: DHLA formation by the reduction of thioctic acid using sodium borohydride in a sodium bicarbonate solution DHLA was prepared by modifying procedures previously described 2, 5. Fresh chemicals were essential for successful reduction of the disulfide bond in thioctic acid. For the reduction step, 6 g of thioctic acid and 117 ml of a 0.25 M solution of sodium bicarbonate (NaHCO 3 ) were mixed in an Erlenmeyer flask in an ice bath. 2.8 g of NaBH 4 was slowly added in aliquots of about mg and the mixture stirred for at least 1 hour. Allowing the reaction to stir for about four hours produced the best results. The solution changed from the bright yellow color
61 48 of thioctic acid to completely clear, indicating all the disulfide bonds had been broken. The DHLA was extracted by adding 100 ml of toluene, resulting in a two-phase solution. The bottom aqueous layer was acidified to ph 1 using concentrated HCl and the reduced thioctic acid (DHLA) transferred into the organic phase, resulting in a milky, white appearance. The phases were separated using a separatory funnel and the organic phase collected. Magnesium sulfate powder was added to remove any excess water from the organic phase, causing the solution to become clear, and was then filtered off with a Buchner funnel and vacuum. The solvent (toluene) was removed using a rotary evaporator (rotavap) at about C. The pure DHLA was a clear, colorless, highly viscous liquid and was stored in a freezer Ligand Exchange Procedure For effective ligand exchange to occur, the core/shell quantum dots needed to be dispersed in an excess of pure DHLA. QDs were precipitated out of solution using methanol, centrifuged, and the supernatant decanted. They were then air dried and weighed. DHLA was added to the dried QDs at a rate of about 2 ml DHLA per gram and stirred at C for at least 2 3 hours to displace the native hydrophobic shell (Figure 4-2). The solution was diluted with 4 ml of dimethylformamide (DMF), which is a polar solvent that is miscible with water. The deprotonation of the terminal carboxyl group on DHLA is responsible for its stability in aqueous media 2. Therefore an excess of the strong organic base, potassium tert-butoxide (K[t-BuO]) was slowly added while stirring until the QDs began precipitating out of solution. We found that about five times the initial mass of QDs was the best amount of K[t-BuO] needed for complete deprotonation of the terminal carboxyl group of DHLA. The solution was sedimented by centrifugation and the supernatant was discarded. The QDs were
62 49 redispersed in water and the acidity tested with ph paper. A ph of about 12 produced the best stability. The water soluble QDs were purified to remove excess K[t-BuO] and residual DMF by centrifugation using a centrifugal filter about five times and redispersed in a small volume of ultrapure water. A 0.45 µm disposable syringe filter was used as an additional purification step, resulting in a clear solution. These DHLA-capped QDs were stored in a refrigerator and found to stilll be stable and fluorescent several months later. Figure 4-2: Schematic representation of a layer of DHLA molecules on the outer surface of a quantum dot Characterization of DHLA-Capped Quantum Dots Water-soluble QDs were characterized by the same methods used for the core and shell overcoated QDs. Absorption and emission spectra were obtained as before (Figure 4-3), and the photoluminescence quantum yield was calculated to be about %, which was
63 50 lower than both the core and the overcoated QDs. This can be explained by the decreased passivation provided by DHLA as compared to TOP/TOPO and other hydrophobic ligands. In neutral and basic media, the values remained around 10 11%, while in acidic solutions, QY was found to be only about 2%. The absorption profile of the DHLA-capped QDs is the same as that of the core/shelll overcoated QDs, and both are red-shifted about 10 nm as compared to the CdSe core QDs. Figure 4-3: Absorption and emission spectra of a DHLA-coated water-soluble QD sample compared to the core and core/shell absorption profiles 4.2 Amine-Terminated Dihydrolipoic Acid Thioctic acid can be covalently modified by carbodiimide coupling chemistry to create amine-terminated ligands that would potentially improve the solution properties of QDs by increasing the ph solubility range 1. In this section, a large excess of 1,3-diaminopropane
64 51 (DAP) is appended to the carboxyl end of thioctic acid using a procedure modified from similar carbodiimide conjugations in the literature 1, 2, 7 (Figure 4-4). Figure 4-4: Amine-terminated DHLA synthesized by carbodiimide coupling chemistry Briefly, 10 mol 1,3-diaminopropane (DAP), 1 mol thioctic acid (TA), 0.2 mol of the nucleophilic catalyst dimethylaminopyridine (DMAP), and 55 mol of the solvent dichloromethane (DCM) were mixed in an Erlenmeyer bulb and degassed for about 30 minutes under N 2 gas. The flask was placed in an ice bath and 1.1 mol N,Ndicyclohexylcarbodiimide (DCC) was dissolved in 5.5 mol of DCM and added drop wise. The reaction proceeded for 24 hours, stirring under N 2 gas and a white, crystalline product formed in the solution. In this condensation reaction (depicted in Figure 4-5), the carbodiimide, DCCC [2], activated the carboxyl group on thioctic acid [1], and produced the intermediate carboxylic ester, O- acylisourea [3]. This intermediate reacted with the amine, DAP [4], to form the amine- precipitate terminated thioctic acid (TA/DAP) [5], which is an amide, and a white crystalline called N,N-dicyclohexylurea (DCU) [6], which is removed by filtration. Side reactions of the O-acylisourea can occur, with one resulting in the desired product. In the presence of excess thioctic acid [1], an acid anhydride (α-lipoic anhydride) [7] may form, whichh then reacts with the DAP [4] to produce TA/DAP [5] and thioctic acid [1]. One undesired reaction pathway entails O-acylisourea [3] rearranging to form N-acylurea [9], which is very stable. Using a
65 52 solvent such as dichloromethane (DCM) minimizes this side reaction because it has a low dielectric constant of (i.e. a non-polar solvent). Figure 4-5: Carbodiimide coupling reactions for the formation of amine-terminated thioctic acid Figure 4-6 shows 1 H NMR spectra of TA/DAP and some of the compounds used in the synthesis, obtained with a Varian VXR-300 nuclear magnetic resonance (NMR) spectrometer. The multiplet peaks between 1.5 and 3.5 ppm in the thioctic acid spectrum can be seen in the TA/DAP spectrum as well. The DAP peaks at 1.5 and 2.5 ppm are also apparent in the TA/DAP spectrum with the 2.5 ppm peeak shifted slightly to 2.7 ppm in the TA/DAP spectrum.
66 53 Figure 4-6: 1 H NMR spectra of TA/DAP and some of the compounds used for the synthesis Purification of TA/DAP Filtration The white crystalline product was filtered out with a Buckner funnel, filter paper, and vacuum pump 2 or 3 times and the crystals rinsed with extra DCM. Over the course of several days, crystals continued to form, so the solution was filtered approximately every two days. Cooling the solution did not seem to alter the rate of crystal formation at all. From NMR spectra (Figure 4-7) the slow crystallization product turned out to be mostly composed of the polyamine, diaminopropane (DAP).
67 54 Figure 4-7: 1 H NMR spectra of DAP and the white crystalline precipitate recovered from reaction Aliphatic amines (such as DAP) are reasonably strong bases because of the alkyl substituents so they form water soluble salts that are insoluble in organic solvents when combined with acids 9. This may be the explanation for the crystallization of the excess DAP. NR 3 + HCOOH [NHR 3 ] + [HCOO] - Lower ratios of DAP to TA were tried in an attempt to minimize the amount of time required for crystal formation. Ratios of 1 TA:3 or 5 DAP were tried, with the 1:5 ratio producing the best results because it appeared as though the 1:3 ratio reaction produced some different products, probably following one of the undesirable reaction pathways mentioned earlier. Lowering the amount of DAP did not reduce the time needed for crystal formation, which ranged from 7 to 24 days regardless of the amount of DAP used. From a calculation of the total mass of crystals expected ed from DAP, DCC, and DMAP, it was found that from 20 76% these reactants did not crystallize out, but remained in solution, so extensive purification measures needed to be undertaken.
68 Column Chromatography Whatman brand aluminum backed, flexible thin layer chromatography (TLC) plates were spotted with TA/DAP, placed in a developing chamber with a 6% methanol to chloroform solvent ratio and ninhydrin (triketohydrindene hydrate C 9 H 6 O 4 ) was used to detect the TA/DAP spots. Ninhydrin is useful for the detection of primary and secondary amines on TLC plates. It reacted with the free amines, evolving a deep blue/purple color called Ruhemann s purple. Another color appeared above the purple (yellowish-orange) on the TLC plate indicating the presence of an iminium salt which results when a secondary amine is present. The TA/DAP sample was run through a chromatography column but chemically interacted with the silica gel and did not move through the column Acetylation To prevent the TA/DAP from interacting with the silica column the amine groups were modified by acetylation using pyridine and acetic anhydride with DMAP as a catalyst. TLC was performed on the product with a 3% methanol in chloroform solution using iodine vapor and basic potassium permanganate (KMnO 4 ) solution to stain the plates. KMnO 4 was able to stain the tertiary amines produced by acetylation. A chromatography column was again used to purify the TA/DAP, with better results this time. The TA/DAP moved through the column, separated well, and a pure product was collected. The deacetylation of the TA/DAP was not possible because the sodium methoxide used would cleave both the acetyl and the amide bonds on the molecule. The use of sodium borohydride was attempted, but it was not strong enough to cleave the acetyl group, although it was able to reduce the disulfide bond.
69 56 Figure 4-8: 1 H NMR spectra of acetylated TA/DAP compared to the non-acetylated product Reduction of Disulfide Bond The same procedure used for reducing thioctic acid was followed to reduce TA/DAP. Instead of sodium bicarbonate, a 2:1 ratio of ethanol to water was used to dissolve the sample. Sodium borohydride (NaBH 4 4) was slowly added and the solution stirred for two hours. The solution changed from yellow to clear when the disulfide bond of thioctic acid was broken. Leaving the solution stirring too long caused the disulfide bond to re-form. Either toluene with acid at ph 1 or chloroform orm was used to extract the pure TA/DAP from aqueous solution, after an additional amount of water had been added to increase the polarity of the solution. Judging from the volumes of product recovered, it appeared as though the extraction removed not only the TA/DAP AP very well, but also all the original reactants in solution. Yields of about % were realized, but impurities made up a portion of the product. NMR spectra of the reduced TA/DAP indicated that there may have been both reduced and unreduced TA/DAP in the sample (Figure 4-9).
70 57 Figure 4-9: 1 H NMR spectra of reduced TA/DAP compared to the non-reduced product Ligand Exchange Running the reduced TA/DAP through a syringe filter before use removed solid impurities and produced a clear solution. This solution was stirred with QDs overnight and remained very bright. After the addition of DMF, HCl was used to precipitate the QDs out of solution. Resuspension in water did not turn out well because many of the QDs fell out of solution, possibly indicating incomplete cap exchange or too many impurities in solution. The QDs however remained very bright. 4.3 Tris(3-hydroxypropyl)phosphine (THPP) The quantum yield of QDs is diminished when thiols are used for ligand exchange because they do not electronically passivate the surface as well as organophosphines do 10. In this section, the organophosphine derivative, tris(hydroxypropyl)phosphine roxypropyl)phosphine (THPP) (Figure 4-10) is used for ligand exchange. The formula weight of THPP (208.24) 11 is very similar to that of DHLA ( ) so the same amounts were used to displace the native hydrophobic surface ligands.
71 58 Figure 4-10: Structure of tris(hydroxypropyl)phosphine (THPP) QDs were combined with THPP and sonicated for 40 minutes. Since THPP was extremely viscous, the QDs did not disperse easily in such a small volume. The mixture was placed in an oil bath and stirred for 24 hours at 80 C under N 2 gas. The QDs fluoresced very brightly when illuminated by a UV lamp. Water was added to the mixture and a clear solution resulted. ph stability was tested using hydrochloric acid and sodium hydroxide solutions. The initial ph was 8 and despite the addition of a large amount of acid, the solution acted as a buffer around ph 7. Continued addition of acid eventually dropped the ph to 2 and the QDs remained very stable and bright throughout. The addition of base changed the ph more rapidly, but the solution remained stable and bright. Although the solution started out with a yellow fluorescence color, after a few minutes, the basic sample changed to orange fluorescence. Over time, the QDs begun precipitating out of the basic solution and were no longer quite as bright. Absorption and emission spectra (Figures 4-11 and 4-12) were obtained for the original neutral sample and both the acidic and basic samples. All three samples had peak absorptions at 555 nm, but the basic sample had a peak emission at 579 nm, unlike the other two samples
72 59 at 568nm. The PL QY of the neutral THPP-capped QDs was calculated to be 1.6%, and that of the acidic sample was 2.7% Figure 4-11: Absorption spectra of THPP-coated QDs in neutral, acidic, and basic solutions Intensity 5.E+06 4.E+06 4.E+06 3.E+06 3.E+06 2.E+06 2.E+06 1.E+06 5.E+05 0.E Wavelength (nm) Neutral ph2 ph12 Figure 4-12: Emission spectra of THPP-coated QDs in neutral, acidic, and basic media, showing the red-shift of the basic solution
73 60 Next, a mixture of DHLA and THPP was used for the ligand exchange procedure. Protonation of the DHLA carboxyl was achieved using K[t-BuO] and the QDs suspended readily in ultrapure water. ph testing indicated that the QDs were soluble in neutral and basic media, but not in acidic solution, although they remained bright. The absorption spectra for these samples are shown in Figure No QD absorption onset peak could be seen for any of the samples Absorbance Wavelength (nm) DHLA/THPP ph 12 ph 1-2 Figure 4-13: Absorption spectra of DHLA/THPP-coated QDs in neutral, acidic, and basic solutions 4.4 Alternative Ligands Several hydrophilic organic molecules were studied as potential surface ligands for QDs. This section outlines the attempts made to displace the native hydrophobic surface cap with alternative ligands.
74 α-lipoamide Figure 4-14: Structure of α-lipoamide Due to its similarity to thioctic acid, α-lipoamide was deemed a potentially valuable ligand for water solublization because it possesses a dithiol for binding to the QD surface and the amine functional group that could possibly provide solubility in acidic media. The procedure for reducing the disulfide bond to produce DHLA from thioctic acid was followed. α- lipoamide was not very soluble in sodium bicarbonate and formed beads on top of the solution. When NaBH 4 was added and the solution stirred for four hours, thick, insoluble foam was slowly formed above the solution. Solubility tests were then done on α-lipoamide using ultrapure water. The mixture was gradually acidified to ph 1 with hydrochloric acid and basified to ph 12 with sodium hydroxide. α-lipoamide was found completely insoluble in all ph solutions from ph 1 to 12. The process used for TA/DAP reduction with a 2:1 ratio of ethanol to water was attempted next. The α-lipoamide was partially soluble in the mixture, so NaBH 4 was added and stirred for four hours. The solution changed from yellow to white, indicating the disulfide bond had been broken. The solution was diluted with water to increase its polarity and then chloroform was used for extraction. The reduced α-lipoamide was a clear, viscous solution but after 24 hours, large round crystals formed.
75 ,3-Diaminopropane (DAP) DAP was used in a manner similar to that for DHLA ligand exchange by adding it to QDs and stirring at C for 30 minutes under N 2 gas. The QDs were not found to be water soluble by this method DHLA and Diaminopropane Mixture A 60:40 mole ratio of DHLA to 1,3-diaminopropane (DAP) was prepared using 1 ml DHLA and 0.27 ml DAP. When mixed together, the mixture became gel-like, but liquefied upon heating. QDs were stirred in this mixture overnight, and then 5 ml of DMF was added. K[t- BuO] was used to deprotonate the DHLA carboxyl, but the solution began to solidify, so it was centrifuged and the supernatant discarded. The QDs were resuspended in water and seemed soluble. A centrifugal filter was used to purify the solution, but the QDs precipitated out of the solution after centrifugation, indicating the ligands were unstable on the QD surface γ-aminobutyric acid (GABA) Figure 4-15: Structure of γ-aminobutyric acid Solubility tests were performed on the solid compound γ-aminobutyric acid (GABA) in an attempt to use it for QD ligand exchange tests. It was found to be completely insoluble in N,N-dimethylformamide (DMF), dimethyl sulfoxide (DMSO), hexane, butanol, acetone, and
76 63 chloroform. In toluene and ethanol, it was slightly soluble and was completely soluble in water, 1,3-diaminopropane (DAP), and methanol. Since QDs are insoluble in water and methanol, these solvents could not be used to dissolve GABA for ligand exchange Surfactant Encapsulation The hydrophobic interiors of surfactant micelles are capable of holding hydrophobic quantum dots In this study, a cationic detergent, cetyltrimethylammonium bromide (CTAB) and an anionic detergent, lauryl sulfate (sodium dodecyl sulfate or SDS) were used to encapsulate hydrophobic QDs (Figure 4-16). A mole ratio of 1 QD:300 surfactant molecules was chosen based on literature values 14. Figure 4-16: Structures of the surfactants SDS (top) and CTAB (bottom) A concentrated QD solution was prepared using a ratio of 1 ml of chloroform to 0.1 g of pre-dried, pre-weighed QDs. The surfactants were dissolved in water to a concentration slightly below each of their critical micelle concentration (CMC) values of M for CTAB 17 and M for SDS 18. With the surfactant solutions vigorously stirring, the QD solutions were added drop wise in an attempt to form an oil-in-water micro-emulsion. In SDS, the QD solution dissolved readily but produced a milky appearance, however, in CTAB, the QD solution was completely insoluble and sank to the bottom of the flask initially. After more stirring, it dispersed a little, but not completely. Each solution stirred for
77 minutes, but no micro-emulsion formed since the solutions did not become clear and the QDs stuck to the stir bars and sides of the flasks. Chloroform was slowly evaporated while stirring and heating to 65 C, therefore transferring the QDs into the aqueous phase. The solutions were poured into vials, where some precipitation was immediately observed. Both the solutions and the precipitates were very fluorescent. Absorption and emission spectra were taken of the solutions. The emission spectrum closely resembled that of the original QDs with a slight red-shift (Figure 4-18) E E E E+06 Absorbance E+06 5.E+06 4.E+06 3.E+06 Intensity Absorbance Emission E E E Wavelength (nm) Figure 4-17: Absorption and emission spectra of an SDS-encapsulated water-soluble QD sample
78 65 Intensity 5.E+06 5.E+06 4.E+06 4.E+06 3.E+06 3.E+06 2.E+06 2.E+06 1.E+06 5.E+05 0.E Wavelength (nm) QD & CTAB core/shell QD Figure 4-18: Emission spectrum of a CTAB-encapsulated water-soluble QD sample compared to that of the TOP/TOPO covered core/shell QD sample The ph stability of the encapsulated QDs was tested using HCl and NaOH (initial ph was 7). The ph of SDS-covered QDs dropped fast with the addition of acid, and the QDs begun to become insoluble around a ph of 3, although still remaining fairly fluorescent. By ph 1 they were barely fluorescent anymore. The ph of CTAB-covered QDs took longer to reduce, but the fluorescence faded faster. By ph 3 they were barely fluorescent at all. When base was added, the SDS-covered QDs were still soluble and very bright at ph 12. The CTAB-covered QDs were still bright but some QDs precipitated out by ph 12. Both solutions remained bright and seemed more stable in basic ph than acidic solutions Amino Acid Modification of Thioctic Acid The procedure for TA/DAP synthesis in Section 4.2 was followed using 5 mol each of L- Lysine and L-Glutamine (Figure 4 19) instead of diaminopropane. Neither amino acid was
79 66 soluble in DCM so the reactions were unable to proceed as usual. An aqueous system is the only way for this reaction to proceed, so carbodiimide coupling using 1-ethyl-3-(3- dimethylaminopropyl) carbodiimide hydrochloride (EDC) in combination with N- hydroxysuccinimide (NHS) may be used to produce amino acid modified DHLA. Figure 4-19: Structures of the amino acids L-Lysine (left) and L-Glutamine (right) used in the modification process 4.5 References 1. Liu, W.; Howarth, M..; Greytak, A. B.; Zheng, Y.; Nocera, D. G.; Ting, A. Y.; Bawendi, M. G., Compact biocompatible quantum dots functionalized for cellular imaging. J Am Chem Soc 2008, 130, (4), Susumu, K.; Uyeda, H. T.; Medintz, I. L.; Pons, T.; Delehanty, J. B.; Mattoussi, H., Enhancing the stability and biological functionalities of quantum dots via compact multifunctional ligands. J Am Chem Soc 2007, 129, (45), Clapp, A. R.; Medintz, I. L.; Mauro, J. M.; Fisher, B. R.; Bawendi, M. G.; Mattoussi, H., Fluorescence resonance energy transfer between quantum dot donors and dye-labeled protein acceptors. J. Am. Chem. Soc. 2004, 126, (1), Clapp, A. R.; Medintz, I. L.; Mattoussi, H., Forster resonance energy transfer investigations using quantum-dot fluorophores. Chemphyschem 2006, 7, (1),
80 67 5. Clapp, A. R.; Goldman, E. R.; Mattoussi, H., Capping of CdSe-ZnS quantum dots with DHLA and subsequent conjugation with proteins. Nat Protoc 2006, 1, (3), Hermanson, G. T., Bioconjugate Techniques. Academic Press: San Diego, Nakajima, N.; Ikada, Y., Mechanism of Amide Formation by Carbodiimide for Bioconjugation in Aqueous Media. Bioconjugate Chem. 1995, 6, (1), Weast, R. C., CRC handbook of chemistry and physics : a ready reference book of chemical and physical data. Chemical Rubber Co.: Cleveland, Ohio, Lawrence, S. A., Amines : synthesis, properties, and applications. Cambridge University Press: New York, Kim, S.; Bawendi, M. G., Oligomeric Ligands for Luminescent and Stable Nanocrystal Quantum Dots. J. Am. Chem. Soc. 2003, 125, (48), Materials Safety Data Sheet: Hishicolin P (20 October 2008) 12. Dubertret, B.; Skourides, P.; Norris, D. J.; Noireaux, V.; Brivanlou, A. H.; Libchaber, A., In vivo imaging of quantum dots encapsulated in phospholipid micelles. Science (Washington, D. C.) 2002, 298, (5599), Fan, H. Y.; Leve, E. W.; Scullin, C.; Gabaldon, J.; Tallant, D.; Bunge, S.; Boyle, T.; Wilson, M. C.; Brinker, C. J., Surfactant-assisted synthesis of water-soluble and biocompatible semiconductor quantum dot micelles. Nano Letters 2005, 5, (4), G. Sui, J. O., X. Ji, K. M. Gattás-Asfura, R. M. Leblanc and M. Micic, Surface Chemistry Studies of Quantum Dots (QDs) Modified with Surfactants. Journal of Cluster Science 2003, 14, (2),
81 Chen, Y.; Rosenzweig, Z., Luminescent CdSe Quantum Dot Doped Stabilized Micelles. Nano Letters 2002, 2, (11), Zhelev, Z.; Ohba, H.; Bakalova, R., Single quantum dot-micelles coated with silica shell as potentially non-cytotoxic fluorescent cell tracers. J Am Chem Soc 2006, 128, (19), Bales, B. L.; Messina, L.; Vidal, A.; Peric, M.; Nascimento, O. R., Precision Relative Aggregation Number Determinations of SDS Micelles Using a Spin Probe. A Model of Micelle Surface Hydration. J. Phys. Chem. B 1998, 102, (50), Neugebauer, J. M., Detergents: an overview. Methods Enzymol 1990, 182,
82 69 CHAPTER 5. EMBEDDING QUANTUM DOTS IN POLYMER MICROSPHERES 5.0 Introduction Encapsulating quantum dots in polymer shells is a good way to functionalize their surfaces and manipulate their solution properties. By embedding QDs in polymer microspheres, their unique optical properties such as simultaneous excitation and size-tunable emission can be utilized for applications such as multiplexing 1 and controlled drug delivery 2-5. Some of the encapsulation methods described in this chapter were complicated by aggregation of the microspheres and low QD uptake. Section 5.1 illustrates the results of embedding QDs by swelling polystyrene beads. An oil-oil emulsion technique is employed in Section 5.2 for encapsulating QDs in polymer microspheres. Finally, a four-stream vortex mixer is used to create microspheres with a smaller size distribution and higher fluorescence intensity. 5.1 QD Tagged Carboxyl Terminated Polystyrene Beads In microfluidic systems, measurements of flow fields have been traditionally done with fluorescent dye-tagged polymer microspheres using particle image velocimetry (PIV). PIV is the method used to optically measure properties of a fluid such as the velocity 6, 7. The use of quantum dots instead of dyes in this type of system is advantageous because of the superior properties QDs possess. The following procedure was used to suspend the carboxyl-terminated polystyrene beads in an organic solvent so that quantum dots could be embedded in them. One drop of 2 µm
83 70 polystyrene beads in water was placed in a small Eppendorf tube, ultrapure water (resistivity > 18 MΩ cm) was added, and the solution mixed with a vortex mixer. The mixture was then centrifuged at a rate of 4500 rpm for 5 minutes. This caused aggregates to form, so 2500 rpm for 3 minutes was used instead. The water was decanted and ethanol added to the polystyrene beads. The solution was mixed again with the vortex mixer, centrifuged, and decanted. Butanol was added next and the above procedure was repeated. A 5% chloroform in butanol solution was prepared and added to the polystyrene beads and was left for 30 minutes to enable the beads to swell. 15 µl of a highly concentrated solution of QDs in toluene was added to the swelled beads, vortexed and left for an hour to allow the QDs to diffuse into the beads. The solution was mixed again with the vortex mixer, placed in a sonic bath for a few minutes, centrifuged, and the supernatant decanted. Butanol was added to rinse the beads and the solution was mixed again, centrifuged and, decanted. Finally the solution was resuspended in butanol and stored in a refrigerator. The QD-tagged polystyrene beads were used for PIV. However, due to the low uptake of QDs by the polystyrene during the swelling procedure, no fluorescence could be observed in the PIV system. 5.2 Double-Emulsion Solid-Oil-Oil Microsphere Fabrication Bioerodible polyanhydrides have been shown to be useful for drug delivery applications 2-5. The anhydride monomers 1,6-bis(p-carboxyphenoxy)hexane (CPH) and sebacic acid (SA) in Figure 5-1 are used to form poly(cph) and poly(sa) respectively. Drug distribution studies
84 71 using poly(sa) showed that the more hydrophobic drugs were able to disperse evenly throughout the microspheres and the smaller sized spheres exhibited the best distribution 3. Figure 5-1: Chemical structures of poly(cph) (left) and poly(sa) (right) 2 Using previously established methods for encapsulating and stabilizing proteins and drugs 2-5, 8-10, quantum dots were embedded in polyanhydride microspheres with the assistance of members of the Narasimhan Research Group from the Department of Chemical and Biological Engineering at Iowa State University Frozen Heptane Precipitation Method In this method, the first emulsion consisted of 100 mg poly(sa) and 6 mg core-shell QDs covered in TOP/TOPO, dissolved in 3 ml methylene chloride. A homogenizer was used to agitate the solution at 30,0000 rpm for one minute, then 3 ml paraffin oil and 4 ml methylene chloride were added while the homogenizer was running but turned down to 10,000 rpm, forming the second emulsion. The homogenizer rate was raised to 20,000 rpm for one more minute, and then the emulsion was added drop wise to a beaker immersed in an ice bath containing 200 ml heptane and stirred for two hours. The microspheres weree filtered out of the solution and dried in a vacuum oven.


85 72 The shapes and sizes of the microspheres were determined using a JEOL 840A scanning electron microscope (SEM). From the SEM images, it was apparent that the microspheres had formed large aggregates and the desired monodisperse size distribution was not achieved (Figures 5-2 and 5-3). 50X 150X 500X 1500X Figure 5-2: SEM images of aggregated polyanhydride microspheres fabricated by frozen heptane method

 was weighed out into a 50 ml centrifuge tube and 5 ml DCM added to make a 30 mg/ml solution.")
 and precipitation")
86 X 15000X 50000X Figure 5-3: SEM images showing individual polyanhydride microspheres within an aggregate Petroleum Ether Precipitation Method In this method 16.3 mg of dried CdSe/ZnS QDs were dissolved in 13.6 ml of dichloromethane (DCM) and sonicated, resulting in a QD concentration of 1.2 mg/ml. 145 mg of poly(cph) was weighed out into a 50 ml centrifuge tube and 5 ml DCM added to make a 30 mg/ml solution. The centrifuge tube was mixed with a vortex mixer to dissolve the polymer and 5 ml of the QD solution was added. The polymer and QD mixture was poured into a 400 ml bath of petroleum ether (80:1 ratio of non-solvent to solvent) and precipitation occurred. The precipitate was filtered using a 90 cm Buchner funnel set up on a 2 L filter flask with a vacuum and Whatman No. 2 filter paper. When dry, the microspheres


87 74 were scraped off the filter paper onto a weigh boat and dried in a vacuum oven overnight. The microspheres were then transferred to a micro-centrifuge tube, weighed and stored in a desiccator in a cooler. The petroleum ether that was used for precipitation was checked for fluorescence using an Horiba Jobin Yvon Fluoromax -4 spectrofluorometer. No fluorescence was observed, indicating that all the QDs had been taken up into the microspheres. The whole procedure was repeated using poly(sa) but the poly(sa) microspheres were not as bright as the poly(cph) ones when illuminated with an ultraviolet lamp. Figure 5-4: SEM images of QD-embedded poly(cph) microspheres
.")
 microspheres Poly(SA) was again used for")


88 75 SEM images of the two microsphere samples indicated that some aggregates formed but the individual microspheres were distinguishable (Figures 5-4 and 5-5). More SEM images of the microspheres can be found in Appendix II. Figure 5-5: SEM images of QD-embedded poly(sa) microspheres Poly(SA) was again used for the precipitation procedure but instead of TOP/TOPO capped QDs, inactivated DHLA capped QDs were used. To prepare these, the QDs were precipitated out of solution using methanol and air dried. DHLA was added to the QDs, the solution agitated for 45 minutes using a sonic bath, and then stirred at 78 C for 24 hours in an N 2 (g) atmosphere. This QD solution was used for the petroleum ether precipitation method


89 76 previously described. The microspheres fluoresced when illuminated by an ultraviolet lamp. The SEM images in Figure 5-6 demonstrate some aggregation of the microspheres. More images can be found in Appendix II. 150X 1500X Figure 5-6: SEM images of inactivated DHLA-capped QD-embedded poly(sa) microspheres Total internal reflection fluorescence (TIRF) microscopy was used to image the region of a sample of the microspheres that was closest to the glass surface of the slide. TIRF uses an evanescent wave to excite and illuminate quantum dots in that region. Samples of QD-tagged microspheres were prepared. The first was a dry microsphere sample; the second was dispersed in water; and the third was dispersed in methanol. A final sample consisted of microspheres with TOP/TOPO QDs embedded in them. Video images of fluorescence from QDs in each sample were recorded with a digital camera and screenshots of these videos are presented in Figure 5-7.
 a dry sample, (b) water, and (c) methanol.")


90 77 (a) (b) (c) (d) Figure 5-7: TIRF images of fluorescence from DHLA-capped QDs embedded in microspheres in (a) a dry sample, (b) water, and (c) methanol. Image (d) is a sample of TOP/TOPO QDs in microspheres. 5.3 Diblock Copolymer QD Encapsulation One disadvantage of the precipitation methods described in section 5.2 is that the mixing is not intense enough, so the microsphere sizes tend to be relatively large (about 200 nm). Using higher energy impingement mixing, it is possible to minimize mass transfer limitations and produce smaller particles 11. In this process, a stream of polymer, QDs, and solvent is forced towards three streams of water at a high velocity. A precipitate is formed rapidly when the different streams meet and fine particles result. The following investigations were
91 78 conducted with collaborators in the Department of Chemical Engineering and Materials Science at the University of Minnesota. Dry QD samples were dissolved in tetrahydrofuran (THF) to make 10 mg/ml solutions. From each solution, 2 ml were measured out, mixed with 50 mg of either poly(lactic-coglycolic acid) (PLGA)-polyethylene glycol (PEG) copolymer or polystyrene(9.5k)- polyethylene glycol(5k) copolymer (PS-PEG). To this, 3 ml THF was added, and placed in a 5 ml syringe. Two 45 ml syringes and one other 5 ml syringe were filled with water, bringing the total volume of the system to 100 ml. Two syringe pumps were used to force the contents of the syringes into the four stream vortex mixer with the speed ratio between the 5 ml and 45 ml syringes being 1:9. All the samples showed fluorescence when illuminated by an ultraviolet lamp indicating the QDs were encapsulated within the polymer spheres. The mass and intensity averaged diameters were obtained by dynamic light scattering (DLS) analysis, and scanning electron microscopy (SEM) was used to image the shapes of the particles Intensity % d I = 405 nm Cumulative % Mass % d m = 92 nm Cumulative % Particle Diameter (nm) Particle Diameter (nm) Figure 5-8: Intensity (left) and mass (right) particle size distributions by DLS of 508 nm emitting QD polymer spheres made by turbulent mixing with PLGA-PEG copolymer
92 79 Figures 5-8 to 5-10 show the DLS results of the PGLA-PEG system using 508 and 608 nm emitting QDs. [d I and dm represent intensity average diameter and mass average diameter respectively] Intensity % d I = 364 nm Particle Diameter (nm) Cumulative % Mass % d m = 123 nm Particle Diameter (nm) Cumulative % Figure 5-9: Intensity (left) and mass (right) particle size distributions by DLS of unsonicated 508 nm emitting QD polymer spheres made by turbulent mixing with PLGA-PEG copolymer Intensity % d I = 894 nm Cumulative % Mass % d m = 157 nm Cumulative % Particle Diameter (nm) Particle Diameter (nm) Figure 5-10: Intensity (left) and mass (right) particle size distributions by DLS of 608 nm emitting QD polymer spheres made by turbulent mixing with PLGA-PEG copolymer Figures 5-11 to 5-13 show SEM images and mass average diameter DLS data of PS-PEG encapsulated QDs emitting at 506, 546, and 611 nm. Supplementary SEM images for each sample can be found in Appendix II.


93 80 d m = 167 nm Figure 5-11: SEM image and mass particle size distribution by DLS of 506 nm emitting QD polymer spheres made by turbulent mixing with PS-PEG copolymer d m = 285 nm Figure 5-12: SEM image and mass particle size distribution by DLS of 546 nm emitting QD polymer spheres made by turbulent mixing with PS-PEG copolymer d m = 235 nm Figure 5-13: SEM image and mass particle size distribution by DLS of 611 nm emitting QD polymer spheres made by turbulent mixing with PS-PEG copolymer
 high speed 12bit camera and a pulsed 532 nm emitting Nd:YAG (neodymium-doped yttrium aluminum garnet) laser.")
94 81 The QD-tagged polymer spheres were used for particle image velocimetry (PIV). The apparatus included a LaVision cooled charge-coupled device (CCD) high speed 12bit camera and a pulsed 532 nm emitting Nd:YAG (neodymium-doped yttrium aluminum garnet) laser. The QD-tagged polymer spheres each produced an intensity of counts per pixel and the background was about 40 counts per pixel (Figure 5-14). In comparison, when the same system was run using commercially produced 1 µm polystyrene tagged with fluorescein isothiocyanate (FITC) dye, an intensity of 100 counts per pixel was recorded. Figure 5-14: 12-bit camera image of QD-tagged polystyrene beads illuminated by a pulsed laser
95 References 1. Han, M.; Gao, X.; Su, J. Z.; Nie, S., Quantum-dot-tagged microbeads for multiplexed optical coding of biomolecules. Nature Biotech. 2001, 19, (7), Kipper, M. J.; Shen, E.; Determan, A.; Narasimhan, B., Design of an injectable system based on bioerodible polyanhydride microspheres for sustained drug delivery. Biomaterials 2002, 23, (22), Berkland, C.; Kipper, M. J.; Narasimhan, B.; Kim, K. K.; Pack, D. W., Microsphere size, precipitation kinetics and drug distribution control drug release from biodegradable polyanhydride microspheres. J Control Release 2004, 94, (1), Determan, A. S.; Trewyn, B. G.; Lin, V. S.; Nilsen-Hamilton, M.; Narasimhan, B., Encapsulation, stabilization, and release of BSA-FITC from polyanhydride microspheres. J Control Release 2004, 100, (1), Kipper, M. J.; Wilson, J. H.; Wannemuehler, M. J.; Narasimhan, B., Single dose vaccine based on biodegradable polyanhydride microspheres can modulate immune response mechanism. J Biomed Mater Res A 2006, 76, (4), Santiago, J. G., Wereley, S. T., Meinhart, C. D., Beebe, D. J., Adrian, R. J., A particle image velocimetry system for microfluidics. Experiments in Fluids 1998, 25, (4), Prasad, A. K., Stereoscopic particle image velocimetry. Experiments in Fluids 2000, 29, (2), Determan, A. S., Jennifer H. Wilson, Matt J. Kipper, Michael J. Wannemuehler, Balaji Narasimhan, Protein stability in the presence of polymer degradation products: Consequences for controlled release formulations. Biomaterials 2006, 27, (17),
96 83 9. Torres, M. P.; Determan, A. S.; Anderson, G. L.; Mallapragada, S. K.; Narasimhan, B., Amphiphilic polyanhydrides for protein stabilization and release. Biomaterials 2007, 28, (1), Determan, A. S.; Graham, J. R.; Pfeiffer, K. A.; Narasimhan, B., The role of microsphere fabrication methods on the stability and release kinetics of ovalbumin encapsulated in polyanhydride microspheres. J Microencapsul 2006, 23, (8), Zhu, Z.; Anacker, J. L.; Ji, S.; Hoye, T. R.; Macosko, C. W.; Prud'homme, R. K., Formation of Block Copolymer-Protected Nanoparticles via Reactive Impingement Mixing. Langmuir 2007, 23, (21),
97 84 CHAPTER 6. FLUORESCENCE RESONANCE ENERGY TRANSFER (FRET) 6.0 Introduction FRET investigations between two different engineered proteins and quantum dots are covered in this chapter. The results indicate that FRET indeed occurs between the QDs and Cy3 dyes on the protein molecules. It is also shown that there is an increase in the fluorescence intensity in each sample when only unlabeled protein molecules are placed on the surface of the quantum dots. 6.1 FRET with Quantum Dots and Proteins In fluorescence resonance energy transfer (FRET), energy is nonradiatively transferred from a donor to an acceptor fluorophore which are relatively close together 1. Dipole-dipole interactions between the two fluorophores are the driving force of FRET and these interactions depend heavily on the distance of separation between them 1, 2. Quantum dots have been shown to be useful as donors for FRET with dyes acting as the acceptor fluorophores. Multiple dyes can be placed on the surface of the quantum dots to increase the FRET rate since small changes in the distance between the two fluorophores cause a large change in the FRET intensity 2-6. Appending a polyhistidine tag onto an engineered protein labeled with a dye molecule enables the protein to self-assemble on the quantum dot surface via metal affinity interactions between the histidine tag and the shell of the QD 1, 2, 7, 8. The following Sections discuss FRET studies carried out between CdSe/ZnS core-shell quantum dots and engineered
98 85 proteins provided by the department of Biochemistry, Biophysics, and Molecular Biology at Iowa State University. Figure 6-1: Schematic representation of a protein-covered quantum dot FRET with Modified Influenza Haemagglutinin Membrane glycoproteins are the components of viruses that mediate the fusion of viral and cellular membranes for the transfer of viral genetic material into the cell. The influenza virus haemagglutinin (HA) is one of the best characterized membrane glycoproteins. HA, which is 13.5 nm in length, is composed of three identical subunits, with each one made up of two glycopolypeptides connected by a disulfide bond. The glycopolypeptides are HA 1, which has 328 residues, and HA 2, with 221 residues. The carboxyl terminus of HA 2 secures it to the viral membrane 9.

99 86 Figure 6-2: Structure of influenza haemagglutinin 10 Samples of engineered influenza virus haemagglutinin (HA) with polyhistidine tags and known concentrations were obtained. One sample of protein was labeled with Cy3 dye and the other was not. The total number of protein molecules conjugated onto each QD was kept the same but the ratio of the QD to Cy3-labeled protein was varied. Hence, each QD had some labeled and some unlabeled protein molecules attached to it. The number of moles of QD chosen was 30 picomoles and the molar ratio of QD to protein was used to calculate the volume of each needed. Core-shell CdSe/ZnS quantum dots capped with DHLA were used for the FRET investigations. A small amount (about 50 µl) of 10 mm sodium tetraborate buffer (borax) at ph 8 was pipetted into several small Eppendorf tubes. Labeled and unlabeled protein were added to the buffer and shaken to ensure neither one preferentially bound to the QDs, which were then added to the solutions and allowed to coordinate with the protein molecules at room temperature for one hour. Each Eppendorf tube was topped off with borate buffer to the
100 87 predetermined total volume which was either ml when using large quartz cuvettes or 0.25 ml for small ones. In subsequent runs, citrate-phosphate buffer (at ph 5 and 7) and HEPES (4-(2-hydroxyethyl)-1-piperazineethanesulfonic acid) buffer were used instead of borax. After an hour, fluorescence spectra were obtained using quartz cuvettes, five monochromator slits, and an excitation wavelength of 390 nm on an Horiba Jobin Yvon Fluoromax -4 spectrofluorometer. Two controls were run, one with QDs in buffer without any protein, using a 390 nm excitation, and the other with protein in buffer only, using a 500 nm excitation. For the latter control, no appreciable peak could be observed for the Cy3 dye when excited at 390 nm as is apparent in Figure E+05 4.E+06 Intensity 3.E+05 2.E+05 1.E+05 Intensity 3.E+06 2.E+06 1.E+06 0.E+00 0.E Wavelength (nm) Wavelength (nm) Figure 6-3: Fluorescence spectra of Cy3 dye-labeled protein excited at 390 nm (left) and at 500 nm (right) The rest of the samples contained varying ratios of QD to protein and were excited at 390 nm. Figure 6-4 contains data from FRET experiments using 1, 2, 3, 4, and 8 labeled protein molecules on QD, with the rest of the proteins being unlabeled up to eight total protein molecules. Borate buffer at ph 8 was used with a total volume of 0.25 ml in each sample. This volume was found to be too small for the large quartz cuvettes. Since so few protein
101 88 molecules had dye on them, the Cy3 peak is barely visible (around 564 nm) to the right of the large QD peak at 527 nm. 1.60E E+06 Intensity 1.20E E E E E E E Wavelength (nm) QD Control 1 QD : 0 Cy3 1 QD : 1 Cy3 1 QD : 2 Cy3 1 QD : 3 Cy3 1 QD : 4 Cy3 1 QD : 8 Cy3 Protein Control Figure 6-4: Influenza haemagglutinin (HA) on QDs in borate buffer with 8 total protein molecules The total volume of borate buffer was raised to 1 ml and the ratios of protein to QD were changed until a total of twelve Cy3-labeled protein molecules were placed on the QDs. A slightly more pronounced Cy3 peak was then produced (Figure 6-5). It can also be noted that the QD peak diminishes greatly in intensity when either 8 Cy3 dyes (Figure 6-4) or 12 Cy3 dyes (Figure 6-5) are present, indicating the successful transfer of energy by FRET from the QD donor to the Cy3 dye acceptor. The number of dyes present also obviously affects the FRET intensity.
102 89 Intensity 3.50E E E E E E E E Wavelength (nm) QD Control 1 QD : 0 Cy3 1 QD : 2 Cy3 1 QD : 4 Cy3 1 QD : 6 Cy3 1 QD : 8 Cy3 1 QD : 10 Cy3 1 QD : 12 Cy3 Protein Control Figure 6-5: Influenza haemagglutinin (HA) on QDs in borate buffer with 12 total protein molecules When the buffer was changed from borax to HEPES (4-(2-hydroxyethyl)-1- piperazineethanesulfonic acid), the intensity of the Cy3 fluorescence increased slightly (Figure 6-6). 2.00E+06 Intensity 1.50E E E E Wavelength (nm) QD Control 1 QD : 0 Cy3 1 QD : 2 Cy3 1 QD : 4 Cy3 1 QD : 6 Cy3 1 QD : 8 Cy3 1 QD : 10 Cy3 1 QD : 12 Cy3 Figure 6-6: Influenza haemagglutinin (HA) on QDs in HEPES buffer with 12 total protein molecules
103 90 The use of citrate-phosphate buffer increased the Cy3 fluorescence relative to the QD fluorescence still further as seen in Figures 6-7 and 6-8, with the ph of the buffer having no perceivable effect on the system when it was changed from ph 5 to E+06 Intensity 2.00E E E E E Wavelength (nm) QD Control 1 QD : 0 Cy3 1 QD : 2 Cy3 1 QD : 4 Cy3 1 QD : 6 Cy3 1 QD : 8 Cy3 1 QD : 10 Cy3 1 QD : 12 Cy3 Figure 6-7: Influenza haemagglutinin (HA) on QDs in ph 5 Citrate-Phosphate buffer with 12 total protein molecules Intensity 1.80E E E E E E E E E E Wavelength (nm) Sam1 Sam2 Sam3 Sam4 Sam5 Sam6 Sam7 Sam13 Figure 6-8: Influenza haemagglutinin (HA) on QDs in ph 7 Citrate-Phosphate buffer with 12 total protein molecules

104 91 It is also important to note that in each case presented, the QDs covered with unlabeled protein molecules have a higher fluorescence intensity than the QDs without any protein at all (i.e. the QD control), indicating that the layer of protein on the surface positively influences the emission of quantum dots FRET with Modified SNARE Complex SNARE proteins are membrane proteins that play an important role in the fusion of synaptic vesicles with the plasma membrane in eukaryotic cells. The proteins form a ternary complex with four parallel α-helices called a SNARE complex. The components of the α-helix bundle include one helix of syntaxin 1a and two helices of synaptosome-associated protein of 25 kda (SNAP-25), which are plasma membrane proteins. The last helix of synaptobrevin 2 (also called vesicle-associated membrane protein 2 VAMP 2), which is a synaptic vesicle protein, completes the bundle Figure 6-9: Structure of a SNARE complex consisting of syntaxin 1a, SNAP 25, and VAMP 2
105 92 Several protein samples with differences in the SNARE complex were provided by the department of Biochemistry, Biophysics, and Molecular Biology at Iowa State University. Each protein was engineered with a histidine-tag on one end. Cy3 dye-labeled and unlabeled samples were prepared. To prevent the protein molecules from sticking to each other, one end was encapsulated in a 100 nm liposome bilayer vesicle, with the histidine-tagged portion on the outside to facilitate conjugation onto QDs (Figure 6-10). The SNARE complexes engineered included one with only a syntaxin 1a α-helix (single), a binary complex consisting of a syntaxin 1a α-helix and two SNAP 25 helices, and a ternary complex with the syntaxin 1a, SNAP 25, and a VAMP 2 helix. Figure 6-10: Schematic representation of the modified SNARE complex attached to a quantum dot FRET investigations were carried out with each complex separately using the same procedure as that used for the influenza haemagglutinin (HA) previously discussed. Small quartz cuvettes were filled with 0.25 ml of the sample solutions and fluorescence spectra obtained. From Figures 6-11 to 6-13, it can be seen that the Cy3 dye peak had a very low
106 93 intensity, especially in the binary and ternary systems. After further investigations, we concluded that the liposome vesicle attached to the protein molecules was too large and hindered the conjugation of protein molecules to quantum dots, thus limiting the number of protein molecules on each QD and interfering with the FRET mechanism. For future analyses, the liposome vesicle would need to be much smaller so that enough proteins could conjugate onto the QDs. 1.20E+07 Intensity 1.00E E E E E E Wavelength QD Control 1 QD : 0 Cy3 1 QD : 2 Cy3 1 QD : 4 Cy3 1 QD : 6 Cy3 1 QD : 8 Cy3 1 QD : 10 Cy3 1 QD : 12 Cy3 Figure 6-11: Single SNARE complex on QDs in HEPES buffer with 12 total protein molecules The viability of using HEPES buffer as a solvent for FRET investigations was studied by testing the solubility of QDs in it. 3 µl of DHLA-covered water soluble QDs were dropped out of solution using a centrifugal filter and centrifuging at 2500 rpm for 3 minutes. The water was decanted and 6 µl of HEPES buffer added to resuspend the QDs. The solution was found to be homogenous, indicating that QDs are very soluble in HEPES buffer. See Appendix III for more FRET fluorescence spectra using the SNARE complex system.
107 E+07 Intensity 1.00E E E E E E Wavelength (nm) QD Control 1 QD : 0 Cy3 1 QD : 2 Cy3 1 QD : 4 Cy3 1 QD : 6 Cy3 1 QD : 8 Cy3 1 QD : 10 Cy3 1 QD : 12 Cy3 Figure 6-12: Binary SNARE complex on QDs in HEPES buffer with 12 total protein molecules 1.40E+07 Intensity 1.20E E E E E E E Wavelength (nm) QD Control 1 QD : 0 Cy3 1 QD : 2 Cy3 1 QD : 4 Cy3 1 QD : 6 Cy3 1 QD : 8 Cy3 1 QD : 10 Cy3 1 QD : 12 Cy3 Figure 6-13: Ternary SNARE complex on QDs in HEPES buffer with 12 total protein molecules 6.2 References 1. Clapp, A. R.; Medintz, I. L.; Mattoussi, H., Forster resonance energy transfer investigations using quantum-dot fluorophores. Chemphyschem 2006, 7, (1),
108 95 2. Clapp, A. R., T. Pons, I. L. Medintz, J. B. Delehanty, J. S. Melinger, T. Tiefenbrunn, P. E. Dawson, B. R. Fisher, B. O'Rourke, H. Mattoussi, Two-Photon Excitation of Quantum- Dot-Based Fluorescence Resonance Energy Transfer and Its Applications. Advanced Materials 2007, 19, (15), Medintz, I. L.; Clapp, A. R.; Mattoussi, H.; Goldman, E. R.; Fisher, B.; Mauro, J. M., Self-assembled nanoscale biosensors based on quantum dot FRET donors. Nature Materials 2003, 2, (9), Kim, J. H.; Morikis, D.; Ozkan, M., Adaptation of inorganic quantum dots for stable molecular beacons. Sensors and Actuators B-Chemical 2004, 102, (2), Pons, T.; Medintz, I. L.; Wang, X.; English, D. S.; Mattoussi, H., Solution-phase single quantum dot fluorescence resonance energy transfer. J Am Chem Soc 2006, 128, (47), Grecco, H. E.; Lidke, K. A.; Heintzmann, R.; Lidke, D. S.; Spagnuolo, C.; Martinez, O. E.; Jares-Erijman, E. A.; Jovin, T. M., Ensemble and single particle photophysical properties (Two-Photon excitation, anisotropy, FRET, lifetime, spectral conversion) of commercial quantum dots in solution and in live cells. Microscopy Research and Technique 2004, 65, (4-5), Clapp, A. R.; Medintz, I. L.; Mauro, J. M.; Fisher, B. R.; Bawendi, M. G.; Mattoussi, H., Fluorescence resonance energy transfer between quantum dot donors and dye-labeled protein acceptors. J. Am. Chem. Soc. 2004, 126, (1), Clapp, A. R.; Goldman, E. R.; Mattoussi, H., Capping of CdSe-ZnS quantum dots with DHLA and subsequent conjugation with proteins. Nat Protoc 2006, 1, (3),
109 96 9. Bullough, P. A.; Hughson, F. M.; Skehel, J. J.; Wiley, D. C., Structure of influenza haemagglutinin at the ph of membrane fusion. Nature 1994, 371, (6492), htm. (15 October 2008) 11. Pobbati, A.; Razeto, A.; Boddener, M.; Becker, S.; Fasshauer, D., Structural basis for the inhibitory role of tomosyn in exocytosis. J. Biol. Chem. 2004, M Zwilling, D.; Cypionka, A.; Pohl, W. H.; Fasshauer, D.; Walla, P. J.; Wahl, M. C.; Jahn, R., Early endosomal SNAREs form a structurally conserved SNARE complex and fuse liposomes with multiple topologies. Embo J 2007, 26, (1), Ungar, D.; Hughson, F. M., SNARE protein structure and function. Annu Rev Cell Dev Biol 2003, 19, Poirier, M. A.; Hao, J. C.; Malkus, P. N.; Chan, C.; Moore, M. F.; King, D. S.; Bennett, M. K., Protease Resistance of Syntaxin SNAP-25 VAMP Complexes. Implications for Assembly and Structure. J. Biol. Chem. 1998, 273, (18),
110 97 CHAPTER 7. CONCLUSIONS AND FUTURE WORK 7.1 Conclusions The overall objective of the research presented in this thesis was to preserve the valuable properties of semiconductor nanocrystal quantum dots, while changing their solution properties to render them useful for biological applications. This was achieved by modifying their surfaces via ligand exchange and encapsulation techniques. Chapter 4 mainly focused on methods used to displace hydrophobic surface ligands using small hydrophilic organic molecules, such as dihydrolipoic acid (DHLA) and tris(hydroxypropyl)phosphine (THPP), and derivatization of some these molecules by carbodiimide bioconjugation techniques. Several quantum dot encapsulation methods in polymer shells to functionalize their surfaces and manipulate their solution properties were covered in Chapter 5. The most promising method involved using a four-stream vortex mixer to create quantum dot-embedded polymer microspheres with a small size distribution and high fluorescence intensity. The ability of polyhistidine tags to self assemble onto QDs via metal coordinating interactions was exploited in Chapter 6 by using dye-labeled proteins to perform fluorescence resonance energy transfer (FRET) investigations between two different engineered proteins as acceptor fluorophores and quantum dots as FRET donors. FRET can be applied to deriving the structure of complex molecules by measuring the distances between amino acids and detecting enzymatic activity in cells by sensing the changes in the FRET signal when an enzyme attacks the substrate attached to the QD.
111 98 A common theme between the embedding and ligand exchange methods is that they both attempt to enhance the passivation of the QD surface, therefore increasing the brightness of the photoluminescence emitted. In addition to this, the stability of the whole system is of utmost importance because QDs need to be robust in order to function properly in biological systems. The surface modification should also augment the compatibility of the QD with its surroundings, such as inside the cytoplasm or endosome of a cell, to avoid problems like aggregation. Finally, the ease of cytoplasmic or endosomal uptake and the ph stability of the surface modification system determine whether or not it will be useful in the systems desired. 7.2 Future Work Many of the organic molecules used for ligand exchange in Chapter 4 are capable of being developed further to produce stable, robust, bright, and biocompatible quantum dots with high photoluminescence quantum yields (PL QY). Increased multifunctionality is also potentially achievable by combining two or more of the organic molecules on the same QD surface such as DHLA with TA/DAP and/or THPP. Hence, nanocrystals can be produced that are stable over a broad ph range. Bioconjugation techniques such as the carbodiimide coupling chemistry employed in the synthesis of amine-modified thioctic acid (TA/DAP) can be enhanced using a water soluble carbodiimide, 1-ethyl-3-(3-dimethylaminopropyl) carbodiimide hydrochloride (EDC) in combination with N-hydroxysuccinimide (NHS), instead of N,N-dicyclohexylcarbodiimide (DCC). Consequently, different molecules can be successfully appended to the carboxyl group on DHLA. Some molecules that could benefit from this aqueous conjugation include amino acids and carbohydrates.
112 99 Further exploration into stable surfactant molecule micelles within which QDs can be encapsulated is needed. The natural amphiphilic nature of these molecules makes them potentially valuable as QD surface coating agents. Finally, phosphine derivatives, such as tris(hydroxypropyl) phosphine (THPP), can be investigated further because they may be able to provide more of the elusive electronic passivation needed by QDs to keep the PL QY high.


.")

113 100 APPENDIX I SUPPLEMENTARY TEM IMAGES OF QUANTUM DOTS Lattice fringes and an approximately monodisperse size distribution (about 6 nm) can be seen in TEM images of CdSe/ZnS core/shell nanocrystals taken with a 2007 JEOL kv scanning and transmission electron microscope (STEM) at the Ames Laboratory at Iowa State University (Figures I-1 and I-2). Figure I-1: Electron diffraction patterns of colloidally prepared CdSe/ZnS core-shell nanocrystals Figure I-2: TEM images of colloidally prepared CdSe/ZnS core-shell nanocrystals


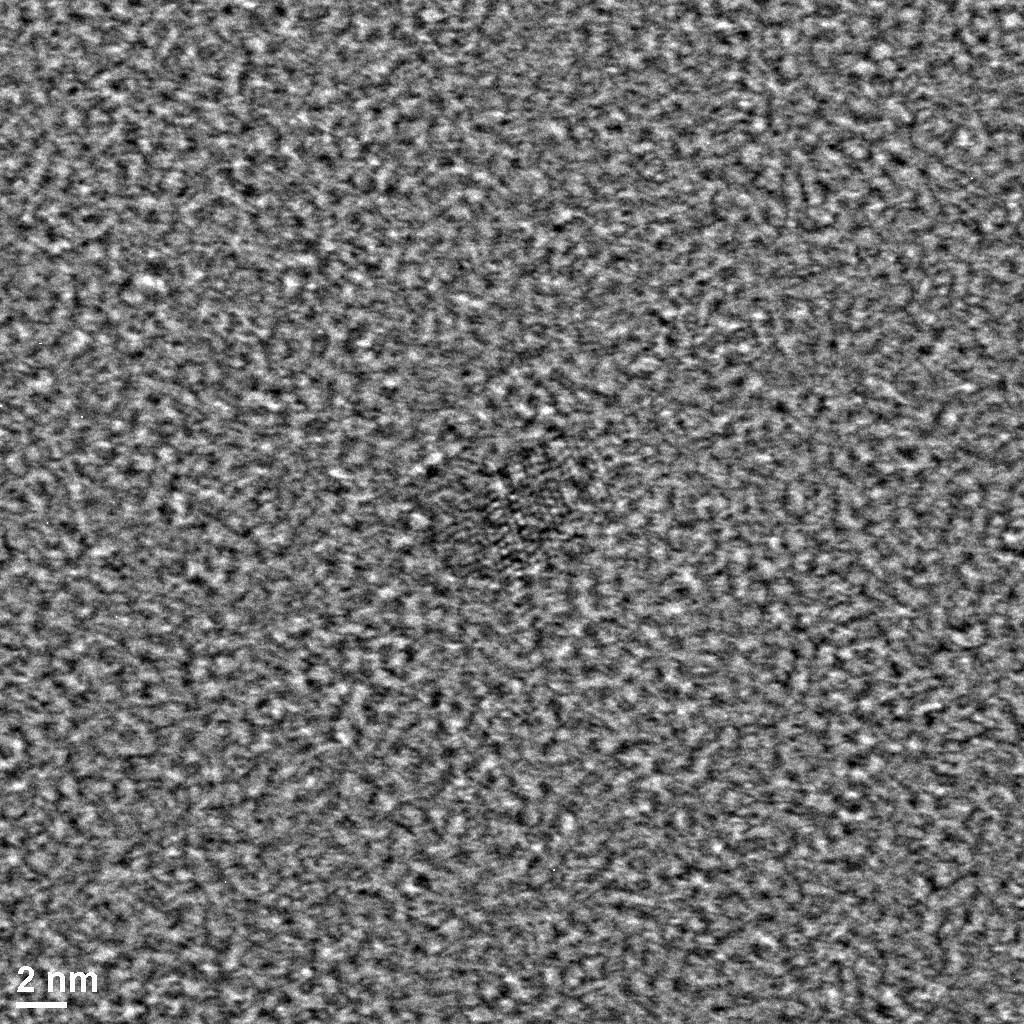

114 101 Figure I-2: Continued
 and")


115 102 APPENDIX II SUPPLEMENTARY SEM IMAGES OF POLYMER MICROSPHERES The poly(cph) and poly(sa) microspheres used to encapsulate TOP/TOPO-capped QDs formed differently sized aggregates seen in Figures II-1 to 3. SEM images were obtained using a JEOL 840A scanning electron microscope. Figure II-1: SEM images of QD embedded poly(cph) microspheres (sample 1)


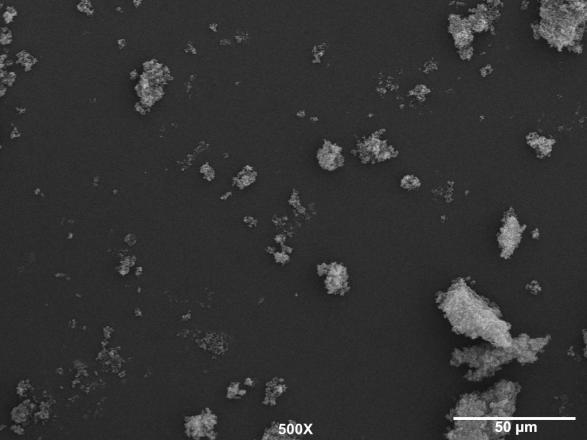


116 103 Figure II-2: SEM images of QD embedded poly(cph) microspheres (sample 2) Figure II-3: SEM images of QD embedded poly(sa) microspheres


117 104 The poly(sa) microspheres used to encapsulate inactivated DHLA-capped QDs formed differently sized aggregates seen in Figures II-4. 50X 500X 1500X 5000X 50X 150X 500X 5000X Figure II-4: SEM images of inactivated DHLA-capped QD embedded poly(sa) microspheres


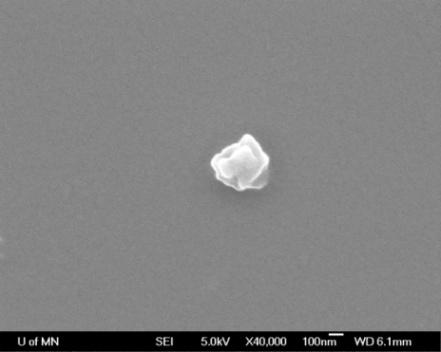
118 105 QD encapsulated PS-PEG copolymer spheres made by turbulent mixing were imaged by scanning electron microscopy. The supplementary SEM images are presented below in Figures II-5 to II-7. Figure II-5: SEM images 506 nm emitting QD polymer spheres made by turbulent mixing with PS-PEG copolymer Figure II-6: SEM images 546 nm emitting QD polymer spheres made by turbulent mixing with PS-PEG copolymer


119 106 Figure II-7: SEM images 611 nm emitting QD polymer spheres made by turbulent mixing with PS-PEG copolymer
Applications of Quantum Dots to Biosensing
 Applications of Quantum Dots to Biosensing CHEM 681 Student Seminar Series March 17 th, 2003 Heechang Ye Advisor : Dr. Richard M. Crooks Introduction Quantum dots (QDs) are semiconductor particles that
CH676 Physical Chemistry: Principles and Applications. CH676 Physical Chemistry: Principles and Applications
 CH676 Physical Chemistry: Principles and Applications Crystal Structure and Chemistry Synthesis of Tetrahexahedral Platinum Nanocrystals with High-Index Facets and High Electro-Oxidation Activity Na Tian
Quantum Dots in Frogs
 Quantum Dots in Frogs David J. Norris Chemical Engineering & Materials Science University of Minnesota Fluorescent imaging with semiconductor nanocrystals 1 Quantum Dots via Gas-Phase Deposition: Semiconductor
Quantum Dots The Pennsylvania State University Quantum Dots 1
 Quantum Dots www.nano4me.org 2018 The Pennsylvania State University Quantum Dots 1 Outline Introduction Quantum Confinement QD Synthesis Colloidal Methods Epitaxial Growth Applications Biological Light
Semiconductor quantum dots
 Semiconductor quantum dots Quantum dots are spherical nanocrystals of semiconducting materials constituted from a few hundreds to a few thousands atoms, characterized by the quantum confinement of the
Fabrication and Biomedical Applications of Ⅱ-Ⅵ Core-shell Quantum Dots
 33 1 Vol. 33 No. 1 2 0 1 2 3 SHANGHAI NONFERROUS METALS March 2012 1005-2046 2012 01-0020- 05 Ⅱ-Ⅵ 200083 Ⅱ-Ⅵ CdSe Ⅱ-Ⅵ Ⅱ-Ⅵ CdSe TN304. 2 + 5 A Fabrication and Biomedical Applications of Ⅱ-Ⅵ Core-shell Quantum
Materials as particle in a box models: Synthesis & optical study of CdSe quantum dots
 Lab Week 3 Module α 2 Materials as particle in a box models: Synthesis & optical study of CdSe quantum dots Instructor: Francesco Stellacci OBJECTIVES Introduce the particle-wave duality principle Introduce
Stable Encapsulation of Quantum Dot Barcodes with Silica Shells
 Stable Encapsulation of Quantum Dot Barcodes with Silica Shells Shang-Hsiu Hu and Xiaohu Gao Department of Bioengineering, University of Washington Seattle, WA 98195 (USA) Adv. Funct. Mater. 2010. ASAP
Synthesis and characterization of monodisperse CdSe quantum dots in different organic solvents
 Front. Chem. China (2006) 4: 378 383 DOI 10.1007/s11458-006-0052-7 RESEARCH ARTICLE He Rong, You Xiaogang, Tian Hongye, Gao Feng, Cui Daxiang, Gu Hongchen Synthesis and characterization of monodisperse
not to be confused with using the materials to template nanostructures
 Zeolites as Templates: continued Synthesis: Most zeolite syntheses are performed by using template-synthesis not to be confused with using the materials to template nanostructures templates are often surfactants
SUPPLEMENTARY INFORMATION
 SUPPLEMENTARY INFORMATION 1. Selection of the concentrations of PQDs and dye co-immobilized in the sol-gel Both donor (PQDs) and acceptor (dye) concentrations used in the doped sol-gel synthesis were optimized.
Highly Luminescent Water-Soluble CdTe Quantum Dots
 Highly Luminescent Water-Soluble CdTe Quantum Dots NANO LETTERS 2003 Vol. 3, No. 4 503-507 Sander F. Wuister,* Ingmar Swart, Floris van Driel, Stephen G. Hickey, and Celso de Mello Donegá Debye Institute,
Nucleation and Growth Kinetics of CdSe Nanocrystals in Octadecene
 VOLUME 4, NUMBER 12, DECEMBER 2004 Copyright 2004 by the American Chemical Society Nucleation and Growth Kinetics of CdSe Nanocrystals in Octadecene Craig R. Bullen and Paul Mulvaney* Chemistry School,
Fabrication of Core/Shell. structured Nanoparticles
 Fabrication of Core/Shell structured Nanoparticles Core + Shell Representative heterogeneous nucleation Peter Reiss,* Myriam Protie`re, and Liang Li, Core/Shell Semiconductor Nanocrystals, Small 2009,
Chapter VI Synthesis and Characterization of Core-Shell Nanoparticles
 Chapter 6 120 Chapter VI Synthesis and Characterization of Core-Shell Nanoparticles Core-Shell nanoparticles are hybrid systems. They have a core and a shell having distinct attributes such as metallicity,
FLUORESCENCE RESONANCE ENERGY TRANSFER BETWEEN DYES AND WATER-SOLUBLE QUANTUM DOTS WITH AVIDIN AS A BRIDGE
 International Journal of Nanoscience Vol. 3, No. 3 (2004) 1 8 c World Scientific Publishing Company FLUORESCENCE RESONANCE ENERGY TRANSFER BETWEEN DYES AND WATER-SOLUBLE QUANTUM DOTS WITH AVIDIN AS A BRIDGE
SYNTHESIS, SPECTRAL CHARACTERISTICS OF CDTE/CDS CORE/SHELL QUANTUM DOTS AND CARBAZOLE ABUTMENT CYANINE DYE
 Chalcogenide Letters Vol. 8, o. 8, August 2011, p. 499-504 SYTHESIS, SPECTRAL CHARACTERISTICS OF CDTE/CDS CORE/SHELL QUATUM DOTS AD CARBAZOLE ABUTMET CYAIE DYE XUEIG FEI a,b *, XU YAG a, YI LIU b, XIAOYAG
Short Communication Optical Properties Investigation of Core/Shell Quantum Dots by Low Temperature Synthesis
 Int. J. Electrochem. Sci., 9 (2014) 3795-3801 International Journal of ELECTROCHEMICAL SCIENCE www.electrochemsci.org Short Communication Optical Properties Investigation of Core/Shell Quantum Dots by
CHAPTER 3. FABRICATION TECHNOLOGIES OF CdSe/ZnS / Au NANOPARTICLES AND NANODEVICES. 3.1 THE SYNTHESIS OF Citrate-Capped Au NANOPARTICLES
 CHAPTER 3 FABRICATION TECHNOLOGIES OF CdSe/ZnS / Au NANOPARTICLES AND NANODEVICES 3.1 THE SYNTHESIS OF Citrate-Capped Au NANOPARTICLES Au NPs with ~ 15 nm were prepared by citrate reduction of HAuCl 4
Characterization of the ZnSe/ZnS Core Shell Quantum Dots Synthesized at Various Temperature Conditions and the Water Soluble ZnSe/ZnS Quantum Dot
 1776 Bull. Korean Chem. Soc. 2005, Vol. 26, No. 11 Cheong-Soo Hwang and Ill-Hee Cho Characterization of the ZnSe/ZnS Core Shell Quantum Dots Synthesized at Various Temperature Conditions and the Water
Silica Coating of Water-Soluble CdTe/CdS Core-Shell Nanocrystals by Microemulsion Method
 CHINESE JOURNAL OF CHEMICAL PHYSICS VOLUME 20, NUMBER 6 DECEMBER 27, 2007 ARTICLE Silica Coating of Water-Soluble CdTe/CdS Core-Shell Nanocrystals by Microemulsion Method Yong Wang a, Shu-hua Niu b, Zhi-juan
SYNTHESIS OF CADMIUM SULFIDE NANOSTRUCTURES BY NOVEL PRECURSOR
 Nanomaterials: Applications and Properties (NAP-2011). Vol. 1, Part I 107 SYNTHESIS OF CADMIUM SULFIDE NANOSTRUCTURES BY NOVEL PRECURSOR M. Salavati Niasari 1,2* 1 Department of Inorganic Chemistry, Faculty
Detection of toxic mercury ions using a ratiometric CdSe/ZnS nanocrystal sensor
 Supporting Information for Detection of toxic mercury ions using a ratiometric CdSe/ZnS nanocrystal sensor Leah E. Page, Xi Zhang, Ali M. Jawaid, and Preston T. Snee * Department of Chemistry, University
Quantum Dots for Advanced Research and Devices
 Quantum Dots for Advanced Research and Devices spectral region from 450 to 630 nm Zero-D Perovskite Emit light at 520 nm ABOUT QUANTUM SOLUTIONS QUANTUM SOLUTIONS company is an expert in the synthesis
TECHNICAL INFORMATION. Quantum Dot
 Quantum Dot Quantum Dot is the nano meter sized semiconductor crystal with specific optical properties originates from the phenomenon which can be explained by the quantum chemistry and quantum mechanics.
7. MILD SYNTHESIS AND CHARACTERIZATION OF IRON OXIDE / CdS NANOPARTICLES. In the past decade, colloidal II VI semiconductor nanocrystals are often
 7. MILD SYNTHESIS AND CHARACTERIZATION OF IRON OXIDE / CdS NANOPARTICLES 7.1. Introduction In the past decade, colloidal II VI semiconductor nanocrystals are often referred as quantum dots and have attracted
SYNTHESIS AND PARTICLE SIZE CHARACTERIZATION OF CdSe SEMICONDUCTOR QUANTUM DOTS
 International Journal of Metallurgical & Materials Science and Engineering (IJMMSE) ISSN(P): 2278-2516; ISSN(E): 2278-2524 Vol. 3, Issue 5, Dec 2013, 37-46 TJPRC Pvt. Ltd. SYNTHESIS AND PARTICLE SIZE CHARACTERIZATION
Synthesis of ternary chalcogenide colloidal nanocrystals in aqueous medium
 Journal of Physics: Conference Series PAPER OPEN ACCESS Synthesis of ternary chalcogenide colloidal nanocrystals in aqueous medium To cite this article: D S Mazing et al 28 J. Phys.: Conf. Ser. 38 25 View
quantum dots, metallic nanoparticles, and lanthanide ions doped upconversion
 Chapter 1 Introduction 1.1 Background Nanostructured materials have significantly different characteristics from their bulk counterparts. 1 Inorganic nanoparticles such as semiconductor quantum dots, metallic
what happens if we make materials smaller?
 what happens if we make materials smaller? IAP VI/10 ummer chool 2007 Couvin Prof. ns outline Introduction making materials smaller? ynthesis how do you make nanomaterials? Properties why would you make
Luminescence Process
 Luminescence Process The absorption and the emission are related to each other and they are described by two terms which are complex conjugate of each other in the interaction Hamiltonian (H er ). In an
Conference Paper Synthesis and Efficient Phase Transfer of CdSe Nanoparticles for Hybrid Solar Cell Applications
 Conference Papers in Energy, Article ID 194638, 3 pages http://dx.doi.org/10.1155/2013/194638 Conference Paper Synthesis and Efficient Phase Transfer of CdSe Nanoparticles for Hybrid Solar Cell Applications
Synthesis and Optical Properties of CdSe and CdSe/CdS Nanoparticles
 3096 Chem. Mater. 1999, 11, 3096-3102 Synthesis and Optical Properties of CdSe and CdSe/CdS Nanoparticles Encai Hao,, Haiping Sun, Zheng Zhou,, Junqiu Liu, Bai Yang,*, and Jiacong Shen*,, Department of
Chapter 6 Magnetic nanoparticles
 Chapter 6 Magnetic nanoparticles Magnetic nanoparticles (MNPs) are a class of nanoparticle which can be manipulated using magnetic field gradients. Such particles commonly consist of magnetic elements
Nanophysics: Main trends
 Nano-opto-electronics Nanophysics: Main trends Nanomechanics Main issues Light interaction with small structures Molecules Nanoparticles (semiconductor and metallic) Microparticles Photonic crystals Nanoplasmonics
Spectrochimica Acta Part A: Molecular and Biomolecular
 Accepted Manuscript Photoluminescence spectra of CdSe/ZnS quantum dots in solution K.H. Ibnaouf, Saradh Prasad, A. Hamdan, M. AlSalhi, A.S. Aldwayyan, M.B. Zaman, V. Masilamani PII: S1386-1425(13)01246-8
Revisited Wurtzite CdSe Synthesis : a Gateway for the Versatile Flash Synthesis of Multi-Shell Quantum Dots and Rods
 Supporting Information for Revisited Wurtzite CdSe Synthesis : a Gateway for the Versatile Flash Synthesis of Multi-Shell Quantum Dots and Rods Emile Drijvers, 1,3 Jonathan De Roo, 2 Pieter Geiregat, 1,3
Semiconductor nanocrystals
 Semiconductor nanocrystals Image of fluorescence in various sized Cadmium Selenide Quantum Dots. (Dr. D. Talapin, University of Hamburg, http://www.chemie.unihamburg.de/pc/weller/). Applications: Biology
Achiral CdSe quantum dots exhibit optical activity in the visible region upon post-synthetic ligand exchange with D- or L-cysteine
 This journal is The Royal Society of Chemistry Supporting Information for the manuscript entitled Achiral CdSe quantum dots exhibit optical activity in the visible region upon post-synthetic ligand exchange
Nanoparticles and Quantum Dots.
 Nanoparticles and Quantum Dots. 1 Prof.P. Ravindran, Department of Physics, Central University of Tamil Nadu, India & Center for Materials Science and Nanotechnology, University of Oslo, Norway http://folk.uio.no/ravi/cutn/nmnt
Electronic Supplementary Information
 Electronic Supplementary Information Dual N-type Doped Reduced Graphene Oxide Field Effect Transistors Controlled by Semiconductor Nanocrystals Luyang Wang, Jie Lian, Peng Cui, Yang Xu, Sohyeon Seo, Junghyun
Multi-Color Emission in Quantum-Dot Quantum-Well Semiconductor Heteronanocrystals
 Vol. 116 (2009) ACTA PHYSICA POLONICA A No. 4 Proceedings of the International School and Conference on Photonics, PHOTONICA09 Multi-Color Emission in Quantum-Dot Quantum-Well Semiconductor Heteronanocrystals
PREPARATION OF LUMINESCENT SILICON NANOPARTICLES BY PHOTOTHERMAL AEROSOL SYNTHESIS FOLLOWED BY ACID ETCHING
 Phase Transitions Vol. 77, Nos. 1 2, January February 2004, pp. 131 137 PREPARATION OF LUMINESCENT SILICON NANOPARTICLES BY PHOTOTHERMAL AEROSOL SYNTHESIS FOLLOWED BY ACID ETCHING X. LI, Y. HE, S.S. TALUKDAR
BIOCOMPATIBILITY OF CADMIUM-SELENIDE QUANTUM DOT
 European International Journal of Science and Technology ISSN: 2304-9693 www.eijst.org.uk BIOCOMPATIBILITY OF CADMIUM-SELENIDE QUANTUM DOT Slavica Brkić Faculty of Natural Sciences, Mathematics and Education,
Supporting Information
 Supporting Information Semiconductor Nanocrystals as Luminescent Down-Shifting Layers to Enhance the Efficiency of Thin-Film CdTe/CdS and Crystalline Si Solar Cells Sergii Kalytchuk,, Shuchi Gupta, Olga
OPTICAL PROPERTIES of Nanomaterials
 OPTICAL PROPERTIES of Nanomaterials Advanced Reading Optical Properties and Spectroscopy of Nanomaterials Jin Zhong Zhang World Scientific, Singapore, 2009. Optical Properties Many of the optical properties
Supporting Information
 Supporting Information A Generic Method for Rational Scalable Synthesis of Monodisperse Metal Sulfide Nanocrystals Haitao Zhang, Byung-Ryool Hyun, Frank W. Wise, Richard D. Robinson * Department of Materials
Strong polyelectrolyte quantum dot surface for stable bioconjugation and layer-by-layer assembly applications
 Electronic Supplementary Information Strong polyelectrolyte quantum dot surface for stable bioconjugation and layer-by-layer assembly applications Ho Jin 1, Jutaek Nam 1, Joonhyuck Park 2, Sungho Jung
[Kurapati*, 4(4): April, 2017] ISSN Impact Factor: 2.805
![[Kurapati*, 4(4): April, 2017] ISSN Impact Factor: 2.805](/thumbs/93/111154922.jpg "[Kurapati*, 4(4): April, 2017] ISSN Impact Factor: 2.805") SYNTHESIS AND OPTICAL PROPERTIES OF SEMICONDUCTOR CORE/SHELL NANOPARTICLES Ravindra Babu Kurapati *1 & Laxmikanth Cherupally 2 *1 NREM department, University of Kurdistan Hewler, Erbil, Iraq. 2 Department
SYNTHESIS AND OPTICAL PROPERTIES OF SEMICONDUCTOR CORE/SHELL NANOPARTICLES Ravindra Babu Kurapati *1 & Laxmikanth Cherupally 2 *1 NREM department, University of Kurdistan Hewler, Erbil, Iraq. 2 Department
Laser-induced fluorescence measurements on CdSe quantum dots #
 Processing and Application of Ceramics 4 [1] (2010) 33 38 Laser-induced fluorescence measurements on CdSe quantum dots # Zoltan Győri 1, Dávid Tátrai 2, Ferenc Sarlós 2, Gábor Szabó 2, Ákos Kukovecz 1,*,
Luminescence Temperature Antiquenching of Water-Soluble CdTe Quantum Dots: Role of the Solvent
 Published on Web 07/31/2004 Luminescence Temperature Antiquenching of Water-Soluble CdTe Quantum Dots: Role of the Solvent Sander F. Wuister,* Celso de Mello Donegá, and Andries Meijerink Contribution
Defense Technical Information Center Compilation Part Notice
 UNCLASSIFIED Defense Technical Information Center Compilation Part Notice ADP013097 TITLE: Optically Detected Magnetic Resonance of Semiconductor Quantum Dots DISTRIBUTION: Approved for public release,
GREEN SYNTHESIS OF STARCH-CAPPED
 GREEN SYNTHESIS OF STARCH-CAPPED CdSe QUANTUM DOTS IN AQUEOUS SOLUTION Tanutkun Palakawong Na Aayudhaya 1, *, Panida Viwattana 2, Kheamrutai Thamaphat 2,#, Khemika Lomthaisong 1 1 Program of Forensic Science,
Debjit Roy, Saptarshi Mandal, Chayan K. De, Kaushalendra Kumar and Prasun K. Mandal*
 Electronic Supplementary Material (ESI) for Physical Chemistry Chemical Physics. This journal is the Owner Societies 2018 Nearly Suppressed Photoluminescence Blinking of Small Sized, Blue-Green-Orange-Red
Scienza e Tecnologia dei Materiali Ceramici. Modulo 2: Materiali Nanostrutturati
 Università degli Studi di Trieste Dipartimento di Ingegneria e Architettura A.A. 2016-2017 Scienza e Tecnologia dei Materiali Ceramici Modulo 2: Materiali Nanostrutturati - Lezione 5 - Vanni Lughi vlughi@units.it
Controlled Assembly of Organic Whispering Gallery Mode Microlasers as Highly Sensitive Chemical Sensors
 Electronic Supplementary Material (ESI) for ChemComm. This journal is The Royal Society of Chemistry 2017 Electronic Supplementary Information Controlled Assembly of Organic Whispering Gallery Mode Microlasers
NANO 243/CENG 207 Course Use Only
 L12: Drug Loading & Quantification May 15, 2018 1. Drug loading techniques 1.1 Physical approaches Nanprecipitation Single emulsion Double emulsion Encapsulation Remote loading 1.2 Chemical approaches
Ciência (Bio)nanosystems based on quantum dots, plasmonic or magnetic nanoparticles
nanosystems based on quantum dots, plasmonic or magnetic nanoparticles") Ciência 216 (Bio)nanosystems based on quantum dots, plasmonic or magnetic nanoparticles Paulo J. G. Coutinho Departamento/Centro de Física Escola de Ciências Universidade do Minho 4 Julho 216 OVERVIEW
Ciência 216 (Bio)nanosystems based on quantum dots, plasmonic or magnetic nanoparticles Paulo J. G. Coutinho Departamento/Centro de Física Escola de Ciências Universidade do Minho 4 Julho 216 OVERVIEW
Fluorescence Spectroscopy
 Fluorescence Spectroscopy Frequency and time dependent emission Emission and Excitation fluorescence spectra Stokes Shift: influence of molecular vibrations and solvent Time resolved fluorescence measurements
Synthesis and characterization of aqueous MPA-capped CdS ZnS core shell quantum dots
 PRAMANA c Indian Academy of Sciences Vol. 80, No. 4 journal of April 2013 physics pp. 713 721 Synthesis and characterization of aqueous MPA-capped CdS ZnS core shell quantum dots ATEFEH EMAMDOUST 1, SABER
ROLE OF SURFACE COATING ON ACCUMULATION OF CADMIUM SULFIDE QUANTUM DOTS IN SOYBEAN PLANTS AND STRESS MECHANISMS SANGHAMITRA MAJUMDAR
 ROLE OF SURFACE COATING ON ACCUMULATION OF CADMIUM SULFIDE QUANTUM DOTS IN SOYBEAN PLANTS AND STRESS MECHANISMS SANGHAMITRA MAJUMDAR Jason C. WHITE (The Connecticut Agricultural Experiment Station) Arturo
Size-Dependent Biexciton Quantum Yields and Carrier Dynamics of Quasi-
 Supporting Information Size-Dependent Biexciton Quantum Yields and Carrier Dynamics of Quasi- Two-Dimensional Core/Shell Nanoplatelets Xuedan Ma, Benjamin T. Diroll, Wooje Cho, Igor Fedin, Richard D. Schaller,
Top down and bottom up fabrication
 Lecture 24 Top down and bottom up fabrication Lithography ( lithos stone / graphein to write) City of words lithograph h (Vito Acconci, 1999) 1930 s lithography press Photolithography d 2( NA) NA=numerical
Characterization of Group (II-VI) Semiconductor Nanoparticles by UV-visible Spectroscopy *
 Semiconductor Nanoparticles by UV-visible Spectroscopy *") OpenStax-CNX module: m34601 1 Characterization of Group 12-16 (II-VI) Semiconductor Nanoparticles by UV-visible Spectroscopy * Sravani Gullapalli Andrew R. Barron This work is produced by OpenStax-CNX
OpenStax-CNX module: m34601 1 Characterization of Group 12-16 (II-VI) Semiconductor Nanoparticles by UV-visible Spectroscopy * Sravani Gullapalli Andrew R. Barron This work is produced by OpenStax-CNX
Electroluminescence from Silicon and Germanium Nanostructures
 Electroluminescence from silicon Silicon Getnet M. and Ghoshal S.K 35 ORIGINAL ARTICLE Electroluminescence from Silicon and Germanium Nanostructures Getnet Melese* and Ghoshal S. K.** Abstract Silicon
Chapter 1: Introduction
 1 Chapter 1: Introduction 1.1 Semiconductor Quantum Dots Semiconductor quantum dots (QDs), or nanocrystals, represent nanometersized materials that exist between molecular and bulk forms. 1-3 Generally,
NNIN Nanotechnology Education
 NNIN Nanotechnology Education Name: Date: Class: Student Worksheet Part 1: Synthesizing CdSe Quantum Dots (with Answers in Red) The following synthesis must be performed in a fume hood, and the students
Supporting Information for: Heavy-Metal-Free Fluorescent ZnTe/ZnSe Nanodumbbells
 Supporting Information for: Heavy-Metal-Free Fluorescent ZnTe/ZnSe Nanodumbbells Botao Ji, Yossef E. Panfil and Uri Banin * The Institute of Chemistry and Center for Nanoscience and Nanotechnology, The
Room-temperature method for coating ZnS shell on semiconductor quantum dots
 Electronic Supplementary Material (ESI) for Journal of Materials Chemistry C. This journal is The Royal Society of Chemistry 2014 Electronic supplementary information Room-temperature method for coating
Lecture 6: Individual nanoparticles, nanocrystals and quantum dots
 Lecture 6: Individual nanoparticles, nanocrystals and quantum dots Definition of nanoparticle: Size definition arbitrary More interesting: definition based on change in physical properties. Size smaller
Invited Paper 1. INTRODUCTION
 Invited Paper Near-infrared peptide-coated quantum dots for small animal imaging Gopal Iyer, Jack J. Li, Fabien Pinaud, James M. Tsay, Laurent A. Bentolila, Xavier Michalet, and Shimon Weiss a Department
THEORETICAL STUDY OF THE QUANTUM CONFINEMENT EFFECTS ON QUANTUM DOTS USING PARTICLE IN A BOX MODEL
 Journal of Ovonic Research Vol. 14, No. 1, January - February 2018, p. 49-54 THEORETICAL STUDY OF THE QUANTUM CONFINEMENT EFFECTS ON QUANTUM DOTS USING PARTICLE IN A BOX MODEL A. I. ONYIA *, H. I. IKERI,
UVicSPACE: Research & Learning Repository
 UVicSPACE: Research & Learning Repository Faculty of Science Faculty Publications This is a post-print copy of the following article: Near-infrared emitting quantum dots: Recent progress on their synthesis
Morphology of CdSe/ZnS core/shell QDs coated on textured surface with SiN X film of a
 Electronic Supplementary Material (ESI) for Nanoscale. This journal is The Royal Society of Chemistry 2014 Supplementary/supporting information Morphology of CdSe/ZnS core/shell QDs coated on textured
(2). They fluoresce when excited by light and have many advantages to traditional dyes. Our
. They fluoresce when excited by light and have many advantages to traditional dyes. Our") Sarah Rugheimer Flathead Valley Community College Advisor: Dr. X. L. Wu University of Pittsburgh Department of Physics and Astronomy Summer 2003 REU July 16, 2003 ABSTRACT Quantum dots are relatively new
Sarah Rugheimer Flathead Valley Community College Advisor: Dr. X. L. Wu University of Pittsburgh Department of Physics and Astronomy Summer 2003 REU July 16, 2003 ABSTRACT Quantum dots are relatively new
Fabrication / Synthesis Techniques
 Quantum Dots Physical properties Fabrication / Synthesis Techniques Applications Handbook of Nanoscience, Engineering, and Technology Ch.13.3 L. Kouwenhoven and C. Marcus, Physics World, June 1998, p.35
Seminars in Nanosystems - I
 Seminars in Nanosystems - I Winter Semester 2011/2012 Dr. Emanuela Margapoti Emanuela.Margapoti@wsi.tum.de Dr. Gregor Koblmüller Gregor.Koblmueller@wsi.tum.de Seminar Room at ZNN 1 floor Topics of the
Development and application for X-ray excited optical luminescence (XEOL) technology at STXM beamline of SSRF
 technology at STXM beamline of SSRF") Development and application for X-ray excited optical luminescence (XEOL) technology at STXM beamline of SSRF Content Introduction to XEOL Application of XEOL Development and Application of XEOL in STXM
Development and application for X-ray excited optical luminescence (XEOL) technology at STXM beamline of SSRF Content Introduction to XEOL Application of XEOL Development and Application of XEOL in STXM
Chapter 6 Photoluminescence Spectroscopy
 Chapter 6 Photoluminescence Spectroscopy Course Code: SSCP 4473 Course Name: Spectroscopy & Materials Analysis Sib Krishna Ghoshal (PhD) Advanced Optical Materials Research Group Physics Department, Faculty
CHAPTER 3. OPTICAL STUDIES ON SnS NANOPARTICLES
 42 CHAPTER 3 OPTICAL STUDIES ON SnS NANOPARTICLES 3.1 INTRODUCTION In recent years, considerable interest has been shown on semiconducting nanostructures owing to their enhanced optical and electrical
Enhanced Photonic Properties of Thin Opaline Films as a Consequence of Embedded Nanoparticles.
 Enhanced Photonic Properties of Thin Opaline Films as a Consequence of Embedded Nanoparticles. D E Whitehead, M Bardosova and M E Pemble Tyndall National Institute, University College Cork Ireland Introduction:
2004 Debye Lecture 3 C. B. Murray. Semiconductor Nanocrystals Quantum Dots Part 1
 2004 Debye Lecture 3 C. B. Murray Semiconductor Nanocrystals Quantum Dots Part 1 Basic Physics of Semiconductor Quantum Dots C. R. Kagan, IBM T. J. Watson Research Center, Yorktown Heights, NY Conduction
ESH Benign Processes for he Integration of Quantum Dots (QDs)
") ESH Benign Processes for he Integration of Quantum Dots (QDs) PIs: Karen K. Gleason, Department of Chemical Engineering, MIT Graduate Students: Chia-Hua Lee: PhD Candidate, Department of Material Science
ESH Benign Processes for he Integration of Quantum Dots (QDs) PIs: Karen K. Gleason, Department of Chemical Engineering, MIT Graduate Students: Chia-Hua Lee: PhD Candidate, Department of Material Science
Novel Nanoparticles for Ultrasensitive Detection and Spectroscopy
 Final Technical Report (DOE-FG02-98ER14873) Project Officer: Dr. Richard Gordon / Dr. John Miller Novel Nanoparticles for Ultrasensitive Detection and Spectroscopy Shuming Nie Indiana University P. 0.
Supporting Information
 Supporting Information Enabling Förster Resonance Energy Transfer from Large Nanocrystals through Energy Migration Renren Deng,,# Juan Wang,,# Runfeng Chen, Wei Huang,*,, and Xiaogang Liu*,, Փ Department
Quantum Dot-Peptide-Fullerene Bioconjugates for Visualization of In Vitro and In Vivo Cellular Membrane Potential
 Quantum Dot-Peptide-Fullerene Bioconjugates for Visualization of In Vitro and In Vivo Cellular Membrane Potential Okhil K. Nag, Michael H. Stewart, Jeffrey R. Deschamps, Kimihiro Susumu, Eunkeu Oh, Vassiliy
Semiconductor Nanocrystals with Different Size and. Shape
 Supporting Information Determination of Concentration of Amphiphilic Polymer on the Surface of Encapsulated Semiconductor Nanocrystals with Different Size and Shape Aleksandra Fedosyuk, Aliaksandra Radchanka,
Interfacial alloying in CdSe/CdS heteronanocrystals, a Raman spectroscopy analysis
 Interfacial alloying in CdSe/CdS heteronanocrystals, a Raman spectroscopy analysis Norman Tschirner,, Holger Lange, Andrei Schliwa, Amelie Biermann, Christian Thomsen, Karel Lambert,, Raquel Gomes,, and
Jahresbericht 2003 der Arbeitsgruppe Experimentalphysik Prof. Dr. Michael Farle
 olloidal Synthesis of Magnetic Nanoparticles V. Salgueirino Maceira and M. Farle 1 Institut für Physik, Universität Duisburg-Essen, Lotharstr. 1, 47048 Duisburg 1. Introduction 1 The synthesis of monodisperse
Interaction of Gold Nanoparticle with Proteins
 Chapter 7 Interaction of Gold Nanoparticle with Proteins 7.1. Introduction The interfacing of nanoparticle with biomolecules such as protein is useful for applications ranging from nano-biotechnology (molecular
Commercial Volumes of Quantum Dots: Controlled Nanoscale Synthesis and Micron- Scale Applications.
 Page 1 of 7 Page 1 of 7 Return to Web Version Commercial Volumes of Quantum Dots: Controlled Nanoscale Synthesis and Micron- Scale Applications. By: Drs. Nigel L. Pickett, Ombretta Masala, James Harris,
Chapter 1 Overview of Semiconductor Materials and Physics
 Chapter 1 Overview of Semiconductor Materials and Physics Professor Paul K. Chu Conductivity / Resistivity of Insulators, Semiconductors, and Conductors Semiconductor Elements Period II III IV V VI 2 B
Excimer like Photoluminescence Spectra of CdSe/ZnS Quantum Dots
 Excimer like Photoluminescence Spectra of CdSe/ZnS Quantum Dots A. Hamdan, Saradh Prasad, M. S. Alsalhi, and V. Masilamani Research Chair for Laser Diagnosis of Cancer, King Saud University. Riyadh, KSA
Supporting Information
 Supporting Information Study of Diffusion Assisted Bimolecular Electron Transfer Reactions: CdSe/ZnS Core Shell Quantum Dot acts as an Efficient Electron Donor as well as Acceptor. Somnath Koley, Manas
Light Interaction with Small Structures
 Light Interaction with Small Structures Molecules Light scattering due to harmonically driven dipole oscillator Nanoparticles Insulators Rayleigh Scattering (blue sky) Semiconductors...Resonance absorption
CHAPTER IV SYNTHESIS AND CHARACTERIZATION OF METAL IONS DOPED ZINC SELENIDE NANOPARTICLES
 132 CHAPTER IV SYNTHESIS AND CHARACTERIZATION OF METAL IONS DOPED ZINC SELENIDE NANOPARTICLES 4.1 Introduction Introducing impurity atoms into a semiconductor host leads to an increase in the free-carrier
Optical Properties Of ZnS And CdS Quantum Dots
 Optical Properties Of ZnS And CdS Quantum Dots Kalipada Das 1 and Bidhan Mohanta 2 1. Research Scholar, Dept. of Physics, Assam University, Silchar, India, PIN-78811 2. Assistant Professor, Dept. of Physics,
Tunable optical properties of Mn-doped CdSe quantum dots synthesized via inverse micelle technique
 Vol. 6, No. 9 1 Sep 2016 OPTICAL MATERIALS EXPRESS 2915 Tunable optical properties of Mn-doped CdSe quantum dots synthesized via inverse micelle technique NOR ALIYA HAMIZI,1 FATIHAH APLOP,1 HOR YUEN HAW,1
Bio-Inspired Structures Spring 2009
 MIT OpenCourseWare http://ocw.mit.edu 16.982 Bio-Inspired Structures Spring 2009 For information about citing these materials or our Terms of Use, visit: http://ocw.mit.edu/terms. Chemical Synthetic Routes
Hidden Role of Anion Exchange Reactions in Nucleation of Colloidal Nanocrystals
 Electronic Supplementary Material (ESI) for CrystEngComm. This journal is The Royal Society of Chemistry 2015 Hidden Role of Anion Exchange Reactions in Nucleation of Colloidal Nanocrystals Rekha Mahadevu,