DEMULSIFICATION OF WATER-IN- OIL (W/O) EMULSION BY MICROWAVE HEATING TECHNOLOGY
|
|
|
- Dwain Johns
- 6 years ago
- Views:
Transcription
1 DEMULSIFICATION OF WATER-IN- OIL (W/O) EMULSION BY MICROWAVE HEATING TECHNOLOGY NOR ILIA ANISA BINTI ARIS MASTER OF ENGINEERING IN CHEMICAL UNIVERSITI MALAYSIA PAHANG
2 UNIVERSITI MALAYSIA PAHANG CENTER FOR GRADUATE STUDIES We certify that the thesis entitled Demulsification of Water-in-Oil (W/O) Emulsion via Microwave Heating Technology is written by Nor Ilia Anisa Binti Aris. We have examined the final copy of this thesis and in our opinion; it is fully adequate in terms of scope and quality for the award of the degree of Master of Engineering in Chemical. We herewith recommend that it be accepted in fulfillment of the requirements for the degree of Master of Engineering specializing in Chemical. Name of External Examiner Institution: Signature Name of Internal Examiner Institution: Signature
3 DEMULSIFICATION OF WATER-IN-OIL (W/O) EMULSION BY MICROWAVE HEATING TECHNOLOGY NOR ILIA ANISA BINTI ARIS A thesis submitted in fulfillment of the requirements for the award of the degree of Master Engineering of Chemical Faculty of Chemical and Natural Resource Engineering UNIVERSITI MALAYSIA PAHANG FEBRUARY 2011
4 STATEMENT OF AWARD FOR DEGREE 1. Master of Engineering (by research) Thesis submitted in fulfilment of the requirements for the award of the degree of Master of Engineering in Chemicals
5 SUPERVISOR S DECLARATION I hereby declare that I have checked this thesis and in my opinion, this thesis is adequate in terms of scope and quality for the award of the degree of Master of Engineering in Chemical Signature: Name of Supervisor: ASSOCIATE PROF. DR. ABDURAHMAN HAMID NOUR Position: LECTURER IN FACULTY OF CHEMICAL EMGINEERING AND NATURAL RESOURCES Date:
6 STUDENT S DECLARATION I hereby declare that the work in this thesis is my own except for quotations and summaries which have been duly acknowledged. The thesis has not been accepted for any degree and is not concurrently submitted for award of other degree. Signature Name: NOR ILIA ANISA BINTI ARIS ID Number: MKC09001 Date:
7 To my beloved parents, brothers, sisters, fiance, lecturers and friends
8 ABSTRACT Traditional ways of breaking emulsion using heat and chemicals are disadvantageous from both economic and environmental perspectives. In this thesis, the potentials of microwave technology in demulsification of water-in-oil emulsion is investigated. The work began with some characterisation studies to provide understandings of fundamental issues such as formation, formulation and breaking of emulsions by both chemical and microwave approaches. The aim was to obtain optimised operating condition as well as fundamental understanding of water-in-oil stability, upon which further developments on demulsification processes could be developed. The stability studies were carried out by analysing operating conditions such as stirring time, types of surfactant used, temperature, phase inversion, water-oil-ratio (10-90%) and stirring intensity. In this study, also for microwave and chemical demulsification performance tests, three crude oils, namely crude oil A, B and C were utilised. These crude oils were obtained from Petronas Penapisan Melaka, Malaysia. Among of these oils, crude oil C was found to be the heaviest and best for stability and followed by crude oil A and B, respectively. Results also showed that microwave heating of emulsions is advantageous as it was faster and more uniform. A microwave-assisted chemical system was then developed in crude oil A and C, and then successfully applied on demulsification of water-in-oil emulsions. Its performance was compared with conventional demulsification methods such as hotplate, chemical demulsifiers and gravity separation. For microwave irradiation, it was found that the microwave power was proportional to the volume rate of heat generation, rate of temperature increases, wavelength and penetration depth, while the volume fraction is proportional to dielectric properties and inversely proportional to the penetration depth and wavelength. In optimisation part, crude oil A and C obtained 2 3 factorial designs with microwave power, microwave processing time and demulsifier concentration. The percentage of water separated from the model crude oil A was 45.10% at 710 watt in 2.40 minutes with 0.15 wt% demulsifier, while for crude oil C was 38.03% at 767 watt in 2.50 minutes with 0.14 wt% demulsifier, respectively. Crude oil B acquired 2 2 factorial design with microwave power and time processing; the percentage of water separated was 64.07% at 692 watt in 2.56 minutes. The results obtained in this study have exposed the capability of microwave technology in demulsification of water-in-oil emulsion. Further works are nevertheless required to provide deeper understanding the mechanisms involved to facilitate the development of an optimum system applicable to the industry.
9 ABSTRAK Kaedah tradisional dalam memisahkan emulsi menggunakan haba dan bahan kimia adalah merugikan dari segi ekonomi and alam sekitar. Dalam tesis ini, potensi teknologi gelombang mikro dalam demulsifikasi oleh air-dalam-minyak emulsi dikaji. Pekerjaan bermula dengan beberapa kajian mengenai ciri-ciri untuk memberikan pemahaman tentang isu-isu asas seperti pembentukan, perumusan dan memecahkan emulsi oleh kedua-dua pendekatan kimia dan gelombang mikro. Tujuannya adalah untuk mendapatkan keadaan operasi dioptimumkan serta pemahaman dasar air-dalam kestabilan-minyak, atas mana perkembangan lebih lanjut atas proses demulsification dapat dikembangkan. Pengajian kestabilan dilakukan dengan menganalisis keadaan operasi seperti waktu pengadukan, jenis surfaktan yang digunakan, suhu, fasa inversi, nisbah air-minyak (10-90%) dan adukan intensitas. Dalam kajian ini, juga untuk ujian gelombang mikro dan demulsifikasi kimia, tiga minyak mentah, dinamakan sebagai minyak mentah A,B dan C telah digunakan. Minyak mentah ini diperolehi dari Petronas Penapisan Melaka, Malaysia. Di antara minyak mentah ini, minyak mentah C adalah yang terberat and baik untuk kestabilan dan masingmasing diikuti oleh minyak mentah A and B. Keputusan juga telah menunjukkan bahawa pemanasan emulsi oleh gelombang mikro ini menguntungkan kerana lebih cepat dan seragam. Sebuah sistem gelombang mikro-kimia kemudian dikembangkan di minyak mentah A dan C, dan kemudiannya berjaya dalam aplikasi ke atas demulsifikasi oleh emulsi air-dalam-minyak. Prestasinya telah dibandingkan dengan kaedah demulsifikasi konvensional seperti piring pemanas, demulsifi kimia dan pemisahan graviti. Untuk iridiasi gelombang mikro, didapati bahawa kuasa gelombang mikro adalah berkadar terus dengan kadar isipadu oleh generasi haba, kadar peningkatan suhu, panjang gelombang dan kadalaman penetrasi, manakala fraksi isipadu adalah berkadar terus dengan sifat dielektrik dan berkadar songsang dengan kedalaman penetrasi dan panjang gelombang. Dalam bahagian pengoptimuman, minyak mentah A dan C memperolehi 2 3 rancangan faktorial dengan kuasa gelombang mikro, masa pemprosesan gelombang mikro dan konsentrasi demulsifer. Peratusan pemisahan air daripada model minyak mentah A ialah 43.11% pada 710 watt dalam 2.40 minit dengan 0.15 wt% konsentrasi demulsifer, manakala untuk minyak mentah C ialah % pada 767 watt dalam 2.50 minit bersama 0.14 wt% demulsifer. Minyak mentah B memperolehi 2 2 rancangan faktorial dengan kuasa gelombang mikro dan masa memprosesan; peratusan pemisahan air ialah % pada 692 watt dalam 2.56 minit. Keputusan yang diperolehi dari kajian ini telah mengembangkan keupayaan teknologi gelombang mikro dalam demulsifikasi emulsi air-dalam-minyak. Lebih banyak kerja tetap diperlukan untuk memberikan pemahaman yang lebih dalam mekanisme yang terlibat untuk memudahkan pembangunan sistem yang optimum yang sesuai untuk industri.
10 ACKNOWLEDGEMENT I would like to express my gratitude to all those who gave me the possibility to complete this thesis. I am deeply indebted to my supervisor s, Associate Professor Dr. Abdurahman Hamid Nour whose help, inspiring suggestions and encouragement helped me in all the time of my research. It is difficult to overstate my gratitude to Petronas Penapisan Melaka for supplying the crude oil. Also to my former colleagues supported me in my research work. I wish to extend my warmest thanks to all of them. I am especially grateful to lecturers in Faculty of Chemical Engineering and Natural Resources by assisting in explaining any difficulty I faced. My thanks goes also to all people in my group for their direct and indirect assistance and helpful discussion during my work. Finally, I owe my loving thanks to my family. Without their love, encouragement and understanding it would have been impossible for me to finish this work. My deepest gratitude goes also to my friends for their indefatigable love and support throughout my life. To all of them I dedicate this thesis.
11 TABLE OF CONTENTS TITLE PAGE STATEMENT OF AWARD SUPERVISOR S DECLARATION STUDENT S DECLARATION DEDICATION ACKNOWLEDGEMENTS ABSTRACT ABSTRAK TABLE OF CONTENTS LIST OF TABLES LIST OF FIGURES LIST OF ABBREVIATIONS LIST OF NOMECLATURES Page i ii iii iv v vi vii viii ix xv xvii xxi xxiii CHAPTER 1 INTRODUCTION Background of Study Problem Statement Definition of Terms Emulsion Demulsification Microwave Irradiation Operational Definition Microwave Objectives of Study Scopes of Study Significant of Study Thesis Outline Summary 7 CHAPTER 2 EMULSION STABILITY 8
12 2.1 Introduction Crude Oil Emulsion Composition Emulsion Emulsion Formation Physico-chemical Factors Affecting the 11 Formation of Emulsions 2.5 Types of Emulsion Water-in-Oil Emulsion (W/O) Oil-in-Water Emulsion (O/W) Differences Between W/O and O/W Emulsions Tests for Emulsion Types Dilution Method Electrical Conductivity Staining the Continuous Phase Emulsion Stability Electrostatic Forces Steric Repulsion Marangoni-Gibbs Effect Thin Film Stabilization Emulsion and Foam Emulsion Destabilisation Sedimentation Aggregation Coalescence Ostwald Ripening Methods of Emulsion Breaking Application of Chemical Application of Thermal Heating Effects of Electric Current Surfactants 23
13 2.12 Summary 25 CHAPTER 3 MECHANISMS OF MICROWAVE THEORY Introduction Microwave Energy and Materials Interaction Microwave Properties Dipole Rotation Mechanism Ionic Conduction Dielectric Properties Energy Conversion Working Equations for Microwave Demulsification 33 Study 3.5 Summary 35 CHAPTER 4 MATERIALS AND METHODS Introduction Flow of Study Material Selection Sample Preparation Analytical Procedure Physical Characteristics Chemical Characteristics Demulsification Procedures Microwave Oven Conventional Methods Data Analysis Optimisation 48
14 4.7.1 The method of Factorial Experiment Optimisation Using Response Surface 51 Methodology (RSM) Evaluating the Model Summary 52 CHAPTER 5 CRUDE OIL STABILITY Introduction Characteristics of Crude oil Physical Properties of Crude oil Chemical Properties of Crude oil Stability Characteristics of Crude oil Emulsion Effect of Surfactant Concentration Ratio on Stability 59 of Emulsion Effect of Stirring Intensity (rpm) on Emulsion 61 Stability Effect Temperature on Emulsion Stability Other Factors Controlling Emulsion Stability Rheological Properties of W/O Emulsions of 68 Different Dispersed Volume Fractions 5.5 Summary 75 CHAPTER 6 MICROWAVE DEMULSIFICATION STUDY ON 76 WATER-IN-OIL (W/O) EMULSION 6.1 Introduction Experimental Results for Microwave Irradiation Effect of Water-Oil Ratio on Temperature Distribution Effect of Microwave Power on W/O Emulsion Separation of Water from Emulsions 83
15 6.5.1 Comparison Microwave Irradiation and Conventional 83 Methods 6.6 Comparison between Microwave Irradiation and 89 Conventional Heating 6.7 Effect of Volume Fraction on Dielectric Constant, 96 Dielectric Loss, Wavelength and Microwave Penetration Depth 6.8 Optimisation Optimisation for Crude oil A Optimisation for Crude oil B Optimisation for Crude oil C Validation of Model Prediction Summary 117 CHAPTER 7 CONCLUSIONS AND RECOMMENDATIONS Conclusions Characterisation of Crude Oil and Stability of W/O 118 Emulsion Demulsification Recommendations 121 REFERENCES 122 APPENDICES A FTIR Analysis of Crude Oil 130 B Analysis of Differential Scanning Calorimetry 132 C Effect of Droplets Size on Stirring Intensity 134 D Effect of Temperature on Emulsion Stability 135 E W/O Emulsion Heated by Microwave Irradiation in Varied 138 Microwave Power
16 F W/O Emulsion Heated by Microwave Irradiation in Varied 142 Volume Fraction G List of Publications 145
17 LIST OF TABLES TABLE NO. TITLE PAGE 2.1 A Summary of Surfactant HLB Ranges and Applications Assignment of Absorption Bands of IR-Spectra of the Crude 45 Oil Fractions 4.2 Assignment for Hydrogen Bonding in Asphaltenes Levels of the Experimental Variables in 2 2 Factorial Design Levels of the Experimental Variables in 2 3 Factorial Design Physical Properties of Crude Oil Chemical Properties of Crude Oil Factorial Design with Response Analysis of Variance (ANOVA) Regression Coefficient Values for Response Surface Observed Response and Predicted Values Factorial Design with Response Analysis of Variance (ANOVA) Regression Coefficient Values for Response Surface Observed Response and Predicted Values Factorial Design with Response Analysis of Variance (ANOVA) Regression Coefficient Values for Response Surface Observed Response and Predicted Values Model Prediction Variables 116
18 LIST OF FIGURES FIGURE NO. TITLE PAGE 1.1 Common Types of Crude Oil Emulsions (W/O and O/W) 4 and Less Common (W/O/W) 2.1 Schematic of Saturate, Aromatic, Resin and Asphaltene (SARA) 9 Fractionation of Crude Oils 2.2 Processes of the Crude Oil Emulsion Formation The Orientation of Emulsifier on the Surface of the Dispersed 12 Phase 2.4 Electrostatic Forces Steric Repulsion Illustration of a Generalised (a) Foam; (b)emulsion Possible Consequence from Collisions between Two Droplets Process of Chemical Demulsification Typically Surfactant Structure Frequency Ranges of Microwaves used in Microwave Oven A Propagating Electromagnetic Wave Sample Heating by (a) Conventional Thermal Heating 28 (b) Microwave Heating 3.4 Alignment of Dipolar Molecules with an Oscillating Electric Field Charge Particles in the Solution Follow the Applied Electric Field Flow of Study Schematic Diagram for Preparing W/O Emulsion System Procedures for Recovering Asphaltenes and Resins Separation Wax Crystal from Crude Oil 44
19 4.5 Schematic Diagram for Elba Microwave Model: EMO 808 SS Central Composite Designs for Optimisation of 2 2 Factorial 50 Design 4.7 Central Composite Designs for Optimisation of 2 3 Factorial 51 Design 5.1 FTIR Spectra for Asphaltenes of Crude oil A, B and C FTIR Spectra for Resins of Crude oil A, B and C Effects of Types of Surfactant on W/O Emulsion Stability 61 (Experimental Condition: Stirring Intensity=1500 rpm; Processing Time=5 minutes) 5.4 Viscosity Effect at varied Stirring Intensity (a) % W/O 62 (b) % W/O Emulsion 5.5 Effects of Stirring Intensity on Emulsification Mean of Droplet Diameter (µm) within 500 to 2000 rpm of 64 Stirring Intensity 5.7 Effect of Temperature on Emulsion Stability at (a) % W/O 66 and (b) % W/O Emulsion 5.8 Effect of Mean Droplet Diameter (m) in Increasing Temperature An Influence of Phase Volume Fraction on the Emulsion Type 70 and Viscosity 5.10 Interfacial Tension Effect of Emulsion by varied Density Effect of Shear Stress on Shear Rate with Varied Phase Ratio 73 (a) % W/O Emulsion (b) % W/O Emulsion 5.12 Effect of Shear Stress on Shear Rate in Crude oil A by Increased 74 the Composition 5.13 Shear Rate Dependence on Viscosity of Emulsion with Varied 75 Phase Ratio (a) % W/O Emulsion (b) % W/O Emulsion 5.14 Effect of Apparent Viscosity on Shear Rate in Crude oil A at % and % W/O emulsion
20 6.1 Temperature (a) and Heating Rate (b) as Function Microwave 79 Radiation Time by Comparing Water with Crude Oils 6.2 Effect of Temperature Distribution at Varied Phase Ratio Microwave Power Effect on Water Separation Efficiency Heating Rate in Microwave Power with Variation Time Wavelength (cm) and Wavelength (cm) Affected Within 360 to W in Microwave Power 6.6 Comparison of Conventional and Microwave Methods in 86 Demulsified W/O Emulsion for % W/O Emulsion (a) Crude oil A (b) Crude oil B (c) Crude oil C 6.7 Comparison of Conventional and Microwave Methods in 87 Demulsified W/O Emulsion for % W/O Emulsion (a) Crude oil A (b) Crude oil B (c) Crude oil C 6.8 Demulsification Efficiency in Microwave Irradiation during minutes for Crude oil A and C containing 0.1% of Demulsifier 6.9 Photography of Emulsion after Irradiation in 3 minutes for 90 Crude oil A and C with 0.1 % Demulsifier at (a) % W/O emulsion (b) % W/O Emulsion within 5 minutes Observing the Phase Separation 6.10 Effect of Viscosity by Comparison Microwave (MW) and 92 Conventional Heating (CH) (a) % W/O Emulsion (b) % W/O Emulsion 6.11 Microscope Image of an Emulsion in Crude oil A, B and C before 93 Demulsified in Microwave 6.12 Microscope Image of an Emulsion in Crude oil A, B and C after 93 Demulsified in Microwave 6.13 Droplets Diameter (m) before Demulsified in Microwave 95 Irradiation (a) Crude oil A (b) Crude oil B (c) Crude oil C 6.14 Droplets Diameter (m) after Demulsified in Microwave 95 Irradiation (a) Crude oil A (b) Crude oil B (c) Crude oil C 6.15 Effect of Dielectric Constant within Radiation Time 97
21 6.16 Plots of Tangent Loss (tan δ) with Temperature (o C) in Varied 98 Volume Fraction 6.17 Effect of Penetration Depth, Dp and Wavelength, λm on Varied 99 Volume Fraction 6.18 Response Surface of Predicted Water Separated in Microwave 105 Irradiation by Interaction (a) Power-Time (b) Power-Concentration and (c) Time-Concentration 6.19 Response Surface of Predicted Water Separated by Interaction 109 Power (X 1 ) and Time (X 2 ) in Microwave Irradiation 6.20 Response Surface of Predicted Water Separated by Interaction 115 Microwave Power (X1), Time Processing (X2) and Concentration of Demulsifier (X3) in Microwave Irradiation 6.21 W/O Emulsion Demulsified Using Optimum Variables 117
22 LIST OF ABBREVIATIONS A API o C o C/min asphaltenes American Petroleum Institute O Celcius o C per minute CH conventional heating cm centimetre CMC critical micelle concentration cp centipoises DSC Differential Scanning Calorimetry FTIR Fourier Transform Infra Red g gram GHz giga hertz HLB hydrophile-lipophile balance HPLC High-Performance Liquid Chromatogram min minute ml mili litre mg mili gram MW microwave O/W oil-in-water O/W/O oil-in-water-in-oil R resin R/A resin to asphaltene ratio rpm rotate per minute SARA Saturated, Asphaltenes, Resin, Aromatic SDDS sodium dedocyl sulfate Span 83 sorbitan sesquiolate Tween 80 polysorbate 80 WAT wax appearance temperature
23 W/O W/O/W water-in-oil water-in-oil-in-water
24 LIST OF NOMENCLATURES E f H S c o Dp c V Cp h q mv P W electric field intensity frequency magnetic field surface velocity penetration depth speed of light volume of water separated heat capacity convective heat transfer coefficient volume rate of heat generation microwave power dissipated per unit volume watt Greek Symbols µ O viscosity of oil ρ liquid density, g/cm 3 µ micron Φ volume fraction ε dielectric loss ε dielectric properties ε* complex permittivity λ wavelength, cm % percent ζ electric conductivity
25 CHAPTER 1 INTRODUCTION 1.1 BACKGROUND OF STUDY It is well recognized that the energy consumption per capita and crude oil play and important role in providing energy supply of the world because crude oil is the most readily exploitable source of energy available to humankind, and also source of raw materials for feed stocks in many of the chemical industries (Holmberg; 2001). However, there are about 80% of exploited crude oils exist in an emulsion state, all over the world (Xia et al., 2004). Particularly, the emulsion presents in crude oil reduced the quality of crude oil and also may be encountered problems during the refinery process thus can lead to enormous financial losses if not treated correctly. Hence, emulsions have to be broken to reach specific values of product quality (<0.5% W/O), both for oil and produced water to avoid large economic penalties (Hannisdal, 2005). The undesired emulsion is necessary to be demulsified to have good quality of the crude oil. Although great effort has been made to demulsified these emulsions, it remains a challenge to effectively break up undesired emulsions by understand the mechanism of formation and stabilisation of the emulsion. The stabilisation and formation of emulsion are crucial parts to study before demulsified the stable emulsion, results in higher separation of water presented in the crude oil.
26 1.2 PROBLEM STATEMENT The major problem, when dealing with the crude oil is the formation of persistent water in the crude oil emulsion thus performed the stable emulsion. The present stable emulsion in crude oils encountered many problems especially when deals with the quality of crude oils. Emulsions occurred when there is water as immiscible liquids present in the crude oil. Water is normally present in crude oil reservoirs or is injected as steam to stimulate oil production. Water and oil can mix while rising through the well and when passing through valves and pumps to form in most cases relatively stable dispersions of water droplets in crude oil. Emulsions of crude oil and water can be encountered at many stages during drilling, producing, transporting and processing of crude oils and in many locations such as in hydrocarbon reservoirs, well bores, surface facilities, transportation system and refineries. Also, emulsions usually exhibit viscosities significantly higher than crude oil, thus increasing the energy input required for transport in pipeline (Alejandro et al., 2005). The formation of stable and persistent emulsions are typically undesirable and can result in high pumping costs, reduced throughput and special handling equipment in the production and refining of crude oil petroleum as a challenge which has defied broads and generic resolution for several decades. A most recent technology which has received lots of attention from researchers is the application of microwave field in the demulsification process (Wolf, 1986; Rajaković and Skala, 2006). Microwave offer a fast heating treatment with uniform temperature distribution to the subjected sample. Because of the qualities of microwave discussed earlier in the other industry such as food industry and oil sands separation from previous researchers (Mutyala et al., 2010; Yanniotis and Sundén, 2006), study has been conducted regarding the use of electromagnetic energy to heat emulsion especially for stable emulsion. This present study is aimed to investigate the effect of microwave radiation in the breaking of the emulsion and separation of water from crude oil and compare it with conventional heating methods, to find an effective way of good separation, less energy consumption, and even cost effective. Thus, to fill this gaps in petroleum industry, three types of crude oil from light to heavy crude oil were selected to accomplish the problems in
27 9 industry especially when covenant with stable emulsion for heavy crude oil. The emulsion was prepared by following the problems encountered in industry through screening the stability of emulsion before demulsified each emulsion. 1.3 DEFINITION OF TERMS The terms of emulsion, types of emulsion, demulsification and microwave radiation are defined in generally and are listed below: Emulsion Dispersions of a liquid phase in another will exhibit certain stability. The term significantly stable means relative to the intended use and may range from a few minutes to a few years. At least two immiscible liquid phases should be present to make an emulsion (Sjöblom, 2006; Rosen, 2004). The dispersed phase is sometimes referred to as the internal (disperse) phase and the continuous phase as the external phase (Schramm, 2005). In most emulsions, one of liquids is aqueous while the other is hydrocarbon and referred to as oil. Emulsions are formed when one liquid is dispersed in a continuous liquid phase of a different composition. However, as studied by Rosen (2004), two immiscible pure liquids cannot form an emulsion. For a suspension of a liquid in another to be stable enough to be classified as an emulsion, a third component must be present to stabilise the system and called as emulsifying agent. As reviewed from Holmberg (2001) as shown in Figure 1.1, the common types of emulsions are oil-in-water (O/W) and water-in-oil (W/O) emulsions, although water-in-oilin-water (W/O/W) and oil-in-water-in-oil (O/W/O) multiple emulsions are sometimes encountered. However, in the petroleum industry, the common emulsion present is waterin-oil (W/O) types.

28 10 W/O O/W W/O/W Figure 1.1: Commom Types of Crude Oil Emulsions (W/O and O/W) and Less Common (W/O/W) Source: Holmberg (2001) Demulsification The breaking of emulsion is necessary in many applications such as environmental technology, painting, petroleum industry and waste-water treatments. The breaking of emulsion which is the process of oil and water separation from emulsion also can be identified as demulsification (Yang et al., 2009). As studied by Wu et al. (2003), demulsification can be achieved by three methods which are chemical, mechanical and electrical Microwave Irradiation Microwave irradiation is one of the demulsification methods. Abdurahman et al. (2007), Tanmay and Ayappa (1997) as saying that microwave radiation is an electromagnetic radiation with frequency range within 300 MHz to 300 GHz or equivalently with wavelengths ranging from 1 m down to 1 mm Microwave is non-ionizing radiation that causes molecular motion by migration of ions and dipole rotation. However, it will not change the molecular structure.
29 OPERATIONAL DEFINITION Microwave radiation terms need to be operated as follow this study Microwave In this study, microwave was used as an alternative method to demulsified water-incrude oil emulsion. Elba domestic microwave oven model: EMO 808 SS would be used in heating crude oil emulsion samples. The microwave was modified to put sample container. Two thermocouples were inserted in the emulsion samples at different locations. This study was investigated the capability of microwave compared with conventional methods at prescribed variables. 1.5 OBJECTIVES OF STUDY The objectives of this present study are:- i. To investigate the stability of emulsion using different crude oil samples. ii. To investigate the performance of microwave application in demulsification of water-in-crude oil emulsions. iii. To compare the performance of microwave application with conventional demulsification methods. 1.6 SCOPES OF STUDY To accomplish the objectives of this study, the scopes of this work focuses on: 1. Characterisation of crude oil in terms of physical and chemical properties. 2. To investigate the factors affected stability and formation of W/O emulsion. 3. To examine the demulsification of emulsions by conventional methods (hotplate, chemical demulsifiers, and gravity separation). 4. To examine the demulsification of emulsions by microwave heating using batch process system.
30 12 5. To study the effect of varying the microwave power generation in demulsification of W/O emulsions. 6. Optimisation of process parameters in demulsification. 1.7 SIGNIFICANT OF STUDY Demand of the crude oil especially in refinery industry causes the higher production of crude oil. However to date, crude oil exploitation has advanced to the point that the era of large fields with a high quantity and quality is over. Since the possibility of finding highly productive formations is small the corresponding strategy is focused on an improved exploitation of the existing large fields and to tie in, in an efficient way, small fields. The most important thing when focusing on existing large fields is to increase the recovery rate. To fill these gaps, this study is proposed an alternative method to demulsified the formation of emulsion by using different types of crude oil starting from lighter to heavier which each crude oil inventive from petroleum industry to accomplish the industry standard and requirement. Subsequently, the prepared emulsion was demulsified by comparing conventional and microwave irradiation. By the end of this study, the most effective method in demulsification could be identified and the process parameters also could be optimised using response surface methodology. 1.8 THESIS OUTLINE This thesis was organized by seven chapters which begun with chapter 1. Chapter 1 presents in general information regarding the background, definition of terms. This chapter also listed the objectives and scopes of study covered in this study. Chapter 2 discussed in details about water-in-crude oil emulsion and factors affect the stability of emulsion. In first section, the formation of emulsion different of W/O and O/W also foam were explained. As major problems investigated in this study, emulsions were explained the mechanisms of stability and instability. The introduction of application method such as heating, chemical and electrical in demulsification is engrossed in general.
31 13 The purpose of chapter 3 is to discuss, in general terms how microwave is generated. It also introduces the fundamental nature of microwaves include mechanisms of dielectric constant and loss and loss tangent. This chapter discuss about interact of microwave with materials, and how these interactions generate process heat. Materials and experiment procedures used to achieve objectives in this study are presented in Chapter 4. These include the crude oil characteristics which involve the physical and chemical properties of crude oil. Then follow by the emulsion stability test at different phase ratio of emulsion. And finally demulsified the emulsion by comparing conventional and microwave methods. Demulsification by microwave heating technology was selected for further scope which optimisation part. The main findings for emulsion stability are discussed in Chapter 5. The discussion covered the crude oil characteristics in physical and chemical properties. This chapter also discussed the factors affect on emulsion stability. Meanwhile for the demulsification part, results and discussion are conferred in Chapter 6. The optimisation part in microwave technology also covered in this chapter. Lastly, the conclusion and recommendations in this study are discussed and listed in Chapter SUMMARY Emulsion problems in crude oil production and processing have gained serious consideration either from fundamental and practical aspects by oil companies as well as researchers for the last few decades. One of the focuses is on developing an effective method of breaking up W/O emulsions formed within reservoirs. This study will address some of the fundamental and practical aspects of these areas of interest.
32 14 CHAPTER 2 EMULSION STABILITY 2.1 INTRODUCTION Crude oil emulsions have a wide variation in both physical and chemical properties, and also stability of emulsion. Emulsion presences in industry normally performed the stable emulsion due to the existence of natural surfactant in crude oil. The rheological properties such as emulsion composition and viscosity have been a great interest in understanding the concept of emulsion stability. Therefore, it is necessary to study the composition and properties of crude oil before further with the factors effect stability and rheological properties in emulsion. In this chapter, the characterisation of crude oil, the formation of emulsion and the factors affect stability of emulsion will be reviewed. Then, the demulsification methods will be touched in generally by explained the application of using chemical demulsifier, conventional thermal heating and electric current in treating the emulsion. 2.2 CRUDE OIL EMULSION COMPOSITION Crude oil varies greatly in appearance depending on its composition. As postulated from Auflem (2002), crude oil is the complex mixture of hydrocarbons, with small amount of sulphur, oxygen and nitrogen, as well as various metallic constituents, particularly vanadium, nickel, iron and copper. Crude oils consist of light hydrocarbon such as gasoline, asphaltenes, resins, waxes and napthenic acid. Crude oils, especially heavy crude oils
33 contain large quantities of asphaltenes (high molecular weight polar components) act as natural emulsifier or also called surface active agent. Besides, the other crude oil components such as resins, fatty acids, waxes and napthenic acid also act as surface active agent but cannot action alone in producing stable emulsion. The other particles in crude oils such as silica, clay and iron oxides naturally hydrophilic but they can become oil-wet (hydrophobic) due to long term exposure to the crude oil in the absence of water (Langevin et al., 2004). The method of dividing crude oil into four major fractions: saturates (including waxes), aromatics, resins and asphaltenes is called SARA fractionation, based on their polarity and solubility in the solvent. Based on Hannisdal (2005), briefly, saturates are defined as the saturated hydrocarbons ranging from straight-chained paraffins to cycloparaffins (naphthenes) while the aromatic fraction includes those hydrocarbons containing one or more aromatic nuclei which may be substituted with naphthenes or paraffins. Asphaltenes are defined as the solubility class of crude oil that precipitates in the presence of aliphatic solvents while the resin fraction is defined as the fraction soluble in light alkanes, but insoluble in liquid propane. Both are the most aromatic and most polar compounds of petroleum with the greatest amount of sulphur, nitrogen, and oxygen. The method of dividing crude oil into these four fractions is illustrated in Figure 2.1. Crude Oil Dilute with n-alkane Maltenes Adsorb with silica Precipitated n-alkane Toluene Toluene/ Saturates Aromatics Resins Asphaltene s Figure 2.1: Schematic of Saturate, Aromatic, Resin and Asphaltene (SARA) Fractionation of Crude Oils Source: Auflem (2002)
34 28 Crude oils from different regions have different properties. The physical properties that mainly affect the behaviour and persistence of crude oil are specific gravity, viscosity and pour point (Hannisdal, 2005). 2.3 EMULSION Emulsions are colloidal dispersions in which a liquid is dispersed in a continuous liquid phase of different composition. The dispersed phase is sometimes referred as the internal (disperse) phase and the other one phase as the external phase (Schramm, 2005). Emulsions may contain not just oil, water and emulsifier (usually surfactant), but also solid particles and gas. Emulsions are created throughout the full range of processes in the petroleum producing industry including drilling and completion, fracturing and simulation, reservoir recovery, surface treating and transportation. During heating, as part of an oil recovery process such as hot-water flotation or in situ steam flooding, emulsions having a wide range of viscosities can be formed, particularly if they are water-in-oil (W/O) type. 2.4 EMULSION FORMATION There are two stage processes formation of emulsions which are formation of new droplets and stabilisation of the droplets (Figure 2.2). For the formation of emulsion, at least two immiscible liquids are required (Ariany, 2004). The first process, formation of new droplets involves disrupting the stable bulk liquid to form dispersed phase by apply mechanical energy. The second process is the tendency of the droplets to coalesce and reform the stable bulk liquid must be overcome (Jennifer, 1999). Emulsions form more readily as the interfacial tension between the oil and water phases is reduced, and theoretically, when the value of interfacial tension is zero, the emulsion will form spontaneously. According to the emulsion theory, the formation of emulsion is easier when the interfacial energy is low but this is not a crucial factor for emulsion stability (Wanli et al., 2000). In the formation of an emulsion, the surface area or interfacial area between the dispersed and continuous phases increase to a very great extent,
35 29 and the properties of the interface are important in determining the ease of emulsion formation and its stability. This increase in surface area increases the free energy and thermodynamic instability of the system. Emulsifiers have the property of adsorbing at the interface, thus reducing the interfacial free energy, and this influences the ease with which the emulsion forms. Figure 2.2: Processes of the Crude Oil Emulsion Formation Source: Ariany (2004) Physico-chemical Factors Affecting the Formation of Emulsions Emulsion is part of liquid-liquid dispersion that can be affected by the formation of emulsion. The more important once are: (a) Concentration, (b) stability, (c) particle size, (d) viscosity, of the emulsion. Sometime other properties, like dielectric strength, electrical conductivity, or the colour may be specified, but these are relatively special features. 2.5 TYPES OF EMULSION
 is states that the continuous phase of an emulsion will be in which the surfactant (emulsifier) is most soluble.")
36 30 In commonly, there are two basic types of emulsion depend on the kind of liquid that perform as continuous phase. Still, the very general formulation by Bancroft (1912) is states that the continuous phase of an emulsion will be in which the surfactant (emulsifier) is most soluble. The common types of emulsions in the petroleum industry are oil-in-water (O/W) and water-in-oil (W/O). Figure 2.3: The Orientation of Emulsifier on the Surface of the Dispersed Phase Water-in-Oil Emulsion (W/O) In industry, typically W/O emulsion is existed. Water dispersed in crude oil, therefore water act as dispersion phase and continuous phase is crude oil. As claimed by Fingas (2001), W/O emulsion can be classified in four types which stable emulsion, mesostable emulsion, unstable emulsion and entrained water. Stable emulsion is brown materials with about 80% of average water content. While mesostable emulsion is brown or black viscous liquid with average water content of 62% on the day of formation and 38% one week later; entrained water is black liquids with average water content 42% in on the first day of formation and about 15% after one week Oil-in-Water Emulsion (O/W)
37 31 In general, O/W is presented if the surfactant (emulsifying agents) is more soluble in water than oil. Emulsions are common colloidal systems in many industrial products such as food, cosmetics, and pharmaceutical or agrochemical preparations. O/W emulsion is often used to deliver functional molecules and nutritional benefits, or to create a certain texture to the consumer. Oil-in-water emulsions are made of oil droplets which are dispersed in an aqueous continuous phase and stabilised by surface active molecules Differences Between W/O and O/W Emulsions Not all emulsions exhibit the classical milky opaqueness with which they are usually associated. A tremendous in range of appearance of emulsion is depending on the droplets sizes and difference of refractive index between the phases. Physically, the texture of an emulsion frequently reflects to the continuous phase. W/O emulsion feel more oily or greasy compared to O/W which this types of emulsion are considered more watery or creamy (Schramm, 2005). 2.6 TESTS FOR EMULSION TYPES Several tests can be used to identify the emulsion types. In general, three tests are usually used as listed below: Dilution Method This method is based on the fact that an emulsion can be diluted freely with a liquid as same as continuous phase. Typically, a small amount of the emulsion is added to a relatively large volume of water and the mixture is stirred. If the emulsion disperses in water, it is considered to be on O/W type emulsion. However, the emulsion remains undispersed is opposite type; W/O emulsion Electrical Conductivity
38 32 Measurement of electrical conductivity with conductivity bridges using platinum electrodes fused into glass tubing was proposed many years ago as away differentiating between O/W and W/O emulsions. The concept of this method based on the ability of the emulsion to conduct electrical current. Thus, when a voltage is applied across a liquid, a significant amount of electric current will flow only when the path of the current is through water as continuous phase. W/O performed insignificant current flow when applied under electric current since oil is a non-conductor of electricity Staining the Continuous Phase Another method to determine the type of emulsion is to use Sudan III or Scharlach R, red dyes soluble in the oil but not in the water (Bancroft, 1912). A small portion of the finely powdered dye is dusted over the surface of the emulsion. If oil is the external phase the colour gradually spreads throughout the emulsion. But if water is the external phase the colour does not spread but is confined to the oil with which it comes in contact on the surface. An example of such a dye is scarlet red, which is an oil soluble dye. When added to an O/W type emulsion, followed by observation under the microscope, bright red coloured oil drops in an aqueous phase can be seen clearly. 2.7 EMULSION STABILITY Emulsion stabilized with particles is called pickering emulsions. It is generally considered that since the size of stable emulsion drops is generally 10 μm or less, the particles contributing to emulsion stabilization should not be more than 1 μm in size (Langevin et al., 2004). Usually emulsions made by mixing together two pure liquids are not very stable. The stability of emulsion is determined by the interaction between the particles during the collisions. As studied from previous researchers (Sullivan and Kilpatrick, 2002; Ariany, 2004; Abdurahman et al., 2007) there are at least four mechanisms by which emulsions are stabilized; electrostatic repulsion, steric repulsion, the Marangoni- Gibbs effect, which retards film drainage and thin film stabilization.
39 Electrostatic Forces The approach of emulsion droplets to another one may be resisted by electrostatic forces. Sullivan and Kilpatrick (2002) as saying that electrostatic forces in emulsions arise from a surface charge on the droplet and then electric double layer may form around disperses phase droplet (Figure 2.4). Electrostatic forces do not play a significant role in the stabilization of water-in-oil emulsion because of the low dielectric constant of continuous phase. Figure 2.4: Electrostatic Forces Source: Ariany (2000) Steric Repulsion Steric repulsion is one of the mechanisms in emulsion stability. Steric repulsion is the resistance of adsorbed species on droplet interfaces to interactions with adsorbed species on other droplets as shown in Figure 2.5 (Sullivan and Kilpatrick, 2002). This mechanism occurs when it is energetically favourable for the adsorbed material to interact with the solvent in the continuous phase rather than other adsorbed material. Steric repulsion is commonly found in systems stabilized by nonionic where salvation energies can be high as result of hydrogen-bonding interactions.
40 34 Figure 2.5: Steric Repulsion Source: Ariany (2004) Marangoni-Gibbs Effect The effect on the surface tension by surfactant adsorption from the bulk solution (Gibbs effect) and by diffusion along the interface (Marangoni effect) is often referred to as combined Marangoni-Gibbs effect. The critical thickness for rupture of a thin film depends on the adsorption kinetics and interfacial activity of added demulsifiers. As the film thins, the continuous phase drains out from between the droplets and an interfacial tensions gradient is formed as the surfactants at the droplet interface are dragged out with the liquid. Because of the depletion of surfactant at the centre of the thin film interface, a diffusion flux is generated in the opposite direction of the drainage which cause the slowing fluid drainage (Sullivan and Kilpatrick, 2002) Thin Film Stabilization The formation of a mechanically rigid, viscoelastic and stagnant film around the droplets provides a physical barrier for droplet-droplet coalescence. Crude oil varies greatly in appearance depending on its composition. As postulated from Auflem (2002), crude oil, especially heavy crude oils contain large quantities of asphaltenes (high molecular weight polar components) act as natural emulsifier or also called surface active agent. Besides, the other crude oil components such as resins, fatty acids, waxes and napthenic acid also act as
. 2.8 EMULSION AND FOAM As mention above, emulsion is colloidal dispersion in which a liquid is dispersed in a continuous liquid phases. Foam is also deal with the colloidal dispersion.")

41 35 surface active agent but cannot action alone in producing stable emulsion (Langevin et al., 2004). 2.8 EMULSION AND FOAM As mention above, emulsion is colloidal dispersion in which a liquid is dispersed in a continuous liquid phases. Foam is also deal with the colloidal dispersion. However, foam involve with gas is dispersed in a continuous liquid phase. Liquids foams and emulsions in general, unstable thermodynamic (Wilde, 2000). The creation of foams and emulsion essentially requires the formation of fine bubbles and droplets. Foam can be created by liquid which, the surface area of liquid is expand to form a thin film around gas bubbles. The liquid must be able to posse the correct rheological and surface properties to retard thinning of the lamellae which lead to bubble coalescence and also diffuse the trapped gas from small to large bubbles or to the surrounding atmosphere. Figure 2.5 illustrated the general foam and emulsion image. Bubbles in persistent foams are polyhedral and not spherical. In fact foam bubbles usually have diameters greater than 10 µm and may be larger than 1000 µm (Schramm, 2005). (a) (b) Figure 2.6: Illustration of a Generalised (a) Foam (b) Emulsion Source: Schramm (2005)
42 EMULSION DESTABILISATION The break-up of droplets depends strongly on the type and intensity of the flow which is determined by the rotational speed and geometry of the impeller, geometry of the vessel and material properties of the continuous phase such as viscosity and mass density (Hannisdal; 2005). The phenomenon of emulsion separation can be broadly categorized into four mechanisms for demulsification which are sedimentation/ creaming, aggregation coalescence and Ostwald ripening. Sedimentation or creaming occurs when there is density different between dispersed and continuous phase. Aggregation is when two or more droplet species are aggregated and clump together but separated by a thin film of continuous phase. While coalescence occurs when thin film between the droplets break and they fuse together to form single larger unit. From Figure 2.7, at low interfacial coverage of the stabilizing units, collision of the emulsion droplets (a-b) usually terminated their coalescence (b-c). The flocculation or aggregation (d) takes place before proceed with coalescence process. Figure 2.7: Possible Consequence from Collisions between Two Droplets. Source: Hannisdal (2005) Sedimentation This is the phenomenon by which emulsions separate into two emulsions, one richer other is poorer in the dispersed phase. The more concentrated emulsion is commonly referred to as cream. The separation of cream from unhomogenised milk is very common
43 37 example of cream phenomenon. The mechanism of creaming appears to be due to the slow sedimentation of the emulsified droplets (Paul and Daniel; 1985). The velocity of sedimentation of a drop, v m of a radius, r and density, w in a liquid of viscosity, µ o and density of continuous phase, o is given by Stoke s equation if oil is continuous phase. V m gd ( ) 2 w o (2.1) 18 o Larger dispersed particle radii and difference density, ( w - o ) give the faster sedimentation. This effect may be minimised by gentle mixing (Jennifer; 1999) Aggregation Flocculation is the process in which emulsion drops aggregate, without rupture of the stabilizing layer at the interface. Flocculation of emulsions may occur under conditions when the van der Waals attractive energy exceeds the repulsive energy and can be weak or strong, depending on the strength of inter-drop forces (Hannisdal, 2006). The rate of flocculation can be estimated from the product of a frequency factor (how often drops encounter each other) and the probability factor (how long they stay in contact) Coalescence As two emulsified drops approach each other, liquid flows out of the film and thinning occur. According to Wanli et al. (2000), the drainage velocity of thinning film is dependent upon the forces acting at the interface of the film then, the droplets fuse together to form a single larger unit.
44 Ostwald Ripening Ostwald ripening is a long-term effect in destabilisation process of emulsion. This step occurs when dispersed phase is soluble enough within the continuous phase and consists of a gradual coarsening of emulsion (Hannisdal, 2005). Ostwald ripening caused by the diffusion of monomers from smaller to larger droplets due to greater solubility of a single monomer molecules in the larger monomer droplets METHODS OF EMULSION BREAKING The breaking of emulsion is necessary in emulsion treatment. Methods currently available for demulsification can be classified as chemical, electrical and mechanical (Abdurahman et al., 2007). In generally, methods to induce phase separation for water-inoil emulsions can be applied using chemical or heating the emulsion. Chemical demulsifiation is common method used and since the 1930s, demulsifier has been used in treating emulsion (Wu et al., 2003). Conventional thermal heating involved the breaking of emulsion due to reduction of viscosity of continuous phase. However, currently microwave has been studied an alternative method to treat the emulsion. The concept of microwave demulsification is first introduced by Klaika (1978) and Wolf (1986) Application of Chemical Chemical demulsifier is a conventional method widely used in industry. However, the problems of using this method are environment problematic which involve with waste water stream and the cost of using chemical in large quantities volume could be enormous and may outweigh the benefits realized (Countinho et al., 2008; Rajaković and Skala, 2006; Arnoud, 2004). This method involves the use of chemical additives to accelerate the emulsion breaking process. As studied by Kang et al. (2006), the breaking through this method is based on the rupture of interfacial film and surfactant adsorption mechanisms. The dispersed phase (water droplets) approached each other and flattens to form a thin film of continuous phase between them. Demulsifier molecules and natural surfactants
45 39 (asphaltenes) then compete each other to adsorb onto voids created because of the difference of interfacial tension inside and outside film (Figure 2.8). The outward drainage flow of the film can create gradients in the interfacial tension which then oppose and slow down to drainage (Djuve et al., 2001). In this way, the adsorption of demulsifier is continuous exponentially until the films become very thin and it ruptures due to close proximity of adjacent dispersed phase surfaces and local absence of surfactant molecules. Most commercial demulsifiers that are used to break up water-in-oil emulsions are oil soluble. The interfacial activity of these oil soluble demulsifier molecules is controlled by the rate of the bulk diffusion process from bulk phase to the interface and adsorption barrier at the water/oil interface. As reviewed by Djuve et al. (2001), the efficiency of the demulsifier is related to the hydrophile-lipophile balance (HLB) behaviour. Figure 2.8: Process of Chemical Demulsification Application of Thermal Heating Source: Djuve et al. (2001)
46 40 Thermal heating method is the addition of heat to enhance the emulsion breaking. Heating an emulsion usually causes a slight reduction in the interfacial tension between oil and water phases. Heat is applied in breaking the emulsion because it is characterised by rates in temperature (Coutinho et al., 2008). The thermal heating is affected on the emulsion due to reduction of viscosity of emulsion. This is agreed from previous researchers (Strom-Kristiansen et al., 1995; Hannisdal, 2005; Yang et al., 2009) the viscosity of emulsion is reduced as increasing temperature due to the elimination of protective rigid film surround the droplets. Temperature and viscosity have significant factors in heating. Indeed, microwave irradiation also occupied with heating but in different way. In microwave irradiation, electromagnetic is transfer to energy and energy will be conversed. But, for thermal heating the heat transfer is transfer using thermal gradient from conduction to convection (Yanniotis and Sundén, 2006). Microwave irradiation is widely used in food industry because demonstrates significant advantages over conventional methods in reducing process time and improving food quality. The idea of using this microwave heating in food industry leads of using this method in demulsification. As studied by Xia et al. (2004), conventional heating could be used in demulsification due to the reduction of viscosity; however this process takes long time in separation Effects of Electric Current Electric is applied to demulsified across an emulsion that causes the charged droplets to move toward the oppositely charged. Electric field produced disturbs the surface tension of each droplet, possibly by causing polar molecules to reorient themselves. This reorientation weaken the film surround the droplets because the polar molecules are no longer concentrated at the droplets surface. A mutual attraction of adjacent emulsion particles receives induced and oriented charges from the applied electric field. This mutual attraction places oppositely charged particles in close proximity to each other. Therefore, the droplets are electrically attracted to each other and lead coalescence process.
47 41 In microwave irradiation, electric current is applied due to the combination of electric and magnetic wave from penetration of electromagnetic through the materials. Information of using this method in demulsification has been developed in last 30 years. This method was firstly introduced by Klaika and Wolf since 1970s in their patent application to remove hydrocarbon fuel from geological substrates such as coal, shale, tar sand and existing oil wells (Klaika, 1978). Abdurahman and Rosli (2006) studied the efficiency of microwave irradiation by comparing gravity sedimentation, conventional heating and microwave irradiation by using light crude oil. They concluded that microwave irradiation can be tool to demulsified emulsion. In a related study, Ngai and Wu (2005) investigated the efficiency of microwave mixed with solvent in stabilising the microemulsion polymerisation. These combination solvent and microwave could be able to produce narrowly distributed small emulsifier-free polystyrene latex particles due to volumetric heating in microwave. Rajaković and Skala (2006) also proved the efficiency of microwave irradiation in demulsification method by combination freeze-thaw and microwave and metal-working oil has been used as emulsion sample. The development of microwave irradiation as an alternative method for heating heavy crude oil in reservoirs may be economically viable alternatives to steam in certain situation. From Mutyala et al. (2010), the application of microwave in petroleum industry could be used as pre-heating tools where the temperature effect on viscosity is significant SURFACTANTS Surfactants are widely used and find a very large number of applications because of their remarkable ability to influence the properties of surfaces and interfaces. A surfactant, also called surface-active agent is a substance that has the property of adsorbing onto the surfaces of interfaces of the system at low concentration and alter to a marked degree the surface or interfacial free energies of those surfaces (Rosen, 2004). Previous researchers (Rosen, 2004; Schramm, 2000), agreed that surfactants have a characteristic molecular structure consisting of a structural group that has very little attraction for solvent, known as
48 42 hydrophilic group, together with a group that has strong attraction for solvent, and known as hydrophobic group. This is known as an amphiphilic structure. The adsorption of surfactant from a bulk phase to a surface or interface occurs at any concentration. As studied by Homberg (2001), the surface concentration increased gradually as soluble surfactant in water increased until reaches a maximum level at specific bulk concentration. Beyond this concentration, individual surfactant monomers begin to aggregate with their hydrophilic heads pointing outwards towards the solution and the hydrophobic tails pointing inwards away from the water in order to minimise the free energy of the system. The effects of association between adjacent hydrophobic or hydrophilic section of surfactant molecules are enhanced in aggregate structures such as micelles (Biresaw and Mittal, 2008). Hence, the concentration at this aggregation occurs is called the critical micelle concentration (CMC) as shown in Figure 2.9. Figure 2.9: Typically Surfactant Structure Source: Carlota et al. (2005) By adding surfactant such as surface-active emulsifiers or demulsifiers that affect the molecular confirmation and arrangement at the interface, would alter the interfacial tension and changed the stability of the formed emulsions (Wang et al., 2004). The selection of surfactant in preparation of either W/O or O/W emulsions is often made by hydrophilic-lipophilic balance (HLB). This method was first introduced by Griffin (1954) to scale the relative percentage of hydrophilic to lipophlic (hydrophobic) groups in the
49 43 surfactant molecules. For an O/W emulsion, droplets the hydrophobic chain exists in the oil phase, while the hydrophilic head resides in aqueous phase and vice versa for W/O emulsion. Table 2.1 provided the range of HLB in selection of surfactants for particular applications:- Table 2.1: A Summary of Surfactant HLB Ranges and Applications HLB range Application 3-6 W/O emulsifier 7-9 Wetting agent 8-18 O/W emulsifier Detergent Solubiliser 2.12 SUMMARY Source: Hait and Moulik (2001) In the petroleum industry, the present of emulsion is undesirable because of problems encountered by forming this emulsion. Essentially breaking of emulsion is to improve the quality of emulsion. However, the stability of emulsion is crucial part to investigate first. This stability of emulsion depends on the properties of crude oil and factors affected on emulsion characteristics such as viscosity, temperature and concentration of dispersed phase.
50 44 CHAPTER 3 MECHANISMS OF MICROWAVE THEORY 3.4 INTRODUCTION It has been known for long time that microwaves can be use for heat materials. In fact, the development of microwave oven for the heating food has been more than a 50-year history (Wu, 2003). Recently, microwave is investigated as an alternative method to break the emulsion. Microwave irradiation is being studied as tool for demulsification. In the electromagnetic spectrum, the microwave radiation is located between infrared radiation and radio waves. Microwaves have wavelengths of 1 mm -1m, corresponding to the frequencies between 0.3 and 300 GHz (Lidstrőm et al., 2001). From Lidstrőm et al. (2001), in general in order to avoid interference, the frequency at which industrial and domestic corresponding to 2.45 GHz, but other frequency allocations do exists (Figure 3.1). The heating of liquids using microwaves can be explained by the interaction of matter with the electric field of the incident radiation, causing the movement of ions as well as that of induced or permanent molecule dipoles. The movement of such species can cause heat generation. 3.5 MICROWAVE ENERGY AND MATERIALS INTERACTION Microwave is very short waves of electromagnetic by penetrate the electromagnetic energy through materials. Since microwave energy transfer involve electric and magnetic field, the interaction materials is selected based on electric and magnetic component.
51 Figure 3.1: Frequency Ranges of Microwaves used in Microwave Oven Source: Modified from National Materials Advisory Board (1994) A propagating electromagnetic wave has two components which are an electric field, E (unit V/m) and magnetic field, H (unit A/m). There are vectors and always perpendicular with each other as illustrated in Figure 3.2. In free space the propagating wave has a velocity (c o ) of about 3.0 x 10 8 m/s and this is the maximum speed for energy to travel. Frequency (f) and wavelength (λ) are linked as in Equation 3.1; c f (3.1) Figure 3.2: A Propagating Electromagnetic Wave Source: Ryynänen (2002)
52 38 The most important thing in microwave heating is volumetric heating, which in a manner different with conventional heating. Volumetric heating means that materials can absorb microwave energy directly and convert into heat. This lead the advantages of microwave like rapid, selectively, control and uniform heating. While in conventional heating, heat must diffuse from the surface to material. As reported by Nadkarni (1984), for conventional thermal heating, typical time required to complete heat wet absorption by conductive heating is about 1-2 hours. While for microwave heating in open-vessel, the time required is less about 96% which 5-15 min. In conventional thermal heating, vessel used usually poor conductors of heat, thus it takes time to heat vessel and transfer it into the solution. Because vaporisation occurs at the surface of liquid, a thermal gradient is established by convection currents and only a small portion of solution is at the temperature of the heat applied. Therefore, when conductively heating occurs, only a small portion of the solution is above the boiling point temperature of the solution (Figure 3.3). (a) (b) Figure 3.3: Sample Heating by (a) Conventional Thermal Heating (b) Microwave Heating Source: Kingston (1988)
53 MICROWAVE PROPERTIES The main application of microwave processing of materials is heating. As studied by Lidstrőm et al. (2001), if two samples containing water and oil respectively are heated under microwave irradiation, the final temperature is higher in the water sample. In order to understand why this phenomenon occurs, it is necessary to understand the mechanisms of microwave dielectric heating. As with all electromagnetic radiation, microwave radiation can be divided into an electric field and magnetic field component. The former component is responsible to the dielectric heating is affected via two mechanisms which are dipole rotation and ionic conduction as illustrated in Figure 3.4 and 3.5 (Coutinho et al., 2008). Gas cannot be heated under microwave irradiation since the distance between two rotating molecules is long enough for molecules to be able to follow the electric field therefore, there are no phases different will be generated Dipole Rotation Mechanism Electric dipoles are formed by the interaction of electric charge with the matrix. A dipole is sensitive to the external electric fields and will attempt to align itself with the electric field by rotation itself (Lidstrőm et al., 2001). Water molecule is an example of a posse dipole molecule. Figure 3.4: Alignment of Dipolar Molecules with an Oscillating Electric Field Source: Lidstrőm et al. (2001)
, in liquids state, the electric dipoles cannot rotate instantaneously and the ability of molecules to align under influence of electric field will vary with different frequencies and")
54 40 Based on Coutinho et al. (2008), in liquids state, the electric dipoles cannot rotate instantaneously and the ability of molecules to align under influence of electric field will vary with different frequencies and viscosities of liquid. For low radiation frequencies, the time where the electric field changes direction is higher than the dipole response time. Molecules gain some energies but overall heating effect with full alignment is small. However, at very high frequency electric field, dipoles do not have sufficient time to follow the oscillating field and molecules do not rotate and move. When there is no motion, so there is no energy takes place and there also no heating occurs Ionic Conduction A solution containing ions migrate through the solution under the influence of an electric field, resulting in expenditure of energy due to an increased collision rate, therefore converting the kinetic energy to heat (Lidstrőm et al., 2001). The resulting electrical currents heat the sample as a consequence of the electrical resistance Figure 3.5: Charge Particles in the Solution Follow the Applied Electric Field Source: Lidstrőm et al. (2001) This ion migration is a flow of current that results in I 2 R migration depend on size, charge and conductivity of the dissolved ions and are subject to the effects of ion interaction with the solvent molecules. The parameters affecting ionic conduction are ion concentration, ion mobility and temperature of solution.
55 Dielectric Properties From the mechanisms above, polar solvents and/or ions are needed for the microwave heating. Dielectric response for various materials plays important role to carry out efficient material processing and a significant amount of earlier research was devoted to understand the physics on microwave assisted transport and heating characteristics (Lidstrőm et al., 2001; Basak and Meenakshi, 2006). The dielectric polarization depends on the ability of the dipoles reorientation in an applied electric field. In order to compare the abilities of different solvents to generate heat from microwave irradiation, their capabilities to absorb microwave energy and to convert the absorbed energy into heat must be accounted (Lidstrőm et al., 2001). These factors may be considered using the loss angle, δ which is usually expressed in the form of its tangent '' tan (3.2) The real permittivity or dielectric constant, is characterising the penetration of microwaves into material and loss factor, indicating the material ability to store energy. The complex permittivity,* is a measure the ability of a dielectric to adsorb and store electrical potential energy with real permittivity, and loss factor,. * ' i * ' ' (3.3) The re-orientation of dipoles and displacement of charge are equivalent to an electric current as mention in Maxwell s displacement current. As postulated by Indra, (2007), the displacement current will be 90 o out of phase with the electric field when a dielectric precisely follows the electric field whereas the flow of current is perpendicular to the electric field. A dielectric that does not follow the oscillating electric field will have a phase difference between the orientation and electric field. Hence, this will produces a component, I sin δ which cause energy is absorbed from the electric field and converted into heat; called as dielectric loss.
56 Energy Conversion In microwaves, energy is converted into heat which, a process that involves interaction between microwave fields and the conductivity or dielectric properties of the material. As claimed by National Materials Advisory Board (1994), there are three processes interaction between microwave and materials; i) space charges due to electronic conduction ii) ionic polarization associated with far-infrared vibrations and iii) rotation of dielectric dipoles. The dielectric properties of material in combination with the applied of electromagnetic field result in the conversion of the electromagnetic energy into heat. Power that transmitted through the material can be determined by Poynting s Vector (Equation 3.4) which is derived from Maxwell equation (Leszek, 2003). The flow of energy through the surface, S enclosing the volume, V to the cross product of the electric-field, E and magnetic field, H strength which can be explained by the flux of a vector:- S E H (3.4) Using the divergence theorem, the Maxwell equation by assuming material properties of the volume, the following equation can be acquired for the real portion of the Poynting Power Theorem:- S 1 1. V t (3.5) E H ds E JdV E H dv n V The rate loss of energy stored in electric and magnetic field within a region of space is state in left side. The right side represent the work done per second by the impressed forces, E. JdV, the sum of the rate of dissipation of electrical energy, 1 2 E 2 as heat and the rate of flow of electromagnetic energy outward, 1 H 2 2 through the surface of region.
57 WORKING EQUATIONS FOR MICROWAVE DEMULSIFICATION STUDY Microwave heating is an alternative method to demulsified the emulsion due to the fact that microwave offers a clean, cheap and convenient heating process that in most of the times results into better yield and shorter times. Since microwave heats material volumetrically, the volume rate of microwave heat generation from energy balance equation can be determined as:- Q mw 4 dt ( T ) ( T ) C ha A 4 ( Tm Ta ) m a p (3.6) V V dt The right side comprises three terms, convection, conduction and radiation heat transfer through the sample. From Equation 3.7, the rate of heat transfer for conduction and convection are assume zero due to the rate of heat transfer from emulsified water droplets to continuous phase is very rapid; therefore, in practically temperature of water and oil almost same. Therefore, the heat generation of emulsion can be expressed as follows:- dt Qmw CP (3.7) dt where Q mw ( cal/s.cm 3 ) is the total dissipated microwave power in the material, heating rate, dt/dt ( o C/sec), density, (g/cm 3 ) and heat capacity, C p (cal/g. o C) respectively. Density and heat capacity of emulsion calculated from mixing rules as: m w o( 1) (3.8) C (1 pm Cp, w Cp, o( ) (3.9) The rate of heat generation is depends on dielectric properties of the emulsion. For water, dielectric constant and loss are two important parameters. These parameters are represented by the following equations (Di et al., 2000): ' w T (3.10) 1.03 '' w T (3.11)
58 44 However, as proposed by Von Hippel (1954) dielectric properties of various petroleum oils, in this regard dielectric constant and loss tangent of crude oil for this study calculated from the equation below:- oil T ' (3.12) tan x T o (3.13) From Lidstrőm et al. (2001), the dielectric constant can only change with temperature since the frequency for most types of microwave apparatus is set at 2.45 GHz, the wavelength, m and penetration depth, D p within a sample for a radiation is related to dielectric constant and dielectric loss as follows: 2 1 / ' ' ' 1 ' r r r m f c (3.14) Penetration depth has been generally related to temperature distribution in microwave heating. Penetration depth measures the distance from the surface of a dielectric material and given approximately by:- 2 1 / ' ' ' 1 ' 2 r r r p f c D (3.15) 3.5 SUMMARY The penetration of electromagnetic into materials was depends on the ability of materials to absorb the electromagnetic and convert it into heat. The ability of materials to absorb the electromagnetic was interpreted into dielectric properties equation of emulsion whereas using mixing rule for water and crude oil. The effectiveness of microwave
59 45 radiation at different microwave power and ratio of water-crude oil was investigated through penetration depth and wavelength as discussed in equation above.
60 46 CHAPTER 4 MATERIALS AND METHODS 4.1 INTRODUCTION This chapter describes the materials, equipment and methods followed to solve the problem of this study. To accomplish the objectives of scopes of this research, the study was carried out in three stages namely, emulsion stabilisation, microwave batch process and optimisation. The first and second stages are experimental while third stage is optimisation. Experimental methods involve the procedure for emulsion sample preparations, experimental set-up for microwave equipment, sample characterisation using microwave processes (sample analysis, identification of emulsion type, measurement of emulsion stability, density, viscosity and dielectric properties of emulsions. Details of the experimental are discussed below. 4.2 FLOW OF STUDY The study has been conducted by using three types of crude oil from lighter to heavier crude oil. The flow of study shows in Figure 4.1. Basically this study was summarised by six parts. Firstly each crude oil was characterised in term of physical and chemical properties. The emulsion would be prepared depend on the requirement of volume fraction and each prepared emulsion was checking either W/O or O/W emulsion by using
61 dilution and conventional drop tests. Only W/O emulsion has been used in the emulsion stability part. The most stable emulsion was selected in this screening part before demulsified in demulsification part by comparing conventional and microwave irradiation. The most effective methods determined by observing the percentage of water separated. For the optimisation part, the process parameters in demulsification would be optimised using response surface methodology. Crude oil characteristics i. Physical ii. Chemical Emulsion preparation Emulsion checking W/O or O/W emulsion Emulsion stability Stable emulsion preparation Demulsification i. Conventional method ii. Microwave irradiation Optimisation Response surface methodology (RSM) Figure 4.1: Flow of Study
62 MATERIAL SELECTION Basically in this study, there were three types of crude oils were donated from Petronas Refinery at Melaka were used. The samples were denoted as crude oil A (Saudi), crude oil B (Kuwait) and C (United Arab Emirates). The samples were selected because of the types which were consisting heavy and light crude oil. Several chemicals are selected while characterise and investigated the emulsion stability. In the preliminary study, four emulsifiers such as sodium dedocyl sulfate (SDDS) 10% in water from Merck, polysorbate 80 (Tween 80) from R&M chemicals, Triton X-100 (98-100% from Merck) and sorbitan sesquiolate (Span 83) from Sigma were selected to form the most stable emulsions depend on the type of crude oils. The emulsifiers contain of non-ionic and ionic groups to compare the most stable emulsion performed by emulsifiers. The reagent grade n-pentane (>99.0% from R&M Chemicals), n-hexane (99% from Merck) to decolourise crude oil, toluene (>99.5% from Systerm), methanol ( 99.9% from Merck), dichloromethane ( 99.6% from Merck) were used in separation of fraction components in crude oil. 99% hexylamine from Sigma-Aldrich, octylamine ( 98% from Merck) and pentylamine (98% from Merck) act as demulsifier Sample Preparation Basically emulsion is prepared by added water to crude oil in prescribed ratio. About 50 ml of emulsion sample was prepared in this study. Figure 4.2 illustrates the schematic diagram in preparing the emulsion. Firstly, 0.1% emulsifier of crude oil added to crude oil (mixing solution) and it stirred using three blades propeller for 1 minute with ±500 rpm. Water is added gradually to the mixing solution and was agitated vigorously using a standard three blade propeller at speed 500 to 1500 rpm and temperature o C for 5 minutes. Then, the type of emulsion (W/O or O/W) was inferred by a conventional drop test (Evdokimov et al., 2008). The concentrations of water (internal phase) in the samples were varied by volume. Emulsions were observed over a period of time to provide
63 78 a qualitative measure of the stability. Details of these studies were reported in next chapter (results and discussion). Figure 4.2: Schematic Diagram for Preparing W/O Emulsion System 4.4 ANALYTICAL PROCEDURE Physical Characteristics Density of Crude Oil The density of crude oil is measured using pycnometer 20 ml (ASTM D70, NFT 66007). Pycnometer is a glass flask with a close fitting ground glass stopper with a capillary hole through it. This fine hole releases a spare liquid. The samples is introduced to equilibrate to room temperature (27 o C ± 0.2 o C) in pycnometer and weighted. The pycnometer also filled with distillate water and weighted at same temperature. While for o API density, both density of crude oil and water are measured at 15.6 o C as shown in Equation The petroleum gravity ( o API) is measured using the following equation:-
64 79 o APIdensity o d( at15.6 C) (4.1) d o sample ( at15.6 C) (4.2) water Pour Point Pour point bath model K46100 from Koehler Instrument Company which conforms to ASTM D9 used to measure pour point for each crude oil. Pour point bath required a pressure vessel and a water bath in addition. The pour point bath consisted of 4 litres water cooling bath with cover, which is equipped with an opening for one air jacket, a stopper and a borehole for thermometer. Crude oil was cooled at specified rate and examined the flow characteristics. The lowest temperature at which crude oil will flow is observed and stated as pour point. Viscosity, Shear Rate and Shear Stress Viscosity, shear rate, and shear stress of the water-in-crude oil emulsions in this study were determined by Brookfield Rotational Digital Viscometer Model LV/DV-III with UL adaptor. The Brookfield Viscometer apparatus was equipped with a water bath thermostat, a spindle set, and software of Brookfield Rheocalc Version 1.2. A smaller diameter spindle (type s spindle 31) was used to measure the emulsions viscosities with a cell containing approximately 10 ml of sample. This type of measurement is usually referred as Couette method, and it measures the fluid parameters of shear stress and viscosity at given shear rates. The principle of operation of this unit is to drive a spindle which is immersed in the sample. The measuring range is determined by the rotational speed of the spindle, the container the spindle is rotating in and the full scale torque of the spring. The rheometer was thoroughly cleaned between measurements of different emulsion samples.
65 80 Water Content The crude oil was injected using syringe 10mL in Karl Fisher Analyzer model 787 KF Titrano brand Metrohm to analyse water content in crude oil. Karl Fisher is calibrated to achieve standard drift value is below 20 or once condition of light remains on without blinking, the 787 KF Titrano was ready for sample injected. The syringe with sample was tare to zero and sample was injected through septum. The result of water content was measured in unit of percent (%). Interfacial Tension and Surface Tension Surface and interfacial tension measurement standard test method (ASTM) is used and the equipment is Surface Tension Analyzer model DST 60 A. This measurement was equipped with ring and glass sample. Crude oil was inserted into the glass sample and the ring was adjusted and the analyzer was calibrated at the surface of crude oil. Water was inserted into the crude oil and the reading of interfacial tension perform was recorded. The ring used in this method must kept under perfectly clean and dust free conditions. It was cleaned by 70% ethanol and burnt with a blue flame from a Bunsen burner after every application. Droplet Size The droplet size distribution of emulsion was observed and determined using Carl Zeiss research microscope equipped with the digital camera and AxioVission AC image analysis software. The measurement of emulsion was performed without further dilution of emulsion. Approximately 3 images were randomly taken for each distribution and droplets were counted to obtain droplets size distribution.
66 81 Wax Appearance Temperature (WAT) The wax appearance temperature of crude oil was performed using Differential Scanning Calorimetry (DSC) apparatus. Before experiment, all the crude oils are thermally pre-treated; namely, the samples were heated to 80 o C for 2 hours in water bath with closed containers and shaken thoroughly to ensure complete dissolution of wax. Then the closed containers are left to cool to room temperature. A 4-8 mg thermally pre-treated crude oil specimen was then transferred into an aluminium crucible, which was then sealed and weighed. The apparatus was continuously flushed with nitrogen at 20 ml/min, and an empty crucible was held in the reference cell (Díaz-Ponce et al., 2010). Experiments were carried out by heating the crucible to 80 o C and keeping temperature for 1 minute then cooled at a cooling rate of 5 o C/min from 80 to -30 o C Chemical Characteristics Crude Oil Separation The procedures in separating asphaltenes and resins were modified from Ariany(2004) and followed procedure from ASTM D Crude oil was weighted about 100 g and hexane slowly added into the crude oil with ratio 1:10. The solution was stirred using magnetic stirrer and left in 6 hours to sediment precipitated. Two layers were observed. The solution was filtered using membrane filter paper (0.22 µm) at funnel filter. The precipitated was dried and evaporated at fumed hood. The precipitate contained asphaltenes and solid, was filtered and dried at room temperature. In order to separate asphaltene from solid, the dried precipitate was dissolved into toluene and centrifuged for 30 minutes at 3000 rpm. After supernatant liquid was separated from precipitate, the precipitated solids were rewashed with toluene until clear rewashed toluene flow. The asphaltene was acquired by evaporated the toluene of supernatant. The supernatant liquid was poured onto the silica gel. The mixture was shaken using mechanical shaker for 15 minutes at room temperature to ensure resins (absorbed fraction)
67 82 absorbed well onto the silica gel. The mixture was allowed stand for 30 minutes for sedimentation and followed by filtration process to separate oil and silica gel with absorbed fraction. After that, the mixture was dried by evaporating the solvent then the mixture dissolved with 7% methanol in dichloromethane to desorbed resins from silica. Lastly, the resins and clean silica was obtained after filtration and solvent evaporation. Crude Oil Ratio 1:10 Mixing Left for 6 hours Hexane Toluen e Solid Precipitate Washing Drying Precipitated (Asphaltenes Mixing Centrifuging Evaporating Silica+ Adsorbed Fraction Dissolved in 7% methanol in dichloromethane Filtration Supernatant (liquid) Mixing Sedimentation and Filtration Silica Gel Oil-wax +solvent (hexane) Evaporating Hexane Toluen Asphaltenes e Solvent (Methanol + dichloromethane) Adsorbed Fraction + Solvent Evaporating Resins Silica Gel Oil + wax Without active fraction Figure 4.3: Procedures for Recovering Asphaltenes and Resins Source: Ariany (2004)
68 83 Separation of Oil and Wax Precipitated From sedimentation and filtration steps in supernatant liquid, the balance of sedimentation was oil, wax and hexane. Meanwhile after filtration, the filtrate was silica with absorbed fraction as shown in Figure 4.4 (Nemirosvkaya et al., 2005). Hexane was evaporated in room temperature to ensure only oil and wax was left in further steps. The oil-wax sample was weighted and petroleum ether was added as ratio 1:7. The mixing process was done using glass rod to dissolve the sample. A 110mL of acetone was inserted into the dissolved sample and stirred using magnetic stirrer in 5 minutes to execute the homogenous sample. The samples were cooled in 2 hours at -20 o C in the freezer. The next process was filtration which the samples were filtrated (using Whatman no.1 filter paper) through a Buchner funnel (d=15 cm). The precipitated sample was wax crystal and supernatant liquid consisted of crude oil with solvent (acetone and petroleum ether). The precipitated was washed with wash solvent until clean solvent flowed and dried in room temperature was about 24 hours. The precipitated wax crystal was weighted each hour after 24 hours sample was dried to ensure the solvent was evaporated with ±0.001g from previous weighted crystal wax. Meanwhile for pure oil, the supernatant liquid was evaporated to obtain pure oil. Oil-wax sample 1:7 Mixing Mixing Petroleum ether Acetone 110 ml Freezing at -20 o C Wax crystal (precipitate) Drying Wax Filtration Supernatant (Liquid) Evaporating Non-volatile Oil Figure 4.4: Separation Wax Crystal from Crude Oil
69 84 Functional Group Analysis Fourier Transfer Infrared Spectrometer (FTIR) model Thermo Nicolet was used to analyse the content of various functional groups in main natural surfactant of crude oil which are asphaltenes and resins based on vibration of molecules. The sample was prepared and inserted into pellet beside KBr powder. This KBr powder was utilised as die set before recorded into FTIR spectrophotometer. The pellet was cleaned with acetone for each sample analysis. In infrared spectroscopy, IR was passed through the asphaltenes and resins. Infrared spectroscopy detects the vibration characteristics of chemical functional groups in a sample. When an infrared light interacts with the matter, chemical bonds will stretch, contract and bend. As a result, a chemical functional group tends to adsorb infrared radiation in a specific wavenumber (cm -1 ) range regardless of the structure of the rest of the molecule. Table 4.1 listed the assignment of absorption bands in the and cm -1 region of IR-spectra of the crude oil fractions. Table 4.1: Assignment of Absorption Bands of IR-Spectra of the Crude Oil Fractions Functional group Absorption band (cm -1 ) Ester Ketone Aldehyde Amide Aromatic 1600 Nitro Ether Sulfoxide Source: Midttun and Kvalheim (2001) Table 4.2 listed the types of hydrogen bonding presence in asphalatenes within cm -1 region of FTIR spectra.
70 85 Table 4.2: Assignment for Hydrogen Bonding in Asphaltenes Types of hydrogen bonding Wavenumber (cm -1 ) OH-п 3500 Self-associated OH 3370 OH-ether O 3300 Cyclic OH 3240 OH-N 3170 Source: Chen et al. (1998) 4.5 DEMULSIFICATION PROCEDURES The stable emulsion would be treated in demulsification part. The demulsification experiments were performed using both methods; conventional heating and microwave irradiation at 2450 MHz. using batch process. For conventional heating, chemical and hotplate were selected as method in comparing with microwave radiation method. The demulsification efficiency was evaluated by measuring the percentage of water separated from the emulsion as a function of time. The amount of separated water is the most appropriate measure of the emulsion stability of water-in crude oil (W/O) emulsions (Jiang et al., 2007) Microwave Oven Elba domestic microwave oven model: EMO 808 SS was used in heating crude oil emulsion samples (for batch heating process). The details of the Elba domestic microwave oven was: its power consumption is 230 V~50Hz, 1400 Watts (microwave), 230 V at 1000 Watts (Heater) and its rated power outlet is 900 Watts at operation frequency of 2450 MHz. The oven cavity dimensions are: 215 mm (H)*350 mm (W)* 330 mm (D), and oven capacity 23 Litres.
71 86 For the batch microwave heating process, the top and bottom of the sample container was covered with aluminium foil and was placed in the centre of the microwave. Three thermocouples were inserted in the emulsion samples at different locations; top, middle, and bottom, as shown in Figure 4.5 respectively. The emulsion samples were heated with microwave radiation at 2450 MHz for a different microwave exposure time. Temperature profiles of emulsions inside the cylindrical container during the batch microwave heating were recorded by Pico-TC-08 data logger. In the conventional heating, a hotplate was used for samples heating. Figure 4.5: Schematic Diagram for Elba Microwave Model: EMO 808 SS Conventional Methods Emulsion was prepared by compared two ratios; % W/O and % W/O emulsion. The chemical demulsifier was added into the emulsion at 1500 rpm in 30 seconds to perform homogenous solution. The effectiveness of demulsifier was evaluated by observing the percentage of water separation from gravity settling. The most effective demulsifier in screening part was then compared with others demulsification methods. In conventional heating method, the prepared emulsion was heated using hotplate in prescribed condition to compare with microwave heating method. Temperatures at surface
72 87 and bottom beaker were measured using thermometer. While for gravity settling, emulsion was prepared and separated by sedimentation. 4.6 DATA ANALYSIS The experiment was analysed by observation free water forms at the bottom of measuring cylinder and calculated as percentage water separation as shown in Equation 4.3. This is the best indicator in measuring stability of emulsion and used from previous researcher (Jiang et al., 2007). The amount of water separated or response of yield (%) was calculated as equation below:- Water separated (%) = volume of water (V), ml x 100 (4.3) Original volume of water (V o ), ml Each data collection would be performed in MATLAB (matrix laboratory) in plotting functions of data collection. 4.7 OPTIMISATION The results from the demulsification of microwave irradiation were used as the variable in optimising the formulation in order to produce the best results in breaking the prepared emulsion by using experimental design. An experimental design determined the effect of the independent variables on the dependent variable (response) which then the relation between them illustrated through a regression model. In this section, the software Design Expert (Trial Version 6.0.8, Stat-Ease Inc., Minneapolis, MN) was employed for experimental design, data analysis and modelling of experiment. The central composite design (CCD) of response surface methodology was used to obtain data that fits a full second order polynomial in five replicates at the centre of the design to allow for estimation the pure of sum squares (Wang et al., 2008).
73 The Method of Factorial Experiment There are many types of factorial experiment, but only 2 levels, i.e. the 2 k factorial experiments used in this study. As denoted 2 k, 2 refer to level and k is for variable investigated in the study. The method of factorial experiments has been design to allow the effects of a number of experimental variables on the yield to be investigated simultaneously. It gives the main effects and interaction effects of the changing its value from lower to higher level. The main effect of an experimental variable is defined as average of the effects of changing its value from the lower level to upper level among all the experiments. It is derived by assuming that the experimental variable is an independent variable and all the variations in its effect due to experimental errors only. The interactive effects between two or more experimental variables are calculated on the assumption that the experimental variables are not independent but in fact interacting between them. In this study two levels of factorial design were selected which 2 2 and 2 3 designs. These factorial design were selected depend on the sample used after screening processes. The 2 2 Design For this type, emulsion prepared in crude oil B was used which two variables involved between microwave power and time processing. The levels of each variable may be arbitrarily called as low and high (Montgomery, 2001). The treatment combinations can be displayed graphically as in Figure 4.6. The level of experiment variables in 2 2 factorial design is shown in Table 4.3 which x 1 donates microwave power and x 2 is time processing of microwave, respectively.
74 89 Figure 4.6: Central Composite Designs for Optimisation of 2 2 Factorial Design () Points of Factorial Design, (о) Axial Points and ( ) Central Point Source: Bezerra et al. (2008) In the experimental design, all variables were coded. Once the desired range of values for the variables are defined, they were coded to lie at ±1 for the factorial points, 0 for the center points and ± for the axial points. Table 4.3: Levels of the Experimental Variables in 2 2 Factorial Design Level of Experiment Variables Experiment variables = -1 = 0 = +1 units Power (x 1 ) Watt Time (x 2 ) min The 2 3 Design Supposing there were three variables for both screening emulsions (crude oil A and C) that are microwave power (x 1 ), time processing (x 2 ) and concentration of demulsifier (X 3 ). This design is known as 2 3 factorial design due to the number of variables involved (Montgomery, 2001). The treatment combinations can be displayed graphically as in Figure 4.7. The level of experiment variables in 2 3 factorial design is shown in Table 4.4.
75 90 Figure 4.7: Central Composite Designs for the Optimisation of 2 3 Factorial Design () Points of Factorial Design, (о) Axial Points and ( ) Central Point Source: Bezerra et al. (2008) Table 4.4: Levels of the Experimental Variables in 2 3 Factorial Design Level of Experiment Variables Experiment variables = -1 = 0 = +1 units power Watt time min concentration wt % Optimisation Using Response Surface Methodology (RSM) Respond surface methodology is a group of statistical techniques for empirical model building (Lenth, 2009). Usually the response surface model can be classified in firstorder or second-order polynomial. The first-order function will be used if the response is well modelled by a linear function of the independent variables. y o 1 x1 2x2... k xk (4.4)
76 91 If the model is curvature in the system, then equation below must be used for second and higher order level approximated:- y o k i1 x i i k i1 x ii 2 i i x x ij j i j i j (4.5) y represents the measured response and x i, the value of variables. o, i, and ij are the constants representing the intercept, coefficients of the first-order term and coefficients of second-order interaction terms and is the residual associated to the experiments, respectively Evaluating the Model The mathematical model found after fitting the function to the data sometimes not satisfactorily described the experimental domain studied. Thus, the model fitted was evaluated using the Analysis of Variance (ANOVA) obtained from Design of Expert (DOE). The analysis based on variance ratios to determine whether significant or not significant different exist among the means of observed parameters. The analysis has begun with the estimation the effect of each experimental variable and their two variables interaction by estimation the regression and standard error for each coefficient. The significance of each coefficient was determined using p-value. Another way to evaluate the model is the lack of fit (Bezerra et al., 2008). A model will be well fitted to the experimental data if it presents a significant regression and non-significant lack-of-fit. 4.8 SUMMARY Screening of the most stable emulsion is the most important test in this study. This test was run by using the well-known method, which is called emulsion stability test
77 92 assisted equipments depend on the types of emulsion rheology have been chosen and the most stable emulsion was performed through percentage of water separated. For the optimisation, parameters affected demulsification process in microwave was selected to locate the optimum point in enhancing the percentage of water separated. Crude oil A and C was used 2 3 factorial design while crude oil B occupied with 2 2 factorial design due to the results in demulsification using microwave irradiation.
78 93 CHAPTER 5 CRUDE OIL EMULSION STABILITY 5.1 INTRODUCTION For emulsion dispersion, which is not thermodynamically stable, the degree of emulsion stability is very important. Thus, knowledge of the emulsion stability was investigated closely before proceed with demulsification process. The stability of emulsion was first determined by observing the physical separation of water after emulsion was prepared and left in room in a certain time. Generally, greater separation phase separation indicates lower emulsion stability with shorter shelf life. 5.2 CHARACTERISTICS OF CRUDE OIL The stability of emulsion was investigated closely to the characteristic of crude oil. Determine physical and chemical properties of crude oil are essential to get better understanding of crude oil characteristics. The physical properties such as viscosity, shear stress, density and surface tension, as well as for chemical properties; weight percentage of asphaltenes, resins, solid particles and wax precipitated Physical Properties of Crude Oil Each crude oil has own complexity nature in characteristics and offers individual problems. The properties of crude oil is one of the crucial parts need to be studied to solve and better understanding of emulsion problems encountered in oil field. Comparison studies
79 94 among the crude oil were listed in Table 5.1.Results had shown that crude oil C was the heaviest and the lightest was crude oil B. Crude oil C acquired nearly density as crude oil A. The density of all the types of crude oil exhibit almost same density while crude oil C obtained the highest followed by crude oil A and B. This trend has good confirmation with Ariany (2004), which viscosity changes in small magnitude usually proportional to density change, whether caused by temperature or pressure. The different physical properties of crude oil are obviously showed from API density which strongly agreed that crude oil C is the heaviest crude oil. The crude oil ceased to flow when reached pour point due to excessive amount of wax crystal forming due to the build up of network wax crystal forming and the crude oil gels under static condition (Zhu, 2008). From Table 5.1, crude oil A obtained the lowest pour point (-20.4 o C) while crude oil C acquired the highest pour point (-12 o C) whereas the lower pour point would mean the gelling of oil in the wells will not be expected. This is supported by Pedersen and Rnningsen (2000) which the network of wax crystal build up was persuaded the value of pour point. As reported by Taraneh et al. (2008), the waxy crystal behaves as typical homogenous liquid at temperature above pour point and the amount of wax start to attain its saturation limit by forming a solid solution in the crude oil at temperature lower pour point. In contrast, temperature at which the dissolved solids are no longer completely soluble was measured using differential scanning calorimetry (DSC) as the onset temperature of the exothermal peak observed upon cooling and called as wax appearance temperature (WAT). Crude oil C, which presents the highest pour point, displays higher with sharp peak of exothermal (Appendix A). High WAT cause greater flow pressure and temperature drop, thus the WAT is good indicator of the pour point (Alghanduri et al., 2010). The properties of crude oil also investigated closely for surface tension analysis. From Table 5.1, crude oil C obtained the highest surface tension due to high viscosity of crude oil thus increase force attraction between molecules. Table 5.1: Physical Properties of Crude Oil
80 95 crude oil A crude oil B crude oil C viscosity (cp) at 25 o C density (g/cm 3 ) o API density pour point ( o C) Wax Appearance Temperature (WAT), o C Water content (%) Surface tension (m/nm) Chemical Properties of Crude Oil The composition of crude oil as explained in Chapter 4 shown in Table 5.2. Results explained that crude oil C obtained the highest asphaltenes content followed by crude oil A and B. From Auflem (2002) and Langevin et al. (2004), the asphalteness content can be a good indicator in emulsion stability since asphaltenes play an important part in emulsion stability. As postulated from El Gamal et al. (2005), at the interface, asphaltenes self assemble to produce rigid film thus make a barrier in coalescence. The presence of resin also persuade in the emulsion stability. However, high content of resin reduced the emulsion stability due to the interaction of resins with asphaltenic aggregates render the aggregates less interfacially active. Therefore, the ratio of resin to asphaltenes (R/A) can be an important factor to identify the emulsion stability. As increasing R/A ratio, the asphaltenes molecularly dissolved (Ali and Alqam, 2000; Mclean and Kilpatrick, 1997). Results indicate crude oil B less stable crude oil compared to others crude oil. In contrast, as studied the content of wax precipitated in the crude oil, crude oil C performed the higher content of wax followed by crude oil B and A. This was proven by studied of physical properties of crude oil which the higher wax crystal exhibited higher wax appearance temperature. Solid particles have both hydrophilic and hydrophobic regions, so it would be located at the oil-water interface. Therefore, the presence of solid particles at the interface
81 96 will enhance the stability of asphaltenes-resin film (El Gamal et al., 2005; Sullivan and Kilpatrick, 2002). Table 5.2: Chemical Properties of Crude Oil Oil Types of asphaltenes resin solid Wax crude oil (A) (R) nonvolatile volatile particles R/A crude oil A crude oil B crude oil C Infrared analysis informs the functional groups exist in asphaltenes for crude oil A, B and C as shown in Figure 5.1. Crude oil A, B and C indicate the presence of hydrocarbon bonded such as OH due to the presence of hydrogen bonding between OH groups and various hydrogen bonding acceptors such as ether oxygen and pyridinic nitrogen. Both asphaltenes and resin had shown same trend with the spectra of crude oil (Appendix A). As listed in Table 4.2 (in previous chapter) there were five types of hydrogen bonding existed in asphaltenes (Chen, 1998). Figure 5.1 shows the strongest absorption ~ 3300 cm -1 that OH-ether oxygen was the main hydrogen bonds in all types of crude oil studied. These types of crude oil also contained large amounts of water, characterised by the large broad band at 3400 cm -1. Hence, as postulated by Woods et al. (2004), the peak also is attributed to O-H or N-H stretching and associated hydrogen bonding. All crude oil also obtained peaks in the 2830 and 2850 cm -1 which corresponding to CH 2 and CH 3 group. The range of these peaks due to the CH bends for aliphatic group presented in asphaltenes. At~1600cm -1, the crude oil contain of aromatic groups. However this functional group indicates stronger peak in crude oil B compared to other crude oils. The stronger peak of aromatic performs lower asphaltenes (Hannisdal et al., 2005; Ariany, 2004).
82 Transmittance (%) 97 Wavenumber (cm -1 ) Figure 5.1: FTIR Spectra for Asphaltenes of Crude Oil A, B and C Resin is a component in crude oil that has dark colour in liquid or semisolid. The functional groups of resin are also indicated in crude oil A, B and C. Figure 5.2 displays the spectra of resin analyse using FTIR. The overall trend of spectra has similarity with asphaltenes because resin also has polar group. A comparison of the subtracted spectra of the each crude oil shows that crude oil A and B displayed the same trend. However, crude oil C presents the aldehydes group at cm -1 which this interest area different with both crude oil A and B. Aldehydes is part of aromatic group whereas the heavy crude oil presents high aromatic content. This is supported by Hannisdal (2005) who studied the relation of aromatic groups in crude oil. Meanwhile, aromatic compound also rest in range cm -1 the peaks on figure show that each crude oil resin have similar aromatics compound.
83 Transmittance (%) 98 Wavenumber (cm -1 ) Figure 5.2: FTIR Spectra for Resin of Crude Oil A, Crude Oil B and Crude Oil C 5.3 STABILITY CHARACTERISTICS OF CRUDE OIL EMULSION The stability of emulsion is main element of water-in-oil (W/O) emulsion. The characteristics of emulsion are investigated closely to better understand the effect of parameters such as surfactant, stirring intensity, droplets size and volume fraction on emulsion stability Effect of Surfactant Types on Stability of Emulsion Emulsion was prepared at different surfactants to discover the most stable emulsion as problems encountered in industry. The most important task in preparation of emulsions is the selection of suitable surfactant which will satisfactorily emulsify the chosen ingredients at a given temperature. It has long been recognized that with a homologous series of surfactants, there is a relation between the contributions of the polar hydrophilic
84 99 head and the nonpolar lipophilic tail which related to the polarity of surfactant (Chen and Tao, 2005). Figure 5.3 shows various types of surfactants were compared to investigate the most stable emulsion performed in crude oil B. Span 83 (HLB=3.7) which is non-ionic group oil soluble executed the most stable emulsion compared to other types of surfactant. As studied by Opawale and Burgess (1998), who are investigated the rheological properties of sorbitan fatty acid ester (Span) at water-oil interface, the sorbitan fatty acid ester (Span) is typically used in preparing W/O emulsion. As observed until 180 minutes, there was no separation occurring by using Span 83. Span 83 adsorbed onto surfaces with hydrophobic group oriented toward the surfaces and making it more hydrophilic. This surfactant dissolved in the crude oil as continuous phase, essentially non-polar in nature as compared to water, the dispersed phase (water) in crude oil becomes covered with a single layer of surfactant molecules and increased dissimilarity between droplets. By increasing dissimilarity between two droplets, avoided droplets from coalesce and made system become stable. As compared to the other types of surfactant, Tween 80 is non-ionic group and water-soluble obtained the highest percentage of water separation (60 % after 60 minutes) followed by Triton X-100 and SDDS. Triton X-100 (HLB= 13.5) same group as Tween 80 (15.0) with but Triton X-100 most soluble in water and miscible in most polar organic solvents & aromatic hydrocarbons (Hait and Moulik, 2001). However within 180 minutes, the percentage of water separated in the crude oil was only 56 % within 180 minutes by gravitational settling. SDDS from anionic group obtained the higher percentage of water separated compared with emulsion prepared in Span 83 due to the properties of surfactant which an anionic group. From Chern and Lin (1996), this types of surfactant can impart repulsive forces between similarity charged electric double layer to the particles of natural surfactant i.e. asphaltenes and resin.
85 Water Separated (%) Span 83 SDDS Triton X-100 Tween Time (min) Figure 5.3: Effects of Types of Surfactant on W/O Emulsion Stability (Experimental Condition: Stirring Intensity = 1500 rpm; Processing Time=5 minutes) Effect of Stirring Intensity (rpm) on Emulsion Stability The stability of emulsion is also affected by stirring intensity. During emulsification, interfacial area between two phases increase, therefore mechanical energy is required to minimise the interfacial area and proceed with emulsification. The larger excess of energy required to produce small droplets size using very intense agitation thus makes a barrier of droplets to coalesce. The break-up of droplets depends strongly on the type and intensity of the flow which is determined by the rotational speed and geometry of the agitator (Hannisdal, 2005). Figure 5.4 examines the effect of viscosity for crude oil A, B and C in % W/O and % W/O emulsion as varied stirring intensity. From figures, higher ratio (50-50 % W/O emulsion) has higher viscosity because the main attribution to the viscosity in emulsion system is dispersed droplets (Urdahl et al., 1997). When droplets are introduced, the flow system becomes distorted; hence the energy dissipation is increased. This increment energy will lead to an increase in the viscosity of emulsion. For % W/O emulsion, crude oil C showed there was significantly increasing of viscosity. In contrast,
86 Viscosity (cp) Viscosity (cp) 101 crude oil A and B show only slightly increasing and at 1500 rpm, emulsion prepared from crude oil A and B began to form stable emulsion. This trend of results also can be determined at lower ratio (20-80 % W/O emulsion) crude oil A crude oil B crude oil C Stirring Intensity (rpm) (a) crude oil A crude oil B crude oil C Stirring Intensity (rpm) (b) Figure 5.4: Viscosity Effect at Varied Stirring Intensity (a) % W/O (b) % W/O Emulsion Further study of stirring intensity on water separated only could be observed in crude oil B due to the properties of crude oil and after screening, crude oil A and C do not separated through observation until 5 days. The percentage of water separated observed in
87 Water Separated (%) 102 varied stirring intensity shown in Figure 5.5. Emulsion was processed at 5 minutes for each mixing speed and using Span 83 as selected surfactant. Results acquired that higher stirring intensity indicated more stable emulsion by observing the percentage of water separation. At 500 rpm, after 15 minutes, the water resolved was 65 % as compared to 1500 rpm which only achieved 5%. At lower stirring intensity, the surfactant does not well mixed with the crude oil (not homogenous). Thus, the surfactant do not covered the droplets significantly and rigid film do not formed. However, for the higher stirring intensity, the effectiveness of surfactant to adsorb onto the droplets was increased. At higher stirring intensity, example for this study, the maximum speed has been studied was 2000 rpm, the surfactant and crude oil mixed well and the amphiphilic in the surfactant and play their parts very well and adsorbed onto the droplets rpm rpm rpm 2000 rpm Time (hrs) Figure 5.5: Effect of Stirring Intensity on Emulsification In addition, the agitation speed also persuaded the diameter of droplets and provided information on the efficiency of emulsification process. Figure 5.6 demonstrates the mean of droplets diameter, d at varied phase ratio for crude oil B where the size of droplets (mean) is inversely proportional with stirring intensity. Both phases ratio showed high discrepancy for droplets mean diameter and viscosity where % W/O emulsion obtained higher diameter and viscosity compared to % W/O emulsion. For %
88 Mean Droplets Diameter (µm) 103 W/O emulsion, the droplets mean diameter decrease significantly until 1500 rpm and slightly decreased at 2000 rpm while % W/O emulsion, there was slightly decreased of droplets mean diameter within 1500 rpm and droplets decreased drastically at 2000 rpm. The intersection of mean droplet diameter for % and % W/O emulsion can be explained due to the stability of emulsion. Emulsion at this stirring intensity was believed began to form a stable emulsion and after this stirring intensity the emulsion took a long time to separate after left in room temperature. The higher stirring intensity also providing the two-phase-oil-water system which more energy can generate drastic shear strength as consequence leading to the water droplets being small % W/O emulsion % W/O emulsion Stirring Intensity (rpm) Figure 5.6: Mean of Droplet Diameter (µm) within 500 to 2000 rpm of Stirring Intensity Effect of Temperature on Emulsion Stability Temperature often has an indirect factor that affects the emulsion stability as results of altering the interfacial tension and viscosity of emulsion. The effect of temperature was examined at % W/O and % W/O emulsion. For both ratios,
89 104 viscosity of W/O emulsion is strongly augmented by decreasing temperature. According to the ideal Stoke s Law for the creaming rate of emulsion, the gravitational instability rate of emulsion is directly proportional with density different of continuous and dispersed phases (ρ o - ρ w ) v gd ( ) 2 O w m 18o (5.1) If viscosity, µ o (cp) is lower, the density different of continuous and dispersed phases increased. Thus, lead the higher velocity of droplets, v m. As temperature increased, the movement of droplets (velocity) also higher therefore enhance the droplets to coalescence. Figure 5.7 (a) and (b) show decreasing of viscosity as augmented temperature. However for crude oil B, at 90 o C the deformability limit for the droplets is over and the viscosity abruptly increased. The drastic increasing of viscosity in crude oil B is believed because of the phase inversion occurs from W/O to O/W emulsion. Temperature is one of factor changing the surfactant hydrophile-lipophile balance (HLB) in systematically varied from predominantly oil-soluble to water soluble. At lower temperature, Span 83 is mainly soluble in oil phase and as temperature increased to 90 o C (crude oil B), the surfactant is preferentially soluble in water phase. Crude oil B obtained the lower viscosity compared to crude oil A and C. At inversion point, the interfacial tension decreases favour the breaking process thus, produced smaller droplets size and associated higher viscosity.
90 Viscosity (cp) Viscosity (cp) crude oil A crude oil B crude oil C Temperature ( o C) (a) crude oil A crude oil B crude oil C Temperature ( o C) (b) Figure 5.7: Effect of Temperature on Emulsion Stability at (a) % W/O and (b) % W/O Emulsion Figure 5.8 illustrates the effects of mean droplets size diameter as increasing temperature when prepared at 1500 rpm for % W/O and % W/O emulsion. The emulsion with higher ratio shows bigger in mean of droplets size compared to lower ratio
91 Emulsion Droplets Size (µm) 106 with increasing temperature as decipted in Figure 5.8. This results was discussed in previous figure (Figure 5.6) which at 1500 rpm, the mean droplet size has intersaction of % and % W/O emulsion. This is expected since higher ratio obtained the emulsion become more viscous thus reduce the interaction among droplets. However for % W/O emulsion observed there was drastically decreasing for mean of droplets size from 27 m to 7.5 m at 90 o C. This results explained the study was proven by Rusli (2007), which the decreasing droplet size at higher temperature because of viscosity have no longer effects to temperature. As droplets size increased, the specific surface area of oil/water interface increased thus resulting strong interaction between them. The emulsion which have relatively large droplet size (>10 µm), the relative temperature is independent of the droplet size. As temperature increased, the viscosity decreased thus the viscosity of emulsion is no longer independent factor. This result is correlated with Zaki (1997) which, at higher droplet size, the hydrodynamic forces (hardsphere interaction) are dominant. While for smaller droplet size (<10 µm), the colloidal surfaces and Brownian motion can be dominant % W/O emulsion % W/O emulsion Temperature ( o C) Figure 5.8: Effect of Mean Droplet Diameter (µm) in Increasing Temperature 5.4 OTHER FACTORS CONTROLLING EMULSION STABILITY
92 Rheological Properties of W/O Emulsions of Different Dispersed Volume Fractions The discussion of rheology has deal with the deformability and flow properties which related to the viscosity of emulsion. Volume fraction of dispersed (water) phase is varied from lower (10-90 % W/O) until % W/O emulsion to identify the effect of volume fraction of dispersed phase on emulsion stability. Effects on Viscosity As stated in literature part, viscosity can be though as resistance of fluid to flow. The affecting factors are numerous and viscosity is one of the expected. If the internal phase in an emulsion has a sufficiently high volume fraction, the emulsion viscosity increased due to droplet crowding or structural viscosity become non-newtonian until achieved to the critical volume fraction. This expected result is proven by investigated the effects of viscosity when changing the volume fraction of emulsion. The effects of volume fraction and maximum volume fraction on viscosity are described using the Krieger-Dougherty equation:- 2 1 c (5.2) m Where η is viscosity of emulsion; η c represents the viscosity of continuous phase (based on this study, crude oil is continuous phase); Φ is phase volume of dispersed phase and Φ m denotes the maximum phase volume. Effect of the viscosity on the volume fraction is shown in Figure 5.9 for all types of crude oil used in this study. At low volume fraction (~0.15), the viscosity increased linearly but as the volume fraction increased the viscosity increased steeper. However, when the
93 Viscosity (cp) 108 droplets are closed enough and exceed the limitation, the viscosity decreased drastically due to changing the phase inversion of emulsion to oil-in-water. From Figure 5.9, the critical volume fraction point for crude oil A, B and C are 0.5, 0.6 and 0.68, respectively. This results is supported by Tadros (2009) which, random packing droplets might start being in contact at a lower volume fraction. Earlier assumptions of phase inversion were based on packing parameters. When volume fraction exceeds of maximum packing (~ 0.64 for random packing and ~0.74 for hexagonal packing of monodisperse), critical point of volume fraction reached. However, these assumptions are not adequate because there are still emulsion invert at volume fraction values below than the maximum packing crude oil A crude oil B crude oil C Volume Fraction Figure 5.9: An Influence of Phase Volume Fraction on the Emulsion Type and Viscosity Effect of Interfacial Tension Surface tension is a measure of the force at a boundary between condenses and gas phase. If these attractive forces are between two immiscible liquids, which boundary
94 109 between two condensed phases, like oil and water, they are referred to as interfacial tension. The interfacial tension of crude oil are important because they are also indicative the ease of formation and emulsion stability. Figure 5.10, the overall trend of graph shows that the interfacial tensions increased with density and drastically decrease as density is further increasing. Emulsion prepared in crude oil A and C demonstrated there are linear increasing of interfacial tension within density and 0.92 g/ml and linearly decrease within 0.94 g/ml. Also, as can be seen from Figure 5.10, in crude oil B, two peaks are obtained before interfacial tension drastically decreases at g/ml. The increasing density of emulsion has correlation with volume fraction which emulsion has changing from a simple viscous solid at low volume fraction to an elastic solid having a substantial shear modulus at higher volume fraction. Also, this elasticity results from work done against interfacial tension to create additional droplet surface area when the shear further deforms the compressed droplets. Thus, the definition from Bancroft (1912) could be applied whereas the water acted as continuous phase due to the surfactant more soluble in water. From Rosen (2004), the changing of W/O to O/W emulsion as increasing volume fraction due to the interfacial tension between the hydrophilic ends of the surfactant molecules with water phase and oil phase molecules. For W/O emulsion, the waterhydrophilic end tension was greater causing the film to be concave toward water. However, as droplets increased until reached a critical amount, the oil-hydrophobic end tension was greater causing the film toward the oil, resulting in the enclosure of the oil by the water.
95 Interfacial Tension (mn/m) crude oil A crude oil B crude oil C Density (g/ml) Figure 5.10: Interfacial Tension Effect of Emulsion by Varied Density Effects of Shear Stress and Shear Rate The shear stress versus shear rate profile is presented in Figure The rheological behaviour of an emulsion may be either Newtonian or non-newtonian depending upon its ratio. When shear stress is applied, Newtonian liquid flows as long as stress is applied even after stress is removed (McClements, 2005). Figure 5.11(a) and (b) show the shear stress is no longer linear as increasing the dispersed phase ratio which at % W/O emulsion, a straight line graph observed from shear stress versus shear rate. While as increased the dispersed phase ratio, crude oil B and C obtained non-newtonian behaviour. As proposed from Chhabra, (2007) and Lee et al. (1997), as increasing dispersed phase ratio, the emulsion behaviour more on non-newtonian due to the alteration of rheological properties of fluid flow condition. However, at % W/O emulsion for crude oil A, the emulsion follows Newtonian behaviour which as shear stress is applied, the crude oil is flow continuously. This is due to the wax appearance temperature (WAT) of crude oil higher (4.44 o C) compared to others crude oils. Above the WAT, wax crystal
96 Shear Stress (d/cm 2 ) Shear Stress (d/cm 2 ) 111 dissolved although chemically very complex crude oil and performed a simple Newtonian fluid (Li and Zhang, 2003) crude oil A crude oil B crude oil C Shear Rate, dv/dy (1/sec) (a) crude oil A crude oil B crude oil C Shear Rate, dv/dy (1/sec) (b) Figure 5.11: Effect of Shear Stress on Shear Rate with Varied Phase Ratio (a) % W/O (b) % W/O Emulsion
97 Shear Stress (d/cm 2 ) 112 The crude oil A was investigated closely by increasing the phase ratio of watercrude oil to % W/O and % W/O emulsion as shown in Figure As increasing the phase ratio, the emulsion behaviour as pseudoplastic which emulsion was stretched and alignment while being sheared due to increasing the droplet content into the crude oil. This result verified that higher phase ratio required from crude oil A to behave as non-newtonian due to the content of wax-precipitated in crude oil A was lower than crude oil C and B % W/O emulsion % W/O emulsion Shear Rate, dv/dy (1/sec) Figure 5.12: Effect of Shear Stress on Shear Rate in Crude Oil A by Increased the Ratio The effect of phase ratio in examining the emulsion behaviour was confirmed by plotting apparent viscosity versus shear rate as shown in Figure At higher phase ratio, the apparent viscosity of crude oil B and C clearly decreased as increasing shear rate thus verified the emulsion pursued pseudoplatic behaviour. The gradual break-up of interparticles structure may be primarily responsible for this behaviour. While, crude oil A obtained a slightly decreased of apparent viscosity at lower shear rate and begun to be constant at higher shear rate.
98 Apparent Viscosity Apparent Viscosity 113 However, at lower phase ratio, all the crude oil confirmed act as Newtonian behaviour whereas the apparent viscosity is independent with shear rate because the flocculation of droplets does not take place due to the amount of droplets present in the emulsion was smaller crude oil A crude oil B crude oil C Shear Rate (1/sec) (a) crude oil A crude oil B crude oil C Shear Rate, dv/dy (1/sec) (b) Figure 5.13: Shear Rate Dependence on Viscosity of Emulsion with Varied Phase Ratio (a) % W/O Emulsion (b) % W/O Emulsion
99 Apparent Viscosity 114 Crude oil A was further investigated in behaviour of emulsion by increased phase ratio to % W/O and % W/O emulsion. The results display in Figure 5.14 was showed that the apparent viscosity decreased as increasing shear rate. Emulsion in both ratios exhibited non-newtonian behaviour due to trend of graph obtained. This was supported the discussion of shear stress against shear rate at same ratios in crude oil A % W/O emulsion % W/O emulsion Shear Rate, dv/dy (1/sec) Figure 5.14: Effect of Apparent Viscosity on Shear Rate in Crude Oil A at % and % W/O emulsion 5.5 SUMMARY The overall stability of emulsion was influenced by the characteristics of crude oil itself. The heavy crude oil obtained the higher percentage of asphaltenes and waxprecipitated thus enhance the non-newtonian behaviour as increased the volume fraction of emulsion. Thus, from this study, crude oil C acquired the heaviest crude oil, followed by crude oil A and B. The rheological of emulsion plays an important role in the phase inversion of emulsion from water-in-oil (W/O) to oil-in-water (O/W).
100 115 CHAPTER 6 MICROWAVE DEMULSIFICATION STUDY ON WATER-IN OIL (W/O) EMULSION 6.1 INTRODUCTION The types and mechanisms of demulsification process as reviewed in section 2.9 for the overall demulsification methods (Chapter 2) and details of microwave demulsification was discussed in Chapter 3. Chapter 5 was mainly concerned with the problems involved in the production, formation and stabilisation of water-in-oil (W/O) emulsions. This chapter on the other hand, focuses on reducing the stability of existing emulsions, i.e., demulsification or emulsion breaking. This chapter presents and analyses results of an alternative of cost effective technology of high frequency energy separation of crude oil emulsions via microwave field irradiation in comparison with the conventional breaking methods. 6.2 EXPERIMENTAL RESULTS FOR MICROWAVE IRRADIATION Experiments were carried out using water and crude oils in microwave irradiation. It can be seen in Figure 6.1, water obtained higher temperature compared to crude oil because water has dipole moments thus more rapid temperature can be arises. However at 80 sec (T= 105 o C), temperature rise for water began to constant because temperature rise in water is more uniform than oil since more convective mechanisms existence in water.
101 77 Water is becoming a vapour but, temperature of crude oil is increasing. Temperature difference of water and crude oil are explained by polarisation. The temperature in crude oil B and C show higher increasing compared to crude oil A due to the content of wax precipitated in the crude oil. Wax is non-polar, thus in crude oil A the efficiency of crude oil in microwave is reduced thus correlated also with the temperature rise. By comparing crude oil B and C, it shows that crude oil C which exhibited highest asphaltenes content acquired the highest temperature rise between the others crude oil. This trend was first detected by Gunal and Islam (2000) who mentioned that under the influence of microwave irradiation, the temperature rise increases due to the greater impact at higher concentration values of asphaltenes. The heating rate was calculated by divided temperature increasing with microwave radiation time. Results in Figure 6.1b show that the correlation of heating rate was inversely proportional with radiation. This is expected since the dielectric loss to the wall is small. The average of heating rate in water, crude oil A, B and C were 0.867, 0.218, and o C/sec. At early stage in microwave irradiation, crude oil B obtained the higher heating rate compared with crude oil C. However, as time increased the heating rate of crude oil B is reduced than crude oil C. This unstable heating in crude oil B obtained due to the properties of crude oil B itself was lighter than crude oil C. Al-Ayed (2009) has studied the contribution of heavy component into heating rate which heating rate higher at lower viscosity of crude oil and can be clarified as smaller heavy component.
102 Temperature ( o C) Temperature ( o C) water crude oil A crude oil B crude oil C Radiation Time (sec) (a) water crude oil A crude oil B crude oil C Radiation Time (sec) (b) Figure 6.1: Temperature (a) and Heating Rate (b) as Function Microwave Radiation Time by Comparing Water with Crude Oils
103 Temperature ( o C) EFFECT OF WATER-OIL RATIO ON TEMPERATURE DISTRIBUTON The heaviest crude oil, which crude oil C was further investigated in temperature distribution under microwave irradiation. Figure 6.2 shows that increasing ratio of water-oil phase caused the temperature distribution increased % W/O emulsion performed the lowest temperature increased within 220 seconds; the maximum temperature achieved was o C. In contrast, for higher ratio, at 220 seconds, temperature distribution could be higher as 120 o C for % W/O emulsion and 106 o C for % W/O emulsion. This was due to the content of dispersed phase was lesser than % W/O and % W/O emulsion. However, the temperature distribution of % W/O has same trend with % W/O emulsion due to rapid heating at higher phase ratio. The average temperature distribution for % W/O, % W/O and % W/O emulsion were 61.67, and o C. Thus, as phase ratio increased more readily microwave irradiation is absorbed and higher temperature is obtained % W/O emulsion % W/O emulsion % W/O emulsion Radiation Time (sec) Figure 6.2: Effect of Temperature Distribution at Varied Phase Ratio
104 Percentage of Water Separated (%) EFFECT OF MICROWAVE POWER ON W/O EMULSION The effectiveness of microwave power was first determined by observing the physical phase separation which the higher percentage of water separated indicates the most effective microwave power in demulsified emulsion. Figure 6.3 presents the efficiency of water-oil separation by varying microwave power. Increasing microwave power up to 720 W (96 %) causes a substantial efficiency in phase separation. After that, the phase separation decreased to 80 % within 60 minutes. As microwave power increased, the percentage of water separated increases due to high dielectric properties. However, from Figure 6.3, at 900 W the percentage of water separated decreased because emulsion from crude oil A and C contained higher natural surfactant thus at higher power, temperature increases rapidly and thermal heating arises W 540 W 720 W 900 W Time (min) Figure 6.3: Microwave Power Effect on Water Separation The effects of microwave power with radiation time was examined and results shown in Figure 6.4. Microwave power significantly influences the rate of temperature rise. When the emulsion was exposed to 900 W, the average heating rate is approximately
105 Heating Rate ( o C/sec) o C/sec. The average heating rate decreased as microwave power decreased. With an increment microwave power from 360 W to 900 W, the heating reached o C/sec and o C/sec respectively with the same exposure time. For higher microwave power, the temperature is greater near the top surface and locally high inside the layer. Furthermore, this is evident that there has correlation between heating rate and microwave power. The increasing of heating rates with microwave power is caused by increasing the absorption of microwave energy because the power absorbed increases with the square of the internal electric intensity. The relation between microwave power dissipated absorbed by a material with dielectric field electric intensity has been given in Equation 6.1:- P o '' f E E (6.1) where P is microwave power dissipated per unit volume, E is electrical field intensity and is electrical conductivity. This relationship shows that the energy dissipation is proportional to the electrical conductivity W W 540 W 360 W Radiation Time (sec) Figure 6.4: Heating Rate in Microwave Power with Variation Time
106 Wavelength (cm) Penetration Depth (cm) 82 The effect of wavelength, and penetration depth, D p at varied microwave power from 360 W to 900 W were investigated within radiation time as shown in Figure 6.5. From Figure 6.5, at high microwave power, 900 W, both wavelength and penetration depth were increased and their values were found to be 2.25 cm and cm, respectively. Both wavelength and penetration depth significantly increased at 360 to 540 W and at higher microwave power, the wavelength and penetration depth showed slightly increasing because of more intense electromagnetic inside the molecules. At higher microwave power, waves can transmit through the water layer rapidly thereby less amount of waves loss at the wall of the sample s beaker due to the decreasing of dielectric constant. The decreasing in dielectric constant is attributed to the higher temperature within the water layer since the electromagnetic field is more intense Micowave Power (W) Figure 6.5: Wavelength (cm) and Penetration Depth (cm) Affected within 360 W to 900 W in Microwave Power
107 SEPARATION OF WATER FROM EMULSIONS Comparison between Microwave Irradiation and Conventional Methods The comparison of conventional and microwave demulsification methods were reflected in Figure 6.6 and 6.7. The figures illustrated that at crude oil B, the microwave demulsification offered rapid separation compared to conventional methods, whereas the emulsion was totally demulsified within 30 hours in microwave irradiation compared to chemical demulsifier was separated entirely in 100 hours. This was because of microwave quickly heat emulsion, huge temperature rises and reducing the viscosity of continuous phase, thus favouring the contact among water droplets and coalesce the droplets. Besides, microwave is non-destructive method on emulsion, do not required addition of chemical agents, which do not implies for further waste water treatment (Rajakovic and Skala; 2006). The percentage of water separation for both conventional and microwave method was higher at % W/O emulsion. As mentioned in stability part, at higher phase ratio, the droplets tends to interact each other and agglomerate thus perform coalesce. However for both ratios, emulsions could not be treated by using gravity settling due to the high stability of emulsion. As expected, the demulsification efficiency for each crude oil decreases from lighter to heavy crude oil emulsions as a consequence of the higher stability of the emulsion because of the higher content of asphaltenes and resins in the crude oil, ultimately the higher viscosity. The time required for crude oil A and C for demulsification process is relatively long which within 20 to 40 hours. However, the other researches performed the chemical demulsification of W/O emulsion in a few minutes to one hour (Zhang et al., 2005; Kim et al., 1995). Most of the chemical demulsification studies described in papers have been conducted using lower asphaltenes fraction in which emulsion stability relatively lower than this study.
108 Water Separated (%) Water Separated (%) gravity settling hotplate chemical demulsifier microwave Time (hrs) (a) gravity settling hotplate chemical demulsifier microwave Time (hrs) (b)
109 Water Separated (%) Water Separated (%) gravity settling hotplate chemical demulsifier microwave Time (hrs) (c) Figure 6.6: Comparison of Conventional and Microwave Methods in Demulsified W/O Emulsion for % W/O Emulsion (a) Crude Oil A (b) Crude Oil B (c) Crude Oil C gravity settling hotplate chemical demulsifier microwave Time (hrs) (a)
110 Water Separated (%) Water Separated (%) gravity settling hotplate chemical demulsifier microwave Time (hrs) (b) gravity settling hotplate chemical demulsifier 4th degree microwave Time (hrs) (c) Figure 6.7: Comparison of Conventional and Microwave Methods in Demulsified W/O Emulsion for % W/O Emulsion (a) Crude Oil A (b) Crude Oil B (c) Crude Oil C
111 87 Yang et al. (2009) and Xia et al. (2004) have reported that microwave irradiation can accelerate the efficiency of W/O emulsion separation without use the additives. However, in this study, crude oil A and C could not be broken using microwave irradiation alone. For these emulsions, it was necessary to add a demulsifier agent before microwave irradiation. Thus, for crude oil A and C, demulsifier was added into the emulsion and results presented in Figure 6.8. As shown in figure, the demulsification efficiency increased by assisted of demulsifier under experimental conditions, having been irradiated for 3 minutes at 720 W. For both crude oil, the percentage of water separated increased within 60 minutes and crude oil A obtained higher efficiency in separation compared to crude oil C due to the lower viscosity in crude oil properties. This could be proven by observing from Figure 6.8 which, in 5 minutes crude oil A for % W/O emulsion clearly separated about 48 %. However for % W/O emulsion, flocculation was observed in 64 %. While within 60 minutes, the percentage of water separated increased up to 88 % and 70 % for % W/O and % W/O emulsion. Figure 6.9 also demonstrates the phase separation of crude oil C for % W/O and % W/O emulsion. Both ratios showed the flocculation occurred after 5 minutes of crude oil being irradiated whereas emulsion do not totally separated. In Figure 6.8, crude oil C at % W/O emulsion separated about 65 % within 60 minutes and for % W/O emulsion, the percentage of water separated is 40 %. Crude oil A and C acquired the percentage of water separated in emulsion increased as phase ratio increases. This was due to the acceleration of demulsifier through emulsion before irradiated in microwave irradiation. Still, these results were contrasted with previous researcher (Guzmán-Lucero et al., 2010), who studied. the effect of demulsifier in microwave effect which 95% of water could be removed within 30 minutes due to the dissimilarity natural surface active presented whereas about 15 wt%, two times smaller than this study.
 Figure 6.8: Demulsification Efficiency in Microwave Irradiation during 60 Minutes for Crude Oil A and C with addition 0.")
112 Percentage of Water Separated (%) crude oil A, % W/O crude oil C, % W/O crude oil A, % W/O crude oil C, % W/O Time (min) Figure 6.8: Demulsification Efficiency in Microwave Irradiation during 60 Minutes for Crude Oil A and C with addition 0.1% of Demulsifier (a)
 50-50 % W/O Emulsion (b) 20-80 % W/O Emulsion within 5 minutes Observing the Phase Separation 6.")
113 89 (b) Figure 6.9: Photography of Emulsion after Irradiation in 3 minutes for Crude Oil A and C with 0.1 % Demulsifier at (a) % W/O Emulsion (b) % W/O Emulsion within 5 minutes Observing the Phase Separation 6.6 COMPARISON BETWEEN MICROWAVE IRRADIATION AND CONVENTIONAL HEATING The fundamental in different method of transferring energy from the source to the sample is the main benefit of utilizing the microwave irradiation compared to conventional heating processing. The energy delivered to microwave-absorbing materials is directly penetrated into the sample. The delivering energy generates heat by collisions dipole moment molecules in the emulsion. Thus, the viscosities of microwave and conventional heating can be examined due to the heat transfer mechanisms from both methods. The viscosities of conventional and microwave irradiation for % W/O and % W/O emulsion were shown in Figure Both ratios showed the lowest viscosity obtained once the emulsion was demulsified in microwave irradiation. Indeed, the percentage of viscosity for % W/O emulsion in both before and after demulsified in microwave irradiation were higher than conventional method for crude oils A, B and C were 87.3, 91.4 and 89 % while for conventional, the percentage decreasing viscosity in crude oil A, B and C were 7.64, and 20.4 %. This was because of the mechanisms of heating emulsion in both methods was different. In conventional heating, heat was applied
114 viscosity (cp) Viscosity (cp) 90 to the surface of body, stimulating the outside molecules or atoms. The kinetic energy is gradually transferred to the inside molecules or atoms until the whole body is heated. While microwave irradiation allows volumetric heating of samples by penetrated the electromagnetic wave (Mutyala et al., 2010). The lower ratio (20-80 % W/O emulsion) also displayed the same result which, viscosity of emulsion was reduced after demulsified in microwave irradiation. However, the decreasing viscosity was lesser than higher ratio because of the content of droplets in % W/O emulsion was lower than % W/O emulsion. The effect of viscosity was related to temperature. At lower phase ratio, the continuous phase content was dominant thus temperature cannot distribute easily through the whole body of sample in conventional heating. In microwave irradiation, the lower phase ratio reduce the efficiency of electromagnetic to heat emulsion which water only was selected and has ability to absorb electromagnetic field crude oil A crude oil B crude oil C before MW CH (a)
115 viscosity(cp) Viscosity (cp) crude oil A crude oil B crude oil C 50 0 before MW CH (b) Figure 6.10: Effect of Viscosity by Comparison Microwave (MW) and Conventional Heating (CH) (a) % W/O Emulsion (b) % W/O Emulsion The droplets size distribution of the crude oils before and after demulsified the emulsion were illustrated in Figure 6.11 and Figure 6.11 indicates the scatter of droplets size in crude oil B higher compared to crude oil A and C due to the lower viscosity of crude oil thus droplets can interact each other easily compared to crude oil A and C. While when compared the crude oil A and C, crude oil C illustrated non-statistical distribution due to the sedimentation and weak interaction between the droplets. This figure supported the crude oil characteristics studied and discussed in Chapter 5. The droplets size distribution can be concluded generally become much tighter as the droplets size is increased.
116 92 (a) (b) (c) Figure 6.11: Microscope Image of an Emulsion in Crude Oil A, B and C before Demulsified in Microwave After emulsions were demulsified in microwave irradiation, the droplets literally high and scattered far away from each other and the droplet size distribution quite uniform. The quite long distance between droplets existed in crude oil B. However, the size distribution in crude oil A and C do not display high scattered of droplets because of the high viscosity of the crude oil itself and this was reason for the lower separating of emulsion even demulsified in microwave. (a) (b) (c) Figure 6.12: Microscope Image of an Emulsion in Crude Oil A, B and C after Demulsified in Microwave The effectiveness of microwave irradiation was also determined by observing the droplets diameter of emulsion. According to Figure 6.13, the emulsion droplets were dependent on the effectiveness of demulsification process in microwave irradiation. As discussed previously, the emulsion do not separated in microwave irradiation and
117 Frequency (%) 93 demulsifier was added to enhance the separation process. This happens to all emulsions except the emulsion prepared from crude oil B. Figure 6.13 showed the droplets diameter before demulsified in microwave irradiation whereas emulsion in crude oil A and C obtained 6.59 and 5.04 m smaller than three times emulsion prepared in crude oil B (18.59 m). The droplets diameter increases after demulsified in microwave irradiation as postulated from Holtze et al. (2006), the heating increases with droplets size diameter. The droplets diameter of emulsion increases after demulsified (Figure 6.14) in microwave heating which for crude oil A, the mean droplets increase up to 12.1 µm. While for crude oil B, the mean droplets diameter showed there was a slightly increasing about 19.5 µm due to the droplets are expected coalescence each other and only small droplets can be observed through microscope using 10x resolutions. Indeed, when studied the distribution of droplets, emulsion in crude oil B obtained a uniform distribution compared before demulsified emulsion due to the volumetric heating arises in microwave irradiation. From figure, the droplets diameter from crude oil C cannot be examined because emulsion still viscous and accumulate each other thus it was hard to measure droplets diameter. Besides, Urdahl et al. (1997) postulated that viscosity is higher when the size distribution is narrow due to the low degree of polydispersity d=6.59 ±11.71 µm Droplets Diameter (µm) (a)
118 Frequency (%) Frequency (%) d= ± 8.07µm Droplets Diameter (µm) (b) d=5.04 ± 1.99µm Droplets Diameter (µm) (c) Figure 6.13: Droplets Diameter (µm) before Demulsified in Microwave Irradiation (a) Crude Oil A (b) Crude Oil B (c) Crude Oil C
119 Frequency (%) Frequency (%) d=12.1 ± 7.11µm Droplets Diameter (µm) (a) d=19.5 ± 13.21µm Droplets Diameter (µm) (b) Figure 6.14: Droplets Diameter (µm) before Demulsified in Microwave Irradiation (a) crude oil A (b) crude oil B
120 Dielectric Constant EFFECT OF VOLUME FRACTION ON DIELECTRIC CONSTANT, DIELECTRIC LOSS, WAVELENGTH AND MICROWAVE PENETRATION DEPTH Theoretically the effect of volume fraction on dielectric properties is important to better understanding the interaction between droplets in the emulsion. Figure 6.15 shows the effect of dielectric constant at , and 0.32 of volume fraction. By measurements, it is observed that higher volume fraction (Φ = 0.32) obtained higher dielectric constant within radiation time. It would seem reasonable to believe that at higher volume fraction, more droplets exist thus higher interaction with the electric fields therefore increase in the dielectric constant. However, the dielectric constant for higher volume fraction (Φ = 0.32) decreases from 35.2 to 25.9 and lower volume fraction (Φ = ) shows only slightly decreases from 9.1 to 7.6 because the abrupt changing of dielectric constant at higher volume fraction compared to lower volume fraction due to the decreasing of heat generation within radiation time and the compactness of molecules in these emulsions. This results was supported the explanation from Calla et al. (2007) who studied the effect of microwave irradiation with radiation time in soil Radiation Time (sec) Figure 6.15: Effect of Dielectric Constant within Radiation Time
121 Tangent Loss 97 Figure 6.16 shows the effects of tangent loss with temperature in varied volume fraction. It can be seen that the tangent loss exponential decreased as increasing temperature when emulsion is heated under microwave irradiation. Volume fraction at 0.32 has a decreases tangent loss from at o C to at o C can be explained by the reduction of interaction matter with the electric field of the incident radiation. Initially, the droplets absorb more electromagnetic wave due to the polar molecules exist in the droplets. However, as radiation time increase, temperature also increase and lead the decreasing of dielectric properties due to the decreasing of heat generation Temperature ( o C) Figure 6.16: Plots of Tangent Loss (tan δ) with Temperature ( o C) in Varied Volume Fraction Volume fraction has the greater influence in microwave irradiation due to the influence on dielectric properties. Figure 6.17 gives the effect of wavelength and penetration depth at various volume factions. As revealed by the figure, the wavelength and penetration depth decrease in all the range of volume fraction. As discussed in previous, the increasing volume fraction leads to the increasing of the droplets interaction thus, the propagate wave more rapidly thereafter penetration depth rapidly decreased. As mention before, penetration depth is a depth which power has been attenuated to 1/e times approximately. As electromagnetic introduced to the medium, the transmitted radiation
122 Wavelegth (cm) Penetration Depth (cm) 98 would gets attenuated exponentially while passing through medium and acquired the higher frequency. The microwaves operate at high frequency has a short wavelength which corresponds to a smaller penetration depth (Rao et al., 1988; Rattanadecho, 2006) Volume Fraction Figure 6.17: Effect of Penetration Depth, D p and Wavelength, λ m on Varied Volume Fraction A convenient expression for penetration depth, D p as a function of permittivity, ε is shown in Equation 6.2, respectively. D P ' (6.2) '' 2 eff
123 OPTIMISATION Optimisation for Crude Oil A To study the optimisation of emulsion demulsification, three variables; microwave power, microwave processing time and demulsifier concentration were investigated in crude oil A. As discussed previously, emulsions of crude oil A can be separated by chemical demulsifiers before microwave irradiation introduced. The water separation yield obtained from experiments that based on the experimental design from Design of Expert was given in Table 6.1. Table 6.1: 2 3 Factorial Design with Response Run Type Factor A, power (Watt) Factor B, time (min) Factor C, concentration (wt %) Response, water separated (%) 1 Fact Fact Fact Fact Fact Fact Fact Fact Axial Axial Axial Axial Axial Axial Center
124 Center Center Center Center The analysis of variance (ANOVA) from DOE was analysed to measure the variability of the observed response values as shown in Table 6.2. The value of R 2 is which the second-order model explained about % of the variability observed in the gain. Table 6.2: Analysis of Variance (ANOVA) Source Sum of Mean F Prob > Squares DF Square Value F Model < significant A B C A B C AB AC BC Residual Lack of Fit not significant Pure Error Cor Total Std. Dev R-Squared Mean Adj R
125 101 The application of the response surface methodology (RSM) yielded the following regression equation. The empirical relationship between response and variables in coded unit are summarised in Table 6.3 and the equation was given in Equation 6.3. Table 6.3: Regression Coefficient Values for Response Surface Coefficients Values b o b b b b 1 2 b 2 2 b b b b Y= X X X X X X 3 2 (6.3) -1.7X 1 X X 1 X 3-0.6X 2 X 3 Each of observation values y A is compared with predicted value, y o as shown in Table 6.4. Table 6.4: Observed Response and Predicted Values Actual value (y A ) Predicted value (y O ) Errors (y A -y O ) Squared errors
126 Sum of squared errors = Mean squared errors = The effects of microwave power, time processing and concentration of demulsifier on the yield of water separation percentage, as well as their interaction are shown in Figure An increasing microwave power resulted in higher percentage of water separation while the percentage (yield) reached a maximum when both microwave power and time processing up to a certain value, with no significantly further improvement thereafter. Time processing and concentration of demulsifier in microwave irradiation had similar effect on the yield. The yield increased to a certain value with elevating time and concentration (Figure 6.18c). A different effect on the percentage of water separated was shown for concentration of demulsifier. As shown in Figure 6.18b and c, there were plateau in relation to concentration of demulsifier, indicating that the percentage of water separated increased with increasing the concentration. High percentage of water separated could only be produced at higher demulsifier concentration. Molecules presented in the emulsion could be


127 103 accelerated by increasing the concentration of demulsifier. Therefore, in this model, microwave power acquired high effect on the percentage of water separated due to the fact that the wavelength and penetration depth increases along with microwave power. Thus, the ability of electromagnetic to penetrate into the emulsion could be evaluated by correlation of both penetration depth and wavelength with microwave power. The overall results obtained show that there are limitation of microwave power, time processing in microwave irradiation and also concentration of demulsifier to achieve optimum point of water separated. Based on Figure 6.18, the maximum yield of water separation predicted through this model is % at microwave power 710 W in 2.40 min with 0.15 wt% demulsifier. (a) (b)
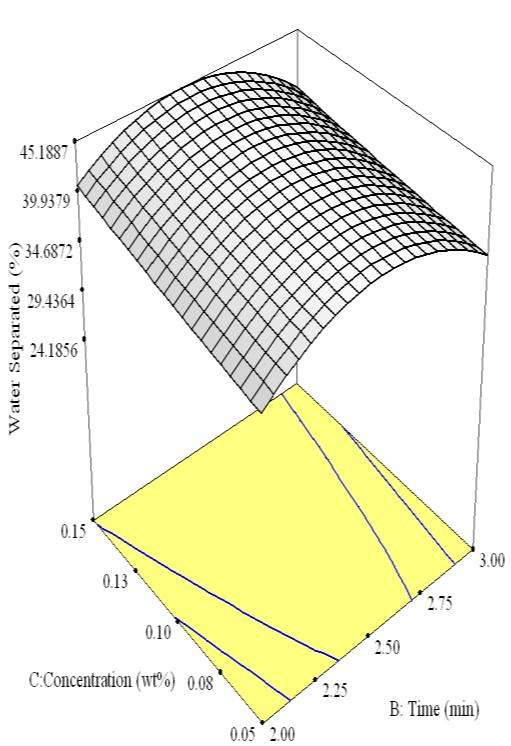
128 104
129 (c) Figure 6.18: Response Surface of Predicted Water Separated in Microwave Irradiation by Interaction (a) Power-Time (b) Power-Concentration and (c) Time- Concentration Optimisation for Crude Oil B The variables in optimisation of crude oil B involved microwave power and time processing in microwave. The percentage of water separated in crude oil B obtained from the experiments based on the experimental design are given in Table 6.5. The model was considered as a second-order model for the transistor gain data. The combination of variables can be treated as 2 2 factorial design using Yates Method (Lazić, 2004) to calculate response from main and interactive effects from the factorials. Table 6.5: 2 2 Factorial Design with Response Run Type Factor A, power (Watt) Factor B, time (min) Response, water separated (%) 1 Fact Fact Fact Fact Axial Axial
130 121 7 Axial Axial Center Center Center Center Center Subsequently, the significance interaction of each factors were showed in an analysis of variance (ANOVA) from Table 6.6. The factors can be declared as significant when the Prob > F is less than 0.05, thus A and A2 are significantly model terms. The "Lack of Fit F-value" of 2.73 implies the Lack of Fit is not significant relative to the pure error. By analysis of variance, the R 2 value of this model was determined to be , which showed that the regression model defined well the true behaviour of the system. Table 6.6: Analysis of Variance (ANOVA) Sum of Mean F Source Squares DF Square Value Prob > F Model < significant A B A < B AB
131 122 Residual Lack of not Fit significant Pure Error Cor Total Std. Dev R Mean Adj. R The application of the response surface methodology (RSM) yielded the following regression equation. The empirical relationship between response and variables in coded unit are summarised in Table 6.7. While the mathematical model representing the yield of water separation percentage as a function of the independent variables within the region under this study was expressed from Equation 6.4. Table 6.7: Regression Coefficient Values for Response Surface Coefficients Values b o b b b 1 2 b b 1 b
132 123 Y= X X X X X 1 X 2 (6.4) The yield or response expression to be optimised was the water separated in percent (%). Table 6.8 listed the actual and predicted of responses from model. The differential values between actual and predicted are ranging between -1.9 and 1.9. The comparison of the error and squared error indicates that none of the individual error exceeds twice of the squared root of the errors. Due to this smaller differential, the regression model indicates in good adequacy. Table 6.8: Observed Response and Predicted Values Actual value (y A ) Predicted value (y O ) Errors (y A -y O ) Squared errors Sum of squared errors = Mean squared errors =

133 124 The interaction and 3D graphs of optimisation in crude oil B arises between two variables are identified and explained in Figure Both variables obtain quadratic trend of graphs however, microwave power has significant factor compared to time of microwave processing. The reason for this result due to the characteristics of crude oil B which crude oil B acquired a light type of crude oil. Thereby, the thermal heating occurred could be avoided when demulsified under microwave irradiation. The thermal heating was correlated to the higher temperature. In crude oil B, the light crude oil might have lower interaction of molecules compared to heavy crude oil. Thus, as increasing time, only slightly temperature increased arises in this type of crude oil. The maximum yield of water separation predicted from the response surface under microwave irradiation illustrates in Figure 6.19b. The response surface plot in figure shows this model is quadratic. The maximum yield of water separation predicted through this model is % at microwave power 692 W in 2.56 min. (a) (b) Figure 6.19: Response Surface of Predicted Water Separated by Interaction Power (X 1 ) and Time (X 2 ) in Microwave Irradiation (a) Interaction (b) 3D Graph Optimisation for Crude Oil C
134 125 This crude oil also selected same variables (microwave power, time of microwave processing and concentration of demulsifier) with factorial design 2 3 factorial design. The water separation yield obtained from experiments that based on the experimental design is given in Table 6.9. Table 6.9: 2 3 Factorial Design with Response Factor A, Factor B, Response, Factor C, Run Type power time water concentration (wt %) (Watt) (min) separated (%) 1 Fact Fact Fact Fact Fact Fact Fact Fact Axial Axial Axial Axial Axial Axial Center Center Center Center Center
135 126 The analysis of variance (ANOVA) from DOE was analysed to measure the variability of the observed response values as shown in Table The value of R-squared from regression coefficient table is That is, the second-order model explained about % of the variability observed in the gain. The adjusted R 2 for this model is which considered as good fit for the observed response values. The Prob>F values of the model were which indicated that the model fitness was significant. The values of Prob> F less than 0.05 indicate model terms are not significant, and in this crude oil, A, A2, B2 and AB display the significant model terms. The Lack of Fit F-Value of 2.33 implies the Lack of Fit is not significant relative pure error. Thus model was acceptable to fit. Table 6.10: Analysis of Variance (ANOVA) Sum of Mean F Source Squares DF Square Value Prob > F Model significant A B C A B C AB AC BC
136 127 Residual Lack of Fit Pure Error Cor Total Std. Dev R Mean Adj. R not significant The application of the response surface methodology (RSM) yielded the following regression equation. The empirical relationship between response and variables in coded unit are summarised in Table 6.10 and the equation was given in Equation 6.5. Table 6.11: Regression Coefficient Values for Response Surface Coefficients Values b o b b b b 1 2 b 2 2 b b b b
137 128 Y= X X X X X X 3 2 (6.5) X 1 X X 1 X X 2 X 3 where Y is the response of water separated and X 1, X 2 and X 3 are the coded variables for microwave power, time of processing and concentration of demulsifier, respectively. Table 6.12 listed the actual and predicted of responses from model. The differential values between actual and predicted are ranging between and The agreement between actual and predicted value of percentage water separation yield confirmed the significance of model. Thus, due to this smaller differential, the regression model indicates in good adequacy. Table 6.12: Observed Response and Predicted Values Actual value (y A ) Predicted value (y O ) Errors (y A -y O ) Squared errors
138 Sum of squared errors = Mean squared errors = As shown in Figure 6.20a, there was an optimal value for microwave power and time processing in microwave to obtain the highest percentage of water separated. Indeed, microwave power and time processing arises a maximum point in the experimental region. However both Figure 6.20b and c display there were plateau in relation to concentration of demulsifier, which also as same in crude oil A that indicating that the concentration do not affected in this microwave-assisted chemical system. This is due to the higher asphaltenes presented in this crude oil. The content of asphaltenes in crude oil can be an indicator in determining the viscosity of crude oil. Crude oil C had higher viscosity thus as increasing the demulsifier concentration in the microwave-assisted system conveyed thermal heating in microwave system. Thus, the concentration of demulsifier was allowed of 0.14wt% at 767 W in 2.50 min.
")

139 130 (a) (b)
 will be used in order to validate this predicted model.")
140 131 (c) Figure 6.20: Response Surface of Predicted Water Separated by Interaction Microwave Power (X 1 ), Time Processing (X 2 ) and Concentration of Demulsifier (X 3 ) in Microwave Irradiation 6.9 VALIDATION OF MODEL PREDICTION Optimum variables gained by Design of Expert (DOE) will be used in order to validate this predicted model. However, the microwave power obtained through this model cannot be followed exactly due to the drawback of microwave power used. Table 6.13 indicates the optimum variables for each crude oil. Table 6.13: Model Prediction Variables Crude oil Microwave power (Watt) Time (min) Concentration (wt %) A B C
141 Percentage of Water Separated (%) 132 Crude oil A was pursued the variables listed from Table In contrast, the microwave power in crude oil B and C were operated at 690 W and 770 W. The results obtained in this validation model are shown in Figure It seems that each crude oil excellently break after 5 minutes as followed by response of prediction model. This results proved that the W/O emulsion for each crude oil is better separation in both real and prediction model. In this results, within 5 minutes, crude oil A obtained 44.0 % of water separated, which is 1.1.0% lower than prediction model. While crude oil B shows that 60.0 % of water can be separated and 38.0% for crude oil C. The percentage of water separated in crude oil B lower 4.0 % than predicted model. This is might be obtained due to the microwave power operated was lower than predicted model. However, still W/O emulsion can be separated in microwave irradiation and microwave-assisted chemical for heavy crude oil crude oil A 5th degree crude oil B crude oil C Time Time (min) (min) Figure 6.21: W/O Emulsion Demulsified Using Optimum Variables
142 SUMMARY By comparing the effectiveness methods of microwave irradiation and conventional methods in demulsification, microwave irradiation indicates the highest percentage of water separation for lighter crude oil. However, for heavy crude oil which in this study, crude oils A and C were treated in chemical demulsifier to accelerate the droplets in emulsion before enhanced in microwave irradiation. In optimisation part, crude oil A and C used 2 3 factorial design in modelling experiments using design expert. In contrast, 2 2 factorial design was selected in crude oil B due to the properties of crude oil and only this type of crude oil can be separated while using microwave irradiation.
143 134 CHAPTER 7 CONCLUSIONS AND RECOMMENDATIONS 7.1 CONCLUSION The behaviour of water-in-oil emulsion was investigated by studying the formation, stabilisation and demulsification of emulsions by various methods (chemical demulsifications and microwave irradiation). The principal objective of this study work was to develop a better fundamental understanding of the mechanisms of emulsion stabilisation, mechanisms of coalescence demulsification (emulsion breaking), as well as microwave method for emulsion demulsification. This chapter presents the main results discussed in chapter 5 and 6. In this study, three types of crude oils were used namely; crude oil A, B and C. results showed crude oil C is the heaviest and followed by crude oil A and B, respectively. Based on the results of this study, it can be concluded that: Characterisation of Crude Oil and Stability of W/O Emulsion According to the characterisation results of crude oil A, B, C and W/O emulsion prepared from these crude oils, the following conclusion can be made:- i. The physical properties of three types of crude oil showed that the range of viscosity was between 24.6 to cp; the API density obtained ranged from to ; pour point acquired value ranged from to o C; wax
144 appearance temperature within range to 4.44 o C and for surface tension analysis, the range within to m/nm. While for chemical properties, crude oil C obtained the highest asphaltenes content 14.7 wt%, followed by crude oil A (11.0 wt%) and 5.94 wt% in crude oil B. Therefore, the presents of solid particles in crude oil C was highest (15.27 wt %) followed by crude oil A (14.20 wt %) and 9.77wt% for crude oil B. The analysis of the properties shows that there are correlations between some physical and chemical properties of crude oil. For instance, crude oil C whereas the heaviest crude oil indicated the higher asphaltenes content and viscosity. In contrast, higher resin content performed the instability of crude oil as following crude oil B>crude oil A>crude oil C. Besides, asphaltenes and resins analysed by FTIR showed that they have functional groups of hydrocarbon and aromatic. ii. The analysis of the factor affected the stability of emulsion were demonstrated that the emulsion prepared in crude oil C acquired the highest viscosity as comparing the stirring intensity and temperature. Besides, phase inversion of W/O to O/W emulsion investigated closely which caused at higher temperature and ratio. Crude oil B showed that the W/O emulsion inversed to O/W at higher temperature (90 o C) and at % W/O emulsion for all crude oil types, emulsions were inversed to O/W. In addition the emulsion also varied with the ratio of water-oil to analyse the rheology of emulsion. The behaviour of emulsion observed through plotting graph shear stress versus shear rate and viscosity versus shear rate. Higher ratio (50-50 % w/o emulsion) indicated emulsion behave as non-newtonian for crude oil B and C only. However, for crude oil A, the emulsion showed non-newtonian behaviour at higher ratio (55-45 % W/O emulsion) due to the content of wax in crude oil Demulsification Analysis of demulsification was conducted by comparing microwave irradiation with conventional methods such as chemical demulsification, thermal heating (hotplate) and settling gravity. In optimisation, the optimum conditions in microwave irradiation of
145 percentage water separated were arises. The following of analysis in demulsification were concluded below:- i. There were no separation observed in emulsion prepared from crude oil A and C compared to crude oil B after demulsified in microwave irradiation and conventional methods. Thus, chemical demulsifier was added into emulsions from crude oil A and C to accelerate the droplets in emulsion before enhanced using microwave irradiation. ii. The correlation of volume fraction of emulsion and microwave power with dielectric properties, wavelength and penetration depth also discussed in demulsification part. Volume fraction increased with increasing the dielectric properties and has reversed correlation with wavelength and penetration depth due to the efficiency of microwave absorption high. While, microwave power has directly correlation with penetration depth and wavelength because of more electromagnetic intense inside the water molecules. iii. In optimisation part, the analysis of demulsification in microwave irradiation using response surface methodology, two types of factorial designs selected which 2 2 factorial design for crude oil B and 2 3 factorial design for crude oil A and C. From factorial design analysis, it was found that the optimum variables and yield (percentage of water separation) in crude oil A which are 710 W in 2.40 min with 0.15 wt% of demulsifier and maximum yield of water separation predicted was %. While in crude oil B, the maximum yield of water separation predicted through this model is % at microwave power 692 W in 2.56 min. The last sample analysis was crude oil C whereas based on the model; the maximum yield of water separation predicted through this model is % at microwave power 767 W in 2.50 min with 0.14 wt% demulsifier.
146 7.2 RECOMMENDATIONS Based on this study, some additional experiments in characterisation of crude oil are suggested before demulsification is a`cquired. Therefore, some further studies are still required as follows:- i. For heavy crude oil, viscosity reduction is necessary to obtain the optimum viscosity point by dilution of heavy crude oil with light crude oil. ii. Instead of using bottle test to asses the emulsion stability, this study suggests water concentration profile (hold-up) and coalescing interface behaviour as future investigation or emulsion stability.
147 REFERENCES Abdurahman, H. N., Rosli, M.Y. and Anwarudin, H Water in crude oil emulsion: Its stabilization and demulsification. Journal of Applied Science 7(22): Abdurahman, H. N. and Rosli, M A comparative study on emulsion demulsification by microwave radiation and conventional heating. Journal of Applied Science 6(10): Al-Ayed, O.S., Al-Harahsheh, A., Khaleel, A.M. and Al-Harahsheh, M Oil shale pyrolysis in fixed-bed retort with different heating rates. Estonian Academy Publishers. Oil Shale. Vol. 26, No.2, pp Alejandro, A.P., George, J.H. and Miller, C.A Chemically induced destabilization of water-in-crude oil emulsions. Ind. Eng. Chem. Res. 44: Alghanduri, L.M., Elgarni, M.M., Daridon, J-L. and Coutinho, J.A.P Characterization of Libyan waxy crude oils. Energy Fuels 24: Ali, M.F. and Alqam, M.H The role of asphaltenes, resins and other solids in the stabilization of water in oil emulsions and its effects on oil production in Saudi oil fileds. Fuel 79: Ariany, Z Formation and stability study of some Malaysian crude oil emulsions. MSc. Thesis. Universiti Teknologi Malaysia, Skudai Arnaud, J Methods and apparatus for oil demulsification and separation of oil and suspended solids from produced water. US Patent 2004/ A1 Auflem, I.H Influence of asphaltene aggregation and pressure on crude oil emulsion stability. Ph.D Thesis. Norwegian University of Science and Technology. Trondhein, Noway. Bancroft, W.D Theory of emulsification IV, Journal of Physical Chemistry 16 (9): Basak, T. and Meenakshi, A A theoretical analysis on microwave heating of food slabs attached with ceramic plates: role of distributed microwave incidence. Food Research International 39: Bezerra, M.A., Santelli, R.E., Oliveira, E.P., Villar, L.S. and Escaleira, L.A Response surface methodology (RSM) as a tool for optimization in analytical chemistry. Talanta 76:
148 Biresaw, G. and Mittal, K.L.2008 (ed). Surfactants in tribology. CRC Press, Taylor & Francis Group, London, New York Calla, O.P.N., Bohra, D. and Mishra Effect of microwave radiation on the electrical parameters of soil. Indian Journal of Radio and Spaces Physic. Vol.36, June 2007, pp Carlota, O.R-Y., Adalberto, P-Jr. and Tavares, C.L Micellar solubilization of drugs. J Pharm Pharmaceut Sci 8(2): , 2005 Chern, C-S. and Lin, S-Y Emulsion polymerization of styrene stabilized by mixed anionic and nonionic surfactants. Polymer Vol. 38 No. 8, pp Chhabra, R.P Bubbles, drops and particles in non-newtonian fluids. Boca Raton, FL: CRC Taylor & Francis, 2007 Chen, C., Gao, J.-S. and Yan, Y.-J Original preasphaltenes and asphaltenes in coals. Fuel Processing Technology 55: Chen, G. and Tao, D An experimental study of stability of oil-water emulsion. Fuel Processing Technology 86: Coutinho, R.C., Fortuny, H.M., de Souza, M.N. and Santos, A.F Method for the microwave treatment of water-in-oil emulsions. US Patent 2008/ A1 Di, P., Chang, D.P.Y. and Dwyer, H. A Heat and mass transfer during microwave steam treatment of contaminated soils. Journal of Environmental Engineering. Vol. 126 n12 pp Díaz-Ponce, J.A., Flores, E.A., Lopez-Ortega, A. Hernández-Cortez, J.G., Estrada, A., Castro, L.V. and Vazquez,F.2010.Differential scanning calorimetry characterization of water-in-oil emulsions from Mexican crude oils. J Therm Anal Calorim. DOI /s Djuve, J., Yang, X., Fjellanger, I.J. Sjöblom, J. and Pelizzetti, E Chemical destabilization of crude oil based emulsions and asphaltene stabilized emulsions. Colloid Polymer Science. 279: El Gamal, M., Mohamed, A-M.O. and Zekri, A.Y Effect of asphaltene, carbonate, and clay mineral contents on water cut determination in water oil emulsions. Journal of Petroleum Science and Engineering 46: Evdokimov, I.N., Efimov, Y.O., Losev, A.P. and Novikov, M.A Morphological transformation of native petroleum emulsions, I. Viscosity Studies. Langmuir 24:
149 Fingas, M. F.F.B What causes the formation of water-in-oil emulsions. International Oil Spill Conference. Environment Canada, Ottawa, Ontario. pp Griffin, W.C: Classification of surface-active agents by 'HLB. Journal of the Society of Cosmetic Chemists 1: 311 Gunal, O.G. and Islam, M.R Alteration of asphaltic crude rheology with electromagnetic and ultrasonic irradiation. Journal of Petroleum Science and Engineering 26: Guzmán-Lucero, D.,Flores, P., Rojo, T. and Martínez-Palou, R Ionic Liquids as Demulsifiers of water-in-crude oil emulsions: study of the microwave effect. Energy Fuels 24: Hait, S.K. and Moulik, S.P Determination of critical micelle concentration (CMC) of nonionic surfactants by donor acceptor interaction with iodine and correlation of CMC with hydrophile lipophile balance and other parameters of the surfactants. Journal of Surfactants and Detergents, Vol. 4, No. 3 (July 2001) Hannisdal, A., Helen, M. Ese, Hemmingsen, P.V. and Sjόblom, J Particle-stabilized emulsions: effect of heavy crude oil components pre-adsorbed onto stabilizing solids. Colloids and Surfaces A: Physicochem. Eng. Aspects 276: Hannisdal, A Particle-stabilized emulsions and heavy oils. Ph.D Thesis. Norwegian University of Science and Technology. Trondhein, Noway. Hannisdal, A., Helen, M. Ese, Hemmingsen, P.V., Sjöblom, J Group-type analysis of heavy crude oils using vibrational spectroscopy in combination with multivariate analysis. Ind. Eng. Chem. Res. 44: Holmberg, K Handbook of Applied Surface and Colloid Chemistry. United States: John Wiley & Sons. Holtze, C. Sivaramakrishnan, R. Antonietti, M, J. Tsuwi, Kremer, F., Kramer, K.D The microwave absorption of emulsions containing aqueous micro- and nanodroplets: A means to optimize microwave heating. Journal of Colloid and Interface Science 302: Indra, S.R.G.2007.Microwave assisted generation and trapping of acetylketene. MSc. Thesis. Texas Technology University, Texas Jennifer, K Investigation in to the stability of bitumen emulsions. Thesis and Seminars. The University of Queensland, Australia. Jiang,T., Hirasaki, G. and Miller, C Diluted Bitumen Water-in-Oil Emulsion Stability and Characterization by Nuclear Magnetic Resonance (NMR) Measurements. Energy Fuels. 21 (3), pp
150 Kang, W., Jing, G., Zhang, H., Li M. and Wu, Z Influence of demulsifier on interfacial film between oil and water. Colloids and Surfaces A. Physicochem. Eng. Aspects 272: Kim, Y.H, Wasan, D.T. and Breen, P.J A study of dynamic interfacial mechanisms for demulsification of water-in-oil emulsions. Colloids and Surfaces A: Physicochemical and Engineering Aspects 95 : Kingston, H. M. and Tassie, L.B Introduction to microwave sample preparation theory and practice. American Chemical Society. Washington. Klaika, W.J Method and apparatus for controlling fluency of high viscosity hydrocarbon fluids. U.S.Patent 4,067,683 Langevin, D., Poteau, S., Hénaut, I. and Argillier, J.F Crude oil emulsion properties and their application to heavy oil transportation. Oil & Gas Science and Technology. Rev. IFP, Vol. 59, No. 5, pp Lazić, Z.R Design of Experiments in Chemical Engineering: A Practical Guide. WILEY-VCH Verlag GmbH & Co. KGaA, Weinheim Lenth, R.V Response-Surface Methods in R, Using RSM Journal of Statistical Software October 2009, Volume 32, Issue 7. (online). (20 July 2010). Leszek, S.C Considerations on the concept of pointing vector contribution to power theory development. Sixth International Workshop on Power Definitions and Measurements under Nonsinusoidal Conditions.Milano, Italy. Lee, H.M. Lee, J.W. and Park, O.O Rheology and dynamics of water-in-oil emulsions under steady and dynamic shear flow. Journal of Colloid and Iinterface Science Li, H. and Zhang, J A generalized model for predicting non-newtonian viscosity of waxy crudes as a function of temperature and precipitated wax. Fuel. 82(11): Lidstrőm, P., Tierney, J., Wathey, B. and Westman, J Microwave assisted organic synthesis: a review. Tetrahedron 57: McClements, D.J Food emulsions: principles, practices, and techniques.2 nd ed. Boca Raton: CRC Press, 2005 McLean, J.D. and Kilpatrick, P.K Effects of asphaltene solvency on stability of water-in-crude-oil emulsions. Journal of Colloid and Interface Science. 189:
151 Midttun, O. and Kvalheim, O.M Interactions in chromatographic separation of resins from deasphaltened crude oils studied by means of infrared spectroscopy and principal component analysis. Fuel, Volume 80, Number 5, April 2001, pp (14) Montgomery, D.C Design and analysis of experiments. 5 th Ed. New York: John Wiley & Sons Mutyala, S., Fairbridge, C., Paré, J.J.R., Bélanger, J.M.R., Ng. S. and Hawkins, R Microwave applications to oil sands and petroleum: A review. Fuel Processing Technology 91: Nadkarni, R.A Application of microwave oven sample dissolution in analysis. Analytical Chemistry 56 (12): National Materials Advisory Board Microwave Processing of Materials. Publication NMAB-473. National Academy Press. Washington, D.C. Nemirosvkaya, G.B., Emel yanova A.S., and Ashmyan, K.D Methods of Analysis of High-Wax Crude Oils. Resins, Asphaltenes, Paraffin Waxes. Chemistry and Technology of Fuels and Oils. 41:( 3) Ngai, T.and Wu, C.2005.Double roles of stabilization and destabilization of initiator potassium persulfate in surfactant-free emulsion polymerization of styrene under microwave irradiation. Langmuir,21: Opawale, F.O. and Burgess, D.J Influence of interfacial properties of lipophilic surfactants on water-in-oil emulsion stability. Journal of Colloid and Interface Science 197: Paul, B. and Daniel, S Encyclopedia of Emulsion Technology. Volume 2: Applications. Marcel Dekker, Inc.New York Pedersen, K.S. and Rnningsen, H.P Effect of precipitated wax on viscosity-a model for predicting non-newtonian viscosity of crude oils. Energy & Fuels 14: Rajaković, V. and Skala, D Separation of water-in-oil emulsions by freeze/thaw method and microwave radiation. Separation and Purification Technology 49(2006): Rao, K.S., Chandra, G. and Rao, P.V.N Study on penetration depth and its dependence on frequency, soil moisture, texture and temperature in the context of microwave remote sensing. Journal of the Indian Society of Remote Sensing, Vo. 16, No.2, 1988
152 Rattanadecho, P The simulation of microwave heating of wood using a rectangular wave guide: Influence of frequency and sample size. Chemical Engineering Science 61: Rosen, M. J Surfactant and interfacial phenomena. New Jersey: John Wiley & Sons, Inc., Hoboken. Rusli, D., Shahinas, B. and Ibrahim, A Effect of molecular weight on the droplet size and rheological properties of liquid natural rubber emulsion. Malaysian Polymer Journal (MPJ), Vol 2, No. 1, p 29-38, 2007 Ryynänen, S Microwave heating uniformity of multicomponent prepared foods. Academic Dissertation. University of Helsinki. Finland. Schramm, L.L Emulsions, foams and suspensions; fundamental and applications. Weinheim : Wiley-VCH Verlag GmbH & Co. Schramm, L.L Surfactant; fundamental and applications in the petroleum industry. Cambridge University Press Sjöblom, J Emulsions and emulsion stability, second edition. New York: Taylor & Francis. Strom-Kristiansen, T., Daling, P.S. and Brandvick, P.J Dispersant and underwater release experiments: Surface oil sampling and analysis. Data report. IKU report, N25: Sujoy, K. S. and Basak, T Enhanced microwave processing of oil-water emulsions confined within ceramic and ceramic/ metallic or composite plates. Chemical Engineering and Processing 48: Sullivan, A.P. and Kilpatrick, P.K The effects of inorganic solid particles on water and crude oil emulsion stability. Ind. Eng. Chem. Res. 41: Tadros, T.F Emulsion science and technology. WILEY-VCH Verlag GmbH & Co. KGaA, Weinheim Tanmay, B. and Ayappa, K.G Analysis of microwave thawing of slabs with effective heat capacity method, AIChE Journal, 43, Taraneh, J.B., Rahmatollah, G., Hassan, A. and Alireza, D Effect of wax inhibitors on pour point and rheological properties of Iranian waxy crude oil. Fuel Processing Technology 89: Urdahl, O., Fredheim, A.O. and LØken, K-P Viscosity measurements of water-incrude-oil emulsions under flowing conditions: A theoretical and practical approach.
153 Colloids and Surfaces A: Physicochemical and Engineering Aspects : Von Hippel, A.R Dielectric Materials and Applications. MIT Press. Cambridge, MA. Wang, L., Yang, B., Du, X., Yi, C Optimisation of supercritical fluid extraction of flavonoids from Pueraria lobata. Food Chemistry 108: Wang, W., Zhou, Z., Nandakumar, K., Xu, Z. and Jacob, H.M Effect of charged colloidal particles on adsorption of surfactants at oil water interface. Journal of Colloid and Interface Science 274: Wanli, K., Yi, L., Baoyan, Q., Guangzhi, L., Zhenyu, Y., and Jichun, H Interactions between alkali: surfactant: polymer and their effects on emulsion stability. Colloids and Surfaces A: Physicochemical and Engineering Aspects 175: Wilde, P.J Interfaces: Their role in foam and emulsion behaviour. Current Opinion in Colloid & Interface Science. 5: Wolf, N.O Use of microwave radiation in separating emulsions and dispersion of hydrocarbon and water. U.S.Patent 4,582,629 Woods, J.R., Kung, J., Pleizier, G., Kotlyar, L.S., Sparks, B.D., Adjaye, J., and Chung, K.H Characterization of a coker gas oil fraction from athabasca oil sands bitumen. Fuel 83 (2004) Wu, J., Xu, Y., Dabros, T. and Hamza, H Effect of Demulsifier Properties on Destabilization of Water-in-Oil Emulsion. Energy Fuels, 17 (6): Xia, L., Lu, S. and Cao, G Stability and demulsification of emulsions tabilized by asphaltenes or resins. Journal of Colloid and Interface Science 271: Yang, X. Tan,W. and Bu, Y Demulsification of asphaltenes and resins stabilized emulsions via the freeze/ thaw method. Energy & Fuel 23(1): pp Yanniotis,B and Sundén, S.(Ed.) Heat transfer in food industry: Recent development and application. Boston: WIT Press Zaki, N.N Surfactant stabilized crude oil-in water emulsions for pipeline transportation of viscous crude oils. Colloids and Surfaces A: Physicochemical and Engineering Aspects 125: Zhang, Z., Wang, F.G.X., Dong, S. and Chen, Y Demulsification by amphiphilic dendrimer copolymers. Journal of Colloid and Interface Science. 282: 1 4
154 Zhu, T Evaluation of Wax Deposition and Its Control during Production of Alaskan North Slope Oils. Petroleum Development Laboratory. Institute of Northern Engineering University of Alaska Fairbanks, Alaska.
155 %T APPENDIX A FTIR ANALYSIS FOR CRUDE OIL Wavenumbers (cm-1) Figure A1: FTIR Analysis of Crude Oil A
156 %T %T Wavenumbers (cm-1) Figure A2 FTIR Analysis of Crude Oil B Wavenumbers (cm-1) Figure A3 FTIR Analysis of Crude Oil C
157 APPENDIX B ANALYSIS OF DIFFERENTIAL SCANNING CALORIMETRY (DSC) Figure B1: DSC Analysis of Crude Oil A Figure B2: DSC Analysis of Crude Oil B
158 Figure B3: DSC Analysis of Crude Oil C
159 APPENDIX C EFFECT OF DROPLETS SIZE ON STIRRING INTENSITY (a) 500 rpm (b)1000 rpm (c) 1500 rpm (d)2000 rpm Figure C1: Droplet Size Affect at Varied Stirring Intensity


160 APPENDIX D EFFECT OF TEMPERATURE ON EMULSION STABILITY Ambient temperature Temperature 50 o C Temperature 70 o C

 Ambient temperature")
161 Temperature 90 o C Figure D % W/O Emulsion (Left at 10x resolution; Right at 100x resolution) Ambient temperature Temperature 50 o C
DEMULSIFICATION OF CRUDE OIL EMULSIONS VIA MICROWAVE ASSISTED CHEMICALS (ENVIRONMENTAL FRIENDLY) NUR HAFIZAH BINTI HUSSIN
 NUR HAFIZAH BINTI HUSSIN") DEMULSIFICATION OF CRUDE OIL EMULSIONS VIA MICROWAVE ASSISTED CHEMICALS (ENVIRONMENTAL FRIENDLY) by NUR HAFIZAH BINTI HUSSIN A thesis submitted in fulfillment of the requirements for the award of the Degree
DEMULSIFICATION OF CRUDE OIL EMULSIONS VIA MICROWAVE ASSISTED CHEMICALS (ENVIRONMENTAL FRIENDLY) by NUR HAFIZAH BINTI HUSSIN A thesis submitted in fulfillment of the requirements for the award of the Degree
EMULSION SEPARATION RATE ENHANCEMENT VIA MICROWAVE HEATING TECHNOLOGY. A.N. Ilia Anisa 1* and Abdurahman H.Nour 1
 National Conference on Postgraduate Research (NCON-PGR) 2009 1st October 2009, UMP Conference Hall, Malaysia Centre for Graduate Studies, Universiti Malaysia Pahang Editors: M.M. Noor; M.M. Rahman and
Applied Surfactants: Principles and Applications
 Applied Surfactants: Principles and Applications Tadros, Tharwat F. ISBN-13: 9783527306299 Table of Contents Preface. 1 Introduction. 1.1 General Classification of Surface Active Agents. 1.2 Anionic Surfactants.
EFFECTS OF Ni 3 Ti (DO 24 ) PRECIPITATES AND COMPOSITION ON Ni-BASED SUPERALLOYS USING MOLECULAR DYNAMICS METHOD
 PRECIPITATES AND COMPOSITION ON Ni-BASED SUPERALLOYS USING MOLECULAR DYNAMICS METHOD") EFFECTS OF Ni 3 Ti (DO 24 ) PRECIPITATES AND COMPOSITION ON Ni-BASED SUPERALLOYS USING MOLECULAR DYNAMICS METHOD GOH KIAN HENG UNIVERSITI TEKNOLOGI MALAYSIA i EFFECTS OF Ni 3 Ti (DO 24 ) PRECIPITATES AND
EFFECTS OF Ni 3 Ti (DO 24 ) PRECIPITATES AND COMPOSITION ON Ni-BASED SUPERALLOYS USING MOLECULAR DYNAMICS METHOD GOH KIAN HENG UNIVERSITI TEKNOLOGI MALAYSIA i EFFECTS OF Ni 3 Ti (DO 24 ) PRECIPITATES AND
NSW Higher School Certificate Senior Science 9.2 Lifestyle Chemistry
 NSW Higher School Certificate Senior Science 9.2 Lifestyle Chemistry Section 2 Cleaning Products 9.2 Lifestyle Chemistry Section 2 ::: Cleaning Products 9.2.2 A wide range of cleaning products are made
*blood and bones contain colloids. *milk is a good example of a colloidal dispersion.
 Chap. 3. Colloids 3.1. Introduction - Simple definition of a colloid: a macroscopically heterogeneous system where one component has dimensions in between molecules and macroscopic particles like sand
CHARACTERISTICS OF SOLITARY WAVE IN FIBER BRAGG GRATING MARDIANA SHAHADATUL AINI BINTI ZAINUDIN UNIVERSITI TEKNOLOGI MALAYSIA
 CHARACTERISTICS OF SOLITARY WAVE IN FIBER BRAGG GRATING MARDIANA SHAHADATUL AINI BINTI ZAINUDIN UNIVERSITI TEKNOLOGI MALAYSIA CHARACTERISTICS OF SOLITARY WAVE IN FIBER BRAGG GRATING MARDIANA SHAHADATUL
ANOLYTE SOLUTION GENERATED FROM ELECTROCHEMICAL ACTIVATION PROCESS FOR THE TREATMENT OF PHENOL
 ANOLYTE SOLUTION GENERATED FROM ELECTROCHEMICAL ACTIVATION PROCESS FOR THE TREATMENT OF PHENOL By ZAULFIKAR Thesis Submitted to the School of Graduate Studies, Universiti Putra Malaysia, in Fulfilment
NUMERICAL INVESTIGATION OF TURBULENT NANOFLUID FLOW EFFECT ON ENHANCING HEAT TRANSFER IN STRAIGHT CHANNELS DHAFIR GIYATH JEHAD
 1 NUMERICAL INVESTIGATION OF TURBULENT NANOFLUID FLOW EFFECT ON ENHANCING HEAT TRANSFER IN STRAIGHT CHANNELS DHAFIR GIYATH JEHAD UNIVERSITI TEKNOLOGI MALAYSIA 3 NUMERICAL INVESTIGATION OF TURBULENT NANOFLUID
R =! Aco! What is formulation?
 1 / 36! AIChE 1rst International Conference on Upstream Engineering and Flow Assurance Houston April 1-4, 2012 2 / 36! Physico-chemical Formulation! Emulsion Properties vs Formulation! Applications! Jean-Louis
1 General Introduction
 1 1 General Introduction Several classes of formulations of disperse systems are encountered in the chemical industry, including suspensions, emulsions, suspoemulsions (mixtures of suspensions and emulsions),
OPTIMIZATION OF CHROMIUM, NICKEL AND VANADIUM ANALYSIS IN CRUDE OIL USING GRAPHITE FURNACE ATOMIC ABSORPTION SPECTROSCOPY NURUL HANIS KAMARUDIN
 ii OPTIMIZATION OF CHROMIUM, NICKEL AND VANADIUM ANALYSIS IN CRUDE OIL USING GRAPHITE FURNACE ATOMIC ABSORPTION SPECTROSCOPY NURUL HANIS KAMARUDIN A dissertation submitted in partial fulfilment of the
HYDROGEN RECOVERY FROM THE REFORMING GAS USING COMMERCIAL ACTIVATED CARBON MEHDI RAHMANIAN
 HYDROGEN RECOVERY FROM THE REFORMING GAS USING COMMERCIAL ACTIVATED CARBON MEHDI RAHMANIAN A dissertation submitted in partial fulfilment of the requirements for the award of the degree of Master of Engineering
Understanding Asphaltene Solvation Nexus and Stability Analyses of Heavy Crude Oil Emulsions
 Understanding Asphaltene Solvation Nexus and Stability Analyses of Heavy Crude Oil Emulsions 1 Emmanuel J. Ekott and 2 Emmanuel J. Akpabio 1 Department of Chemical Engineering, Anambra State University,
MATHEMATICAL MODELLING OF UNSTEADY BIOMAGNETIC FLUID FLOW AND HEAT TRANSFER WITH GRAVITATIONAL ACCELERATION
 MATHEMATICAL MODELLING OF UNSTEADY BIOMAGNETIC FLUID FLOW AND HEAT TRANSFER WITH GRAVITATIONAL ACCELERATION NOR AMIRAH BINTI IDRIS UNIVERSITI TEKNOLOGI MALAYSIA i MATHEMATICAL MODELLING OF UNSTEADY BIOMAGNETIC
STABILITY AND SIMULATION OF A STANDING WAVE IN POROUS MEDIA LAU SIEW CHING UNIVERSTI TEKNOLOGI MALAYSIA
 STABILITY AND SIMULATION OF A STANDING WAVE IN POROUS MEDIA LAU SIEW CHING UNIVERSTI TEKNOLOGI MALAYSIA I hereby certify that I have read this thesis and in my view, this thesis fulfills the requirement
ADSORPTION AND STRIPPING OF ETHANOL FROM AQUEOUS SOLUTION USING SEPABEADS207 ADSORBENT
 ADSORPTION AND STRIPPING OF ETHANOL FROM AQUEOUS SOLUTION USING SEPABEADS207 ADSORBENT M A ZIN ABDULHUSSEIN BEDEN U N IV ERSITI TEK N O L G I M ALAYSIA ADSORPTION AND STRIPPING OF ETHANOL FROM AQUEOUS
Contents XVII. Preface
 V Preface XVII 1 General Introduction 1 1.1 Suspensions 1 1.2 Latexes 2 1.3 Emulsions 2 1.4 Suspoemulsions 3 1.5 Multiple Emulsions 3 1.6 Nanosuspensions 4 1.7 Nanoemulsions 4 1.8 Microemulsions 5 1.9
MONTE CARLO SIMULATION OF NEUTRON RADIOGRAPHY 2 (NUR-2) SYSTEM AT TRIGA MARK II RESEARCH REACTOR OF MALAYSIAN NUCLEAR AGENCY
 SYSTEM AT TRIGA MARK II RESEARCH REACTOR OF MALAYSIAN NUCLEAR AGENCY") MONTE CARLO SIMULATION OF NEUTRON RADIOGRAPHY 2 (NUR-2) SYSTEM AT TRIGA MARK II RESEARCH REACTOR OF MALAYSIAN NUCLEAR AGENCY MASITAH BINTI OTHMAN UNIVERSITI TEKNOLOGI MALAYSIA MONTE CARLO SIMULATION OF
MONTE CARLO SIMULATION OF NEUTRON RADIOGRAPHY 2 (NUR-2) SYSTEM AT TRIGA MARK II RESEARCH REACTOR OF MALAYSIAN NUCLEAR AGENCY MASITAH BINTI OTHMAN UNIVERSITI TEKNOLOGI MALAYSIA MONTE CARLO SIMULATION OF
MECHANICAL PROPERTIES OF CALCIUM CARBONATE AND COCONUT SHELL FILLED POLYPROPYLENE COMPOSITES MEHDI HEIDARI UNIVERSITI TEKNOLOGI MALAYSIA
 1 MECHANICAL PROPERTIES OF CALCIUM CARBONATE AND COCONUT SHELL FILLED POLYPROPYLENE COMPOSITES MEHDI HEIDARI UNIVERSITI TEKNOLOGI MALAYSIA 5 MECHANICAL PROPERTIES OF CALCIUM CARBONATE AND COCONUT SHELL
RAINFALL SERIES LIM TOU HIN
 M ULTIVARIATE DISAGGREGATION OF DAILY TO HOURLY RAINFALL SERIES LIM TOU HIN UNIVERSITI TEKNOLOGI MALAYSIA M ULTIVARIATE DISAGGREGATION OF DAILY TO HOURLY RAINFALL SERIES LIM TOU HIN A report subm itted
EFFECT OF GRAPHENE OXIDE (GO) IN IMPROVING THE PERFORMANCE OF HIGH VOLTAGE INSULATOR NUR FARAH AIN BINTI ISA UNIVERSITI TEKNOLOGI MALAYSIA
 IN IMPROVING THE PERFORMANCE OF HIGH VOLTAGE INSULATOR NUR FARAH AIN BINTI ISA UNIVERSITI TEKNOLOGI MALAYSIA") 1 EFFECT OF GRAPHENE OXIDE (GO) IN IMPROVING THE PERFORMANCE OF HIGH VOLTAGE INSULATOR NUR FARAH AIN BINTI ISA UNIVERSITI TEKNOLOGI MALAYSIA EFFECT OF GRAPHENE OXIDE (GO) IN IMPROVING THE PERFORMANCE OF
1 EFFECT OF GRAPHENE OXIDE (GO) IN IMPROVING THE PERFORMANCE OF HIGH VOLTAGE INSULATOR NUR FARAH AIN BINTI ISA UNIVERSITI TEKNOLOGI MALAYSIA EFFECT OF GRAPHENE OXIDE (GO) IN IMPROVING THE PERFORMANCE OF
FLOW ASSURANCE: DROP COALESCENCE IN THE PRESENCE OF SURFACTANTS
 FLOW ASSURANCE: DROP COALESCENCE IN THE PRESENCE OF SURFACTANTS Vishrut Garg and Osman A. Basaran Davidson School of Chemical Engineering Purdue University With special thanks to: Krish Sambath (now at
ROOFTOP MAPPING AND INFORMATION SYSTEM FOR RAINWATER HARVESTING SURAYA BINTI SAMSUDIN UNIVERSITI TEKNOLOGI MALAYSIA
 ROOFTOP MAPPING AND INFORMATION SYSTEM FOR RAINWATER HARVESTING SURAYA BINTI SAMSUDIN UNIVERSITI TEKNOLOGI MALAYSIA ROOFTOP MAPPING AND INFORMATION SYSTEM FOR RAINWATER HARVESTING SURAYA BINTI SAMSUDIN
PRODUCTION OF POLYHYDROXYALKANATE (PHA) FROM WASTE COOKING OIL USING PSEUDOMONAS OLEOVORANS FARZANEH SABBAGH MOJAVERYAZDI
 FROM WASTE COOKING OIL USING PSEUDOMONAS OLEOVORANS FARZANEH SABBAGH MOJAVERYAZDI") ii PRODUCTION OF POLYHYDROXYALKANATE (PHA) FROM WASTE COOKING OIL USING PSEUDOMONAS OLEOVORANS FARZANEH SABBAGH MOJAVERYAZDI A dissertation report submitted in partial fulfilment of the requirements for
ii PRODUCTION OF POLYHYDROXYALKANATE (PHA) FROM WASTE COOKING OIL USING PSEUDOMONAS OLEOVORANS FARZANEH SABBAGH MOJAVERYAZDI A dissertation report submitted in partial fulfilment of the requirements for
SEPARATION OF CRUDE OIL EMULSION VIA ULTRASONIC TECHNOLOGY SITI ZALEHA BINTI ABDULLAH
 iv SEPARATION OF CRUDE OIL EMULSION VIA ULTRASONIC TECHNOLOGY SITI ZALEHA BINTI ABDULLAH Thesis submitted to the Faculty of Chemical and Natural Resources Engineering in Partial Fulfillment of the Requirement
INVESTIGATING THE KINETICS OF WATER-IN-CRUDE OIL EMULSION STABILITY
 INVESTIGATING THE KINETICS OF WATER-IN-CRUDE OIL EMULSION STABILITY Bamikole J. Adeyemi and Aliyu A. Sulaimon Department of Petroleum Engineering, Universiti Teknologi Petronas, Bandar Seri Iskandar, Tronoh,
SYNTHESIS AND CHARACTERIZATION OF SUPRAMOLECULAR POLYMER BASED ON LINOLEIC ACID OF SUNFLOWER OIL MILI PURBAYA UNIVERSITI TEKNOLOGI MALAYSIA
 i SYNTHESIS AND CHARACTERIZATION OF SUPRAMOLECULAR POLYMER BASED ON LINOLEIC ACID OF SUNFLOWER OIL MILI PURBAYA UNIVERSITI TEKNOLOGI MALAYSIA iv SYNTHESIS AND CHARACTERIZATION OF SUPRAMOLECULAR POLYMER
A COMPUTATIONAL FLUID DYNAMIC FRAMEWORK FOR MODELING AND SIMULATION OF PROTON EXCHANGE MEMBRANE FUEL CELL HAMID KAZEMI ESFEH
 A COMPUTATIONAL FLUID DYNAMIC FRAMEWORK FOR MODELING AND SIMULATION OF PROTON EXCHANGE MEMBRANE FUEL CELL HAMID KAZEMI ESFEH A thesis submitted in fulfilment of the requirements for the award ofthe degree
INDIRECT TENSION TEST OF HOT MIX ASPHALT AS RELATED TO TEMPERATURE CHANGES AND BINDER TYPES AKRIMA BINTI ABU BAKAR
 INDIRECT TENSION TEST OF HOT MIX ASPHALT AS RELATED TO TEMPERATURE CHANGES AND BINDER TYPES AKRIMA BINTI ABU BAKAR A project report submitted in partial fulfillment of the requirements for the award of
Preparation and Characterization of Oil-in-Water and Water-in-Oil Emulsions. Prepared. For
 1 Preparation and Characterization of Oil-in-Water and Water-in-Oil Emulsions Prepared For Dr. Reza Foudazi, Ph.D. Chemical and Materials Engineering New Mexico State University By Muchu Zhou May 10, 2016
OPTICAL TWEEZER INDUCED BY MICRORING RESONATOR MUHAMMAD SAFWAN BIN ABD AZIZ
 OPTICAL TWEEZER INDUCED BY MICRORING RESONATOR MUHAMMAD SAFWAN BIN ABD AZIZ A thesis submitted in fulfilment of the requirements for the award of the degree of Doctor of Philosophy (Physics) Faculty of
Chapter 7. Pickering Stabilisation ABSTRACT
 Chapter 7 Pickering Stabilisation ABSTRACT In this chapter we investigate the interfacial properties of Pickering emulsions. Based upon findings that indicate these emulsions to be thermodynamically stable,
EFFECT OF ROCK MASS PROPERTIES ON SKIN FRICTION OF ROCK SOCKET. YUSLIZA BINTI ALIAS UNIVERSITI TEKNOLOGI MALAYSIA
 EFFECT OF ROCK MASS PROPERTIES ON SKIN FRICTION OF ROCK SOCKET. YUSLIZA BINTI ALIAS UNIVERSITI TEKNOLOGI MALAYSIA EFFECT OF ROCK MASS PROPERTIES ON SKIN FRICTION OF ROCK SOCKET. YUSLIZA BINTI ALIAS A project
Colloidal dispersion
 Dispersed Systems Dispersed systems consist of particulate matter, known as the dispersed phase, distributed throughout a continuous or dispersion medium. The dispersed material may range in size from
Colloid & Interface Science Case Study Model Answers
 Colloid & Interface Science Case Study Model Answers Distance Learning Course in Cosmetic Science Society of Cosmetic Scientists Common Features Formulations were examples of lyophobic colloidal systems
POSITION CONTROL USING FUZZY-BASED CONTROLLER FOR PNEUMATIC-SERVO CYLINDER IN BALL AND BEAM APPLICATION MUHAMMAD ASYRAF BIN AZMAN
 POSITION CONTROL USING FUZZY-BASED CONTROLLER FOR PNEUMATIC-SERVO CYLINDER IN BALL AND BEAM APPLICATION MUHAMMAD ASYRAF BIN AZMAN A thesis submitted in fulfilment of the requirements for the award of the
SOLUBILITY MODEL OF PALM OIL EXTRACTION FROM PALM FRUIT USING SUB-CRITICAL R134a NUR SYUHADA BINTI ABD RAHMAN
 SOLUBILITY MODEL OF PALM OIL EXTRACTION FROM PALM FRUIT USING SUB-CRITICAL R134a NUR SYUHADA BINTI ABD RAHMAN JULY 2012 SOLUBILITY MODEL OF PALM OIL EXTRACTION FROM PALM FRUIT USING SUB-CRITICAL R134a
CHEMISTRY Ch. 14 Notes: Mixtures and Solutions NOTE: Vocabulary terms are in boldface and underlined. Supporting details are in italics.
 CHEMISTRY Ch. 14 Notes: Mixtures and Solutions NOTE: Vocabulary terms are in boldface and underlined. Supporting details are in italics. 14.1 notes I. Types of mixtures (mixture a physical blend of substances)
CHEMISTRY PHYSICAL. of FOODS INTRODUCTION TO THE. CRC Press. Translated by Jonathan Rhoades. Taylor & Francis Croup
 Christos Ritzoulis Translated by Jonathan Rhoades INTRODUCTION TO THE PHYSICAL CHEMISTRY of FOODS CRC Press Taylor & Francis Croup Boca Raton London NewYork CRC Press is an imprint of the Taylor & Francis
Heat Capacity of Water A) heat capacity amount of heat required to change a substance s temperature by exactly 1 C
 heat capacity amount of heat required to change a substance s temperature by exactly 1 C") CHEMISTRY Ch. 13 Notes: Water and Its Solutions NOTE: Vocabulary terms are in boldface and underlined. Supporting details are in italics. 13.1 Notes I. Water Molecule Characteristics POLAR molecule (a
CHEMISTRY Ch. 13 Notes: Water and Its Solutions NOTE: Vocabulary terms are in boldface and underlined. Supporting details are in italics. 13.1 Notes I. Water Molecule Characteristics POLAR molecule (a
Contents. Preface XIII
 V Contents Preface XIII 1 General Introduction 1 1.1 Fundamental Knowledge Required for Successful Dispersion of Powders into Liquids 1 1.1.1 Wetting of Powder into Liquid 1 1.1.2 Breaking of Aggregates
Hydrocarbon Reservoirs and Production: Thermodynamics and Rheology
 Hydrocarbon Reservoirs and Production: Thermodynamics and Rheology A comprehensive course by Prof. Abbas Firoozabadi RERI and Yale University and Prof. Gerald Fuller Stanford University Palo Alto, California
EPSRC Centre for Doctoral Training in Industrially Focused Mathematical Modelling
 EPSRC Centre for Doctoral Training in Industrially Focused Mathematical Modelling Ternary Phase Diagrams for Surfactant/Oil/Brine Mixtures Clint Wong Contents 1. Introduction... 2 2. Predicting Phase Behaviours...
ARTIFICIAL NEURAL NETWORK AND KALMAN FILTER APPROACHES BASED ON ARIMA FOR DAILY WIND SPEED FORECASTING OSAMAH BASHEER SHUKUR
 i ARTIFICIAL NEURAL NETWORK AND KALMAN FILTER APPROACHES BASED ON ARIMA FOR DAILY WIND SPEED FORECASTING OSAMAH BASHEER SHUKUR A thesis submitted in fulfilment of the requirements for the award of the
Classification of emulsifiers and stabilizers
 EMULSIONS An emulsion is a mixture of two immiscible substances whereby one substance (the dispersed phase) is dispersed in the other (the continuous phase). Example oil and water. Emulsions normally have
EMPIRICAL STRENQTH ENVELOPE FOR SHALE NUR 'AIN BINTI MAT YUSOF
 EMPIRICAL STRENQTH ENVELOPE FOR SHALE NUR 'AIN BINTI MAT YUSOF A project report submitted in partial fulfilment oftbe requirements for the award ofthe degree of Master ofengineering (Geotechnics) Faculty
ADSORPTION OF ARSENATE BY HEXADECYLPYRIDINIUM BROMIDE MODIFIED NATURAL ZEOLITE MOHD AMMARUL AFFIQ BIN MD BUANG UNIVERSITI TEKNOLOGI MALAYSIA
 ADSORPTION OF ARSENATE BY HEXADECYLPYRIDINIUM BROMIDE MODIFIED NATURAL ZEOLITE MOHD AMMARUL AFFIQ BIN MD BUANG UNIVERSITI TEKNOLOGI MALAYSIA ADSORPTION OF ARSENATE BY HEXADECYLPYRIDINIUM BROMIDE MODIFIED
Crude Oil Compatibility and Diluent Evaluation for Pipelining Parviz Rahimi and Teclemariam Alem, National Centre for Upgrading Technology (NCUT)
") NCUT National Centre for Upgrading Technology a Canada Alberta alliance for bitumen and heavy oil research Crude Oil Compatibility and Diluent Evaluation for Pipelining Parviz Rahimi and Teclemariam Alem,
NCUT National Centre for Upgrading Technology a Canada Alberta alliance for bitumen and heavy oil research Crude Oil Compatibility and Diluent Evaluation for Pipelining Parviz Rahimi and Teclemariam Alem,
Investigation of Asphaltene Stability in the Iranian Crude Oils
 Iranian Journal of Chemical Engineering Vol. 5, No. 1 (Winter), 2008, IAChE Investigation of Asphaltene Stability in the Iranian Crude Oils A. R. Solaimany Nazar, L. Bayandory Chemical Engineering Department,
INDEX SELECTION ENGINE FOR SPATIAL DATABASE SYSTEM MARUTO MASSERIE SARDADI UNIVERSITI TEKNOLOGI MALAYSIA
 INDEX SELECTION ENGINE FOR SPATIAL DATABASE SYSTEM MARUTO MASSERIE SARDADI UNIVERSITI TEKNOLOGI MALAYSIA INDEX SELECTION ENGINE FOR SPATIAL DATABASE SYSTEM MARUTO MASSERIE SARDADI A Thesis submitted in
ADSORPTION OF ACID FUCHSIN AND FAST GREEN ON ACTIVATED CARBONS
 ADSORPTION OF ACID FUCHSIN AND FAST GREEN ON ACTIVATED CARBONS By HO SOON MIN Thesis Submitted to the School of Graduate Studies, in Fulfilment of the Requirement for the Degree of Master of Science December
Understanding Surfactants and New Methods of Dispersing
 Understanding Surfactants and New Methods of Dispersing Chemists and process engineers far and wide find that their job is commonly a neverending rush to what could be made better. Ideas on how to control
INFLUENCES OF GROUNDWATER, RAINFALL, AND TIDES ON BEACH PROFILES CHANGES AT DESARU BEACH FARIZUL NIZAM BIN ABDULLAH
 INFLUENCES OF GROUNDWATER, RAINFALL, AND TIDES ON BEACH PROFILES CHANGES AT DESARU BEACH FARIZUL NIZAM BIN ABDULLAH A project report submitted in partial fulfillment of the requirements for the award of
ELIMINATION OF RAINDROPS EFFECTS IN INFRARED SENSITIVE CAMERA AHMAD SHARMI BIN ABDULLAH
 ELIMINATION OF RAINDROPS EFFECTS IN INFRARED SENSITIVE CAMERA AHMAD SHARMI BIN ABDULLAH A project report submitted in partial fulfillment of the requirements for the award of the degree of Master of Engineering
SYNTHESIS AND CHARACTERIZATION OF POLYACRYLAMIDE BASED HYDROGEL CONTAINING MAGNESIUM OXIDE NANOPARTICLES FOR ANTIBACTERIAL APPLICATIONS
 i SYNTHESIS AND CHARACTERIZATION OF POLYACRYLAMIDE BASED HYDROGEL CONTAINING MAGNESIUM OXIDE NANOPARTICLES FOR ANTIBACTERIAL APPLICATIONS SEYED ALI ASGHARZADEHAHMADI A thesis submitted in fulfillment of
UNIVERSITI TEKNOLOGI MALAYSIA
 SOL-GEL ORGANIC-INORGANIC HYBRID POLYDIMETHYLSILOXANE-3- AMINOPROPYLTRIMETHOXYSILANE AS SORBENT FOR STIR BAR SORPTIVE EXTRACTION OF ORGANOPHOSPHORUS PESTICIDES ZAFRAN BINTI HASNAN UNIVERSITI TEKNOLOGI
DETECTION OF STRUCTURAL DEFORMATION FROM 3D POINT CLOUDS JONATHAN NYOKA CHIVATSI UNIVERSITI TEKNOLOGI MALAYSIA
 DETECTION OF STRUCTURAL DEFORMATION FROM 3D POINT CLOUDS JONATHAN NYOKA CHIVATSI UNIVERSITI TEKNOLOGI MALAYSIA DETECTION OF STRUCTURAL DEFORMATION FROM 3D POINT CLOUDS JONATHAN NYOKA CHIVATSI A project
ECLIPSE Compositional Simulator: The Asphaltene Option. NTNU Lecture
 ECLIPSE Compositional Simulator: The Asphaltene Chuck Kossack Schlumberger Advisor Denver, Colorado 1 NTNU Lecture Brief overview of Asphaltene in ECLIPSE Compositional Simulator Look at theory skip keywords
COVRE OPTIMIZATION FOR IMAGE STEGANOGRAPHY BY USING IMAGE FEATURES ZAID NIDHAL KHUDHAIR
 COVRE OPTIMIZATION FOR IMAGE STEGANOGRAPHY BY USING IMAGE FEATURES ZAID NIDHAL KHUDHAIR A dissertation submitted in partial fulfillment of the requirements for the award of the degree of Master of Science
Contents. Preface XI Symbols and Abbreviations XIII. 1 Introduction 1
 V Contents Preface XI Symbols and Abbreviations XIII 1 Introduction 1 2 Van der Waals Forces 5 2.1 Van der Waals Forces Between Molecules 5 2.1.1 Coulomb Interaction 5 2.1.2 Monopole Dipole Interaction
Adsorption Processes. Ali Ahmadpour Chemical Eng. Dept. Ferdowsi University of Mashhad
 Adsorption Processes Ali Ahmadpour Chemical Eng. Dept. Ferdowsi University of Mashhad Contents Introduction Principles of adsorption Types of adsorption Definitions Brief history Adsorption isotherms Mechanism
Interfacial Phenomena
 Physical Pharmacy Lecture 4 Interfacial Phenomena Assistant Lecturer in Pharmaceutics Overview Liquid interfaces Surface tension Interfacial tension Surface free energy Measurement of tensions Spreading
UNIVERSITI PUTRA MALAYSIA
 UNIVERSITI PUTRA MALAYSIA SOLUTIONS OF DIOPHANTINE EQUATION FOR PRIMES p, 2 p 13 SHAHRINA BT ISMAIL IPM 2011 10 SOLUTIONS OF DIOPHANTINE EQUATION FOR PRIMES, By SHAHRINA BT ISMAIL Thesis Submitted to the
emulsions, and foams March 21 22, 2009
 Wetting and adhesion Dispersions in liquids: suspensions, emulsions, and foams ACS National Meeting March 21 22, 2009 Salt Lake City Ian Morrison 2009 Ian Morrison 2009 Lecure 2 - Wetting and adhesion
FOURIER TRANSFORM TECHNIQUE FOR ANALYTICAL SOLUTION OF DIFFUSION EQUATION OF CONCENTRATION SPHERICAL DROPS IN ROTATING DISC CONTACTOR COLUMN
 FOURIER TRANSFORM TECHNIQUE FOR ANALYTICAL SOLUTION OF DIFFUSION EQUATION OF CONCENTRATION SPHERICAL DROPS IN ROTATING DISC CONTACTOR COLUMN MUHAMAD SAFWAN BIN ISHAK UNIVERSITI TEKNOLOGI MALAYSIA i FOURIER
Interfacial tension, measurement, effect of surfactant on oil/water interface
 Interfacial tension, measurement, effect of surfactant on oil/water interface infusion mounting, solutions prepared from Na-oleate (M = 304,5), NaDS (Na dodecyl sulfate, M=288,4), NaDBS (Na dodecyl benzene
MICROWAVE SYNTHESIS OF SODALITE FROM COAL FLY ASH AS SOLID BASE CATALYST FOR KNOEVENAGEL REACTION MOHD HILMI BIN MOHAMED
 MICROWAVE SYNTHESIS OF SODALITE FROM COAL FLY ASH AS SOLID BASE CATALYST FOR KNOEVENAGEL REACTION MOHD HILMI BIN MOHAMED A thesis submitted in fulfillment of the requirements for the award of the degree
TABLE OF CONTENTS CHAPTER TITLE PAGE
 v ABSTRACT Fabrication of fiber coupler using fusion requires stable torch flame. Stable torch flame is needed to have a good performance of fabrication. A model was required to observe the stable by equilibrium
COMPUTATIONAL STUDY OF PROTON TRANSFER IN RESTRICTED SULFONIC ACID FOR PROTON EXCHANGE MEMBRANE FUEL CELL SITI NADIAH BINTI MD AJEMAN
 COMPUTATIONAL STUDY OF PROTON TRANSFER IN RESTRICTED SULFONIC ACID FOR PROTON EXCHANGE MEMBRANE FUEL CELL SITI NADIAH BINTI MD AJEMAN A dissertation submitted in partial fulfillment of the requirements
Reprinted from February Hydrocarbon
 February2012 When speed matters Loek van Eijck, Yokogawa, The Netherlands, questions whether rapid analysis of gases and liquids can be better achieved through use of a gas chromatograph or near infrared
3 rd Food Emulsions Short Course November 13 th & 14 th, 2008 University of Massachusetts. David Julian McClements University of Massachusetts
 3 rd Food Emulsions Short Course November 13 th & 14 th, 2008 University of Massachusetts David Julian McClements University of Massachusetts Program Objectives Review Basic Principles of Emulsion Science
SOLIDS AND LIQUIDS - Here's a brief review of the atomic picture or gases, liquids, and solids GASES
 30 SOLIDS AND LIQUIDS - Here's a brief review of the atomic picture or gases, liquids, and solids GASES * Gas molecules are small compared to the space between them. * Gas molecules move in straight lines
DYNAMIC SIMULATION OF COLUMNS CONSIDERING GEOMETRIC NONLINEARITY MOSTAFA MIRSHEKARI
 DYNAMIC SIMULATION OF COLUMNS CONSIDERING GEOMETRIC NONLINEARITY MOSTAFA MIRSHEKARI A project report submitted in partial fulfillment of the requirements for the award of the degree of Master of Engineering
Guidelines for the characterization of dispersion stability
 Provläsningsexemplar / Preview TECHNICAL REPORT ISO/TR 13097 First edition 2013-06-15 Guidelines for the characterization of dispersion stability Lignes directrices pour la caractérisation de la stabilité
FLOOD MAPPING OF NORTHERN PENINSULAR MALAYSIA USING SAR IMAGES HAFSAT SALEH DUTSENWAI
 FLOOD MAPPING OF NORTHERN PENINSULAR MALAYSIA USING SAR IMAGES HAFSAT SALEH DUTSENWAI A project report submitted in partial fulfilment of the Requirements for the award of Master of Science degree in Remote
Sanitary Engineering. Coagulation and Flocculation. Week 3
 Sanitary Engineering Coagulation and Flocculation Week 3 1 Coagulation and Flocculation Colloidal particles are too small to be removed by sedimentation or by sand filtration processes. Coagulation: Destabilization
Rheological Behaviors of Crude Oil in the Presence of Water
 Rheological Behaviors of Crude Oil in the Presence of Water Madjid Meriem-Benziane, and Hamou Zahloul International Science Index, Mechanical and Mechatronics Engineering waset.org/publication/154 Abstract
MODELING AND SIMULATION OF BILAYER GRAPHENE NANORIBBON FIELD EFFECT TRANSISTOR SEYED MAHDI MOUSAVI UNIVERSITI TEKNOLOGI MALAYSIA
 MODELING AND SIMULATION OF BILAYER GRAPHENE NANORIBBON FIELD EFFECT TRANSISTOR SEYED MAHDI MOUSAVI UNIVERSITI TEKNOLOGI MALAYSIA MODELING AND SIMULATION OF BILAYER GRAPHENE NANORIBBON FIELD EFFECT TRANSISTOR
Emulsion Droplets: Characteristics and Importance
 Emulsion Droplets: Characteristics and Importance Jochen Weiss *Food Structure and Functionality Laboratories Department of Food Science & Biotechnology University of Hohenheim Garbenstrasse 21, 7599 Stuttgart,
EVALUATION OF FUSION SCORE FOR FACE VERIFICATION SYSTEM REZA ARFA
 EVALUATION OF FUSION SCORE FOR FACE VERIFICATION SYSTEM REZA ARFA A thesis submitted in fulfilment of the requirements for the award of the degree of Master of Engineering (Electrical) Faculty of Electrical
STABILITY OF PIGMENT INKJET INKS
 Application paper (2009) 1-5 Ink STABILITY OF PIGMENT INKJET INKS Abstract Stability is a key issue for the formulator developing new inkjet ink formulations using pigments. can take place in such systems
Pharmaceutics I صيدالنيات 1. Unit 6
 Pharmaceutics I صيدالنيات 1 Unit 6 1 Rheology of suspensions Rheology, the study of flow, addresses the viscosity characteristics of powders, fluids, and semisolids. Materials are divided into two general
Critical Micellization Concentration Determination using Surface Tension Phenomenon
 Critical Micellization Concentration Determination using Phenomenon 1. Introduction Surface-active agents (surfactants) were already known in ancient times, when their properties were used in everyday
SOLUTIONS TO CHAPTER 5: COLLOIDS AND FINE PARTICLES
 SOLUTIONS TO CHAPTER 5: COLLOIDS AND FINE PARTICLES EXERCISE 5.1: Colloidal particles may be either dispersed or aggregated. (a) What causes the difference between these two cases? Answer in terms of interparticle
Module 4: "Surface Thermodynamics" Lecture 21: "" The Lecture Contains: Effect of surfactant on interfacial tension. Objectives_template
 The Lecture Contains: Effect of surfactant on interfacial tension file:///e /courses/colloid_interface_science/lecture21/21_1.htm[6/16/2012 1:10:36 PM] Surface Thermodynamics: Roles of Surfactants and
SYNTHESIS AND CHARACTERIZATION OF MESO-SUBSTITUTED PORPHYRIN MUHAMMAD TAHIR MUHAMMAD
 SYNTHESIS AND CHARACTERIZATION OF MESO-SUBSTITUTED PORPHYRIN MUHAMMAD TAHIR MUHAMMAD A dissertation submitted in fulfilment of the requirements for the award of degree of Master of Science (Chemistry)
PREDICTION OF FREE FATTY ACID IN CRUDE PALM OIL USING NEAR INFRARED SPECTROSCOPY SITI NURHIDAYAH NAQIAH BINTI ABDULL RANI
 i PREDICTION OF FREE FATTY ACID IN CRUDE PALM OIL USING NEAR INFRARED SPECTROSCOPY SITI NURHIDAYAH NAQIAH BINTI ABDULL RANI A thesis submitted in fulfilment of the requirements for the award of the Degree
429 LIGHT DIFFRACTION MEASUREMENT OF PARTICLE SIZE
 Search USP29 429 LIGHT DIFFRACTION MEASUREMENT OF PARTICLE SIZE Light diffraction is one of the most widely used techniques for measuring the size of a wide range of particles from very fine to very coarse.
Faculty of Science and Technology MASTER S THESIS. Writer: Kanchana Srisan (Writer s signature)
") Faculty of Science and Technology MASTER S THESIS Study program/ Specialization: Master of Science in Petroleum Engineering Specialization- Natural Gas Engineering Spring semester, 2016 Open / Restricted
Faculty of Science and Technology MASTER S THESIS Study program/ Specialization: Master of Science in Petroleum Engineering Specialization- Natural Gas Engineering Spring semester, 2016 Open / Restricted
DEVELOPMENT OF GEODETIC DEFORMATION ANALYSIS SOFTWARE BASED ON ITERATIVE WEIGHTED SIMILARITY TRANSFORMATION TECHNIQUE ABDALLATEF A. M.
 ii DEVELOPMENT OF GEODETIC DEFORMATION ANALYSIS SOFTWARE BASED ON ITERATIVE WEIGHTED SIMILARITY TRANSFORMATION TECHNIQUE ABDALLATEF A. M. MOHAMED A thesis submitted in partial fulfillment of the requirements
A STUDY ON THE CHARACTERISTICS OF RAINFALL DATA AND ITS PARAMETER ESTIMATES JAYANTI A/P ARUMUGAM UNIVERSITI TEKNOLOGI MALAYSIA
 A STUDY ON THE CHARACTERISTICS OF RAINFALL DATA AND ITS PARAMETER ESTIMATES JAYANTI A/P ARUMUGAM UNIVERSITI TEKNOLOGI MALAYSIA A STUDY ON THE CHARACTERISTICS OF RAINFALL DATA AND ITS PARAMETER ESTIMATES
Protein-stabilised emulsions
 Proteinstabilised emulsions Ranjan Sharma 1 Emulsion definition An emulsion consists of two immiscible liquids (generally oil and water) with one liquid forming the continueous phase while the other the
Particle Characterization Laboratories, Inc.
 Analytical services Particle size analysis Dynamic Light Scattering Static Light Scattering Sedimentation Diffraction Zeta Potential Analysis Single Point Titration Isoelectric point determination Aqueous
Solid to liquid. Liquid to gas. Gas to solid. Liquid to solid. Gas to liquid. +energy. -energy
 33 PHASE CHANGES - To understand solids and liquids at the molecular level, it will help to examine PHASE CHANGES in a little more detail. A quick review of the phase changes... Phase change Description
SYSTEM IDENTIFICATION MODEL AND PREDICTIVE FUNCTIONAL CONTROL OF AN ELECTRO-HYDRAULIC ACTUATOR SYSTEM NOOR HANIS IZZUDDIN BIN MAT LAZIM
 iii SYSTEM IDENTIFICATION MODEL AND PREDICTIVE FUNCTIONAL CONTROL OF AN ELECTRO-HYDRAULIC ACTUATOR SYSTEM NOOR HANIS IZZUDDIN BIN MAT LAZIM A project report submitted in fulfilment of the requirements
SPRAY DRIED PRODIGIOSIN FROM Serratia marcescens AS A FOOD COLORANT SHAHLA NAMAZKAR UNIVERSITI TEKNOLOGI MALAYSIA
 1 SPRAY DRIED PRODIGIOSIN FROM Serratia marcescens AS A FOOD COLORANT SHAHLA NAMAZKAR UNIVERSITI TEKNOLOGI MALAYSIA 3 SPRAY DRIED PRODIGIOSIN FROM Serratia marcescens AS A FOOD COLORANT SHAHLA NAMAZKAR
ULTIMATE STRENGTH ANALYSIS OF SHIPS PLATE DUE TO CORROSION ZULFAQIH BIN LAZIM
 i ULTIMATE STRENGTH ANALYSIS OF SHIPS PLATE DUE TO CORROSION ZULFAQIH BIN LAZIM A project report submitted in partial fulfillment of the requirement for the award of the degree of Master of Engineering
L-17 Coagulation and Flocculation Part-I. Environmental Engineering-I
 L-17 Coagulation and Flocculation Part-I Environmental Engineering-I Content Part-I Coagulation, Types of Coagulant, Part-II dosing, rapid mixing, Flocculation-design parameters. Purpose The primary purpose
SOLAR RADIATION EQUATION OF TIME PUNITHA A/P MARIMUTHOO
 SOLAR RADIATION EQUATION OF TIME PUNITHA A/P MARIMUTHOO A THESIS SUBMITTED IN PARTIAL FULFILMENT OF THE REQUIREMENTS FOR THE AWARD OF THE DEGREE OF BACHELOR OF SCIENCE AND COMPUTER WITH EDUACATION (PHYSICS)