Acid front migration during the electrolysis of clay
|
|
|
- Jessica Carter
- 6 years ago
- Views:
Transcription
1 Acid front migration during the electrolysis of clay Final Year Honours Dissertation 2008 Zoe Thiele Supervisors: Dr David Reynolds and Professor Andy Fourie
2 ABSTRACT Past and present land use practices and chemical handling practices have resulted in significant and widespread groundwater contamination issues in Australia and around the world. Remediation can be complex and expensive, and there is currently no practical option for the remediation of contaminated clay soils. Electrokinetic treatment is an innovative new method for subsurface remediation. Electrokinetic treatment involves the application of an electric field across a contaminated soil profile to remove contaminants in the soil. Direct current electric fields are used to mobilise contaminants or treatments through the soil profile. Mechanisms of electrokinetic transport include electromigration, electroosmosis and electrophoresis. During electrolysis, oxidation at the anode generates acid which migrates through the soil profile towards the cathode, whilst reduction at the cathode produces a base front which migrates through the soil towards the anode. The ph gradient generated by this process can affect electrokinetic processes and properties of the clay such as the zeta potential. The zeta potential is the difference in potential between the slipping plane in the double layer and the bulk medium, and governs some properties of electrokinetic transport such as electroosmosis. The primary aim of this study was to investigate the migration of the acid front through clay cores during electrokinetic treatment. A series of one dimensional column electrokinetic experiments were conducted on commercially available clay to investigate the development of a ph gradient during electrolysis. In addition, properties of the three clays including hydraulic conductivity, particle size distribution, buffering capacity and the zeta potential-phionic strength relationships were investigated. The migration of acid through the clay core was measured after different amounts of time by direct measurement of pore water ph. Migration of the acid front was measured in the three clays at a rate of 1.9 to greater than 2.5 cm day -1. Migration of the acid front was fastest through the clay which showed the most negative zeta potential, which may indicate electroosmosis, in addition to electrokinetic migration, was a significant transport mechanism under these conditions. (i)
3 ACKNOWLEDGEMENTS The author would like to acknowledge Dr David Reynolds and Professor Andy Fourie for guidance and feedback throughout the year. The author would also like to acknowledge Golder Associates for funding the project. Thanks also to Tim, Ming and Dan for sharing ideas, references and the laboratory space. A big thankyou to A. Prof. Yee-Kwong Leong for the zeta potential results and Stafford McKnight from the University of Ballarat for the XRD analysis. And finally, thanks to Simon for assistance with the final editing and moral support throughout the year. (ii)
4 TABLE OF CONTENTS Abstract... i Acknowledgements... ii Table of Contents... iii List of Figures... v List of Tables... vi List of Abbreviations... vii Chapter 1. Introduction General Aims and objectives of this study Chapter 2. Literature Review Properties of clays Soil structure The Electrical Double Layer Zeta Potential Hydraulic conductivity Principles of Electrolysis Transport Mechanisms Acid and base production and migration Summary Chapter 3. Research Methods Experimental Design Clay Characteristics X-ray diffraction (XRD) Grain size analysis Moisture content Unit weight Acid neutralising capacity Hydraulic conductivity testing Zeta potential determination D core experiments Intermediate Junction ph sensor Preparation of clay cores Electrolytic cell setup Measurement of the ph profile Chapter 4. Results and Discussion Clay Characteristics X-ray diffraction Grain size analysis Moisture content (iii)
5 4.1.4 Unit weight Acid neutralising capacity Hydraulic conductivity testing Baseline clay ph Zeta potential determination D core experiments Results from core experiments General observations in ph trends and clay characteristics Quality control and instrument performance Chapter 5. Conclusions and Recommendations References Appendices Appendix A Raw Data Appendix B Particle Size Analysis (iv)
6 LIST OF FIGURES Figure 1: Structure of clay minerals Figure 2: The electrical double layer Figure 3: Mechanism of Electroosmosis Figure 4: Experimental setup for determination of hydraulic conductivity using the falling head test Figure 5: PVC Core dimensions Figure 6: Electrolyte containers Figure 7: ph profile measurements Figure 8: Zeta potential for Studio Porcelain Figure 9: Zeta potential for Kagero clay Figure 10: Zeta potential for SWE clay Figure 11: Zeta potential of different clay types at 4.0 g/l NaCl Figure 12 Anolyte and catholyte ph change over time Figure 13: ph profiles for Studio Porcelain clay Figure 14: ph profiles for Kagero clay Figure 15: ph profiles for SWE clay Figure 16: Migration of ph 4 region Figure 17: Migration of ph 3 region Figure 18:Transverse variability in ph measured in a three day SP core (v)
7 LIST OF TABLES Table 1: Effective ionic mobilities of selected common anions and cations Table 2: Percentage mineral composition of clay types based on XRD Table 3: Particle size distribution of clays Table 4: Moisture content of clay types Table 5: Moisture content of SP cores after EK treatment Table 6: Unit weight of clay packed in PVC cores Table 7: Acid neutralising capacity of clay types Table 8: Hydraulic conductivity of the three clay types by the falling head test Table 9: Baseline clay ph Table 10: Migration rate of acid front by line of best fit Table 11: General observations in ph trends Table 12: Average and standard deviation of primary and duplicate ph measurements (vi)
8 LIST OF ABBREVIATIONS 1D ANC CEC DC DI EDL EK One dimensional Acid neutralising capacity Cation exchange capacity Direct current De-ionised Electrical double layer Electrokinetic H+ Hydrogen ion ISCO NaCl OH- SP XRD In situ chemical oxidation Sodium chloride Hydroxide ion Studio porcelain (clay type) X-ray diffraction (vii)
9 Chapter 1. Introduction CHAPTER 1. INTRODUCTION 1.1 GENERAL Past and present land use practices and chemical handling practices have resulted in significant and widespread groundwater contamination issues in Australia and around the world. Groundwater contamination can be detrimental to the environment, people and the economy. Groundwater remediation can be complex, expensive and often ineffective. Project timescales for groundwater remediation are often in the order of decades. While advances in remediation technology have in many instances resulted in partial contaminant removal, there is often a cost barrier and a time barrier to complete remediation of a contaminated site, with compete remediation impractical. Various remediation methods exist, such as pump and treat, in situ chemical oxidation (ISCO) and soil vapour extraction, however these methods have limitations and are only suited to particular types of soils. Remediation of low permeability media such as clays pose a significant challenge due to difficulties in mobilising the contaminant, or transporting the treatment to the contaminant. Remediation of clays using methods such as ISCO is often not feasible due to the cost and timescale of treatment. Combining electrokinetic (EK) treatment with ISCO has been shown to significantly enhance transport of treatment to contaminant, resulting in reduced timescales and cost of remediation. Electrokinetic treatment is an innovative new method for subsurface remediation. EK treatment involves the application of an electric field across a contaminated soil profile to remove or reduce contaminants in the soil. Direct current (DC) electric fields are utilised to mobilise contaminants or treatments through the soil profile. Mechanisms of electrokinetic transport include electromigration, electroosmosis and electrophoresis. While overall mechanisms governing electrokinetic transport are generally well described (1993; Alshawabkeh 2001; Isosaari et al. 2007), there are many complex and interacting processes governing the system due to heterogeneous geochemical behaviour (Eykholt and Daniel 1994; Denisov et al. 1996; Alshawabkeh et al. 2004; Isosaari et al. 2007). Further work is required before EK treatment can be utilised as a viable remediation option. 1.1
10 Chapter 1. Introduction In order to improve the feasibility of EK treatment as a remediation option, research at the University of Western Australia (UWA) is currently looking into developing a threedimensional, coupled hydraulic and electrokinetic flow and reactive solute transport model. The focus of this research group is in developing the technology which will enable the remediation of low permeability contaminated soils, for which currently there is no practical solution. This project was aimed at investigating the geochemistry of EK treatment in three clays whilst also providing baseline data, which will be suitable for the validation of models to simulate electroosmosis, electromigration, electrolysis, and ph changes. 1.2
11 Chapter 1. Introduction 1.2 AIMS AND OBJECTIVES OF THIS STUDY The aim of this study was to investigate the geochemistry of EK treatment, with application to the field of electrokinetic remediation of low permeability media, and to provide baseline data which can be used for the validation of EK treatment modelling. Three main objectives were defined to address this aim. These objectives are outlined below. Objective 1: To obtain three different commercially available clays and investigate physical/chemical parameters of these clays. Commercially available clay types were chosen based on initial zeta potential testing to ensure the three clays showed different zeta potential/ph relationships. Other parameters which were measured to classify the clay included grain size distribution, hydraulic conductivity, acid neutralising capacity (ANC), density, moisture content and x-ray diffraction (XRD). Objective 2: To quantify the relationship between ph and zeta potential in three different clay types. Baseline data was collected to quantify the relationship between ph and zeta potential in three different clay types and at different salt concentrations. This was used to give an indication of differences between the three clays and the indicative zeta potential for the in situ clay cores. Objective 3. To quantify 1D acid/base migration during electrolysis of three clay types. One-dimensional column tests were conducted, measuring the changes in ph along the core profile over time. Three different clay types were investigated at a constant voltage. Time treatment ranged from 1 to 5 days. 1.3
12 Chapter 2. Literature Review CHAPTER 2. LITERATURE REVIEW From a soil remediation perspective, the potential for EK enhanced remediation was initially observed as a method for transporting contaminants (such as heavy metals) through the soil profile for treatment or removal (Acar and Alshawabkeh 1996; Denisov et al. 1996). EK applications have also included electroosmotic dewatering and consolidation in geotechnical applications (Eykholt and Daniel 1994; Alshawabkeh et al. 2004). More recent studies have shown EK treatment as being effective in transporting treatment chemicals such as oxidants through the contaminated soil profile, for in situ remediation (Roach and Reddy 2006; Isosaari et al. 2007; Reynolds et al. 2008). EK remediation has even been utilised to transport polycyclic aromatic hydrocarbon degrading bacteria through soil (Wick et al. 2004). Various studies have already shown the success of combining EK with ISCO (Roach and Reddy 2006; Reynolds et al. 2008), however further research is required to develop the method to be a commercially viable remediation option. The following sections outline the properties of clay necessary for understanding some of the electrochemical phenomena that occur during EK treatment, and then goes on to describe some of the physical processes behind electrochemical remediation of low permeability media. The literature review concludes with a discussion of aspects relating to the production and migration of acid and base through the clay profile, which is the focus of the present study. 2.1 PROPERTIES OF CLAYS Soil structure Whilst clays are defined as fine grained soils (typically grain size less than mm), it s their unique structural characteristics that differentiate them from other soils. It is important to note that clay minerals are different to clay size minerals, as any mineral can be of clay particle size (Gerrard 2000). Non clay minerals of clay particle size are commonly referred to as silts. The building blocks of clay minerals include a basic structural unit of a silica tetrahedron and an alumina octahedron (Craig 1987). The silica tetrahedron consists of a central silica cation, surrounded by four oxygen anions. This forms a silica layer by linking together and sharing oxygen atoms to balance charge. The alumina octahedron structural unit consists of a central aluminium atom with six oxygen or hydroxyl atoms in an octahedron 2.1
13 Chapter 2. Literature Review (Budhu 2007), which also joins to other octahedral units to form a alumina layer. The layering of these silica and alumina sheets form the basic units of the different clay types. The three main groups that make up common clays include kaolinite, illite and montmorillonite (Budhu 2007). Kaolinite, one of the more common clay types, is classified as a two layer clay, with a sheet of silica tetrahedra joined through octagonal hydroxyls with an alumina octahedral sheet (Murray 1999). The surfaces of the kaolinite sheets are theoretically electrically neutral, however at the edges of the 1:1 layer, the surfaces are disrupted and hydroxyl groups occupy sites of broken bonds (Alkan et al. 2005). Figure 1: Structure of clay minerals The silica tetrahedron and the alumina octahedron structural units shown in the left hand panels combine in layers to form Kaolinite, Illite and Montmorillonite clays shown in the right hand panel. Figure adapted from Budhu (2007). 2.2
14 Chapter 2. Literature Review Illite consists of one alumina sheet between two silica sheets, with a layer of potassium ions binding successive layers together (see Figure 1). Montmorillonite has a similar structure, however the silica-alumina-silica layers are joined by weak van der Waals forces and exchangeable ions (Budhu 2007). Montmorillonite is commonly referred to as swelling or expansive clay, as the weak bonding between the silica-alumina-silica layers allows for substantial ingress of water. Some of the important properties that characterise clay minerals are particle size and shape, surface chemistry, surface area, surface charge and plasticity (Murray 1999). Determination of soil structure A common semi-quantitative method of analysis for fine grained sediments such as clays is XRD (Poppe et al. 2001), which utilises x-rays (electromagnetic radiation with wavelength in the order of 10-8 to m). X-rays can be produced from bombarding a metal target with high energy electrons and are useful in the study of crystal structure as they have wavelengths which are comparable to the atomic separation distance in solids (Serway and Beichner 2000). Each different clay type will have a different crystalline lattice structure, hence will diffract x- rays in a characteristic pattern (Poppe et al. 2001). This can be used to identify clay samples against a reference library and can also be used to asses mineral composition of mixed materials. The result is semi quantitative as the intensity of a minerals diffraction peaks does not represent an accurate measure of abundance. This is because different minerals and different atomic planes within a mineral will vary in their ability to diffract x-rays (Poppe et al. 2001). It also depends on the sample mount and x-ray machine conditions, which vary between laboratories The Electrical Double Layer There are a number of increasingly complicated models describing the distribution of charge around a solid layer. One way to describe and visualise surface characteristics is known as the diffuse double layer or electrical double layer (EDL), although it is often described as the electrical interfacial layer, as a two layer model can be simplistic for many applications (Delgado et al. 2007). In the majority of cases the surface of a clay particle is negatively charged due to the presence of broken bonds and isomorphous substitution (Alshawabkeh et al. 1999; Aydin et al. 2004; Laxton and Berg 2006). Electrical neutrality is maintained in the 2.3
15 Chapter 2. Literature Review solid state through a layer of adsorbed cations, which in solution diffuse away from the particle surface to form EDL (Alshawabkeh 1999). The EDL region contains a higher proportion of cations than the bulk solution, which are pulled towards the solid particle surface by electrostatic attraction and away by diffusion into the bulk solution (see Figure 2). Close to the solid surface is a region of bound ions, which may be bound by purely Columbic interactions or by a special chemical affinity to the particle surface (Delgado et al. 2007). The bound layer is also known as the Stern layer or hydrodynamically stagnant layer. Beyond the bound layer is a diffuse layer with a higher concentration of cations than the bulk solution, which merges into the neutral bulk solution. The ions in the EDL are exchangeable, in that they can be replaced by different ions having the same net charge. Figure 2: The electrical double layer The diffuse double layer or EDL is formed by the electrostatic attraction of cations to the net negative charge on the clay particle surface. This results in a region surrounding the solid particle with a higher proportion of cations than the bulk solution. Figure from Gillen (2006). The thickness of the EDL is variable and is a function of ph, electrolyte concentration and electrolyte type (Alkan et al. 2005). The net charge of the particles in the EDL is approximately equal to and opposite to the net charge on the particle (Vane and Zang 1997). If the pore water contains a higher concentration of ions, this will mean that to achieve electrical neutrality, a smaller volume of pore fluid is required in the EDL, hence the thickness of the EDL is smaller. The individual ions in the EDL can carry different charge 2.4
16 Chapter 2. Literature Review (for example calcium ions Ca 2+ and sodium ions Na + ), which will change the thickness of the EDL, as only half as many calcium ions as sodium ions would be required for electrical neutrality. Hence electrolyte type will also determine the thickness of the EDL. Pore water ph also plays a major role in the EDL, however this can be complicated and non-linear. The interaction and exchange of H + and OH - ions with bound ions can increase or decrease the thickness of the double layer. A term for describing the number of exchangeable cation sites on a clay mineral is known as the cation exchange capacity (CEC). An exchange of bound ions with ions in solution can occur if the bonding is not too strong and the sites are accessible to the soil solution (Troeh and Thompson 2005). The CEC of kaolinite (typically 3-15 meq/100g) is much lower then many other clay minerals, such as illite (20-40 meq/100g) and smectite ( meq/100g), due to its 1:1 silicate structure which does not allow for cation exchange between layers (Troeh and Thompson 2005). While in most cases cation exchange dominates clay minerals, anion exchange is also possible due to broken edge bonds. Broken edge bonds can be either positive or negative and result from the termination of the continuous ionic sequence which makes up the clay lattice structure. Anions or cations are required at these edges for electrical neutrality and in some cases these are exchangeable, contributing to the cation or anion exchange capacity (Troeh and Thompson 2005) Zeta Potential The zeta potential is the difference in potential between the slipping plane in the EDL and the bulk medium. The surface charge on a discrete clay particle is generally negative, resulting in a negative zeta potential. As the zeta potential is related to the properties of the EDL as described above, factors that effect the EDL will also change the zeta potential. These factors include pore fluid ionic strength (determined by concentration and composition) and ph. The relationship between ph and zeta potential is complex and depends on the clay properties and the properties of the pore fluid. In some cases the zeta potential is reported to decrease linearly with the logarithm of the ph of the soil medium (Acar and Alshawabkeh 1993). The isoelectric point is defined as the ph value at which the zeta potential is zero (Greenwood et 2.5
17 Chapter 2. Literature Review al. 2007). At low ph, the magnitude of the zeta potential may become positive below the isoelectric point, depending on the surface chemistry and characteristics of the clay (Thepsithar and Roberts 2006). The relationship between ph and zeta potential is also highly dependent on the concentration and type of ions present in the pore fluid. There is no general relationship between the zeta potential-ph curve and pore water ionic concentration, as different ions can increase or decrease the magnitude of zeta potential with regard to ph. Studies by Kaya and Yukselen (2005) demonstrated that in the presence of alkali earth ions (LiCl and NaCl), the zeta potential of quartz powder and kaolinite become more negative over a range of ph values. However, the opposite was observed for CaCl 2 and the hydrolysable heavy metals such as Zn 2+ and Cu 2+, and results for montmorillonite were often opposite to those obtained for kaolinite (Kaya and Yukselen 2005; Kosmulski and Dahlsten 2006). Measurement of zeta potential The zeta potential is a property of charged interfaces and should be independent of the technique used for its measurement (Delgado et al. 2007). There is currently no method to measure zeta potential directly, however there are a number of ways it can be quantified through measurement of its influence on particle behaviour. In most cases to measure zeta potential of clay requires a colloidal solution of discrete clay particles and properties of the movement of the clay particles are measured. One such method involves using optical methods to measure particle velocity in a applied magnetic field. Optical methods measure light scattering off moving particles. For this method samples need to be a very dilute colloid solution (Vane and Zang 1997). Zeta potential can also be measured by electroacoustics, which allows for pastes or slurries to be measured. An alternating voltage across the colloidal solution causes the charged particles to oscillate at the same frequency, generating soundwaves that are measured over a range of frequencies (Shilov et al. 2004). The larger the zeta potential the faster the particle moves, generating stronger sound waves (Greenwood et al. 2007). The method of electroacoustics also allows for simultaneous measurement of the zeta potential and particle size, and allows for measurements of much more concentrated solutions than other techniques (Greenwood 2003). Electroacoustics can also refer to measurement of the reciprocal mechanism, whereby a sound wave passes though the medium, generating a macroscopic potential difference called the ultrasonic vibration potential effect (Greenwood 2003). 2.6
18 Chapter 2. Literature Review Hydraulic conductivity It is well established that the flow of water through saturated soil can be represented by Darcy s law (Equation 1). q=aki Equation 1 v x =q/a=ki Equation 2 Where q is the volume of water flowing per unit time, A is the cross sectional area of soil corresponding to the flow and k is the hydraulic conductivity (also known as coefficient of permeability). This can also be written in the form of Equation 2, where v x is the average flow velocity and i is the hydraulic gradient, also written as dh/dx, which is the change in hydraulic head H over a distance dx (Craig 1987). Darcy s law is valid for all soils where the flow is laminar (Budhu 2007). The average flow velocity calculated by the expression above is the flow divided by the entire cross sectional area. As flow in saturated soil medium only occurs through the interconnected pore space, another term to describe the flow velocity accounting for porosity is the seepage velocity (Equation 3) v s =v x /n Equation 3 Where n is the porosity of the soil, which is the ratio of the volume of voids to the total volume (Budhu 2007). The hydraulic conductivity ranges in the order of 1 cm/s in clean gravels to 1x10⁻⁷ cm/s in some clays (Budhu 2007). Hydraulic conductivity can vary depending on soil type, particle size, pore fluid properties, void ratio, pore size, homogeneity (layering and fissuring) and entrapped gasses (Budhu 2007). 2.7
19 Chapter 2. Literature Review 2.2 PRINCIPLES OF ELECTROLYSIS An electrolytic cell is an electrochemical cell in which a non-spontaneous reaction is driven by an external source of current. Oxidation is defined as the removal of electrons from a species and in a electrolytic cell oxidation reactions occur at the anode. Reduction is the addition of electrons to a species and occurs at the cathode. In a basic electrochemical cell the predominant redox reaction is often the dissociation of water into hydrogen ions and hydroxide ions producing hydrogen and oxygen gas (Alshawabkeh et al. 2004). Anode half reaction: 2H 2 O O 2 + 4H + 4e- (E o =-1.229) Cathode half reaction: 2H 2 O + 2e- H 2 + 2OH- (E o =-0.828) The standard reduction potential, E 0, is a measure of the tendency of the reactants in their standard states to proceed to products in their standard states (Acar and Alshawabkeh 1993). Secondary reactions can occur at the anode and cathode due to the reduction and oxidation of other constituents in the anolyte and catholyte. The type of reactions occurring at the electrodes is dependent on the concentration of species and electrochemical potential of redox reactions (Acar and Alshawabkeh 1993) and the standard reduction potential for the redox reaction. For example other reactions that may occur at the cathode include the production of hydrogen gas from hydrogen ions and the precipitation of metals from metal ions and metal hydroxides (Acar and Alshawabkeh 1993) Transport Mechanisms Mechanisms of electrokinetically induced transport include electromigration, electroosmosis and electrophoresis (Acar and Alshawabkeh 1993). The relative contribution of each transport mechanism to the total mass transport depends on soil properties such as pore water composition, soil type, water content and processing conditions (Acar and Alshawabkeh 1993). Diffusion and advection can also contribute to transport during EK treatment. 2.8
20 Chapter 2. Literature Review Electromigration Electromigration is the movement of ionic species due to an applied electric field. Negative ions (anions) move towards the positively charged anode and positive ions (cations) move towards the negatively charged cathode. This movement is dependent on the applied electric field and the effective ionic mobility. The effective ionic mobility of an ion is a function of its molecular diffusion coefficient, soil porosity, tortuosity factor and charge (Acar and Alshawabkeh 1993). The effective ionic mobility can be estimated by assuming the Nerst- Townsend equation (Equation 4) is valid for ions in the pore fluid of a saturated soil medium. u * j * D j z j F = u jτ n = Equation 4 RT Where u * j is the effective ionic mobility, u j is the ionic mobility in free solution, τ is the tortuosity factor, n is the porosity factor, D * j is the effective diffusion coefficient, z j is the valence of the ion, F is faradays constant, R is the universal gas constant and T is the absolute temperature (Acar and Alshawabkeh 1993). The velocity and migrational flux of a species under electrical potential gradients only can then be defined as Equation 5 and Equation 6. v m * d = u j ( E) Equation 5 dx J m j * d = u jc j ( E) Equation 6 dx Where E is the electric potential, c j is the molar concentration v m, is the velocity of an ion and J j m is the migrational flux. The effective ionic mobility for the hydrogen ion and the hydroxide ion are reported at much higher magnitude than other common ions such as sodium or nitrate (Acar and Alshawabkeh 1993). This is due to their interaction with water molecules in solution and is discussed in more detail later in this chapter. The effective ionic mobilities for some common ions (assuming a clay with porosity 0.6 and average tortuosity of 0.35) are included in Table
21 Chapter 2. Literature Review Table 1: Effective ionic mobilities of selected common anions and cations Common cations Effective ionic mobility (x10 6 cm 2 /Vs) Common anions Effective ionic mobility (x10 6 cm 2 /Vs) H OH Na NO 3 2- Ca CO Table values from Acar and Alshawabkeh (1993) Electrophoresis Electrophoresis is the transport of charged solids suspended in liquid (colloids) and macromolecules under an electric field (Lee 2005). Electrophoresis does not play a major role in mass transport through saturated clay cores but has been observed where micelles are formed due to the addition of surfactants or in remediating slurries (Acar and Alshawabkeh 1993). The phenomenon of electrophoresis can be used to measure zeta potential of clay particles suspended in solution. Electroosmosis Electroosmotic flow refers to the bulk pore fluid flow through a soil medium under an applied electric field. Under the influence of an electric field, the mobile layer of cations in the EDL move towards the cathode. This net migration of cations in the EDL drags the pore water with it, resulting in a hydraulic flow (Alshawabkeh et al. 1999). This mechanism is most apparent in fine grained soils. If the soil pore is idealised as a capillary, fine grained soils have a larger number of capillaries of smaller diameter than coarse grained soils. Thus the influence of the EDL on the net pore water in fine gained soils is proportionately greater, resulting in greater movement of pore water. In addition, electroosmosis is most significant when the pore water ion concentration is low (Ottosen et al. 2008). 2.10
, k e is the coefficient of electroosmotic conductivity (m 2 /V-s), i e is the electric field strength (V/m) and A is the")
22 Chapter 2. Literature Review Electroosmotic flow can be related empirically to the applied electric field by Equation 7. Q e = k e i e A Equation 7 Where Q is the fluid volume flow rate (m 3 /s), k e is the coefficient of electroosmotic conductivity (m 2 /V-s), i e is the electric field strength (V/m) and A is the cross sectional area. By this model electroosmotic flow is dependent on the coefficient of electroosmotic permeability (k e ) which is a empirical measure of the fluid flux per unit area of the soil per unit electric gradient (Alshawabkeh 2001). The k e value is dependent on zeta potential, viscosity of the pore fluid, porosity and electrical permittivity of the medium. Figure 3: Mechanism of Electroosmosis When a DC current is applied across a saturated soil profile, the movement of cations in the electrical double layer drags the bulk solution with it, resulting in movement of the bulk solution towards the cathode in most clays (Vane and Zang 1997). Zeta potential controls the direction and magnitude of the electroosmotic flow (Thepsithar and Roberts 2006). The magnitude of the zeta potential controls the magnitude of osmotic flow, whilst the sign controls the direction (Kaya and Yukselen 2005). Electroosmotic flow is usually in the direction of the cathode due to soil surface having a net negative charge, resulting in a negative zeta-potential, however the direction can be reversed under conditions 2.11
23 Chapter 2. Literature Review of positive zeta potential. As discussed in Section 2.1.3, some clays with certain pore water compositions can exhibit a positive zeta potential for low ph ranges. Whilst the ph of the pore fluid is above the ph value at the iso-electric point, electroosmotic flow will be towards the cathode, however if it drops below the iso-electric point, flow may reverse and be in the direction of the anode (Thepsithar and Roberts 2006). Electroosmotic flow depends mainly on the porosity, applied voltage gradient and the zeta potential of the soil matrix and is independent of the pore size distribution and the presence of macro pores (Acar and Alshawabkeh 1993; Isosaari et al. 2007). This gives electroosmotic flow an advantage at generating uniform fluid and mass transport in fine grained soils over hydraulic gradients, which are highly dependent on the soil fabric and macro-structure (Acar and Alshawabkeh 1993). While the hydraulic conductivity of soils can vary by many orders of magnitude, the coefficient of electroosmotic conductivity is generally in the range of 1x10⁻⁹ to 1x10⁻⁸ m 2 /V-s (Alshawabkeh et al. 1999). Optimising electroosmotic flow is complex and highly dependent on clay and pore water chemistry (Isosaari et al. 2007). Studies have been conducted in enhancing the zeta potential in order to optimise electroosmotic flow (Popov et al. 2004). While the ph of the pore water is a dominant variable controlling processes such as zeta potential and electroosmosis, the extent to which this occurs is highly dependent on clay type (Eykholt and Daniel 1994). Diffusion and advection in a saturated soil medium Whilst not an electrokinetically driven process, diffusion and advection can play a significant role during EK treatment. Diffusion can be significant depending on time and length scales and due to the enhanced chemical gradients which are produced in the soil during EK treatment. Diffusion in a saturated soil matrix differs from diffusion in aqueous solution as the flow paths for diffusion are much longer and more tortuous (Yeung and Datla 1995). The effective diffusion coefficient may be empirically defined by Equation 8. D i * = τ x D i Equation 8 Where D * i is the effective diffusion coefficient of species i, D i is the diffusion coefficient of species i in free solution and τ is the tortuosity of soil ranging from 0 to 1 (Yeung and Datla 2.12
24 Chapter 2. Literature Review 1995). D i can be obtained from literature, and with the measurement of D * i, a value for τ can be obtained experimentally (Yeung and Datla 1995). Advection of species during EK treatment can result from hydraulic gradients, which may either be present from external processes (for example if the technique was applied to a soil profile with groundwater flow, or to enhance pump and treat systems) or from internal processes relating to EK treatment. Non-uniform pore pressure distributions can develop across the soil profile during EK treatment and these can result in hydraulic gradients driving advection processes (Yeung and Datla 1995) Acid and base production and migration Oxidation at the anode generates acid that migrates through the soil profile towards the cathode. Reduction at the cathode produces a base front that migrates through the soil towards the anode (Acar and Alshawabkeh 1993). The rate at which the acid front and base front will migrate through the soil profile depends on many complex and interacting factors relating to the soil properties and electrokinetic treatment. The effective ionic mobility s of the hydrogen ion and the hydroxide ion are reported as significantly higher than other common ions. This is due to transfer mechanisms within and between water molecules. The hydrogen and hydroxide ions are able to be transferred through a series of hydrogen bonded water molecules by rearrangement of hydrogen bonds in a string of aligned water molecules. While it is common to refer to the hydrogen ion as a free ion in solution, this is a simplified model. A lone proton in solution has a very high charge density and has a strong attraction to surrounding water molecules and will bond covalently to one of the lone electron pairs to form a hydronium ion, H 3 O +, which is also attracted by hydrogen bonds to several other water molecules, forming a mixture of species with the general formula of H(H 2 O) + n (Silberberg 2000). Whist the detail of the mechanism is still not fully understood, the suggestion that the effective movement of a proton involves the rearrangement of bonds in a group of water molecules is known as the Grotthuss mechanism (Atkins and de Paula 2002). Agmon (1995) suggested the mechanism for this involves the H 9 O + 4 unit, which is a trigonal planer H 3 O + ion linked to three H 2 O molecules. A rapid re-orientation of this arrangement results in a new 2.13
25 Chapter 2. Literature Review H 9 O + 4 cluster in which the positive charge is located one molecule across from its original location (Atkins and de Paula 2002). Regardless of the detail of the mechanism, the measured ionic mobility of H +, and to a lesser extent OH -, is significantly higher then other ions, as shown in Table 1. Acar and Alshawbkeh (1993) reported the base front which developed at the cathode in kaolinite will first advance towards the anode by ionic migration and diffusion, but its migration will be impeded due to the neutralisation from hydrogen ions migrating in the opposing direction. In addition, the acid front advancing through the soil from the anode to the cathode has been observed as resulting in a decrease in the electroosmotic permeability associated with an increase in conductivity in the anode compartment and a corresponding drop in zeta potential (Acar and Alshawabkeh 1993). The establishment of a ph profile across the clay also results in a zeta potential gradient, with the increase in ph at the cathode resulting in the zeta potential becoming more negative, and the decrease in ph near the anode resulting in the zeta potential becoming less negative (Kaya and Yukselen 2005). Acid production and migration can be beneficial in cases where the objective is to achieve the mobilisation of metals, however it can be detrimental in some applications. Changes in ph can have a complicating effect during EK enhanced ISCO, and in some cases ph gradients across the soil profile are undesirable. For example the mechanism of oxidation of phenol by permanganate is complex and highly dependent on ph (Roach and Reddy 2006; Thepsithar and Roberts 2006) and ph profiles can significantly complicate the process. In cases where the ph gradient needs to be minimised, the production of acid and base at the electrodes can be controlled through the use of buffers in the anolyte and catholyte. In addition the extent to which the acid front moves through the soil depends on the buffering capacity of the clay, which is also highly variable between different clay types. The buffering capacity describes the process whereby ions adhered to the clay particle surface can exchange with the H + and OH - ions, removing them from the pore water and preventing migration of ions adsorbed to the immobile surface (Acar et al. 1993). The lower cation exchange capacity of kaolinite clays is reported to result in a much lower buffering capacity compared with other clay minerals such as illite or montmorillonite (Acar and Alshawabkeh 1993). Various methods have been developed to control the electrolyte ph to suppress or enhance the effect of acid or base migration through the soil profile (Lee and Yang 2000). One method is 2.14
26 Chapter 2. Literature Review to introduce weak acids or bases into the respective electrolyte compartments to neutralise any acid or base produced, for example the addition of acetic acid to the cathode to neutralise hydroxyl ions (Alshawabkeh et al. 1999). For cases where an acidic medium is preferred for the removal of metals, selective membranes have also been investigated for preventing migration of hydroxyl ions (Alshawabkeh et al. 1999). 2.3 SUMMARY Whilst it is well established that acid and base production and migration through the clay core will occur during EK treatment, it has been shown that there are many complex and interacting mechanisms which cause migration. Properties of the clay will effect the timing and extent to which migration by electrokinetic or electroosmotic mechanisms will occur. More research is required, looking into how variations in clay composition will affect the EK migration mechanisms during treatment. 2.15
27 Chapter 3. Methodology CHAPTER 3. RESEARCH METHODS 3.1 EXPERIMENTAL DESIGN The objectives of this study were to investigate some of the physical/chemical properties of three different clays types, to quantify the relationship between ph and zeta potential in these clays and to perform a series of 1D electrolysis tests to observe acid/base migration. The following sections outline the experimental tests used to address each of these objectives. 3.2 CLAY CHARACTERISTICS Three commercially available clay types were chosen for this study based on advice from the manufacturer on compositional differences and some preliminary testing to ensure the zeta potential-ph relationship differed between the three clay types. Commercial clay was chosen in preference to finding a natural clay source as it allowed for large quantities of relatively homogeneous clay to be obtained for this and future studies within reasonable cost and time constraints. The three clays are mixtures consisting of a kaolin component. The clay types selected for analysis were Clayworks Studio Porcelain (SP), Kagero (K), and SWE X-ray diffraction (XRD) To examine the composition of the three clay types, samples were sent for XRD analysis to the University of Ballarat. Prior to sample submission, a 10 g subsample of each clay was dried in an oven at approximately 105ºC for two days. These were then crushed using a mortar and pestle and air-freighted to the University of Ballarat for analysis. X-ray diffraction traces were obtained from the powdered samples with Siemens D500 and D501 diffractometers using Fe-filtered CoK α radiation. The operating conditions were 40kV/30mA, step scan 0.02θ/2θ at 1 o /2θ/min, with a fixed 1 o divergence and receiving slits and a 0.15 o scatter slit (pers com McKnight 2008). Additional traces were obtained from air-dried and glycolated mounts prepared by sedimentation in 1% sodium hexaphosphate aqueous suspensions. The mineral phases present were identified by computer-aided searches of the 2007 ICDD PDF4/Minerals subfile 3.1
28 Chapter 3. Methodology and the USGS Clay Flowsheet (Poppe et al. 2001). Quantitative XRD results were obtained using SiroQuant ver 3.0, which is a whole pattern Rietveld analysis technique and refinement of the most suitable mineral structures available in the current software package databank (pers com McKnight 2008). Results from this method are regarded as semiquantitative Grain size analysis Clay samples were sent to Golder Associates Perth Laboratory for grain size analysis and Atterberg limits. Tests were carried out in accordance with Australian Standard AS1726-Soil Classification. Sieve analysis determined the percentage composition of coarse grained soils (75 to mm) through analysis of the mass of soils passing through successively finer sieve mesh. Fine grained particles (less then 0.075) require hydrometer analysis, which involved mixing a small amount of soil into a suspension and allowing to settle over time (Budhu 2007). The larger particles settle fastest, resulting in a layered profile according to grain size. This is measured using hydrometer which is lowered into suspension and will sink to a position where the buoyancy force balances the weight of the hydrometer, giving a reading of density of the suspension at different times (Budhu 2007) Moisture content Moisture content is defined as the weight ratio of water to solids. Moisture content was measured for the three clay types to determine variation in moisture content between clay types and consistency of moisture content within each clay type. For each moisture content determination, a small amount (roughly 20 g) of wet clay was weighed accurately in a small aluminium foil tray which was pre-weighed. This was then placed in an oven at 105ºC and left for a minimum of two days. The dry sample and aluminium tray were weighed immediately upon removal from the oven. Moisture content was calculated as: w = W w /W s x 100% Equation 9 Where w is the moisture content expressed as a percentage, W w is the weight of water (given by the weight of the wet sample minus the weight of the dry sample) and W s is the weight of the dried sample. 3.2
29 Chapter 3. Methodology Unit weight The unit weight or density is the weight of soil per unit volume and is dependent on moisture content. The unit weight was measured for the three clays to quantify differences between clay types and as a quality control procedure to check the consistency of packing into PVC cores for the column experiments. The unit weight was measured by weighing a PVC core of known dimensions, packing clay into the PVC core, then weighing the PVC and clay, ensuring the open ends of the PVC core were packed flat (no protruding clay or void space). Unit weight was then calculated by Equation 10. γ = W/V Equation 10 Where γ is the unit weight, W is the weight of packed clay (given by the total weight of PVC and packed clay minus the weight of the PVC core) and V is the internal volume of the PVC core Acid neutralising capacity Samples of the three clays were submitted to the analytical laboratory ALS for the determination of acid neutralising capacity (ANC). Samples were dried at 85ºC prior to testing. The standard method ALS uses in the determination of ANC is referenced as USEPA 600/ , and involves a fizz test to semi-quantitatively estimate the likely reactivity, prior to acid titration. The sample is then reacted with an excess quantity of acid. Acid titration is used to determine the amount of acid that has not reacted with the clay and this is used in comparison to a blank titration to calculate the ANC, which is reported as kg H 2 SO 4 equivalent or converted into %CaCO Hydraulic conductivity testing The hydraulic conductivity of the clays was determined using the falling head test (Craig 1987), which is a test suited to fine grained soils such as clays. Figure 4 shows the setup for the measurement of k includes a cylindrical core with the specimen, which has coarse filter paper at each end to prevent loss of sample, a standpipe to measure change in hydraulic head with internal area a, and a constant head reservoir at the outlet. 3.3

30 Chapter 3. Methodology Figure 4: Experimental setup for determination of hydraulic conductivity using the falling head test. The change in hydraulic head is measured over time to determine flow through the sample. The time, t 1, for the water to fall from h 0 to h 1 is measured. Given a cylindrical core specimen of length l and internal cross sectional area A, the hydraulic conductivity is obtained by applying Darcy s law: dh h a = Ak Equation 11 dt l h 1 1 dh Ak a = dt Equation 12 h l h 0 0 t al At 0 k = Equation ln h h Hydraulic conductivity is a property of the clay and the pore fluid. The fluid used to determine hydraulic conductivity was de-ionised (DI) water with a small amount of sodium chloride (NaCl) salt added to make a solution of 0.4 g/l NaCl, which is consistent with the electrolyte solution used in the EK tests. The top of the standpipe was covered to minimise loss of solution by evaporation. 3.4
31 Chapter 3. Methodology Zeta potential determination Clay samples for zeta potential testing were prepared by first drying the sample in an oven at approximately 105ºC for two days. Dried samples were then ground into fine powder using a mortar and pestle. Approximately 21g of clay powder was added to 119 g of laboratory deionised water or a salt solution. Salt solutions were made up with the addition of sodium chloride salt (Ajax fine chem. analytical reagent A465-5KG) to laboratory DI water to the desired concentration. All weight measurements were accurate to g. The clay powder and water mixture was then shaken vigorously by hand to disperse the clay powder into the solution. Zeta potential determination was carried out in the Surface Forces and Dispersion Rheology Laboratory in the School of Mechanical Engineering at UWA by A. Prof. Yee-Kwong Leong. Samples were diluted with the appropriate salt solution to 260ml and then sonicated (Sonics Vibracell TM ) for 30 seconds prior to zeta potential measurement to homogenise the solution and break any agglomerates. Zeta potential measurements were measured using a ZetaProbe, which utilises the principle of electroacoustics to determine zeta potential. This principle is discussed in Section The ZetaProbe is capable of taking single point measurements, or titrating ph to get a relationship between ph and zeta potential for the sample. The particle density and concentration were determined for the calculation of the solids volume fraction required in the calculation of zeta potential. The Kagero clay contained a relatively large amount of coarse grained material in the samples that needed to be removed by sedimentation prior to dilution with the appropriate salt solution and sonification. After sonification a sample of these slurries was collected for solids content determination. Zeta potential-ph curves were determined for each of the three clays using DI water, 0.4 mg/l NaCl, and 4 mg/l NaCl solution D CORE EXPERIMENTS Column experiments utilised a similar physical setup as used by Lee (2005), Gillen (2006) and Reynolds et al. (2008). An electric current was passed through clay packed into PVC 3.5

32 Chapter 3. Methodology sleeves and sealed between two plastic vessels to hold the electrolyte solution and the electrodes Intermediate Junction ph sensor An intermediate Junction ph sensor (Ionode TM IJ44) was used to determine ph. The ph sensor was chosen specifically for its ability to be inserted directly into fine sediment. In the standard electrode design, a porous membrane (typically ceramic) will separate the reference fluid within the sensor from the sample electrolyte. If this becomes clogged, the movement of ions across the membrane is restricted and the probe returns erroneous readings, making this type of probe unsuitable for direct measurement of soft solids such as clay. The intermediate junction ph sensor contains an electrolyte reference gel contained within a removable plastic sleeve, allowing a small amount of unrestricted movement of the electrolytes where the sleeve contacts the main stem. With regular removal, cleaning and replacement of the electrolyte gel, this design allows for restricted solution contact without a porous membrane that would be prone to clogging Preparation of clay cores Clay was packed into PVC sleeves for electrokinetic treatment. The PVC sleeves were 99.1 mm long (x direction) with an internal diameter of 43.9 mm (Figure 5). This gave an internal volume of 150 cm 3. The clay was packed into the sleeve by inserting the sleeve into a solid block of clay, and trimming the clay at the open ends. Cores were then weighed to determine unit weight using the method described in This was performed to identify any inconsistency in packing. Figure 5: PVC Core dimensions 3.6
33 Chapter 3. Methodology To prevent loss of clay sample from the PVC core during treatment, a filter material (Jif cloths) was pre-cut to the dimensions of the open ends and glued (Tarzan s Grip ) to the PVC edge, covering the open end. Cores were left for approximately 10 minutes for the glue to dry, then left to soak in a bucket of the electrolyte solution for a minimum of three days. This was intended to equilibrate the cores with the electrolyte solution prior to EK treatment. The experimental method was modified slightly in the case of the SP clay, as it was observed that this clay had a particularly fine component that was not constrained by the filter cloth. An additional layer of filter paper was used in conjunction with the filter cloth in this case Electrolytic cell setup The electrolytic cell consisted of two identical electrolytic half-cells, which contained the electrodes and the electrolyte fluid. The two half cells were connected by the clay core. Electrolyte fluid The electrolyte solution consisted of laboratory DI water with a small amount of NaCl salt (Ajax fine chem. analytical reagent A465-5KG) added to make a solution of 0.4 g/l NaCl. Some electrolyte is required to enable the electrolyte solution to conduct charge, as theoretically, pure DI water would not conduct charge. A weak NaCl solution was chosen for the anolyte and catholyte as the purpose of the experiment was to observe the production and migration of acid and base at the electrodes and minimise any secondary reactions which may occur at the electrodes. In addition a concentrated NaCl solution could have resulted in error in the measurement of ph due to sodium error from the ph probe. An example of an undesirable secondary reaction would be the production of chlorine gas, Cl 2, from the oxidation of the chloride ion, Cl -, at the anode. This effect is able to be reduced by keeping a low chloride concentration. The ph and conductivity of the anolyte and catholyte was recorded (TPS WR81 ph-cond-salinity) at the beginning and end of each test. The power to the electrodes was turned off before conductivity and ph measurements of the anolyte or catholyte were made. 3.7
34 Chapter 3. Methodology Electrodes The electrodes were mixed copper/titanium/platinum supplied by McCoy Engineering. The electrodes was supplied as a single length of wire which was cut into lengths of approximately 150 mm long. Power supply The electric power was supplied by a Powertech (MP-3092) dual tracking DC laboratory power supply or a Manson (NP-9613) DC regulated power supply, both capable of supplying between 0 and 40V, and a maximum current of three amps. Voltage was set at a constant 20V for all tests, with maximum current enabled. Insulated copper wire was used to connect the power supply to the electrodes. The copper wire was wrapped around the top of the electrode and sealed securely by electrical tape. The connection and seal between the copper wire and the electrodes needed to be water tight to prevent corrosion, as although the connection was kept above the level of the electrolyte solution, condensation would settle on the electrodes and wire leading to corrosion of the copper wire if a sufficient seal was not achieved. The voltage was checked and adjusted using a hand held digital voltameter (DSE Q1459). Voltage measurements were taken using the handheld voltameter in contact directly with the electrodes at the point where the electrode contacted the top of the electrolyte solution. Measurements were taken at the beginning and end of each test. Electrolyte containers The electrolyte fluid and electrodes were contained within two discrete nine litre plastic buckets with a purpose built plastic flange for the connection of the PVC core (Figure 6). Within the plastic flange, two rubber o-rings were used to create a watertight seal once the PVC core was put in place. To assist with obtaining a water tight seal, and inserting and removing the PVC cores, a valve and o-ring lubricant (Molykote 111) was applied liberally to the inside of the plastic flange over the o-rings and outside of the PVC core. The PVC core was directly inserted into the first bucket then the second bucket by hand. Care was required not to dislodge the o-rings during insertion, which could result in leakage. Once the water tight seal was confirmed the buckets were filled with 5L of the electrolyte fluid. The electrodes were then secured in position using adhesive tape and the buckets were covered 3.8
35 Chapter 3. Methodology with cling wrap to reduce electrolyte losses through evaporation. The electrodes were placed to hang vertically immediately adjacent to the PVC core. Figure 6: Electrolyte containers Measurement of the ph profile Removal of the clay core Following the removal of the electrodes and electrolyte fluid from the containment vessels, the PVC core was carefully extracted from the plastic flanges on each vessel without disturbing the clay material within the core. To remove the intact clay core from the PVC sleeve, a flat plastic disc with a radius slightly smaller than the internal radius of the PVC sleeve was placed at the mouth of one end of the PVC sleeve and pushed through the core using a ceramic rod. As the clay cores were saturated and often very soft, particular care was required not to stress the integrity of the clay during removal and potentially result in fractured and collapsed cores. The orientation of the anode and cathode ends were marked with a permanent marker on the PVC sleeve. Upon removal of the clay core from the sleeve it was important to note the orientation during removal to keep track of the anode and cathode ends of the core. 3.9
 described earlier.")
36 Chapter 3. Methodology ph profile measurements Immediately upon removal from the PVC sleeve, the clay core was measured for ph profile using an intermediate junction ph sensor (Ionode IJ44) described earlier. The ph sensor was calibrated using a two point calibration with ph 4.00 and ph 6.88 standard solutions (Rowe Scientific) prior to taking any measurements. The electrolyte gel (TPS saturated KCl gel for I.J. electrodes) was replaced at least weekly. The core was sectioned such that seven equidistant points were measured in a straight line along the length of the clay, being careful to record which end was associated with the anode and which end was associated with the cathode (Figure 7). The ph probe was inserted directly into the clay to a depth of approximately 20 mm. The ph value was recorded after the ph values stabilised. After one set of ph measurements were recorded along the length of the clay core, the core was rotated about its longitudinal axis such that another line of seven points could be measured along its length. This was done to obtain an average value based on two replicate measurements. Figure 7: ph profile measurements Quality control methods The ph probe was calibrated with standard calibration solutions each day prior to measurement. The electrolyte gel was changed as a minimum once a week as recommended in the manufactures instruction manual. Towards the end of the experimental program the electrolyte gel was changed daily when measurements were taken. This was due to ingress of 3.10
37 Chapter 3. Methodology fine sediment into the plastic cover, which could potentially lead to erroneous readings and contribute to drift. The experimental procedure was designed to test 1D flow. As such, it was assumed that the clay packed within the core was relatively homogeneous in all directions and the electric field applied over the clay core was homogeneous in y and z (x, y and z directions shown in to Figure 5), thus any heterogeneity in the y and z directions in either the clay structure and density or the electric field could result in non-uniform migration. To investigate the variability in the y and z direction within a core, five linear profiles along the x-axis of one clay core were measured. Replicate ph profiles along every core were recorded to give two profiles for each clay core for each test. In addition, two independent electrolytic cells were set up and run simultaneously for each time treatment, to give a replicate core for each clay and time treatment. For at least two time treatments for each clay type, a control core was set up and measured using the same methods and over the same timeframe as the treatment cores. The control core was left to soak in the electrolyte solution for the same period as the treatment cores were under the influence of the electric field. Thus any processes owing to diffusion into or out of the core affecting ph were accounted for. 3.11
38 Chapter 4. Results and Discussion CHAPTER 4. RESULTS AND DISCUSSION 4.1 CLAY CHARACTERISTICS X-ray diffraction The XRD results yielded valuable information on the composition of the commercial clays, as it was observed that the dominant clay component was kaolin and two of the clays (the SWE and the SP clay) had a large component of quartz mineral. Quartz is a relatively inert material which can often occur as particles across the entire particle size range, including clay size particles (Gerrard 2000). Table 2: Percentage mineral composition of clay types based on XRD SWE Kagero SP Phase Weight% Phase Weight% Phase Weight% Quartz 44 Kaolin 61.7 Quartz 40.2 Kaolin 33.2 Quartz 20.6 Kaolin 35.3 Illite 17.4 Albite 9.7 Albite 20.3 Albite 3 Illite 6.9 Illite 3.2 Rutile 1.4 Orthoclase 0.7 Rutile 0.3 Mixed layer illite 1 Mixed layer illite 0.2 Mixed layer illite 0.6 Orthoclase 0 Rutile 0.2 Orthoclase 0.1 The major components of all three clays included quartz, kaolin clay, illite clay and albite, which is a sodium rich feldspar not uncommon in clay. Trace components included rutile (naturally occurring titanium dioxide), orthoclase (feldspar mineral) and mixed layer illite clay. 4.1
39 Chapter 4. Results and Discussion The mineral composition of the SWE and SP clays appeared to be very similar, with approximately the same fractional amounts of quartz and kaolin clay, with the main difference between the two clays being the relative amounts of illite clay and albite mineral. The Kagero clay appeared to have a significantly larger component of kaolin clay than the other two clay types. These different mineral compositions may be reflected in the differences in the zeta potential-ph relationship and other ph properties such as buffering capacity and baseline ph Grain size analysis The grain size analysis results were reported according to Australian Standard AS1726 (Soil classification), which separates silts and clays according to grain size, however this is a simplifying convention as silts and clays can have overlapping gain size distributions and ideally should be classified according to mineral structure. The Kagero clay had a significantly higher proportion of larger particle sizes then the SP and the SWE, with 31% of the mass in the sand sized particle range. This result is consistent with the grainy appearances of the Kagero clay. The SWE and SP clay did not have any significant amount of visible grains, and this is confirmed by the sieve analysis showing only 2% of fine sand was present in these clays. The SWE and SP clays were very similar in grain size distribution. The SWE clay had the largest component of grains below mm. Table 3: Particle size distribution of clays SP Kagero SWE Clay description CLAY (With Silt) Sandy CLAY (with Silt) CLAY (With Silt) Sand size particles ( mm) Silt size particles ( mm) Clay size particles (less than 0.002mm) 2% 31% 2% 50% 31% 42% 48% 38% 56% Full sieve and hydrometer analysis results are included in Appendix B. 4.2
40 Chapter 4. Results and Discussion Moisture content The variation in moisture content between clays was determined by the average moisture content from three sub samples within a 10kg bag of each clay type. The moisture content ranged from 33% for the Kagero to 23.6 % for the SP. Table 4: Moisture content of clay types Average moisture content (% w/w, n=3) Standard Deviation (% w/w, n=3) SP Kagero SWE Measurement of moisture content was also performed to give an indication of variation within each clay type, as variability in the clay mixture could result in heterogeneity in the packed clay cores for the 1D core experiments. Three sub-samples from various parts of the clay pack showed a small standard deviation (Table 4) indicating the clay within each 10kg pack was relatively homogenous. The clay used in these 1D core experiments was from a single 10 kg pack of each clay type, hence variability between clay packs was not required for the purposes of this investigation. Table 5: Moisture content of SP cores after EK treatment Average moisture content (% w/w) Standard Deviation (% w/w) SP 3 day treatment 28.0 (n=4) SP 5 day treatment 28.4 (n=2) SP 5 day control 23.4 (n=2) The moisture content was measured in the centre of the SP cores after three and five day EK treatment and in a five day control core for comparison (Table 5). This showed a significant difference in water content between treatment cores and control cores (two tailed t-test, p=0.0025), with an increase in moisture content noted after EK treatment. In addition, the 4.3
41 Chapter 4. Results and Discussion average water content was higher in the five day treatment then the three day treatment, however this was not statistically significant (two tailed t-test, p=0.79). As these measurements were made on only a few cores, and only for the SP clay, this may not be representative of all treatments. It does, however, correlate with the observation of swelling in the EK treated cores, which was observed as lateral expansion of the clay cores resulting in bulging of the filter cloth at either end of the clay core and in some cases leading to rupture of the clay cores. As clay is a three phase medium consisting of solid (clay particles), gas (air) and liquid (pore water), for a increase in moisture content to occur water must displace air, clay particles, or both. In this case as lateral expansion of the clay out of the PVC core was observed the ingress of water has resulted in swelling of the clay matrix, with possibly some displacement of air. If an increase in water content was measured with no observation of swelling this would indicate ingress of water was displacing only the gas phase. The development of positive pore pressures and soil swelling has been noted in similar experiments (Alshawabkeh et al. 2004; Zhou et al. 2006) and is thought to be caused by non-uniform electro-osmotic flow created by non-uniform electric gradients and non-uniform changes in zeta potential (Alshawabkeh et al. 2004). It is also significant to note that the moisture content of the control core was not significantly different to the moisture content of the SP clay prior to soaking, indicating that allowing the clay cores to stand in the electrolyte solution prior to treatment may not have resulted in significant ingress of electrolyte solution into the clay. This result was based on only one core and more measurements would be required to confirm if this observation was representative of the treatment. Ingress of electrolyte fluid would require displacement of soil particles or displacement of gas held in the soil pores, which requires overcoming the displacement pressure of air in successively smaller capillaries. A hydraulic pressure head may be required to promote ingress of electrolyte solution into the clay prior to EK treatment Unit weight The unit weight for the clay types varied from 1.99 g/cm 2 for the Studio Porcelain, to 1.85 g/cm 2 for the Kagero (see Table 6). 4.4
42 Chapter 4. Results and Discussion Table 6: Unit weight of clay packed in PVC cores Average unit weight (g/cm 3 ) Standard Deviation (g/cm 3 ) Range in unit weight (g/cm 3 ) SP (n=10) Kagero (n=9) SWE (n=3) The unit weight was also determined for the packed clay cores as a quality control procedure to check the consistency of packing into PVC cores for the column experiments. In general, the variation in packed density showed little variability for all clay types, with a standard deviation of 0.01 g/cm 3 and the largest range of 0.04 g/cm 3. In terms of the variation in the total weight of the packed core, the largest range was 6.6 g, which was 2.2 % of the average weight of a packed core. This indicated a small variability in packing consistency. Packing consistency in future experiments may be improved by a method of standard compaction at standard moisture content, however this may result in minimal improvement in quality control for the increased procedural complexity. In general, the method used for packing the cores was considered suitable for the purposes of this investigation. Packing efficiency was also confirmed by the general appearance of the control cores after removal from the PVC sleeve, as there were no observations of voids within these cores Acid neutralising capacity The ANC of each clay type is presented in Table 7 in the units of percentage calcium carbonate equivalent. The SP clay gave the highest ANC, followed by the Kagero and the SWE. The greatest difference in this case was between the SP and the SWE, due to compositional differences. 4.5
43 Chapter 4. Results and Discussion Table 7: Acid neutralising capacity of clay types ANC (% CaCO 3 ) SP 0.7 Kagero 0.5 SWE 0.3 SWE (duplicate) 0.4 The ANC could affect the rate of migration by neutralising/consuming a proportion of the acid front, reducing the drop in ph observed in the profile, where the higher ANC would have the greatest effect. A duplicate sample for the SWE was submitted to the laboratory to check the accuracy of the lab method and the result is presented in Table 7. Whilst there was a difference of 0.1 between the primary and the duplicate sample, this was small and not considered to effect the quality of the results for the purposes of this investigation Hydraulic conductivity testing The hydraulic conductivity was determined for the three clays using the falling head test and the results are presented in Table 8. The hydraulic conductivity measurements were repeated a number of times for each clay to confirm the apparatus set up was giving consistent results. The consistency of the results is represented by the standard deviation shown in Table 8. Table 8: Hydraulic conductivity of the three clay types by the falling head test Hydraulic conductivity x10-7 cm/s Standard deviation x10-7 cm/s SP Kagero SWE The Kagero clay had a significantly higher hydraulic conductivity than the SP and SWE clay, consistent with the grain size analysis which showed the SP and SWE clays have a larger component of fine grained particles. 4.6
44 Chapter 4. Results and Discussion Baseline clay ph Measurements of baseline clay ph were taken to determine the differences between clay types and the variation within each 10 kg bag of clay, the results of which are presented in Table 9. The baseline ph is controlled by composition of the clay and the pore fluid. The ph measurements were taken directly from the clay as supplied from the manufacturer, which was at a moisture content of approximately 20 to 30%. The equilibrium between the clay particles and the pore water changes depending on moisture content and pore water composition, and this can also influence ph. Table 9: Baseline clay ph Average (n=4) Standard deviation SP Kagero SWE The baseline ph of the three clay types ranged from7.63 in the SWE to 7.17 in the Kagero. There was some variation across the bag, represented by a standard deviation in ph measurements of 0.18, which was greater than the accuracy of the ph probe and hence reflects small scale spatial variability in clay ph Zeta potential determination Zeta potential-ph curves were determined for each of the three clays using DI water, 0.4 mg/l NaCl and 4 mg/l NaCl solution and these results are presented in Figure 8, Figure 9 and Figure 10 below. For the SP clay the relationship between zeta potential and ph in the DI water and clay slurry was negative and linear in the ph region from 2 to 9 (Figure 8). The addition of NaCl resulted in a more negative zeta potential and a less linear relationship between zeta potential and ph. The difference between a NaCl concentration of 0.4 and 4 g/l was minimal in the ph region from 4 to 7, however diverged in the ph region from 2 to 4. Surprisingly, the zeta potential was slightly more negative for the clay slurry with the weaker salt solution in the ph range of 5 to
45 Chapter 4. Results and Discussion Studio Porcelain Zeta potential (mv) DI water (0.096 ms/cm) 0.4 g/l NaCl (4.04 ms/cm) 4.0 g/l NaCl (26.1 ms/cm) ph Figure 8: Zeta potential for Studio Porcelain Kagero DI water (0.095 ms/cm) 0.4 g/l NaCl (4.25 ms/cm) 4.0 g/l NaCl (27.1 ms/cm) Zeta potential (mv) ph Figure 9: Zeta potential for Kagero clay 4.8
46 Chapter 4. Results and Discussion Similarly to the SP clay, the Kagero clay showed a negative linear relationship between ph and zeta potential for the DI water clay slurry in the ph range from 2 to 7 (Figure 9). The addition of NaCl resulted in a more negative zeta potential, however in the ph region from 3 to 6.5 the zeta potential was more negative for the slurry with a lower concentration of NaCl. Whilst this was also evident in the SP clay, the difference was more pronounced in the Kagero. The SWE clay also showed a negative and mostly linear relationship between zeta potential and ph (Figure 10), however the difference in zeta potential with the addition of NaCl was less pronounced in the SWE. Similarly to the SP and Kagero clay, the clay slurry with the higher concentration of salt had a less negative zeta potential in the ph region from 4 to 6.5, and this was reversed in the ph range of 2 to 4. Zeat potential SWE clay DI water (0.089 ms/cm) 0.4 g/l NaCl (3.98 ms/cm) 4 g/l NaCl (25.60 ms/cm) Zeta Potential (mv) ph Figure 10: Zeta potential for SWE clay Out of the three clay types the Kagero had the most negative zeta potential for clay slurries in a salt solution of 0.4 and 4.0 g/l NaCl, with the SP and SWE clays having a very similar phzeta curve at this salt concentration (see Figure 11). These results can be related back to the 4.9
47 Chapter 4. Results and Discussion composition of the clay types as defined semi-quantitatively in the XRD. The Kagero clay had a significantly larger component of kaolin clay compared to the other two clay types, which were predominantly quartz mineral with a kaolin component. Comparison of clay types at 4.0 g/l NaCl SWE SP Kagero Zeta potential (mv) ph Figure 11: Zeta potential of different clay types at 4.0 g/l NaCl The recorded zeta potentials were negative for all three clays throughout the measured ph range, which was generally from ph 2 to ph 7. This result was highly significant, as many clay types can exhibit positive zeta potential at low ph and certain pore water composition and concentration of electrolytes. This observation was similar to results from Greenwood et al. (2007) who obtained similar ph zeta potential profiles using potassium chloride and stabilised suspensions of pure kaolinite. The magnitude and direction of electroosmotic flux is dependent on the magnitude and sign of zeta potential, with a change in sign of zeta potential resulting in a reversal in the direction of electroosmotic flux, which has been observed in other studies utilising kaolin clay (Thepsithar and Roberts 2006). The zeta potential results in the three clays used in this investigation indicated a reversal in the direction of electroosmotic flow would not be 4.10
48 Chapter 4. Results and Discussion expected in the EK trials and direction of electroosmotic flow should be towards the cathode over the ph range of 2 to ph 7. Hence if significant electroosmotic flow was occurring, it would be assisting the migration of the acid front through the soil towards the cathode and could be inhibiting any base front migration towards the anode. It is important to note that the zeta potentials were measured at different concentrations of NaCl salt to give an indication of differences between the three clays and the indicative zeta potential for the in situ clay cores. However, as discussed in the literature review, the zeta potential ph relationship is highly sensitive to the exact composition and concentration of the pore water as demonstrated by Kaya and Yukselen (2005) and others, with some salts resulting in a more negative zeta potential, and other salts resulting in a more positive zeta potential. The in situ zeta potential-ph relationship may not be accurately reflected by these results depending on the exact composition of the pore water D CORE EXPERIMENTS Results from core experiments Anolyte and catholyte chemistry Measurements of bucket ph and conductivity were made at the beginning and end of each test period. These results have been plotted together below to give an indication of the change in bucket ph over time in the anolyte and catholyte. These results show the rapid change in the ph in the anolyte and catholyte within the first 24 hours. The initial ph of the electrolyte was generally between ph 6 and 7. This increased to ph 10.5 in the catholyte in the first 24 hours, and remained between ph 10 and 12 over the next few days. The anolyte ph dropped to approximately 3 in the first 24 hours, then remained between ph 2 and 3 over the next few days. 4.11
49 Chapter 4. Results and Discussion Anolyte and catholyte ph ph 8 6 Catholyte Anolyte Time (days) Figure 12 Anolyte and catholyte ph change over time The conductivity of the anolyte and catholyte both increased after EK treatment, consistent with the production of H + and OH - ions. After EK treatment the conductivity was higher in the anolyte then the catholyte. This was consistent with observations made by Acar et al. (1994) that the conductivity in the cathode region will decrease due to the formation of water from H + and OH - neutralisation and/or the precipitation of salts. This leads to a non-linear distribution of the electrical gradient between the anode and cathode (Acar et al. 1994). Clay core ph profiles In all three clay types, the production and migration of the acid front through the clay was observed. As the voltage was held constant at 20V for all experiments, the only treatment variable was the amount of time a clay core was left to run, hence the results will refer to time treatments, which varied from one to five days. Each ph profile represented by one line on the graph in the first three figures below is the average value from two separate cores in independent bucket setups, run for the same time treatment. In addition, two profiles were measured from each core, hence each point on the graph is the average of four points at the same distance along the core from the cathode. Due to structural component failures and ruptures, in some cases the duplicate core was not suitable for measurement Some data points 4.12
50 Chapter 4. Results and Discussion are based on two measurements from the primary core rather than four measurements from the primary and duplicate core. The legend for each graph presents the number of replicates each line of points represent. All control core ph profiles presented were the average of two profiles from one core. Studio Porcelin Two days (n=2) Three days (n=4) Four days (n=4) Five days (n=2) 2D Control (n=2) 5D Control (n=2) ph Normalised distance from cathode Figure 13: ph profiles for Studio Porcelain clay The ph profiles for three control cores (at 2, 4 and 5 days) and EK treatments of two to five days were measured for the SP clay. The control cores showed a consistent ph of approximately 7.5 across the length of the core and there was no significant change in ph between the two day, four day and the five day control. Migration of the acid front is evident in the treatment cores by a low ph region at the anode end of the core, which over time extends towards the cathode. This is evident in the first time treatment of two days, which decreased to ph 2.8, indicating a significant increase in the concentration of H + in this region due to influx from the anolyte. The three, four and five day treatments show the ph falls to approximately 2 and does not drop below that level. There is no observation of a rise in ph from the cathode end of the core in any of the time treatments due to incursion of OH - from 4.13
51 Chapter 4. Results and Discussion the catholyte, although the two day treatment does exhibit some points at a higher ph than the control cores. The low ph region was not observed to flush throughout the entire core during the longest time treatments of five days. This may have been caused by acid/base neutralisation in the region immediately adjacent to the cathode at a rate which inhibits further progress of the acid front, or it may have been that the acid front had not migrated through this region after the five day treatment, and a longer time treatment would result in the entire core being dominated by the low ph region. Since there was no significant evidence of base intrusion from the catholyte during the time treatments of two to four days, this indicates that acid/base neutralisation does not account for the neutral ph region near the cathode at day five, and longer time treatments would show the entire core dominated by the low ph region. Kagero Two day (n=2) 2D Control (n=2) Three day (n=4) Four day (n=4) 4D Control (n=2) ph Normalised distance from cathode Figure 14: ph profiles for Kagero clay The ph profiles for three control cores (at two, three and four days) and EK treatments of two to four days were measured for the Kagero clay. The control cores showed a consistent ph of approximately 7.1 across the length of the core and there was no significant change in ph between the two day, three day and the four day control, with the exception of a small drop in ph in the centre of the 4 day core. Migration of the acid front was evident in the treatment 4.14
52 Chapter 4. Results and Discussion cores by a low ph region at the anode end of the core, which over time extended towards the cathode. This was evident in the first time treatment of two days, which decreased to ph 2.9 near the anode. The three day treatment showed the area affected by the low ph region had increased and the four day treatment showed the entire core was dominated by the acid front, with a ph of approximately 2. There was no observation of a rise in ph from the cathode end of the core in any of the time treatments due to incursion of OH - from the catholyte, although similarly to the SP clay, the Kagero two day treatment did exhibit some points at a slightly higher ph than the control cores. SWE One day (n=4) Two day (n=4) 1D Control (n=2) Three day (n=4) Four day (n=4) 4D Control (n=2) ph Normalised distance from cathode Figure 15: ph profiles for SWE clay The ph profiles for three control cores (at one, two and four days) and EK treatments of one to four days were measured for the SWE clay. The control cores showed a consistent ph of approximately 7.1 across the length of the core and there was no significant change in ph between the one day, two day and the four day control. Migration of the acid front was evident in the treatment cores by a low ph region at the anode end of the core, which over time extended towards the cathode. This was evident in the first time treatment, which decreased to ph 3.5 near the anode after 1 day of EK treatment. The two and three day treatments showed the area affected by the low ph region increased over the length of the 4.15
53 Chapter 4. Results and Discussion core. After four days the majority of the core had a ph of 1.6. There was no observation of a rise in ph from the cathode end of the core in any of the time treatments due to incursion of OH - from the catholyte, although similarly to the SP and Kagero clay, the SWE two day treatment did exhibit some points at a slightly higher ph than the control cores. Similar to the SP clay, the low ph region was not observed to fully flush throughout the entire core during the longest time treatments of five days, however there was a marked decrease in ph adjacent to the cathode after five days. Again since there was no significant evidence of base intrusion from the catholyte during the time treatments of two to four days, this indicated that longer time treatments would show the entire core dominated by the low ph region. Migration rate of the acid front To investigate differences between the three clays in the migration of the acid through the clay core, some method for quantifying the rate of migration from the ph profiles presented above was required. One method to investigate this was to take the distance for the ph to drop to a certain level for each time treatment. For each clay at each time treatment, the distance from the anode at which the ph reached four was measured from the graph. This process was repeated for a ph of three for comparison. The time in the graphs above is presented in units of days for simplicity, however time treatments were not in exact multiples of 24 hours, so this is accounted for in the two graphs below and the calculation of migration rates. Figure 16 and Figure 17 below show the migration of the ph 4 region and the ph 3 region for each clay type. 4.16
54 Chapter 4. Results and Discussion Migration of ph 4 region Distance from anode (cm) SWE SP Kagero Time (days) Figure 16: Migration of ph 4 region Migration of ph 3 region Distance from anode (cm) SWE SP Kagero Time (days) Figure 17: Migration of ph 3 region 4.17
55 Chapter 4. Results and Discussion Due to the rapid migration of the acid front through the Kagero, only two time treatments yielded useful information for this particular method of determining the migration rate. The migration rate was determined by using a linear line of best fit through the data points for each clay. The results of this fit are presented in Table 10 using ph 4 and ph 3. Table 10: Migration rate of acid front by line of best fit Migration rate ph 4 (cm/day) R 2 Migration rate ph 3 (cm/day) R 2 SP Kagero SWE Table 10 indicates the rate of migration was fastest in the SWE clay, followed by the Kagero then the SP. In contrast, analysis of the ph profiles presented above demonstrated the acid front swept the entire length of the Kagero core faster than the SWE. The method of linear best fit assumes the migration rate does not change over time, and yields a result inclusive of any retardation that may be occurring, which could occur due to acid neutralising capacity of the clay. In this case, the migration rate was not thought to be constant over time, as one of the properties (namely, the zeta potential) governing the flux from electroosmotic flow changed as a function of ph, and as ph changes over time, so does the rate of electroosmotic flux. In addition, migration of OH - in the opposing direction to H + and neutralisation reactions could contribute to the non-linear nature of acid migration. Therefore the migration rates calculated above are for comparison purposes between the three clays only. The migration rate calculated for Kagero was based on only two time treatments and does not accurately reflect the migration observed. In this case a smaller time resolution (12 or 6 hours) may be required to get a better estimate of acid front migration, especially in the case of the Kagero clay, however as the migration was controlled by a number of processes which change with respect to time, a linear approximation will generally be limited in its ability to represent the migration of the acid front. The migration of the acid front could theoretically be linear if the only mechanism governing the migration was electrokinetic migration (electroosmosis was suppressed), the electric field was constant over time, the electric gradient was constant 4.18
56 Chapter 4. Results and Discussion over the length of the core and the boundary conditions were constant. Control over all of these conditions in the same experiment is possibly not feasible General observations in ph trends and clay characteristics The processes controlling the ph profiles are many and complex. This section aims to identify some of the similarities and differences of the three clays to examine how these may affect the ph profiles measured and the dominating factors responsible for the migration rate of the acid front. Differences were observed in the baseline ph, lower ph bound (after EK treatment) and the control core ph (no EK treatment). It is interesting to note that the clay with the highest baseline ph had the lowest approximate ph bound after EK treatment. The baseline ph was only slightly different (less then one ph unit) to the average ph of the control cores. This could simply be a function of increased moisture content or pore water equilibrium shifts with the control cores being soaked in the electrolyte solution. These three variables would all be influenced by the composition of the pore water and the mineral structure of the clay components in terms of cation exchange and buffering capacity. A high ANC would retard the migration of acid through the core. The highest ANC was measured in the SP clay (Table 11), which also showed the slowest migration of acid. However, the Kagero clay showed a faster acid migration rate then the SWE, despite the ANC being greater in the Kagero. Hence as expected, ANC in isolation did not control the migration of the acid front through the core. Table 11: General observations in ph trends Baseline ph ANC (% CaCO 3 ) Average ph of control cores Approximate lower ph bound Approximate migration rate (cm/day) SP Kagero Greater than 2.8 SWE
57 Chapter 4. Results and Discussion The magnitude of the zeta potential of the Kagero clay slurry was the greatest across the ph range, with the zeta potential of similar magnitude in the SP and SWE slurry. This could have been a major contributing factor for the rapid rate of migration in the Kagero clay in comparison to the SWE and SP clay. No ph profiles showed the intrusion and migration of a base front, however measurements of ph in the catholyte confirmed the production of OH - consistent with literature observations. Other studies (Acar et al. 1993) have reported the base front developed at the cathode in Georgia kaolinite would first advance towards the anode by ionic migration and diffusion, but its migration was impeded due to the neutralisation from hydrogen ions migrating in the opposing direction. The results of these experiments indicate this was not occurring under these conditions, as the ph profiles from initial time treatments showed no evidence of any base intrusion, even when the acid front intrusion was limited to a small area near the anode. The lack of a base front could be attributed to a number of reasons. The base front may have been migrating into the core and its presence was not observed using this experimental method, due to the temporal and spatial scale of measurement. Another possibility could be that the base was migrating into the core and was consumed by processes within the clay, which could have been caused by anion exchange at broken edge bonds. This could be investigated by testing the OH - neutralising capacity of each clay. Alternatively there may have been no significant migration of the base into the clay due to electroosmotic flow from the commencement of the experiment Quality control and instrument performance Performance of the electrochemical cell setup A number of structural component failures resulted in loss of data for some trials. Common failures included leaking containment vessels and the rupturing of clay cores. Leakage was observed in some cases from the inside of the plastic flange if the PVC cores were not fully inserted past both rubber o-rings. O-rings could also be dislodged during insertion resulting in an insufficient seal. If noticed in sufficient time this could usually be rectified by removal of all electrolyte fluid and reassembling the electrochemical cell setup. Leakage of electrolyte fluid was also observed from the join of the containment vessel with the plastic flange. In 4.20
58 Chapter 4. Results and Discussion some cases this could be fixed by resealing the join. If a loss of electrolyte was observed such that the electrolyte level in the containment vessels fell below the level of the top of the clay core (representing a drop in electrolyte of a few centimetres), then the ph profile results for that core were not considered representative of the treatment and were discarded. The level of electrolyte in the core was only visually observed, not measured against a reference level, hence small changes to the level in the buckets due to slow leakage, evaporation or EK related processes were not observed. If unobserved small changes were occurring, and if the level of electrolyte in the containment vessels was not equal, this could have generated a hydraulic gradient that could potentially influence transport. As the maximum change in bucket height which would go unobserved would be in the order of a few centimetres, which would result in only a small hydraulic gradient, this is unlikely to have resulted in any significant effect on transport mechanisms over the timescale of EK measurements. Electrochemical treatment of the clay cores resulted in lateral expansion of the cores, resulting in bulging through the filter cloth at both ends. In some trials this lead to rupture of the core, through the glue joining the filter cloth to the PVC core. This was generally not a function of the duration of the electrokinetic treatment, but was caused by a weakness in the glue join coupled with pressure from lateral expansion of the clay. Some production of chlorine gas was observed by a weak chlorine odour upon removal of the bucket covers. This indicates secondary reactions were occurring, even with a low concentration of electrolytes in the anolyte and catholyte. This would have removed some of the electrical energy at the electrodes for the electrolysis of water. The experimental method was modified in the case of the SP clay, as it was observed that this clay had a particularly fine component which was not constrained by the filter cloth. An additional layer of filter paper, in conjunction with the filter cloth, was used in this case. Fine sediment from the SP clay was not observed to penetrate the finer filter paper, however this treatment increased the occurrence of core rupture. The increased occurrence of clay rupture was attributed to the added difficulty of adhering the filter paper and filter cloth to the PVC core. A smooth but consistent layer of glue was required around the entire edge of the PVC core to minimise the risk of rupture, however if too much glue was applied at one spot then insertion and removal from the plastic flange became difficult and could damage the seal leading to rupture. The slight change in methodology for this clay was not thought to have 4.21
59 Chapter 4. Results and Discussion any effect on the EK treatment of the clay other then resulting in a greater failure rate of the filter seal due to the added difficulty in ensuring an even distribution of glue with the two layers of filter material. For future experiments this methodology may need to be improved to reduce occurrence of core rupture, as this significantly decreases efficiency of the laboratory method. Performance of the ph probe To reduce the influence of drift errors on patterns in ph in the clay profile, ph was measured from the centre point first along the x axis of the core (equidistant from each end), then alternating points at either side of the centre, rather than from one end to the other. This method was used as small quantities of clay often began to intrude into the sleeve containing the electrolyte gel, which may have resulted in more erroneous readings or drift error. The influence of drift error was investigated by comparing the primary and the duplicate line of measurements for each core. If there was a significant drift error over the time of measurement, this would have shown up as a consistent difference in the average reading for the first and the second line of measurements for each core. Taking the average (n=27) of the mean (n=7) reading of the primary line of measurements taken and comparing to the duplicate line of measurements taken should have shown a difference due to drift error if there was one. Table 12: Average and standard deviation of primary and duplicate ph measurements Primary measurement Duplicate measurement Average of means Standard deviation of averages There was little difference observed between the means in this case, indicating there was no significant drift error from the ph probe. In addition, as each ph measurement could be paired with the measurement taken at a later time at the same position in the x direction but a different position in the y-x plane, a paired t-test was used to confirm that there was no significant difference between measurements taken at a later time (p=0.721). If the intrusion 4.22
60 Chapter 4. Results and Discussion of small amounts of clay into the probe had any impact on the accuracy of the probe, this was most likely small random errors rather than drift errors. Transverse variability in the ph profile To investigate the variability in the y and z direction within a core, five linear profiles along the x-axis of the core at different positions of y and z were measured. These results are plotted in Figure 18, with each line on the graph representing one linear ph profile in the x direction. Points at each location on the x axis represent the range of values measured in the y-z plane. If the migration of acid through the core was one dimensional, then variability in the measurements in the y-z plane should only differ due to the accuracy of the ph probe. The reported accuracy of the ph probe when calibrated appropriately is 0.02 ph. The largest range in values at the same point in the x-axis is approximately three ph units at 0.6 of the normalised distance from the cathode, which significantly exceeds the variation due to the accuracy of the ph probe, however in most cases the variability is within one ph unit. This indicates there is variability in the 1D migration through the core. This is most likely due to heterogeneity in the soil matrix and/or a non uniform electric field. Transverse Variablity - Three day SP ph Normalised distance from cathode Figure 18:Transverse variability in ph measured in a three day SP core 4.23
61 Chapter 4. Results and Discussion A number of properties of the soil matrix could lead to transverse variability in the soil ph. Spatial heterogeneity in the chemical properties of the soil such as buffering capacity, pore water ionic composition, structural or adsorbed layer composition could promote or retard the migration of acid. Small pockets in the clay might promote a higher level of electroosmosis due to pore water constituents and variability in zeta potential. Alternatively, the chemical and structural composition of the clay in the core could be homogeneous, with variability in ph due to non-homogenous packing of the clay into the core. Upon the removal of the clay cores after EK treatment, there was no visible evidence of voids in the core due to insufficient packing, however there was often soft spots in the core. These soft spots may be the result of voids created from insufficient packing which have been filled by diffusion or migration of fine sediment during the EK treatment. However, voids or soft spots were not observed in any of the control cores, suggesting the soft spots are due to some clay matrix changes during EK treatment. The other possible cause of transverse variability is a non-uniform electric field across the core. A non-uniform electric field could result from the physical set-up of the electrochemical cell, in particular the position of the electrodes with respect to the core, or from heterogeneity in the clay core. Regardless of the mechanism, the observed transverse variability in the cores is significant enough to require consideration when measuring ph profiles in the clay cores, and this can be addressed by replication of measurements. This variability was addressed in this investigation through the use of duplicate measurements of each core and duplicate cores for each time treatment. 4.24
62 Chapter 5. Conclusions and Recommendations CHAPTER 5. CONCLUSIONS AND RECOMMENDATIONS The migration of the acid front through the core was observed for all three clay types as a change in the longitudinal profile of the measured ph in the clay. The migration rate was estimated based on the midpoint of the breakthrough curve and was different for all three clay types. The acid front migrated the fastest through the Kagero clay, which of the three clays had the most negative zeta potential. This result may indicate electroosmotic flux played a significant role in the migration through the clay, however drawing conclusions of this type is confounded by the many variables which were not isolated in this experimental design. The experimental design was not able to distinguish between the different governing mechanisms controlling the migration of the acid front. The experimental design for this series of experiments was relatively simple to allow for a number of treatments to be run simultaneously for increased replication and to allow a number of time treatments to be run for each clay type. Future investigations may require a more elaborate experimental set up to control and isolate certain parameters. A more elaborate set up would require more resources and decrease the number of replicates achievable in a limited timeframe. The method of estimating the migration rate using a linear curve of best fit for the breakthrough curve was limited due to the non-linear nature of the migration and the temporal resolution of treatments (24 hours). Future experiments may benefit from a temporal resolution of six or twelve hours, especially when the rate of migration is high, as observed in the Kagero clay. In addition, it would be beneficial to run some of the EK experiments for longer time treatments, which in the case of the SP and SWE would confirm or challenge the prediction that the clay cores are dominated by the low ph over the entire core after approximately six or seven days, and that OH - intrusion is not occurring at a rate sufficient to neutralise the H +. Improvements to the method used in this investigation could include controlling the acid and base concentration in the anolyte and catholyte to produce constant boundary conditions throughout the treatment or automatic logging of anolyte and catholyte ph to give high resolution information on the changing boundary conditions. Control of the anolyte and catholyte ph could be achieved by constant circulation of the electrolyte through a larger holding tank, and in some cases introducing acidic or basic buffer solutions, such as acetic 5.1
63 Chapter 5. Conclusions and Recommendations acid. This should be done with care to prevent unwanted electrolysis reactions at the anode and cathode. The clay cores were left to equilibrate in the electrolyte solution for a minimum of three days prior to EK treatment, however testing was not performed to investigate if the electrolyte solution exchanged with any or all of the pore water over this time. Limited moisture content testing indicated the moisture content of the clay did not change significantly after seven days of soaking in the electrolyte solution. Possible improvements to the experimental method could include treating the cores under a hydraulic gradient to flush the core with the electrolyte solution. Alternatively clay samples could be prepared from dry clay using the electrolyte solution. In future experiments it would be of value to conduct analysis of the pore water for chemical composition. This would provide information which could be used to run a series of zeta potential tests for the three clays in the presence of different salts which may be present in the clay. Analysis of the pore water composition should be done before and after soaking or hydraulic flushing with the electrolyte solution prior to EK treatment. It would also be valuable to analyse pore water composition post EK treatment to see what may have been adhered to the soil particle surfaces and may have undergone exchange with the H + ion during treatment. Knowledge of the pore fluid constituents at different stages of experimentation would assist in obtaining zeta-ph curves at pore water compositions which more closely reflect the in situ pore water composition. A confounding factor in isolating and observing changes in transport mechanisms related to structural composition is the mixed nature of the clays utilised in these investigations. Future studies may benefit from utilisation of purified manufactured clay such as pure kaolinite. The investigation of pure kaolinite with additions of known amounts of other clays or mineral types may assist in elucidating changes to EK transport mechanisms due to clay composition. Future experimental designs should focus on isolating each transport mechanism as much as possible and linking changes to each transport mechanism to different attributes of each clay. It is recommended that the first step for each clay would be to measure diffusion of acid and base into the clay cores by setting up constant ph boundary conditions in an identical set up to the EK treatment, with an acidic anolyte and basic catholyte, but with no EK treatment. 5.2
64 Chapter 5. Conclusions and Recommendations This would give a measurement of the effective diffusion coefficient in the three clays, which would depend on tortuosity. This information could then be used to predict the effective ionic mobility to model the migration of the acid front by electrokinetic migration alone. If an experimental method could be devised that could suppress any electroosmotic flow, by subtle and adjustable pressure gradients or an ion selective membrane preventing pore water movement and allowing only electrokinetic migration as the dominant transport mechanism, then the model for electrokinetic migration could be validated. Other factors which would be difficult to isolate which complicate the electrokinetic migration include chemical and structural changes in the clay matrix. Exchange with surface ions adhered to the clay surface would change the pore water composition and possibly retard the migration of H + ions. In addition, neutralisation reactions generate a non-uniform electric field over time, and clay matrix changes may change the tortuosity factor over time which would change the effective ionic mobility. The electrochemical process for groundwater remediation of low permeability sediments is a promising and emerging method for site remediation, however there are complex and interacting processes that make it a challenge to predict its behaviour under different conditions. Future research in this field should involve modelling, bench scale tests and field studies in order to utilise EK treatment in remediation of contaminated sites. 5.3
65 References REFERENCES Acar, Y. B. and A. N. Alshawabkeh (1993). "Principles of electrokinetic remediation." Environmental Science and Technology 27(13): Acar, Y. B. and A. N. Alshawabkeh (1996). "Electrokinetic remediation. 1: Pilot-scale tests with lead spiked kaolinite." Journal of Geotechnical Engineering 122: Acar, Y. B., R. J. Gale, et al. (1993). "Acid/Base distributions in electrokinetic soil processing." Transportation Research Record 1288: Acar, Y. B., J. Hamed, et al. (1994). "Removal of cadmium (II) from saturated kaolinite by the application of electric current." Geotechnique 44(2): Agmon, N. (1995). "The Grotthuss mechanism." Chemical Physics Letters 244(5-6): Alkan, M., O. Demirbas, et al. (2005). "Electrokinetic properties of kaolinite in mono- and multivalent electrolyte solutions." Microporous and Mesoporous Materials 83: Alshawabkeh, A. N. (2001). "Basics and applications of electrokinetic remediation." Handouts prepared for a short course: Alshawabkeh, A. N., T. C. Sheanhan, et al. (2004). "Coupling of electrochemical and mechanical processes in soils under DC fields." Mechanics of Materials 36: Alshawabkeh, A. N., A. T. Yeung, et al. (1999). "Practical aspects of in-situ electrokinetic extraction." Journal of Environmental Engineering 125(1): Atkins, P. and J. de Paula (2002). Atkins physical chemistry. New York, Oxford University Press. Aydin, M., T. Yano, et al. (2004). "Division S2 - Soil chemistry: Dependence of zeta potential and soil hydraulic conductivity on adsorbed cation and aqueous phase properties." Soil Science Society of America 68: Budhu, M. (2007). Soil Mechanics and Foundations. USA, John Wiley & Sons, Inc. 5.1
66 References Craig, R. F. (1987). Soil Mechanics. Fourth edition. Cornwall. Delgado, A. V., F. Gonzalez-Caballero, et al. (2007). "Measurement and interpretation of electrokinetic phenomena." Journal of colloid and interface science 309: Denisov, G., R. E. Hicks, et al. (1996). "On the kinetics of charged contaminant removal from soils using electric fields." Journal of colloid and interface science 178(1): Eykholt, G. R. and D. E. Daniel (1994). "Impact of system chemistry on electroosmosis in contaminated soil." Journal of Geotechnical Engineering 120(5): Gerrard, J. (2000). Fundamentals of soil, Routledge. Gillen, M. (2006). The use of electrokinetics for the remediation of contaminated groundwater in low permeability sediments.. Perth, University of Western Australia. Engineering. Greenwood, R. (2003). "Review of the measurement of zeta potentials in concentrated aqueous suspensions using electroacoustics." Advances in Colloid and Interface Science 106: Greenwood, R., B. Lapcikova, et al. (2007). "The Zeta Potential of Kaolin Suspensions Measured by Electrophoresis and Electroacoustics." Chemical Papers 61(2): Isosaari, P., R. Piskonen, et al. (2007). "Integration of electrokinetics and chemical oxidation for the remediation of creosote -contaminated clay." Journal of Hazardous Materials 114: Kaya, A. and Y. Yukselen (2005). "Zeta potential of clay minerals and quartz contaminated by heavy metals." Canadian Geotechnical Journal 42(5): Kosmulski, M. and P. Dahlsten (2006). "High ionic strength electrokinetics of clay minerals." Colloids and Surfaces A: Physicochemical engineering aspects 291: Laxton, P. B. and J. C. Berg (2006). "Relating clay yield stress to colloidal parameters." Journal of colloid and interface science 296:
67 References Lee, H.-H. and J.-W. Yang (2000). "A new method to control electrolytes ph by circulation system in electrokinetic soil remediation." Journal of Hazardous Materials B77: Lee, J. (2005). Electrokinetic applications in the remediation of NAPL contaminated sites.. Perth, University of Western Australia. Engineering. Murray, H. (1999). "Applied clay mineralogy today and tomorrow." Clay Minerals 34: pers com McKnight, S. (2008). XRD methods. University of Ballarat. Ottosen, L. M., I. V. Christensen, et al. (2008). Utilization of electromigration in civil and environmental engineering: Processes, transport rates and matrix changes, Taylor & Francis. 43: Popov, K., A. Kolosov, et al. (2004). "Enhancement of clay zeta potential by chelating agents." Colloids and Surfaces A: Physicochemical engineering aspects 244: Poppe, L. J., V. F. Paskevich, et al. (2001). "A Laboratory Manual for X-Ray Powder Diffraction." U. S. Geological Survey Open-File Report : Reynolds, D. A., E. H. Jones, et al. (2008). "Electrokinetic Migration of Permanganate Through Low-Permeability Media." Ground Water 46: Roach, N. and K. R. Reddy (2006). "Electrokinetic delivery of permanganate into low permeability soils." Int. J. Environment and Waste Management 1(1): Serway, R. A. and R. J. Beichner (2000). Physics for scientists and engineers: with modern physics. Orlando, Saunders college publishing. Shilov, V. N., Y. B. Borkovskaja, et al. (2004). "Electroacoustic theory for concentrated colloids with overlapped DLs at arbitrary ka: 1. Application to nanocolloids and nonaqueous colloids." Journal of colloid and interface science 277: Silberberg, M. S. (2000). Chemistry: The molecular nature of matter and change. USA, McGraw-Hill Higher Education. 5.3
68 References Thepsithar, P. and E. P. L. Roberts (2006). "Removal of phenol from contaminated kaolin using electrokinetically enhanced in situ chemical oxidation." Environmental Science and Technology 40: Troeh, F. and L. M. Thompson (2005). Soils and soil fertility. Blackwell Publishing. Vane, L. M. and G. M. Zang (1997). "Effect of aqueous phase properties on clay particle zeta potential and electro-osmotic permeability: Implications for electro-kinetic soil remediation processes." Journal of Hazardous Materials 55: Wick, L. Y., P. A. Mattle, et al. (2004). "Electrokinetic Transport of PAH-Degrading Bacteria in Model Aquifers and Soil." Environmental Science & Technology 38(17): Yeung, A. T. and S. Datla (1995). "Fundamental formulation of electrokinetic extraction of contaminants from soil." Canadian Geotechnical Journal 32: Zhou, D.-M., L. Cang, et al. (2006). "Pilot-scale electrokinetic treatment of a Cu contaminated red soil." Chemosphere 63(6):
69 Appendices APPENDICES 5.1
70 Appendices APPENDIX A RAW DATA setup and bucket measurements - SP clay date date PVC PVC+clay clay prepared used days soaked SP SP /08/ :14 11 SP /08/ :14 11 SP /09/ SP /09/ SP /08/ :14 11 SP /09/ :00 2 SP /09/ :00 2 SP /09/ :00 2 SP /09/ :21 4 SP /09/ :21 4 Initial bucket measurements -ve bucket +ve bucket date cond ph cond ph voltage time SP1 failure - rupture SP /08/ :14 SP3 control /08/ :14 SP4 control /09/ :35 SP /09/ :35 SP /08/ :14 SP7 control /09/ :10 SP /09/ :10 SP /09/ :10 SP /09/ :21 SP /09/ :21 Final bucket measurements -ve bucket +ve bucket date cond ph cond ph voltage time SP1 failure - rupture SP /08/ :01 SP3 control /08/ :01 SP4 control /09/ :27 SP /09/ :27 SP /08/ :01 SP7 control /09/ :10 SP /09/ SP /09/ :10 SP /09/ :38 SP /09/ :38 5.2
71 Appendices SP ph profiles 1 Day trials SP08* *partial failure - rupture 2 day trials SP SP04 control Day trials SP SP day trials SP SP SP3 (controll) day trials SP SP07 control
72 Appendices Kagero bucket measurements setup measurements date date PVC PVC+clay clay prepared used days soaked K /08/ /08/ K /08/ /08/ K /08/ /08/ K /08/ /08/ :21 3 K /08/ /08/ :21 3 K /08/ /08/ :21 3 K /08/ /08/ :21 3 K /08/ /08/ :21 3 K /08/ /08/ :21 3 initial bucket measurements -ve bucket +ve bucket date cond ph cond ph voltage time control /08/ : /08/ : /08/ :00 control /08/ :21 control /08/ : /08/ : /08/ : /08/ : /08/ :21 final bucket measurements -ve bucket +ve bucket date cond ph cond ph voltage time control /08/ : /08/ : /08/ :50 control /08/ :25 control /08/ : /08/ :25 failed /08/ : /08/ : /08/ :25 5.4
73 Appendices Kagero ph profiles 2 day trials K K05control Day trials K K K04control day trials K K K
74 Appendices SWE Bucket measurements setup measurements date date PVC PVC+clay clay prepared used days soaked SWE /07/ /08/ :50 5 SWE /07/ /08/ :50 5 SWE /07/ /07/ :42 3 SWE /07/ /08/ :50 5 SWE /07/ /07/ :42 3 SWE /07/ /08/ :50 5 SWE /07/ /07/ :42 3 SWE /07/ /08/ :50 5 SWE Aug-08 07/08/ :38 3 SWE Aug-08 07/08/ :38 3 SWE Aug-08 07/08/ :38 3 initial bucket measurements -ve bucket +ve bucket date cond ph cond ph voltage time control control control control control 01/08/ : /08/ :50 control control control control control 30/07/ : /08/ : /07/ : /08/ : /07/ : /08/ : /08/ : /08/ :38 control control control control control 07/08/ :38 final bucket measurements -ve bucket +ve bucket date cond ph cond ph voltage time control control control control control 05/08/ : /08/ :57 control control control control control 31/07/ : /08/ : /07/ : /08/ : /07/ : /08/ : /08/ : /08/ :30 control control control control control 09/08/ :30 5.6
75 Appendices SWE ph profiles 1 Day trials SWE SWE SWE03 control day trials SWE SWE SWE11 control Day trials SWE SWE day trials SWE SWE SWE01 control
76 Appendices APPENDIX B PARTICLE SIZE ANALYSIS 5.8
77 Appendices 5.9
78 Appendices 5.10
79 Appendices Appendix C - Acid Neutralising Capacity 5.1
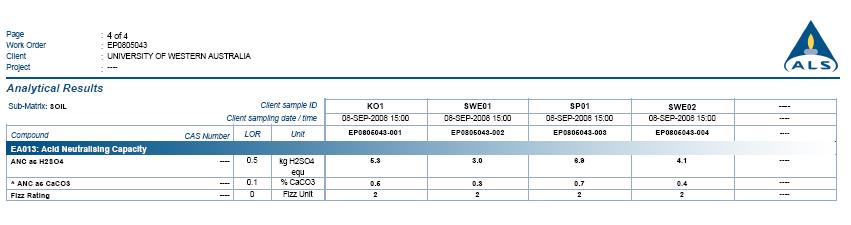
80 Appendices 5.2
Copyright SOIL STRUCTURE and CLAY MINERALS
 SOIL STRUCTURE and CLAY MINERALS Soil Structure Structure of a soil may be defined as the mode of arrangement of soil grains relative to each other and the forces acting between them to hold them in their
Cation Exchange Capacity, CEC
 Cation Exchange Capacity, CEC The basic building blocks of clay minerals are: silicon atoms surrounded by four oxygen atoms (tetrahedra), and aluminium atoms surrounded by six hydroxide groups (dioctahedra),
Reactive-transport modelling of electrokinetic extraction of heavy metals from marine sediments
 EREM63 Reactive-transport modelling of electrokinetic extraction of heavy metals from marine sediments Matteo Masi a, *, Alessio Ceccarini b, Renato Iannelli a a University of Pisa, Department of Energy,
Tikrit University. College of Engineering Civil engineering Department SOIL PROPERTES. Soil Mechanics. 3 rd Class Lecture notes Up Copyrights 2016
 Tikrit University SOIL PROPERTES College of Engineering Civil engineering Department Soil Mechanics 3 rd Class Lecture notes Up Copyrights 2016 1-Soil Composition -Solids -Water -Air 2-Soil Phases -Dry
Prof. B V S Viswanadham, Department of Civil Engineering, IIT Bombay
 05 Clay particle-water interaction & Index properties Electrical nature of clay particles a) Electrical charges i) The two faces of all platy particles have a negative charge. Resulting due to isomorphous
Electrokinetic applications in the remediation of NAPL contaminated sites
 Abstract Electrokinetic applications in the remediation of NAPL contaminated sites Subsurface NAPL contaminated sites act as a long-term environmental problem, and may pose as a threat to human health.
Chapter I Basic Characteristics of Soils
 Chapter I Basic Characteristics of Soils Outline 1. The Nature of Soils (section 1.1 Craig) 2. Soil Texture (section 1.1 Craig) 3. Grain Size and Grain Size Distribution (section 1.2 Craig) 4. Particle
REMEDIATION OF SALT IMPACTED GROUNDWATER WITH ELECTROKINETICS. Paper by: Sean Kelly, Rick Churko, Sean Frisky, Anjum Mullick, Stuart Torr.
 REMEDIATION OF SALT IMPACTED GROUNDWATER WITH ELECTROKINETICS. Paper by: Sean Kelly, Rick Churko, Sean Frisky, Anjum Mullick, Stuart Torr. Alberta Transportation is supporting leading research in the use
Part II: Self Potential Method and Induced Polarization (IP)
") Part II: Self Potential Method and Induced Polarization (IP) Self-potential method (passive) Self-potential mechanism Measurement of self potentials and interpretation Induced polarization method (active)
Part II: Self Potential Method and Induced Polarization (IP) Self-potential method (passive) Self-potential mechanism Measurement of self potentials and interpretation Induced polarization method (active)
9.1 Introduction to Oxidation and Reduction
 9.1 Introduction to Oxidation and Reduction 9.1.1 - Define oxidation and reduction in terms of electron loss and gain Oxidation The loss of electrons from a substance. This may happen through the gain
4.4.1 Reactivity of metals Metal oxides The reactivity series. Key opportunities for skills development.
 4.4 Chemical changes Understanding of chemical changes began when people began experimenting with chemical reactions in a systematic way and organising their results logically. Knowing about these different
Chemical Hydrogeology
 Physical hydrogeology: study of movement and occurrence of groundwater Chemical hydrogeology: study of chemical constituents in groundwater Chemical Hydrogeology Relevant courses General geochemistry [Donahoe]
Soil physical and chemical properties the analogy lecture. Beth Guertal Auburn University, AL
 Soil physical and chemical properties the analogy lecture. Beth Guertal Auburn University, AL Soil Physical Properties Porosity Pore size and pore size distribution Water holding capacity Bulk density
CLASS EXERCISE 5.1 List processes occurring in soils that cause changes in the levels of ions.
 5 SIL CHEMISTRY 5.1 Introduction A knowledge of the chemical composition of a soil is less useful than a knowledge of its component minerals and organic materials. These dictate the reactions that occur
8. Draw Lewis structures and determine molecular geometry based on VSEPR Theory
 Chemistry Grade 12 Outcomes 1 Quantum Chemistry and Atomic Structure Unit I 1. Perform calculations on wavelength, frequency and energy. 2. Have an understanding of the electromagnetic spectrum. 3. Relate
Student Achievement. Chemistry 12
 Student Achievement Chemistry 12 Key Elements: Reaction Kinetics Estimated Time: 14 16 hours By the end of this course, students will be able to explain the significance of reaction rates, demonstrate
5.4 Chemical changes Reactivity of metals Metal oxides The reactivity series. Key opportunities for skills development
 5.4 Chemical changes Understanding of chemical changes began when people began experimenting with chemical reactions in a systematic way and organising their results logically. Knowing about these different
Geotechnical Properties of Soil
 Geotechnical Properties of Soil 1 Soil Texture Particle size, shape and size distribution Coarse-textured (Gravel, Sand) Fine-textured (Silt, Clay) Visibility by the naked eye (0.05 mm is the approximate
Physical and Chemical Reactions during Ion Exchange with TERRA-3000
 Physical and Chemical Reactions during Ion Exchange with TERRA-3000 How does TERRA-3000 work as an ion exchanger and how does it work on silt and colloid particles during treatment? This section looks
CH 221 Chapter Four Part II Concept Guide
 CH 221 Chapter Four Part II Concept Guide 1. Solubility Why are some compounds soluble and others insoluble? In solid potassium permanganate, KMnO 4, the potassium ions, which have a charge of +1, are
Soil Mechanics Prof. B.V.S. Viswanadham Department of Civil Engineering Indian Institute of Technology, Bombay Lecture 3
 Soil Mechanics Prof. B.V.S. Viswanadham Department of Civil Engineering Indian Institute of Technology, Bombay Lecture 3 In the previous lecture we have studied about definitions of volumetric ratios and
Chemistry I 2nd Semester Exam Study Guide
 Chemistry I 2nd Semester Exam Study Guide Study the following topics and be able to apply these concepts to answer related questions to best prepare for the Chemistry exam. You should be able to: 1. Identify
Particles in aqueous environments
 Lecture 11 Particle-Aqueous Solute Interactions Today 1. Particle types and sizes 2. Particle charges 3. Particle-solute Interactions Next time Please continue to read Manahan Chapter 4. 1. Fresh-salt
CHEMISTRY. SCIENCE Paper 2
 CHEMISTRY SCIENCE Paper 2 (Two hours) Answers to this Paper must be written on the paper provided separately. You will not be allowed to write during the first 15 minutes. This time is to be spent in reading
ISO Colloidal systems Methods for zetapotential. Part 1: Electroacoustic and electrokinetic phenomena
 INTERNATIONAL STANDARD ISO 13099-1 First edition 2012-06-15 Colloidal systems Methods for zetapotential determination Part 1: Electroacoustic and electrokinetic phenomena Systèmes colloïdaux Méthodes de
Scientific registration n : 1789 Symposium n : 4 Presentation : poster. ARINGHIERI Roberto
 Scientific registration n : 1789 Symposium n : 4 Presentation : poster Saturated hydraulic conductivity and structural properties of clay-sand systems Conductivité hydraulique en saturé et propriétés structurales
Edexcel Chemistry Checklist
 Topic 1. Key concepts in chemistry Video: Developing the atomic model Describe how and why the atomic model has changed over time. Describe the difference between the plum-pudding model of the atom and
Personalised Learning Checklists Edexcel Combined: Chemistry Paper 1
 Edexcel (combined) Chemistry Topics (1SC0) from 2016 - Paper 1 (Topic 1 parts a&b) Topic Student Checklist R A G Describe how the Dalton model of an atom has changed over time because of the discovery
Lesson on Electrolysis
 Lesson on Electrolysis This lesson package includes a lesson plan, a worksheet for students, and teachers notes on the worksheet. Activity Lesson 1 (50 min-2 Period lesson) Teacher explains (page 1 to
Cation Exchanges on Stabilized Soft Clay Using Electrokinetic Process
 IOSR Journal of Engineering (IOSRJEN) ISSN (e): 2250-3021, ISSN (p): 2278-8719 Vol. 05, Issue 11 (November. 2015), V2 PP 10-15 www.iosrjen.org Cation Exchanges on Stabilized Soft Clay Using Electrokinetic
Chapter 1 - Soil Mechanics Review Part A
 Chapter 1 - Soil Mechanics Review Part A 1.1 Introduction Geotechnical Engineer is concerned with predicting / controlling Failure/Stability Deformations Influence of water (Seepage etc.) Soil behavour
Chapter 2 Basic Chemistry Outline
 Chapter 2 Basic Chemistry Outline 1.0 COMPOSITION OF MATTER 1.1 Atom 1.2 Elements 1.21 Isotopes 1.22 Radioisotopes 1.3 Compounds 1.31 Compounds Formed by Ionic Bonding 1.32 Compounds Formed by Covalent
Chem 321 Lecture 17 - Potentiometry 10/24/13
 Student Learning Objectives Chem 321 Lecture 17 - Potentiometry 10/24/13 Electrodes The cell described in the potentiometric chloride titration (see 10/22/13 posting) consists of a Ag/AgCl reference electrode
Chapter 18 Electrochemistry. Electrochemical Cells
 Chapter 18 Electrochemistry Chapter 18 1 Electrochemical Cells Electrochemical Cells are of two basic types: Galvanic Cells a spontaneous chemical reaction generates an electric current Electrolytic Cells
The Chemistry of Seawater. Unit 3
 The Chemistry of Seawater Unit 3 Water occurs naturally on earth in 3 phases: solid, liquid, or gas (liquid is most abundant) Water Phases Basic Chemistry Review What is an atom? Smallest particles of
BIOLOGY 101. CHAPTER 3: Water and Life: The Molecule that supports all Live
 BIOLOGY 101 CHAPTER 3: Water and Life: The Molecule that supports all Live The Molecule that Supports all Life CONCEPTS: 3.1 Polar covalent bonds in water molecules result in hydrogen bonding 3.2 Four
GCE Chemistry Eduqas AS Component 1
 GCE Chemistry Eduqas AS Component 1 C1.1 FORMULAE AND EQUATIONS formulae of common compounds and common ions and how to write formulae for ionic compounds oxidation numbers of atoms in a compound or ion
Soil Colloidal Chemistry. Compiled and Edited by Dr. Syed Ismail, Marthwada Agril. University Parbhani,MS, India
 Soil Colloidal Chemistry Compiled and Edited by Dr. Syed Ismail, Marthwada Agril. University Parbhani,MS, India 1 The Colloidal Fraction Introduction What is a colloid? Why this is important in understanding
IGCSE Double Award Extended Coordinated Science
 IGCSE Double Award Extended Coordinated Science Chemistry 5 - Electricity and Chemistry Electrolysis You need to know that electrolysis is: - The breakdown of ionic substances into their constituent elements
Simulation of the concrete chloride NT build-492 migration test
 Simulation of the concrete chloride NT build-492 migration test Aix-en-Provence, France May 29-June 1, 2012 J. Lizarazo-Marriaga 1, J. Gonzalez 1, P. Claisse 2, 1 Universidad Nacional de Colombia 2 Coventry
CHEMICAL EFFECTS OF GOETHITE COLLOID ON THE TRANSPORT OF URANIUM (VI) THROUGH A SATURATED QUARTZ-PACKED COLUMN
 THROUGH A SATURATED QUARTZ-PACKED COLUMN") IAEA-CN-78/8 CHEMICAL EFFECTS OF GOETHITE COLLOID ON THE TRANSPORT OF URANIUM (VI) THROUGH A SATURATED QUARTZ-PACKED COLUMN A.A. ZAKI, M.Y. KHALIL, M.E. NAGY, H.F. ALY Atomic Energy Authority, Hot Laboratory
IAEA-CN-78/8 CHEMICAL EFFECTS OF GOETHITE COLLOID ON THE TRANSPORT OF URANIUM (VI) THROUGH A SATURATED QUARTZ-PACKED COLUMN A.A. ZAKI, M.Y. KHALIL, M.E. NAGY, H.F. ALY Atomic Energy Authority, Hot Laboratory
PHYSICAL SCIENCES: PAPER II
 NATIONAL SENIOR CERTIFICATE EXAMINATION NOVEMBER 2014 PHYSICAL SCIENCES: PAPER II Time: 3 hours 200 marks PLEASE READ THE FOLLOWING INSTRUCTIONS CAREFULLY 1. This question paper consists of 14 pages, a
AQA Chemistry Checklist
 Topic 1. Atomic structure Video: Atoms, elements, compounds, mixtures Use the names and symbols of the first 20 elements in the periodic table, the elements in Groups 1 and 7, and other elements in this
Enduring Understandings & Essential Knowledge for AP Chemistry
 Enduring Understandings & Essential Knowledge for AP Chemistry Big Idea 1: The chemical elements are fundamental building materials of matter, and all matter can be understood in terms of arrangements
Atoms and Ions Junior Science
 2018 Version Atoms and Ions Junior Science 1 http://msutoday.msu.edu Introduction Chemistry is the study of matter and energy and the interaction between them. The elements are the building blocks of all
Characterization of Sand Formation from a Crude Oilfield
 This work by IJARBEST is licensed under Creative Commons Attribution 4.0 International License. Available at https://www.ijarbest.com Characterization of Sand Formation from a Crude Oilfield 1 A. Sivasakthi,
Empirical formula C 4 H 6 O
 AP Chem Test- Titration and Gravimetric Analysis p. 2 Name date 4. Empirical Formula A compound is analyzed and found to contain 68.54% carbon, 8.63% hydrogen, and 22.83% oxygen. The molecular weight of
Unit 4: Chemical Changes (Higher Content)
") Metals react with oxygen to produce metal oxides. E.g. Copper + Oxygen > Copper Oxide The reactions are oxidation reactions because the metals gain oxygen. Reactivity of Metals Metal Extraction Metals
Metals react with oxygen to produce metal oxides. E.g. Copper + Oxygen > Copper Oxide The reactions are oxidation reactions because the metals gain oxygen. Reactivity of Metals Metal Extraction Metals
LABORATORY EVALUATION OF PHYSICO-CHEMICAL VARIATIONS IN BENTONITE UNDER ELECTROKINETIC ENHANCEMENT
 Int. J. of GEOMATE, March, 1, Vol., No. 1 (Sl. No. 11), pp. 17-3 Geotech., Const. Mat. and Env., ISSN:1-9(P), 1-99(O), Japan LABORATORY EVALUATION OF PHYSICO-CHEMICAL VARIATIONS IN BENTONITE UNDER ELECTROKINETIC
Advanced Analytical Chemistry Lecture 12. Chem 4631
 Advanced Analytical Chemistry Lecture 12 Chem 4631 What is a fuel cell? An electro-chemical energy conversion device A factory that takes fuel as input and produces electricity as output. O 2 (g) H 2 (g)
Andrew Hart Golder Associates (NZ) Limited. Assessment of ISCO for Remediation of PCP Impacted Soil
 Limited. Assessment of ISCO for Remediation of PCP Impacted Soil") Andrew Hart Golder Associates (NZ) Limited Assessment of ISCO for Remediation of PCP Impacted Soil Overview Introduction to In-Situ Chemical Oxidation (ISCO) Case Study PCP contamination at a timber treatment
Andrew Hart Golder Associates (NZ) Limited Assessment of ISCO for Remediation of PCP Impacted Soil Overview Introduction to In-Situ Chemical Oxidation (ISCO) Case Study PCP contamination at a timber treatment
Electrochemistry. Dr. A. R. Ramesh Assistant Professor of Chemistry Govt. Engineering College, Kozhikode
 Electrochemistry Dr. A. R. Ramesh Assistant Professor of Chemistry Govt. Engineering College, Kozhikode 1 Electro Chemistry : Chemistry of flow of electrons Redox Reaction The electrons flow through the
Answers and Marking Scheme. Chemistry. Chemical Earth + Metals
 Answers and Marking Scheme Chemistry Chemical Earth + Metals Theory Test 2005 Part A 15 marks Attempt Questions 1 15 Allow about 20 minutes for this part Answer Box for Questions 1 15 1 A B C D 2 A B C
5 Energy from chemicals
 5 Energy from chemicals Content 5.1 Enthalpy 5.2 Hydrogen fuel cell Learning Outcomes Candidates should be able to: (a) (b) (c) (d) (e) describe the meaning of enthalpy change in terms of exothermic (H
4.4. Revision Checklist: Chemical Changes
 4.4. Revision Checklist: Chemical Changes Reactivity of metals When metals react with other substances the metal atoms form positive ions. The reactivity of a metal is related to its tendency to form positive
Clay Control and its Application in Fracture Design. Branden Ruyle Basin Engineering Staff Completions Engineer Consultant
 Clay Control and its Application in Fracture Design Branden Ruyle Basin Engineering Staff Completions Engineer Consultant Outline Agenda Characteristics Types of Clays and Mechanism Acidizing Control Additives
4.4. Revision Checklist: Chemical Changes
 4.4. Revision Checklist: Chemical Changes Reactivity of metals When metals react with other substances the metal atoms form positive ions. The reactivity of a metal is related to its tendency to form positive
Personalised Learning Checklists AQA Chemistry Paper 1
 AQA Chemistry (8462) from 2016 Topics C4.1 Atomic structure and the periodic table State that everything is made of atoms and recall what they are Describe what elements and compounds are State that elements
Chapter 4 Influences of Compositional, Structural and Environmental Factors on. Soil EM Properties
 Chapter 4 Influences of Compositional, Structural and Environmental Factors on Soil EM Properties 4. 1 Introduction The measured soil electromagnetic properties can be affected by a large number of factors
CHEMISTRY Ch. 14 Notes: Mixtures and Solutions NOTE: Vocabulary terms are in boldface and underlined. Supporting details are in italics.
 CHEMISTRY Ch. 14 Notes: Mixtures and Solutions NOTE: Vocabulary terms are in boldface and underlined. Supporting details are in italics. 14.1 notes I. Types of mixtures (mixture a physical blend of substances)
Ch. 4 - Clay Minerals, Rock Classification Page 1. Learning Objectives. Wednesday, January 26, 2011
 Ch. 4 - Clay Minerals, Rock Classification Page 1 Learning Objectives Ch. 4 - Clay Minerals, Rock Classification Page 2 Symbols Ch. 4 - Clay Minerals, Rock Classification Page 3 Clay Minerals and Structure
Miami Dade College CHM Second Semester General Chemistry
 Miami Dade College CHM 1046 - Second Semester General Chemistry Course Description: CHM 1046 is the second semester of a two-semester general chemistry course for science, premedical science and engineering
ICSE Board. Class X Chemistry. Board Paper Time: 1½ hrs Total Marks: 80
 ICSE Board Class X Chemistry Board Paper 2013 Time: 1½ hrs Total Marks: 80 General Instructions: 1. Answers to this paper must be written on the paper provided separately. 2. You will NOT be allowed to
OCR Chemistry Checklist
 Topic 1. Particles Video: The Particle Model Describe the main features of the particle model in terms of states of matter. Explain in terms of the particle model the distinction between physical changes
PhET Interactive Chemistry Simulations Aligned to an Example General Chemistry Curriculum
 PhET Interactive Chemistry Simulations Aligned to an Example General Chemistry Curriculum Alignment is based on the topics and subtopics addressed by each sim. Sims that directly address the topic area
ICSE Board Class X Chemistry Board Paper Time: 1½ hrs Total Marks: 80
 ICSE Board Class X Chemistry Board Paper 2011 Time: 1½ hrs Total Marks: 80 General Instructions: 1. Answers to this paper must be written on the paper provided separately. 2. You will NOT be allowed to
What are the chemical forms in which substances occur in aqueous solutions? Solution Composition
 Aqueous Reactions and Solution Stoichiometry Solution Composition Water possesses many unusual properties. One of the most important properties of water is its ability to dissolve a wide variety of substances.
for sodium ion (Na + )
") 3.4 Unit 2 Chemistry 2 Throughout this unit candidates will be expected to write word equations for reactions specified. Higher tier candidates will also be expected to write and balance symbol equations
3.4 Unit 2 Chemistry 2 Throughout this unit candidates will be expected to write word equations for reactions specified. Higher tier candidates will also be expected to write and balance symbol equations
11.3. Electrolytic Cells. Electrolysis of Molten Salts. 524 MHR Unit 5 Electrochemistry
 11.3 Electrolytic Cells Section Preview/ Specific Expectations In this section, you will identify the components of an electrolytic cell, and describe how they work describe electrolytic cells using oxidation
Analysis of Clays and Soils by XRD
 Analysis of Clays and Soils by XRD I. Introduction Proper sample preparation is one of the most important requirements in the analysis of powder samples by X-ray diffraction (XRD). This statement is especially
GCSE Additional Science
 GCSE Additional Science Module C5 Chemicals of the Natural Environment: What you should know Name: Science Group: Teacher: each of the statements to help focus your revision: R = Red: I don t know this
Separation Sciences. 1. Introduction: Fundamentals of Distribution Equilibrium. 2. Gas Chromatography (Chapter 2 & 3)
") Separation Sciences 1. Introduction: Fundamentals of Distribution Equilibrium 2. Gas Chromatography (Chapter 2 & 3) 3. Liquid Chromatography (Chapter 4 & 5) 4. Other Analytical Separations (Chapter 6-8)
Separation Sciences 1. Introduction: Fundamentals of Distribution Equilibrium 2. Gas Chromatography (Chapter 2 & 3) 3. Liquid Chromatography (Chapter 4 & 5) 4. Other Analytical Separations (Chapter 6-8)
Worksheet 1.1. Chapter 1: Quantitative chemistry glossary
 Worksheet 1.1 Chapter 1: Quantitative chemistry glossary Amount The number of moles of a substance present in a sample. Aqueous solution A solution with water as the solvent. Atmosphere The unit atmosphere
A dispersion (system) Colloidal solutions High molecular mass compounds
 Colloidal solutions High molecular mass compounds") A dispersion (system) Colloidal solutions High molecular mass compounds Outline Types of dispersions Characteristics of main types of dispersions Properties of colloidal solutions Structure of colloidal
A dispersion (system) Colloidal solutions High molecular mass compounds Outline Types of dispersions Characteristics of main types of dispersions Properties of colloidal solutions Structure of colloidal
ALPHA OMEGA ZEOLITES FOR THE OILFIELD BRIEF
 ALPHA-OMEGA ALPHA OMEGA ZEOLITES FOR THE OILFIELD BRIEF ALPHA OMEGA ECOLOGICAL SOLUTIONS Athens Office: 8, R. Garibaldi & Sofroniskou str. Tel. +30.210.9228225 Email: info@alpha-omega.com.gr SKYPE PHONE:
Model Solutions Spring 2003
 Exam 2 BE.462J/3.962J Model Solutions Spring 2003 (80 points total possible) 1. (10 points) Explain the phenomenon of phsensitive swelling in polyelectrolyte hydrogels. Why does the swelling depend on
MC 17 C SECTION - I (40 marks) Compulsory : Attempt all questions from this section.
 Compulsory : Attempt all questions from this section.") Question 1. (a) SECTION - I (40 marks) Compulsory : Attempt all questions from this section. Choose from the following list of substances, as to what matches the description from to given below : [Bronze,
Question 1. (a) SECTION - I (40 marks) Compulsory : Attempt all questions from this section. Choose from the following list of substances, as to what matches the description from to given below : [Bronze,
Chem 110 General Principles of Chemistry
 Chem 110 General Principles of Chemistry Chapter 3 (Page 88) Aqueous Reactions and Solution Stoichiometry In this chapter you will study chemical reactions that take place between substances that are dissolved
lect 26:Electrolytic Cells
 lect 26:Electrolytic Cells Voltaic cells are driven by a spontaneous chemical reaction that produces an electric current through an outside circuit. These cells are important because they are the basis
Chemistry 1011 TOPIC TEXT REFERENCE. Electrochemistry. Masterton and Hurley Chapter 18. Chemistry 1011 Slot 5 1
 Chemistry 1011 TOPIC Electrochemistry TEXT REFERENCE Masterton and Hurley Chapter 18 Chemistry 1011 Slot 5 1 18.5 Electrolytic Cells YOU ARE EXPECTED TO BE ABLE TO: Construct a labelled diagram to show
Personalised Learning Checklists AQA Trilogy Chemistry Paper 1
 AQA TRILOGY Chemistry (8464) from 2016 Topics T5.1 Atomic structure and the periodic table State that everything is made of atoms and recall what they are Describe what elements and compounds are State
IB Chemistry Solutions Gasses and Energy
 Solutions A solution is a homogeneous mixture it looks like one substance. An aqueous solution will be a clear mixture with only one visible phase. Be careful with the definitions of clear and colourless.
Downloaded from
 I.I.T.Foundation - XI Chemistry MCQ #10 Time: 45 min Student's Name: Roll No.: Full Marks: 90 Solutions I. MCQ - Choose Appropriate Alternative 1. Molarity is the number of moles of a solute dissolved
Electrochemistry. Part One: Introduction to Electrolysis and the Electrolysis of Molten Salts
 Part One: Introduction to Electrolysis and the Electrolysis of Molten Salts What do I need to know about electrochemistry? Electrochemistry Learning Outcomes: Candidates should be able to: a) Describe
Chapter 11 Properties of Solutions
 Chapter 11 Properties of Solutions Solutions Homogeneous mixtures of two or more substances Composition is uniform throughout the sample No chemical reaction between the components of the mixture Solvents
Solid Type of solid Type of particle Al(s) aluminium MgCl2 Magnesium chloride S8(s) sulfur
 aluminium MgCl2 Magnesium chloride S8(s) sulfur") QUESTION (2017:1) (iii) Sodium chloride, NaCl, is another compound that is excreted from the body in sweat. Use your knowledge of structure and bonding to explain the dissolving process of sodium chloride,
QUESTION (2017:1) (iii) Sodium chloride, NaCl, is another compound that is excreted from the body in sweat. Use your knowledge of structure and bonding to explain the dissolving process of sodium chloride,
Combined Science Chemistry Academic Overview
 Combined Science Chemistry Academic Overview 2018-2019 Science Term 1.1 Term 1.2 Term 2.1 Term 2.2 Term 3.1 Term 3.2 Year 9 States of Matter Methods of Separating and Purifying Substances Atomic Structure
Contents. 2. Fluids. 1. Introduction
 Contents 1. Introduction 2. Fluids 3. Physics of Microfluidic Systems 4. Microfabrication Technologies 5. Flow Control 6. Micropumps 7. Sensors 8. Ink-Jet Technology 9. Liquid Handling 10.Microarrays 11.Microreactors
Introduction Oxidation/reduction reactions involve the exchange of an electron between chemical species.
 Introduction Oxidation/reduction reactions involve the exchange of an electron between chemical species. The species that loses the electron is oxidized. The species that gains the electron is reduced.
Electrodes are normally made out of inert (unreactive) materials. Graphite and platinum are common electrode materials.
 materials. Graphite and platinum are common electrode materials.") Electrolysis Electrolysis is using an electric current to break up an ionic compound to form elements. Covalent compounds can t be split up by electrolysis. Terms used in electrolysis: Electrolyte - the
Electrolysis Electrolysis is using an electric current to break up an ionic compound to form elements. Covalent compounds can t be split up by electrolysis. Terms used in electrolysis: Electrolyte - the
All you need to know about Additional Science
 All you need to know about Additional Science Chapters in this unit 1. Structures and bonding 2. Structures and properties 3. How much? 4. Rates of reaction 5. Energy and reactions 6. Electrolysis 7. Acids,
MAHESH TUTORIALS I.C.S.E.
 MAHESH TUTORIALS I.C.S.E. GRADE - X (2017-2018) Exam No. : MT/ICSE/SEMI PRELIM - II - SET -A 020 Periodic Table, Chemical bonding, Acid, Bases and Salts, Practical Work, Mole Concept, Electrolysis Chemistry
Lecture 14: Cation Exchange and Surface Charging
 Lecture 14: Cation Exchange and Surface Charging Cation Exchange Cation Exchange Reactions Swapping of cations between hydrated clay interlayers and the soil solution Also occurs on organic matter functional
SOIL STRUCTURE AND FABRIC
 SOIL STRUCTURE AND FABRIC The structure of a soil is taken to mean both the geometric arrangement of the particles or mineral grains as well as the interparticle forces which may act between them. Soil
Adsorption at the solid/liquid interface
 1. Ion exchanger Adsorption at the solid/liquid interface Ion exchange process means an exchange of ions between an electrolyte solution and a solid (ionite). In most cases the term is used to denote the
Water Quality - Condensed Version 1999
 9.0 COAGULATION Virtually all surface water sources contain turbidity. ost of the suspended matter in water are present as finally divided or colloidal particles and these do not settle due to gravitational
Specific Curriculum Outcomes (updated September 18, 2016)
") 1 Chemistry 12 Specific Curriculum Outcomes (updated September 18, 2016) Unit A: Thermochemistry Overview: In this unit, students study energy as it relates to chemical changes and quantify the energy
1 Chemistry 12 Specific Curriculum Outcomes (updated September 18, 2016) Unit A: Thermochemistry Overview: In this unit, students study energy as it relates to chemical changes and quantify the energy
Metal + water -> metal hydroxide + hydrogen Metal + acid -> metal salt + hydrogen
 Name of Formula Formula of ion Name of salt Hydrochloric Sulphuric HCl Cl - Chloride H 2 SO 4 SO 4-2 Sulphate Key words: Oxidation: loss of electrons Reduction: gain of electrons Displacement reaction: