N E W S L E T T E R F R O M TO S H V I N A N A LY T I C A L P V T. LT D.
|
|
|
- Maximilian Paul
- 5 years ago
- Views:
Transcription


1 N E W S L E T T E R F R O M TO S H V I N A N A LY T I C A L P V T. LT D. AUGUST 204 TABLE OF CONTENTS Evaluation of Light Intensity Graph and Particle Size Distribution of Mixture Particle Application of Nuclear Magnetic Resonance (NMR) Spectroscopy for the Characterisation of Small Molecules Application of Photovisual DSC Evolved Gas Analysis by TG-FTIR


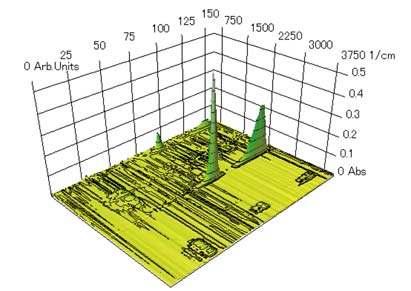
2 Evaluation of Light Intensity Graph and Particle Size Distribution of Mixture Particle Introduction The particle size distribution analyzer is useful to confirm the size, width and number of peaks. Shimadzu s laser diffraction particle size analyzers, the SALD series, obtain particle size distribution together with light intensity distribution. The light intensity distribution shows the scattered light intensity from sample particles on each sensor element. The peak intensity gives information on whether the sample concentration is suitable or not prior to measurement. The light intensity distribution graph is the raw data, has unique pattern for different size distribution, and it can be used in pre- and postmeasurement. Hence, it can be used to check whether the particle size distribution is correct or not, especially when measuring samples with unknown particle mixture. Here we introduce the analysis results of single and mixture samples with both the particle size distribution and the light intensity distribution. Samples Two samples of different particle size distribution were used for the measurement. Figure and 2 show the particle size distribution and light intensity distribution pattern of the sample with 0µm at 50% diameter size, whereas Figure 3 and 4 show µm particles at 50% diameter size. Samples are White Morundam/WA (Al O 99.6%) 2 3 #500 and #8000 by Showa Denko K.K. 0µm sample : WA# ±.0µm by Sedimentation measurement method µm sample : WA#8000.2±0.3µm by Electrical sensing zone method Results and Discussion Single size particle 0µm Figure : Particle size distribution of 0µm Al O 2 3 Figure 2: Light intensity distribution of 0µm Al O 2 3 Single size particle µm Figure 3: Particle size distribution of µm Al O 2 3 Measurement Condition Instrument Accessory Dispersing medium Dispersing agent Sample form Refractive index : SALD-2300 : SALD-MS23 : Pure Water : 0.% Sodium Hexametaphosphate : Suspension : i Figure 4: Light intensity distribution of µm Al O 2 3 The scattered light of bigger particles goes into smaller angle sensors, and smaller particles are detected by larger angle sensors. Particle size and distribution are estimated from raw data as shown in this light intensity graph. 2 AUGUST 204
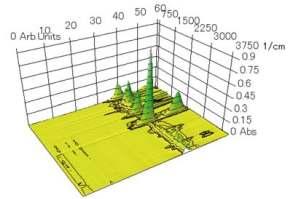
3 Mixture of µm and 0µm Figure 5 shows six different particle distribution curves. These samples comprised a mixture of µm and 0µm of Alumina (Al2O 3) powder with different mixing ratio. When the amount of µm particle is more than 7%, the measurement results are accurate at µm vol.% on the accumulative curve (Q3). When the amount of µm particle is less than 3%, the results of concentration become lower than actual concentration. Figure 6 shows the light intensity distribution curves of six different samples having the same mixing ratio as in Figure 5. The light intensity distribution curve for 0µm and µm is shown in Figure 2 and Figure 4 respectively. The intensity of the peak between 60th and 65th (red arrow) shows the amount of µm powder has nearly equivalent intervals of µm mixing percentage. The light intensity graph in Figure 9 shows the clear difference among four different concentration samples. We can confirm the difference between 0% and % by the light intensity distribution curves. 7% µm, 93% 0µm 5% µm, 95% 0µm % µm, 99% 0µm 0%µm, 00% 0µm Figure 7: Overlay particle size distribution (0 7%) 23% µm, 77% 0µm 20% µm, 80% 0µm 7% µm, 83% 0µm 3% µm, 87% 0µm 9% µm, 9% 0µm 5% µm, 95% 0µm Figure 8: Particle size distribution of 7% µm sample Figure 5: Overlay particle size distribution (5 30%) 7% µm, 93% 0µm 5% µm, 95% 0µm % µm, 99% 0µm 0%µm, 00% 0µm 23% µm, 77% 0µm 20% µm, 80% 0µm 7% µm, 83% 0µm 3% µm, 87% 0µm 9% µm, 9% 0µm 5% µm, 95% 0µm Figure 9: Overlay light intensity distribution (0-7%) Figure 6: Overlay light intensity distribution (5 30%) Figure 7 shows four different lower concentrations. The particle size distribution curves of 0-5% are the same, and there is no peak around µm (blue arrow). However, in the particle size distribution of 7% sample, small peaks are observed around µm particle. Figure 8 shows the enlarged distribution graph of 7% sample. Conclusions The light intensity distribution pattern is an extremely useful tool to avoid inaccurate results in samples which contain smaller size contaminants or unknown samples. It is applicable in laser diffraction and scattering method to determine the accuracy of the results. References Abrasive Micro Grain Size JIS R600 AUGUST 204 3

4 Application of Nuclear Magnetic Resonance (NMR) Spectroscopy for the Characterisation of Small Molecules Background There are a variety of spectroscopic techniques that will give information about the structure of a molecule. Techniques such as FT-IR and Raman can give information about the functional groups and molecular backbone respectively. However, they cannot give all of the information about the molecule and the environment of the nuclei. Nuclear Magnetic Resonance (NMR) is a powerful technique for providing information about functional groups, molecular backbone AND the chemical environment of the nuclei in the molecule. The principle of NMR is that the resonance frequency of a nucleus is determined by its gyromagnetic ratio and the strength of the static magnetic field. If this was the only factor determining resonance then nuclei of the same type would have identical frequencies. However, the resonance frequency of a nucleus also depends subtly on its location within a molecule. More precisely it depends on the electron distribution in a molecule and the shielding effect of the surrounding electrons. The shielding is the result of the static magnetic field inducing electron orbital motion. This motion generates a small magnetic field in the opposite direction to the main field. Thus each nucleus experiences a slightly different magnetic field depending on their location in a molecule. This effect is referred to as chemical shift and is the basis for the chemical specificity that is one of the great strengths of NMR spectroscopy. Chemical shift is not the only information contained in a NMR spectrum. The magnetic interaction between neighbouring nuclei mediated through the bonding network is referred to as J-coupling or scalar coupling. This coupling between nuclei results in multiplets in the NMR spectrum. The number of spectral lines and spacing between them in a multiplet provides additional information about the structure of a molecule. In addition, NMR has the advantage that the amplitude of the NMR signal is directly proportional to the concentrations of the contributing nuclei. Therefore, the ratio of the area under the different peaks corresponds to the number of nuclei per molecule contributing to a resonance. The spectral peak integrals are useful additional information that helps confirm spectral assignments. Analysis To demonstrate the quality of spectra that can be obtained at.4 T corresponding to a H resonance frequency of 60 MHz, the H spectrum from 5 small molecules are shown in Figure. The molecules all have the same chemical formula C6H0O 2 and contain a double bond and a carboxyl group (-C(=O)O) in the form of an ester (R-C(=O)O-R ) or a carboxylic acid (R-C(=O)O-H). 500 mm solutions of each molecule were prepared in CDCl and 00 µl were transferred 3 to a 5 mm NMR tube.. Detailed Interpretation of the Ethyl Crotonate spectrum Figure : Spectra of 5 small molecules with the chemical formula C H O Figure 2: chemical structure of ethyl crotonate AUGUST 204
5 The H spectrum of ethyl crotonate (figure 2) acquired at 60 MHz is shown in figure 3. The spectrum shows a singlet resonance at 9.23 ppm which can be attributed to the triazine added to the solution to provide a reference signal. There are five other resonances labelled A to E with a range of coupling patterns which can be used for spectral assignment. Resonance A centred at.25 ppm is a triplet with a splitting of 7. Hz. Resonance B centred on.84 is a doublet of doublets with splittings 6.8 Hz and.56 Hz. Resonance C centred at 4.6 ppm is a quartet with splitting 7. Hz. Resonance D centred 5.8 ppm is a doublet of quartets splitting 5.46 Hz and.56 Hz. Resonance E is a doublet of quartets centred at 6.99 ppm with splittings 5.46 Hz and 6.8 Hz. The spectral information is summarised in table. Considering the chemical shifts only and comparing them to typical values for H nuclei, resonance A and B are likely to originate from the two methyl groups (-CH ), with 3 resonance C originating from the methylene group (-CH2-) and the source of resonances D and E is the two alkene H nuclei. The splitting pattern of resonances A and B can be used to assign the appropriate methyl groups. The triplet pattern of resonance A and the single splitting imply that the nuclei assigned to resonance A should have two identical neighbouring H nuclei, while the doublet of doublets structure in resonance B implies two non- identical neighbouring H nuclei with two different splittings. It is now possible to assign resonance A to the methyl H nuclei of the ethyl group (CH3-CH2-). Further evidence for this assignment. is resonance C which has been assigned to the methylene hydrogens of the ethyl group. The quartet structure implies three identical neighbouring H nuclei with the same splitting as resonance A. In fact the triplet, quartet pair of resonances is typical of an ethyl group. Resonance B can be assigned to the second methyl group that is adjacent to the double bond, where the two alkene H nuclei are the source of the two different splittings. Splittings across a double bond are typically larger than those across a single bond and the mutual coupling between the two alkene H nuclei accounts for the 5.46 Hz splitting. The coupling between two H nuclei becomes weaker the greater the number of bonds between them. Resonance E can be assigned to the alkene H nuclei closest to the methyl group, accounting for the 6.8 Hz splitting. Resonance D, therefore, can be assigned to the alkene hydrogen nuclei closest to the carboxyl group with the weaker coupling to the methyl group. Further evidence for the assignments can be obtained by integrating the area under each of the resonances. Normalising the integral of resonance C to a value of 2 it can be shown that the other resonance correspond to the correct number of nuclei. The integrals for Resonances A and B show inaccuracies due to the overlap in the spectrum. It is notable in figure 3 that the multiplet patterns of the resonances are not symmetrical and in the case of the ethyl groups (-CH2-CH 3) do not conform to the binomial pattern, :3:3: and :2:, of peak amplitudes. The asymmetry is particularly obvious in resonance D and resonance E, although it is still noticeable in the other resonances. The source of the asymmetry is strong coupling. At 60 MHz the differences in chemical shift between two neighbouring nuclei is not necessarily much larger than the scalar coupling between them. Under these conditions the weak coupling assumption is no longer valid and coupling patterns associated with weak coupling should not be expected. Table : Summary of the spectral information and peak assignments for ethyl crotonate Label A δh (ppm).25 multiplicity triplet Splitting (Hz) 7. Integral 3.29 (3) assignment ethyl CH 3 B.84 doublet of doublets 6.8, (3) crotonyl -CH 3 C 4.6 quartet 7. 2 (2) ethyl CH - 2 D 5.80 doublet of doublets 5.5, () =CH C(=O)- E 6.99 doublet of quartets 5.5, () -CH= Figure 3: H spectrum of 0.5 M ethyl crotonate in CDCl 3 acquired at 60 MHz triazine 9.23 singlet - - triazine reference AUGUST 204 5
6

7 Application of Photovisual DSC Photovisual DSC is a differential scanning calorimetry (DSC) system with a transparent quartz glass window in the furnace cover to permit direct observations of changes in the sample status during measurements. A microscope and CCD camera offer magnified images in realtime. These images can be stored, if required. This system is effective for confirming the sample status corresponding to the endothermic and exothermic peaks obtained by DSC. This Application News introduces examples of the application of Photovisual DSC, particularly to foods and drugs. Fig. System Configuration of Photovisual DSC Measurement of Margarine Margarine was sampled in an aluminum cell and heated from -70 C. A feature of this system is the ability to operate in the subzero temperature region and to observe samples undergoing DSC while cooled by a coolant, such as liquid nitrogen. Fig. 3 Fig.2 Photovisual DSC shows the results of DSC measurements on margarine. Multiple endothermic peaks are observed due to the melting of the oils and fats in the margarine. Fig. 4 to Fig. 6 show the sample status at the positions indicated by the arrows. Fig.4 Fig.5 Fig.3 DSC Curve for Margarine Fig.6 AUGUST 204 7


8 Measurement of Sulfathiazole Fig. 7 shows the result of a DSC measurement from the heating of sulfathiazole after it is pulverized in a mortar and pestle. Sulfathiazole exists in many crystal forms. The peak near 57 C is thought to be a crystal transition from Form 3 to Form. The peak at 202 C is thought to result from the melting of Form. Fig. 8 to Fig. 0 show images of the sample during heating. Observations before and after the 57 C peak (thought to be a crystal transition) indicate no difference in the sample status. After the peak at 202 C, the sample has melted to a liquid. Fig.7 DSC Curve for Sulfathiazole Measurement of Whisky Fig. shows a DSC measurement result from heating whiskey chilled and frozen at -20 C. The endothermic peak at -66 C is due to ethanol and the endothermic peak at -26 C is thought to result from the melting of water. The white cloudy areas increase due to the melting of ethanol at -66 C, as shown in Fig. 3 and 4. Subsequently, the sample becomes transparent after the water melts at-26 C, as shown in Fig. 5 and 6. The white cloudiness is believed to result from separation of a liquid phase within the solid phase due to the melting of ethanol. The irregular lines apparent in Fig. 2 are due to cracking of the frozen sample. Fig. DSC Curve for Whisky 8 AUGUST 204

9
10

11

12
4. NMR spectra. Interpreting NMR spectra. Low-resolution NMR spectra. There are two kinds: Low-resolution NMR spectra. High-resolution NMR spectra
 1 Interpreting NMR spectra There are two kinds: Low-resolution NMR spectra High-resolution NMR spectra In both cases the horizontal scale is labelled in terms of chemical shift, δ, and increases from right
CHEM Chapter 13. Nuclear Magnetic Spectroscopy (Homework) W
 W") CHEM 2423. Chapter 13. Nuclear Magnetic Spectroscopy (Homework) W Short Answer 1. For a nucleus to exhibit the nuclear magnetic resonance phenomenon, it must be magnetic. Magnetic nuclei include: a. all
CHEM 2423. Chapter 13. Nuclear Magnetic Spectroscopy (Homework) W Short Answer 1. For a nucleus to exhibit the nuclear magnetic resonance phenomenon, it must be magnetic. Magnetic nuclei include: a. all
The resonance frequency of the H b protons is dependent upon the orientation of the H a protons with respect to the external magnetic field:
 Spin-Spin Splitting in Alkanes The signal arising from a proton or set of protons is split into (N+1) lines by the presence of N adjacent nuclei Example 1: Bromoethane The resonance frequency of the H
Experiment 2 - NMR Spectroscopy
 Experiment 2 - NMR Spectroscopy OBJECTIVE to understand the important role of nuclear magnetic resonance spectroscopy in the study of the structures of organic compounds to develop an understanding of
16.1 Introduction to NMR Spectroscopy. Spectroscopy. Spectroscopy. Spectroscopy. Spectroscopy. Spectroscopy 4/11/2013
 What is spectroscopy? NUCLEAR MAGNETIC RESONANCE (NMR) spectroscopy may be the most powerful method of gaining structural information about organic compounds. NMR involves an interaction between electromagnetic
Structure Determination: Nuclear Magnetic Resonance Spectroscopy
 Structure Determination: Nuclear Magnetic Resonance Spectroscopy Why This Chapter? NMR is the most valuable spectroscopic technique used for structure determination More advanced NMR techniques are used
HWeb27 ( ; )
") HWeb27 (9.1-9.2; 9.12-9.18) 28.1. Which of the following cannot be determined about a compound by mass spectrometry? [a]. boiling point [b]. molecular formula [c]. presence of heavy isotopes (e.g., 2 H,
HWeb27 (9.1-9.2; 9.12-9.18) 28.1. Which of the following cannot be determined about a compound by mass spectrometry? [a]. boiling point [b]. molecular formula [c]. presence of heavy isotopes (e.g., 2 H,
Chapter 9. Nuclear Magnetic Resonance. Ch. 9-1
 Chapter 9 Nuclear Magnetic Resonance Ch. 9-1 1. Introduction Classic methods for organic structure determination Boiling point Refractive index Solubility tests Functional group tests Derivative preparation
The Use of NMR Spectroscopy
 Spektroskopi Molekul Organik (SMO): Nuclear Magnetic Resonance (NMR) Spectroscopy All is adopted from McMurry s Organic Chemistry The Use of NMR Spectroscopy Used to determine relative location of atoms
NUCLEAR MAGNETIC RESONANCE AND INTRODUCTION TO MASS SPECTROMETRY
 NUCLEAR MAGNETIC RESONANCE AND INTRODUCTION TO MASS SPECTROMETRY A STUDENT SHOULD BE ABLE TO: 1. Identify and explain the processes involved in proton ( 1 H) and carbon-13 ( 13 C) nuclear magnetic resonance
3.15 Nuclear Magnetic Resonance Spectroscopy, NMR
 3.15 Nuclear Magnetic Resonance Spectroscopy, NMR What is Nuclear Magnetic Resonance - NMR Developed by chemists and physicists together it works by the interaction of magnetic properties of certain nuclei
OAT Organic Chemistry - Problem Drill 19: NMR Spectroscopy and Mass Spectrometry
 OAT Organic Chemistry - Problem Drill 19: NMR Spectroscopy and Mass Spectrometry Question No. 1 of 10 Question 1. Which statement concerning NMR spectroscopy is incorrect? Question #01 (A) Only nuclei
Chapter 13 Structure t Determination: Nuclear Magnetic Resonance Spectroscopy
 John E. McMurry www.cengage.com/chemistry/mcmurry Chapter 13 Structure t Determination: ti Nuclear Magnetic Resonance Spectroscopy Revisions by Dr. Daniel Holmes MSU Paul D. Adams University of Arkansas
Basic Concepts of NMR: Identification of the Isomers of C 4 O 2. by 1 H NMR Spectroscopy
 Basic Concepts of NM: Identification of the Isomers of C H 8 O by H NM Spectroscopy Objectives NM spectroscopy is a powerful tool in determining the structure of compounds. Not only is it able to give
NMR SPECTROSCOPY DR. M. KANJIA. Copyright reserved NMRS. Application to reproduce to Dr M Kanjia
 NMR SPECTROSCOPY DR. M. KANJIA Copyright reserved NMRS Application to reproduce to Dr M Kanjia 13 C NMR Spectra of Butan-2-ol CH 3 CHOH CH 2 CH 3 135 DEPT 13 C NMR CH 3 CHOH CH 2 CH 3 D = Doublet T = Triplet
MOLECULAR SPECTROSCOPY AND PHOTOCHEMISTRY
 20 CHAPTER MOLECULAR SPECTROSCOPY AND PHOTOCHEMISTRY 20.1 Introduction to Molecular Spectroscopy 20.2 Experimental Methods in Molecular Spectroscopy 20.3 Rotational and Vibrational Spectroscopy 20.4 Nuclear
Organic Chemistry II (CHE ) Examination I February 11, Name (Print legibly): Key. Student ID#:
 Examination I February 11, Name (Print legibly): Key. Student ID#:") rganic hemistry II (HE 232-001) Examination I February 11, 2009 Name (Print legibly): Key (last) (first) Student ID#: PLEASE observe the following: You are allowed to have scratch paper (provided by me),
rganic hemistry II (HE 232-001) Examination I February 11, 2009 Name (Print legibly): Key (last) (first) Student ID#: PLEASE observe the following: You are allowed to have scratch paper (provided by me),
Thermal and nonlinear optical studies of newly synthesized EDOT based bent-core and hockey-stick like liquid crystals
 Electronic Supplementary Material (ESI) for New Journal of Chemistry. This journal is The Royal Society of Chemistry and the Centre National de la Recherche Scientifique 2018 Electronic supplementary information:
Spin-spin coupling I Ravinder Reddy
 Spin-spin coupling I Ravinder Reddy Spin-interactions External interactions Magnetic field Bo, RF field B1 Internal Interactions Molecular motions Exchange Chemical shifts J-coupling Spin Diffusion Dipolar
16.1 Introduction to NMR. Spectroscopy
 16.1 Introduction to NMR What is spectroscopy? Spectroscopy NUCLEAR MAGNETIC RESNANCE (NMR) spectroscopy may be the most powerful method of gaining structural information about organic compounds. NMR involves
Objective 4. Determine (characterize) the structure of a compound using IR, NMR, MS.
 the structure of a compound using IR, NMR, MS.") Objective 4. Determine (characterize) the structure of a compound using IR, NMR, MS. Skills: Draw structure IR: match bond type to IR peak NMR: ID number of non-equivalent H s, relate peak splitting to
Objective 4. Determine (characterize) the structure of a compound using IR, NMR, MS. Skills: Draw structure IR: match bond type to IR peak NMR: ID number of non-equivalent H s, relate peak splitting to
Spectroscopy in Organic Chemistry. Types of Spectroscopy in Organic
 Spectroscopy in Organic Chemistry Spectroscopy Spectrum dealing with light, or more specifically, radiation Scope to see Organic Spectroscopy therefore deals with examining how organic molecules interact
Experiment 11: NUCLEAR MAGNETIC RESONANCE SPECTROSCOPY
 Experiment 11: NUCLEAR MAGNETIC RESONANCE SPECTROSCOPY Purpose: This is an exercise to introduce the use of nuclear magnetic resonance spectroscopy, in conjunction with infrared spectroscopy, to determine
12-June-2016 Chemsheets A Page 1
 www.chemsheets.co.uk 12-June-2016 Chemsheets A2 1070 Page 1 SECTION 1 1 H NMR Why compounds absorb radiowaves (background information beyond specifications) NMR (nuclear magnetic resonance) is a very powerful
Ethyl crotonate. Example of benchtop NMR on small organic molecules
 R Ethyl crotonate Example of benchtop NMR on small organic molecules Ethyl crotonate (C 6 H 10 O 2 ) is a colourless liquid at room temperature. It is soluble in water, and is used as a solvent for cellulose
CHEMISTRY Organic Chemistry Laboratory II Spring 2019 Lab #5: NMR Spectroscopy
 Team Members: Unknown # CHEMISTRY 244 - Organic Chemistry Laboratory II Spring 2019 Lab #5: NMR Spectroscopy Purpose: You will learn how to predict the NMR data for organic molecules, organize this data
Proton NMR. Four Questions
 Proton NMR Four Questions How many signals? Equivalence Where on spectrum? Chemical Shift How big? Integration Shape? Splitting (coupling) 1 Proton NMR Shifts Basic Correlation Chart How many 1 H signals?
CHEM311 FALL 2005 Practice Exam #3
 EM311 FALL 2005 Practice Exam #3 Instructions: This is a multiple choice / short answer practice exam. For the multiple-choice questions, there may be more than one correct answer. If so, then circle as
PAPER No. 12: ORGANIC SPECTROSCOPY. Module 19: NMR Spectroscopy of N, P and F-atoms
 Subject Chemistry Paper No and Title Module No and Title Module Tag Paper 12: Organic Spectroscopy CHE_P12_M19_e-Text TABLE OF CONTENTS 1. Learning Outcomes 2. 15 N NMR spectroscopy 3. 19 F NMR spectroscopy
12BL Experiment 6 Prelab: NMR Analysis
 12BL Experiment 6 Prelab: NMR Analysis 1. Review the NMR Summary Powerpoint on our lab website under Techniques. 2. Explain if the following statement is true or not: An NMR reports a signal for every
Chapter 15 Lecture Outline
 Organic Chemistry, First Edition Janice Gorzynski Smith University of Hawaii Chapter 5 Lecture Outline Introduction to NMR Two common types of NMR spectroscopy are used to characterize organic structure:
Analysis of NMR Spectra Part 2
 Analysis of NMR Spectra Part 2-1- Analysis of NMR Spectra Part 2 "Things should be made as simple as possible, but not any simpler." Albert Einstein 1.1 Review of Basic NMR Concepts NMR analysis is a complex
IR, MS, UV, NMR SPECTROSCOPY
 CHEMISTRY 318 IR, MS, UV, NMR SPECTROSCOPY PROBLEM SET All Sections CHEMISTRY 318 IR, MS, UV, NMR SPECTROSCOPY PROBLEM SET General Instructions for the 318 Spectroscopy Problem Set Consult the Lab Manual,
NMR = Nuclear Magnetic Resonance
 NMR = Nuclear Magnetic Resonance NMR spectroscopy is the most powerful technique available to organic chemists for determining molecular structures. Looks at nuclei with odd mass numbers or odd number
CHEM311 FALL 2005 Practice Exam #3
 CHEM311 FALL 2005 Practice Exam #3 Instructions: This is a multiple choice / short answer practice exam. For the multiple-choice questions, there may be more than one correct answer. If so, then circle
Paper 12: Organic Spectroscopy
 Subject Chemistry Paper No and Title Module No and Title Module Tag Paper 12: Organic Spectroscopy 31: Combined problem on UV, IR, 1 H NMR, 13 C NMR and Mass - Part III CHE_P12_M31 TABLE OF CONTENTS 1.
Teacher Notes on: NMR Spectroscopy
 Teacher Notes on: NMR Spectroscopy What is it? Nuclear Magnetic Resonance (NMR) spectroscopy is (arguably) the most powerful tool available for determining the structure of organic compounds. This technique
E35 SPECTROSCOPIC TECHNIQUES IN ORGANIC CHEMISTRY
 E35 SPECTRSCPIC TECNIQUES IN RGANIC CEMISTRY Introductory Comments. These notes are designed to introduce you to the basic spectroscopic techniques which are used for the determination of the structure
ORGANIC - BROWN 8E CH NUCLEAR MAGNETIC RESONANCE.
 !! www.clutchprep.com CONCEPT: 1 H NUCLEAR MAGNETIC RESONANCE- GENERAL FEATURES 1 H (Proton) NMR is a powerful instrumental method that identifies protons in slightly different electronic environments
William H. Brown & Christopher S. Foote
 Requests for permission to make copies of any part of the work should be mailed to:permissions Department, Harcourt Brace & Company, 6277 Sea Harbor Drive, Orlando, Florida 32887-6777 William H. Brown
4) protons experience a net magnetic field strength that is smaller than the applied magnetic field.
 protons experience a net magnetic field strength that is smaller than the applied magnetic field.") 1) Which of the following CANNOT be probed by an spectrometer? See sect 15.1 Chapter 15: 1 A) nucleus with odd number of protons & odd number of neutrons B) nucleus with odd number of protons &even number
1) Which of the following CANNOT be probed by an spectrometer? See sect 15.1 Chapter 15: 1 A) nucleus with odd number of protons & odd number of neutrons B) nucleus with odd number of protons &even number
Tuesday, January 13, NMR Spectroscopy
 NMR Spectroscopy NMR Phenomenon Nuclear Magnetic Resonance µ A spinning charged particle generates a magnetic field. A nucleus with a spin angular momentum will generate a magnetic moment (μ). If these
C h a p t e r S i x t e e n: Nuclear Magnetic Resonance Spectroscopy. An 1 H NMR FID of ethanol
 0.2 0.4 0.6 0.8 1.0 1.2 1.4 1.6 1.8 2.0 2.2 2.4 2.6 2.8 3.0 3.2 3.4 3.6 C h a p t e r S i x t e e n: Nuclear Magnetic Resonance Spectroscopy An 1 NMR FID of ethanol Note: Problems with italicized numbers
Module 13: Chemical Shift and Its Measurement
 Subject Chemistry Paper No and Title Module No and Title Module Tag Paper 12: Organic Spectroscopy CHE_P12_M13_e-Text TABLE OF CONTENTS 1. Learning Outcomes 2. Introduction 3. Shielding and deshielding
Química Orgânica I. Nuclear Magnetic Resonance Spectroscopy (I) Ciências Farmacêuticas Bioquímica Química AFB QO I 2007/08 1 AFB QO I 2007/08 2
 Ciências Farmacêuticas Bioquímica Química AFB QO I 2007/08 1 AFB QO I 2007/08 2") Química Orgânica I Ciências Farmacêuticas Bioquímica Química AFB QO I 2007/08 1 Nuclear Magnetic Resonance Spectroscopy (I) AFB QO I 2007/08 2 1 Adaptado de: Organic Chemistry, 6th Edition; L. G. Wade,
Química Orgânica I Ciências Farmacêuticas Bioquímica Química AFB QO I 2007/08 1 Nuclear Magnetic Resonance Spectroscopy (I) AFB QO I 2007/08 2 1 Adaptado de: Organic Chemistry, 6th Edition; L. G. Wade,
τ 1 > 1/J - if this lifetime is significantly shortened, the coupling (splitting of the signal) will not be observed
 will not be observed") It is often advantageous to reverse or remove the splitting caused by spin-spin coupling This is called spin decoupling Spin decoupling (or just decoupling) can be used for several reasons - to simplify
It is often advantageous to reverse or remove the splitting caused by spin-spin coupling This is called spin decoupling Spin decoupling (or just decoupling) can be used for several reasons - to simplify
Chapter 13: Nuclear Magnetic Resonance (NMR) Spectroscopy direct observation of the H s and C s of a molecules
 Spectroscopy direct observation of the H s and C s of a molecules") hapter 13: Nuclear Magnetic Resonance (NMR) Spectroscopy direct observation of the s and s of a molecules Nuclei are positively charged and spin on an axis; they create a tiny magnetic field + + Not all
hapter 13: Nuclear Magnetic Resonance (NMR) Spectroscopy direct observation of the s and s of a molecules Nuclei are positively charged and spin on an axis; they create a tiny magnetic field + + Not all
NMRis the most valuable spectroscopic technique for organic chemists because it maps the carbon-hydrogen framework of a molecule.
 Chapter 13: Nuclear magnetic resonance spectroscopy NMRis the most valuable spectroscopic technique for organic chemists because it maps the carbon-hydrogen framework of a molecule. 13.2 The nature of
Chapter 13 Nuclear Magnetic Resonance Spectroscopy
 Organic Chemistry, 6 th Edition L. G. Wade, Jr. Chapter 13 Nuclear Magnetic Resonance Spectroscopy Jo Blackburn Richland College, Dallas, TX Dallas County Community College District 2006, Prentice Hall
PAPER No.12 :Organic Spectroscopy MODULE No.29: Combined problem on UV, IR, 1 H NMR, 13 C NMR and Mass - Part I
 Subject Chemistry Paper No and Title Module No and Title Module Tag 12: rganic Spectroscopy 29: Combined problem on UV, IR, 1 H NMR, 13 C NMR and Mass - Part I CHE_P12_M29 TABLE F CNTENTS 1. Learning utcomes
CHAPTER 8 ISOLATION AND CHARACTERIZATION OF PHYTOCONSTITUENTS BY COLUMN CHROMATOGRAPHY
 146 CHAPTER 8 ISLATIN AND CHARACTERIZATIN F PHYTCNSTITUENTS BY CLUMN CHRMATGRAPHY 8.1 INTRDUCTIN Column chromatography is an isolation technique in which the phytoconstituents are being eluted by adsorption.
ORGANIC - CLUTCH CH ANALYTICAL TECHNIQUES: IR, NMR, MASS SPECT
 !! www.clutchprep.com CONCEPT: PURPOSE OF ANALYTICAL TECHNIQUES Classical Methods (Wet Chemistry): Chemists needed to run dozens of chemical reactions to determine the type of molecules in a compound.
Principles of Molecular Spectroscopy: Electromagnetic Radiation and Molecular structure. Nuclear Magnetic Resonance (NMR)
") Principles of Molecular Spectroscopy: Electromagnetic Radiation and Molecular structure Nuclear Magnetic Resonance (NMR) !E = h" Electromagnetic radiation is absorbed when the energy of photon corresponds
Principles of Molecular Spectroscopy: Electromagnetic Radiation and Molecular structure Nuclear Magnetic Resonance (NMR) !E = h" Electromagnetic radiation is absorbed when the energy of photon corresponds
CHEM 322 Laboratory Methods in Organic Chemistry. Introduction to NMR Spectroscopy
 EM 322 Laboratory Methods in Organic hemistry Introduction to NMR Spectroscopy What structural information does NMR spectroscopy provide? 1) hemical shift (δ) data reveals the molecular (functional group)
ORGANIC - CLUTCH CH ANALYTICAL TECHNIQUES: IR, NMR, MASS SPECT
 !! www.clutchprep.com CONCEPT: PURPOSE OF ANALYTICAL TECHNIQUES Classical Methods (Wet Chemistry): Chemists needed to run dozens of chemical reactions to determine the type of molecules in a compound.
(a) Name the alcohol and catalyst which would be used to make X. (2)
 Name the alcohol and catalyst which would be used to make X. (2)") 1 The chemical X is an ester with formula CH 3 COOC(CH 3 ) 3 which occurs in raspberries and pears. It can be prepared in the laboratory by refluxing ethanoic acid with an alcohol in the presence of a
1 The chemical X is an ester with formula CH 3 COOC(CH 3 ) 3 which occurs in raspberries and pears. It can be prepared in the laboratory by refluxing ethanoic acid with an alcohol in the presence of a
Magnetic Nuclei other than 1 H
 Magnetic Nuclei other than 1 H 2 H (Deuterium): I = 1 H,D-Exchange might be used to simplify 1 H-NMR spectra since H-D couplings are generally small; - - - -O- - - -D 2 -O- triplet of triplets slightly
Chapter 7. Nuclear Magnetic Resonance Spectroscopy
 Chapter 7 Nuclear Magnetic Resonance Spectroscopy I. Introduction 1924, W. Pauli proposed that certain atomic nuclei have spin and magnetic moment and exposure to magnetic field would lead to energy level
Chapter 18: NMR Spectroscopy
 The most important tool of the chemist for the determination of molecular structure is Nuclear Magnetic Resonance Spectroscopy, or NMR spectroscopy. NMR spectra are acquired on a special instrument called
4) protons experience a net magnetic field strength that is smaller than the applied magnetic field.
 protons experience a net magnetic field strength that is smaller than the applied magnetic field.") 1) Which of the following CANNOT be probed by an NMR spectrometer? See sect 15.1 Chapter 15: 1 A) nucleus with odd number of protons & odd number of neutrons B) nucleus with odd number of protons &even
1) Which of the following CANNOT be probed by an NMR spectrometer? See sect 15.1 Chapter 15: 1 A) nucleus with odd number of protons & odd number of neutrons B) nucleus with odd number of protons &even
Structure Determination
 There are more than 5 million organic compounds, the great majority of which are colourless liquids or white solids. Identifying or at least characterising determining some of its properties and features
Nuclear Magnetic Resonance Spectroscopy
 13 Nuclear Magnetic Resonance Spectroscopy Solutions to In-Text Problems 13.1 (b) Apply Eq. 13.2b with = 360 MHz. chemical shift in Hz = δ = (4.40)(360) = 1584 Hz 13.2 (b) Follow the same procedure used
Instrumental Chemical Analysis
 L15 Page1 Instrumental Chemical Analysis Nuclear Magnetic Resonance Dr. Ahmad Najjar Philadelphia University Faculty of Pharmacy Department of Pharmaceutical Sciences 1 st semester, 2017/2018 Nuclear Magnetic
Chapter 14. Nuclear Magnetic Resonance Spectroscopy
 Organic Chemistry, Second Edition Janice Gorzynski Smith University of Hawai i Chapter 14 Nuclear Magnetic Resonance Spectroscopy Prepared by Rabi Ann Musah State University of New York at Albany Copyright
Nuclear Magnetic Resonance Spectroscopy: Tools for Structure Determination
 Nuclear Magnetic Resonance Spectroscopy: Tools for Structure Determination Chung-Ming Sun Department of Applied Chemistry National Chiao Tung University Hualien 300, Taiwan Introduction NMR (Nuclear Magnetic
Indirect Coupling. aka: J-coupling, indirect spin-spin coupling, indirect dipole-dipole coupling, mutual coupling, scalar coupling (liquids only)
") Indirect Coupling aka: J-coupling, indirect spin-spin coupling, indirect dipole-dipole coupling, mutual coupling, scalar coupling (liquids only) First, two comments about direct coupling Nuclear spins
Indirect Coupling aka: J-coupling, indirect spin-spin coupling, indirect dipole-dipole coupling, mutual coupling, scalar coupling (liquids only) First, two comments about direct coupling Nuclear spins
Nuclear Magnetic Resonance Spectroscopy (NMR)
") OCR Chemistry A 432 Spectroscopy (NMR) What is it? An instrumental method that gives very detailed structural information about molecules. It can tell us - how many of certain types of atom a molecule
OCR Chemistry A 432 Spectroscopy (NMR) What is it? An instrumental method that gives very detailed structural information about molecules. It can tell us - how many of certain types of atom a molecule
Nuclear magnetic resonance spectroscopy II. 13 C NMR. Reading: Pavia Chapter , 6.7, 6.11, 6.13
 Nuclear magnetic resonance spectroscopy II. 13 NMR Reading: Pavia hapter 6.1-6.5, 6.7, 6.11, 6.13 1. General - more/better/additional structural information for larger compounds -problems: a) isotopes
I690/B680 Structural Bioinformatics Spring Protein Structure Determination by NMR Spectroscopy
 I690/B680 Structural Bioinformatics Spring 2006 Protein Structure Determination by NMR Spectroscopy Suggested Reading (1) Van Holde, Johnson, Ho. Principles of Physical Biochemistry, 2 nd Ed., Prentice
Nuclear Magnetic Resonance (NMR) Spectroscopy Introduction:
 Spectroscopy Introduction:") Nuclear Magnetic Resonance (NMR) Spectroscopy Introduction: Nuclear magnetic resonance spectroscopy (NMR) is the most powerful tool available for organic structure determination. Like IR spectroscopy,
Nuclear Magnetic Resonance (NMR) Spectroscopy Introduction: Nuclear magnetic resonance spectroscopy (NMR) is the most powerful tool available for organic structure determination. Like IR spectroscopy,
CHEM1102 Worksheet 4 Answers to Critical Thinking Questions Model 1: Infrared (IR) Spectroscopy
 Spectroscopy") CEM1102 Worksheet 4 Answers to Critical Thinking Questions Model 1: Infrared (IR) Spectroscopy 1. See below. Model 2: UV-Visible Spectroscopy 1. See below. 2. All of the above. 3. Restricted to the identification
CEM1102 Worksheet 4 Answers to Critical Thinking Questions Model 1: Infrared (IR) Spectroscopy 1. See below. Model 2: UV-Visible Spectroscopy 1. See below. 2. All of the above. 3. Restricted to the identification
Nuclear Magnetic Resonance Spectroscopy
 Chapter 5 Nuclear Magnetic Resonance Spectroscopy http://www.yteach.co.uk/page.php/resources/view_all?id=nuclear_magnetic _resonance_nmr_spectroscopy_spin_spectrometer_spectrum_proton_t_pag e_5&from=search
Nuclear Magnetic Resonance H-NMR Part 1 Introduction to NMR, Instrumentation, Sample Prep, Chemical Shift. Dr. Sapna Gupta
 Nuclear Magnetic Resonance H-NMR Part 1 Introduction to NMR, Instrumentation, Sample Prep, Chemical Shift Dr. Sapna Gupta Introduction NMR is the most powerful tool available for organic structure determination.
Calculate a rate given a species concentration change.
 Kinetics Define a rate for a given process. Change in concentration of a reagent with time. A rate is always positive, and is usually referred to with only magnitude (i.e. no sign) Reaction rates can be
Measurement techniques
 Measurement techniques 1 GPC GPC = gel permeation chromatography GPC a type of size exclusion chromatography (SEC), that separates analytes on the basis of size. The column used for GPC is filled with
Your Name: Question 1. 2D-NMR: C 6 H 10 O 2. (20 points)
") Question 1. 2D-NMR: C 6 H 10 O 2. (20 points) Integrations show signals 3H 1 & 5, 2H for signal 4, and 1H each for signals 2 and 3. - Draw the structure. - Assign the hydrogens to signals 1 5 (that is,
Question 1. 2D-NMR: C 6 H 10 O 2. (20 points) Integrations show signals 3H 1 & 5, 2H for signal 4, and 1H each for signals 2 and 3. - Draw the structure. - Assign the hydrogens to signals 1 5 (that is,
NUCLEAR MAGNETIC RESONANCE SPECTROSCOPY
 NMR Spectroscopy 1 NULEAR MAGNETI RESONANE SPETROSOPY Involves interaction of materials with the low-energy radiowave region of the electromagnetic spectrum Origin of Spectra Theory All nuclei possess
Two Dimensional (2D) NMR Spectroscopy
 NMR Spectroscopy") The two important parameters obtained from NMR spectra are; Two Dimensional (2D) NMR Spectroscopy py Correlation NMR a. Chemical shift b. Spin-spin coupling constant Large molecules with numerous atoms
The two important parameters obtained from NMR spectra are; Two Dimensional (2D) NMR Spectroscopy py Correlation NMR a. Chemical shift b. Spin-spin coupling constant Large molecules with numerous atoms
11. Proton NMR (text , 12.11, 12.12)
") 2009, Department of Chemistry, The University of Western Ontario 11.1 11. Proton NMR (text 12.6 12.9, 12.11, 12.12) A. Proton Signals Like 13 C, 1 H atoms have spins of ±½, and when they are placed in
2009, Department of Chemistry, The University of Western Ontario 11.1 11. Proton NMR (text 12.6 12.9, 12.11, 12.12) A. Proton Signals Like 13 C, 1 H atoms have spins of ±½, and when they are placed in
In a solution, there are thousands of atoms generating magnetic fields, all in random directions.
 Nuclear Magnetic Resonance Spectroscopy: Purpose: onnectivity, Map of - framework Process: In nuclear magnetic resonance spectroscopy, we are studying nuclei. onsider this circle to represent a nucleus
Chapter 20: Identification of Compounds
 Chemists are frequently faced with the problem of identifying unknown compounds. Environmental scientists may have to identify pollutants in soils and water, synthetic chemists may want to confirm that
January 30, 2018 Chemistry 328N
 Lecture 4 Some More nmr January 30, 2018 Tricks for solving unknowns Review. Empirical formula is lowest common denominator ratio of atomic composition From Homework: unknown has an empirical formula of
Using NMR and IR Spectroscopy to Determine Structures Dr. Carl Hoeger, UCSD
 Using NMR and IR Spectroscopy to Determine Structures Dr. Carl Hoeger, UCSD The following guidelines should be helpful in assigning a structure from NMR (both PMR and CMR) and IR data. At the end of this
(Refer Slide Time: 0:37)
") Principles and Applications of NMR spectroscopy Professor Hanudatta S. Atreya NMR Research Centre Indian Institute of Science Bangalore Module 3 Lecture No 14 We will start today with spectral analysis.
Principles and Applications of NMR spectroscopy Professor Hanudatta S. Atreya NMR Research Centre Indian Institute of Science Bangalore Module 3 Lecture No 14 We will start today with spectral analysis.
高等食品分析 (Advanced Food Analysis) I. SPECTROSCOPIC METHODS *Instrumental methods: 1. Spectroscopic methods (spectroscopy): a) Electromagnetic radiation
 I. SPECTROSCOPIC METHODS *Instrumental methods: 1. Spectroscopic methods (spectroscopy): a) Electromagnetic radiation") *Instrumental methods: 1. Spectroscopic methods (spectroscopy): a) Electromagnetic radiation (EMR): γ-ray emission X-Ray absorption, emission, fluorescence and diffraction Vacuum ultraviolet (UV) absorption
*Instrumental methods: 1. Spectroscopic methods (spectroscopy): a) Electromagnetic radiation (EMR): γ-ray emission X-Ray absorption, emission, fluorescence and diffraction Vacuum ultraviolet (UV) absorption
Unit 11 Instrumentation. Mass, Infrared and NMR Spectroscopy
 Unit 11 Instrumentation Mass, Infrared and NMR Spectroscopy Spectroscopic identification of organic compounds Qualitative analysis: presence but not quantity (i.e. PEDs) Quantitative analysis: quantity
Module 20: Applications of PMR in Structural Elucidation of Simple and Complex Compounds and 2-D NMR spectroscopy
 Subject Chemistry Paper No and Title Module No and Title Module Tag Paper 12: Organic Spectroscopy Module 20: Applications of PMR in Structural Elucidation of Simple and Complex Compounds and 2-D NMR spectroscopy
Technical Note. Introduction
 Technical Note Characterization of Eleven 2,5-Dimethoxy-N-(2-methoxybenzyl)- phenethylamine (NBOMe) Derivatives and Differentiation from their 3- and 4- Methoxybenzyl Analogues - Part II Patrick A. Hays*,
Química Orgânica I. Nuclear Magnetic Resonance Spectroscopy (II) Ciências Farmacêuticas Bioquímica Química AFB QO I 2007/08 1 AFB QO I 2007/08 2
 Ciências Farmacêuticas Bioquímica Química AFB QO I 2007/08 1 AFB QO I 2007/08 2") Química Orgânica I Ciências Farmacêuticas Bioquímica Química AFB QO I 2007/08 1 Nuclear Magnetic Resonance Spectroscopy (II) AFB QO I 2007/08 2 1 Adaptado de Organic Chemistry, 6th Edition; L.G. Wade,
Química Orgânica I Ciências Farmacêuticas Bioquímica Química AFB QO I 2007/08 1 Nuclear Magnetic Resonance Spectroscopy (II) AFB QO I 2007/08 2 1 Adaptado de Organic Chemistry, 6th Edition; L.G. Wade,
To Do s. Answer Keys are available in CHB204H
 To Do s Read Chapters 2, 3 & 4. Complete the end-of-chapter problems, 2-1, 2-2, 2-3 and 2-4 Complete the end-of-chapter problems, 3-1, 3-3, 3-4, 3-6 and 3-7 Complete the end-of-chapter problems, 4-1, 4-2,
powder in good yield (36%) from the reaction of CH 3 (CH 2 ) 8 COONa.2H 2 O with OTf = Trifluoromethanesulfonate by Korendovych [80].
![powder in good yield (36%) from the reaction of CH 3 (CH 2 ) 8 COONa.2H 2 O with OTf = Trifluoromethanesulfonate by Korendovych [80].](/thumbs/76/73518437.jpg "powder in good yield (36%) from the reaction of CH 3 (CH 2 ) 8 COONa.2H 2 O with OTf = Trifluoromethanesulfonate by Korendovych [80].") 4.2 [Fe 2 (RCOO) 4 (bpy)] The general steps for the syntheses of [Fe(CH 3 (CH 2 ) n COO) 2 (bpy)], where n = 8 (6), 10 (7), 12 (8), and 14 (9), are shown in Scheme 4.2. 2 RCOO - Fe 2+ [Fe(RCOO) 2 ] bpy
4.2 [Fe 2 (RCOO) 4 (bpy)] The general steps for the syntheses of [Fe(CH 3 (CH 2 ) n COO) 2 (bpy)], where n = 8 (6), 10 (7), 12 (8), and 14 (9), are shown in Scheme 4.2. 2 RCOO - Fe 2+ [Fe(RCOO) 2 ] bpy
ORGANIC - EGE 5E CH UV AND INFRARED MASS SPECTROMETRY
 !! www.clutchprep.com CONCEPT: IR SPECTROSCOPY- FREQUENCIES There are specific absorption frequencies in the functional group region that we should be familiar with EXAMPLE: What are the major IR absorptions
To Do s. Answer Keys are available in CHB204H
 To Do s Read Chapters 2, 3 & 4. Complete the end-of-chapter problems, 2-1, 2-2, 2-3 and 2-4 Complete the end-of-chapter problems, 3-1, 3-3, 3-4, 3-6 and 3-7 Complete the end-of-chapter problems, 4-1, 4-2,
In a solution, there are thousands of atoms generating magnetic fields, all in random directions.
 Nuclear Magnetic Resonance Spectroscopy: Purpose: onnectivity, Map of - framework Process: In nuclear magnetic resonance spectroscopy, we are studying nuclei. onsider this circle to represent a nucleus
[1] [2] 10 CH 3 COOH 9 1D 1 H NMR
![[1] [2] 10 CH 3 COOH 9 1D 1 H NMR](/thumbs/79/79475830.jpg "[1] [2] 10 CH 3 COOH 9 1D 1 H NMR") 1.00 0.97 1.03 2.08 1.25 1.08 3.02 rganic NMR quick guide 2016 TDWC NMR Techniques in rganic Chemistry: a quick guide The NMR spectrum proves to be of great utility in structure elucidation because the
1.00 0.97 1.03 2.08 1.25 1.08 3.02 rganic NMR quick guide 2016 TDWC NMR Techniques in rganic Chemistry: a quick guide The NMR spectrum proves to be of great utility in structure elucidation because the
(Refer Slide Time: 1:03)
") Principles and Applications of NMR spectroscopy Professor Hanudatta S. Atreya NMR Research Centre Indian Institute of Science Bangalore Module 1 Lecture No 05 Welcome back! In the last class we looked
Principles and Applications of NMR spectroscopy Professor Hanudatta S. Atreya NMR Research Centre Indian Institute of Science Bangalore Module 1 Lecture No 05 Welcome back! In the last class we looked
Nuclear Spin States. NMR Phenomenon. NMR Instrumentation. NMR Active Nuclei. Nuclear Magnetic Resonance
 Nuclear Magnetic Resonance NMR Phenomenon µ A spinning charged particle generates a magnetic field. A nucleus with a spin angular momentum will generate a magnetic moment (!). E Nuclear Spin States aligned
AQA A2 CHEMISTRY TOPIC 4.10 ORGANIC SYNTHESIS AND ANALYSIS TOPIC 4.11 STRUCTURE DETERMINATION BOOKLET OF PAST EXAMINATION QUESTIONS
 AQA A2 CHEMISTRY TOPIC 4.10 ORGANIC SYNTHESIS AND ANALYSIS TOPIC 4.11 STRUCTURE DETERMINATION BOOKLET OF PAST EXAMINATION QUESTIONS 1 1. Consider the following reaction sequence. CH 3 CH 3 CH 3 Step 1
Ibuprofen. Example of benchtop NMR on small organic molecules
 R Ibuprofen Example of benchtop NMR on small organic molecules Ibuprofen (C 13 H 18 O 2 ) is a non-steroidal antiinflammatory drug (NSAID) and is commonly used for pain relief, fever reduction and against
1,1,2-Tribromoethane. Spin-Spin Coupling
 NMR Spin oupling Spin-Spin oupling Spectra usually much more complicated than a series of single lines, one for each type of hydrogen. Peaks are often split into a number of smaller peaks, sometimes with