Edge and surface plasmons in graphene nanoribbons
|
|
|
- Roxanne Higgins
- 5 years ago
- Views:
Transcription
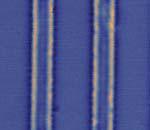
1 Edge and surface plasmons in graphene nanoribbons Z. Fei 1,2, M. D. Goldflam 1, J.-S. Wu 1, S. Dai 1, M. Wagner 1, A. S. McLeod 1, M. K. Liu 3, K. W. Post 1, S. Zhu 4, G.C.A.M. Janssen 4, M. M. Fogler 1, D. N. Basov 1 1 Department of Physics, University of California, San Diego, La Jolla, California 92093, USA 2 Department of Physics and Astronomy, Iowa State University, Ames, Iowa 50011, USA 3 Department of Physics, Stony Brook University, Stony Brook, New York, 11790, USA 4 Department of Precision and Microsystems Engineering, Delft University of Technology, Mekelweg 2, 2628 CD Delft, Netherland Abstract We report on nano-infrared (IR) imaging studies of confined plasmon modes inside patterned graphene nanoribbons (GNRs) fabricated with high-quality chemical-vapordeposited (CVD) graphene on Al2O3 substrates. The confined geometry of these ribbons leads to distinct mode patterns and strong field enhancement, both of which evolve systematically with the ribbon width. In addition, spectroscopic nano-imaging in midinfrared cm -1 allowed us to evaluate the effect of the substrate phonons on the plasmon damping. Furthermore, we observed edge plasmons: peculiar one-dimensional modes propagating strictly along the edges of our patterned graphene nanostructures. Keywords Graphene nanoribbons, CVD graphene, nano-infrared imaging, plasmon-phonon coupling, edge plasmons Main text Surface plasmon polaritons, collective oscillation of charges on the surface of metals or semiconductors, have been harnessed to confine and manipulate electromagnetic energy at the nanometer length scale. 1 In particular, surface plasmons in graphene are collective oscillations of Dirac quasiparticles that reveal high confinement, electrostatic tunability and long lifetimes Plasmons in graphene are promising for optoelectronic and nanophotonic applications in a wide frequency range from the terahertz to the infrared (IR) regime. 16,17 One common approach to investigate plasmons is based on nano-structuring of plasmonic media. 12,18 Large area structures comprised of graphene nanoribbons (GNRs) and graphene nano-disks have been extensively investigated by means of various spectroscopies These types of structures are of interest in light of practical applications including: surface enhanced IR vibrational spectroscopy 19,20, modulators 21, photodetectors 22 and tunable metamaterials 23,24. Whereas the collective, area-averaged responses of graphene nanotructures are well characterized, the real-space characteristics of confined plasmon modes within these nanostructures remain completely unexplored. In this work, we performed nano-ir imaging on patterned GNRs utilizing an antennabased nanoscope that is connected to both continuous-wave and broadband lasers 25 (Supporting Information). As shown in Figure 1a, the metalized tip of an atomic force microscope (AFM) is illuminated by IR light thus generating strong near fields underneath
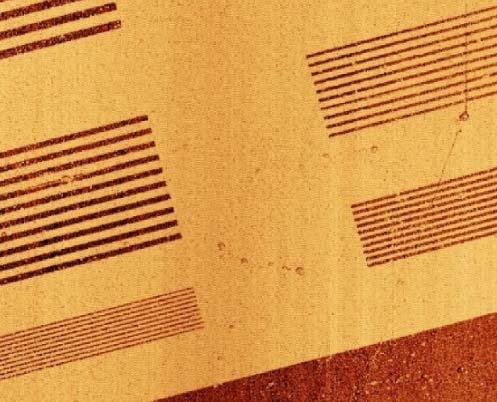
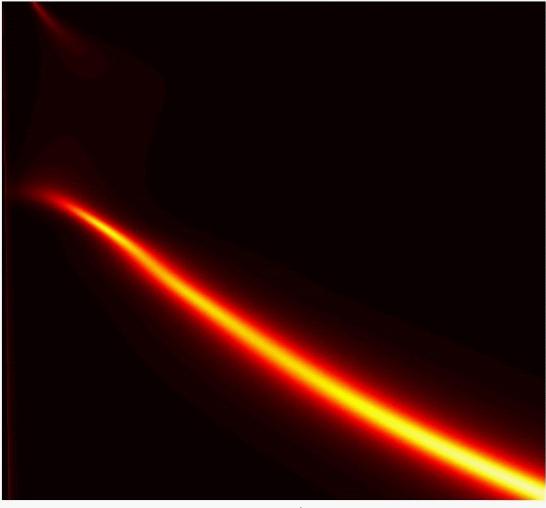
2 the tip apex. These fields have a wide range of in-plane momenta q thus facilitating energy transfer and momentum bridging from photons to plasmons Our GNR samples were fabricated by lithography patterning of high quality CVD-grown graphene single crystals 26 on aluminum oxide (Al2O3) substrates (Supporting Information). As discussed in detail below, the optical phonon of Al2O3 is below = 1000 cm -1 (Figure S2), allowing for a wide mid-ir frequency region free from phonons. In Figure 1b, we show the AFM phase image displaying arrays of GNRs with various widths (darker parts correspond to graphene). The representative near-field images of the GNRs with widths of W = 480, 380, 270 and 155 nm are shown in Figure 1c f, where we plot the near-field amplitude s( ) normalized to that of the bare Al2O3 substrate (Supporting Information). As documented in previous studies 4-12, s( ) is a direct measure of the z-component electric field amplitude Ez underneath the AFM tip. In our experiments, we kept p-polarized light beam incident along the ribbons (Figure 1a) to avoid direct excitation of resonance modes of ribbons. 12 The excitation frequency is set to be at 1184 cm -1, far away from the surface optical phonons of Al2O3 (Figure S2). The boundaries of these ribbons are marked with white dashed lines. In Figure 1g-j we also plot line profiles taken perpendicular to GNRs along red dashed lines in Figure 1c-f. The vertical dashed lines in Figure 1g-j mark the boundaries of GNRs. The fringes in Figure 1c-f correspond to the peaks in line profile plotted in Figure 1g-j. We begin with the widest ribbons (W = 480 nm, Figure 1c,g) where two bright fringes form close to the boundaries of the ribbons. In addition to these brightest fringes, we also observe fringes in the interior of the ribbons (more clearly seen in Figure 1g). The former ones (marked with red arrows in Figure 1g-j), which we referred to as principal fringes, show much higher amplitude compared to the inner oscillations (marked with green arrows in Figure 1g,h). In nano-ir experiments, fringes originate from constructive interference between tip-launched and boundary-reflected plasmons (Figure 1a) Apart from these familiar patterns, we also observed plasmonic characteristics due to ribbon confinement as the ribbon width (W) shrinks. First, the two principal fringes move closer to each other with decreasing W and consequently the total number of distinct fringes observable within GNRs decreases. Second, we witnessed a strong enhancement of the plasmon intensity when the two principal fringes merge together and become indistinguishable (W = 155 nm, Figure 1f,j). The single fringe thus-obtained is highly confined laterally with a full width at half maximum (defined by a pair of blue arrows in Figure 1j) of ~50 nm. The peak amplitude appears to be the sum of the two principal fringes, so the plasmon intensity I( ) ~ s( ) 2 is about 4 times higher compared to the fringes in wider ribbons or larger area graphene. The general aspects of the ribbon confinement effects described above are consistent with previous studies of tapered GNRs. 4,5,9 Nevertheless, the data of straight GNRs are extremely valuable for quantitative analysis of the entire tip-ribbon system (Supporting Information). In order to explore the evolution of the fringe patterns with the frequency of IR radiation, we performed nano-imaging of the GNRs with both broadband and CW sources following an approach introduced in our recent study 27. The broadband mapping is given in Figure 2a, where we plot a real-space line scan across the GNR in Figure 1c (along the red dashed line). For every given real-space position (x) along the line scan, we collected a spectrum covering a broad frequency range ( cm -1 ) with a spectral resolution of 3 cm -1. Therefore Figure 2a contains both real-space and spectroscopic information
3 about the plasmonic modes in GNRs. As an example, we show in Figure 2b horizontal line cuts (black curves) taken directly from the broadband map (Figure 2a) at several discrete frequencies (marked with white arrows in Figure 2a). As a comparison, we plot in Figure 2c the line profiles taken with the CW laser source across the same ribbon at these frequencies. The broadband and CW profiles share similar gross characteristics despite the fact that the peaks in the broadband profiles are noticeably weaker compared to those in the CW profiles. We attribute the intensity weakening in the broadband data to the electron heating (~1500 K) by the pulses of the broadband source: an effect that enhances plasmon damping 28 as verified by our modeling (see discussion below). We emphasize that the broadband map shown in Figure 2a was taken with only two hyper-spectral scans with each scan covering the spectral width of about 400 cm -1 and collected within 30 min. The wide spectral range and short acquisition time endow this technique with major advantages over discrete-frequency scans carried out with monochromatic lasers. To the best of our knowledge, the broadband line scans for graphene plasmons are demonstrated here for the first time. The main features of Figure 2 above 1000 cm -1 are the two principal fringes close to the ribbon boundaries (marked with vertical dashed lines). As the frequency varies from 1450 cm -1 to 1000 cm -1, the two principal fringes move inward and eventually merge together at the ribbon center. Moreover, the fringe intensity increases significantly with decreasing frequency until reaching 1000 cm -1. At even lower frequencies, fringes become strongly damped and their intensity rapidly declines. Note that we vary the scales of vertical axes in Figure 2b in order to visualize all illuminating details of the plasmonic features. The gross features of the data are captured by our numerical analysis (blue curves in Figure 2b,c), where we calculate the near-field amplitude by modeling the AFM tip as a conducting spheroid (Supporting Information). 4,6,29 The key modeling parameter is the complex plasmon wavevector (qp) of graphene that contains information about both the plasmon wavelength p = 2 /Re(qp) and plasmon damping rate p = Im(qp)/Re(qp). As introduced in our previous works 4,6, the above modeling method is quantitatively accurate and it allows us to extract the complex qp by directly fitting the plasmon fringe profiles. The fitting was performed on both the broadband (Figure 2b) and CW (Figure 2c) data sets. The outcome of the fitting are data points of Re(qp) (Figure 3a) and p = Im(qp)/Re(qp) (Figure 3b) at various excitation frequencies. In order to get the best fit, we used the same set of Re(qp) but higher p (Figure 3b) when modeling the broadband profiles. As discussed above, the higher damping in the broadband fitting is due to the electron heating by femtosecond laser pulses (Supporting Information). 28 Thus-extracted data points for Re(qp) are overlaid on top of the frequency ( ) momentum (q) dispersion diagram (Figure 3a). In this diagram we plot the imaginary part of the p-polarized reflection coefficient Im(rp) of the entire graphene/substrate system produced using the standard transfer matrix method 3. The optical conductivity of graphene used here for the dispersion calculation is obtained with the random phase approximation method where the graphene Fermi energy (EF) is the only parameter. In the dispersion color plot, the bright curves represent the plasmon mode and the best match with the experimental data point of Re(qp) is obtained when EF 2700 cm -1. The spectroscopic nano-imaging data (Figure 2) and the dispersion plot (Figure 3a) obtained for graphene on the Al2O3 substrate convey two main messages. First, graphene plasmons are well defined and strongly dispersive above 1000 cm -1, where plasmon fringes
4 were clearly observed. Second, graphene plasmons are strongly damped below 1000 cm -1 : a likely outcome of the proximity to the substrate phonon around 830 cm -1 (Figure S2). The phonon response was directly investigated using nano-ir spectroscopy (Figure 3c) that reveals a strong resonance around 830 cm 1 (black curve in Figure 3d) consistent with the optical constants of Al2O3 obtained from ellipsometry (Figure S2). From Figure 3c, one can also see that graphene significantly enhances the phonon resonance and causes a slight blue shift (~7 cm 1 ), which are both signature effects of the plasmon-phonon coupling. 3 The direct outcome of the plasmon-phonon coupling is the strong damping of graphene plasmons 30 that leads to strongly damped GNR fringes observed below 1000 cm -1 in Figure 2. For the purpose of quantitative analysis, we plot in Figure 3b the extracted plasmon damping rate p = Im(qp)/Re(qp) from fitting for both the CW and broadband excitations. In the case of CW excitation (black squares), one can see that p exceeds 0.2 within the plasmon-phonon coupling region (below 1000 cm -1 ) and can reach values above 0.4 close to the Al2O3 phonon at 830 cm -1 (Figure 3c). Away from this region (above 1100 cm -1 ), p drops rapidly to 0.12, which is comparable to and even slightly lower than what was reported in previous studies conducted for exfoliated graphene on SiO2 substrates ( p ~ 0.135). 4 The plasmon damping rate could be further suppressed by thermal annealing and adding top protection layer to approach the recent experimental record ( p ~ 0.025) set by graphene encapsulated by hexagonal boron nitride. 9,31 When graphene and the AFM tip are illuminated by the broadband source (red circles), p is enhanced by a factor of two or three due to the electron heating by the femtosecond pulses. Note that the damping analysis performed here in our imaging study is directly related to the propagation length of graphene plasmons, while those done in previous spectroscopy work 14 are linked to the mode lifetime. As detailed in the Supporting Information, the two methods provide complementary views about graphene plasmon damping close to the substrate phonons. Now we wish to discuss plasmonic responses at the edges of our structures. In Figure 4a, we show near-field images of a cross-cut GNR (W = 480 nm) that reveals two sharp corners at the top. The dominant features of these images are again the bright plasmon fringes parallel to the boundaries as discussed above. Hereafter we refer to these conventional plasmons as 2D surface plasmons. Remarkably, we also see in these images faint oscillations distributed along the graphene edges. Compared to the fringes of 2D plasmons, these latter oscillations confined to the edges are much weaker in intensity, and therefore can be easily overlooked. In order to reveal these oscillations along the edges, we adjust the color scales to maximize the contrast in all panels of Figure 4a. We assert that the faint oscillations in Figure 4a are interference patterns due to edge plasmons of graphene. Such 1D excitations are generic for 2D metals although their dispersion depends on the charge density profile and the dielectric environment of the edge. In the simplest case where this profile is step-like and the conducting sheet resides at the interface of two uniform media, the wavelengths of the 1D edge plasmons ( ep) and 2D surface plasmons ( p) differ by a universal numerical factor 32,33 ep= p. (1) The physical reason for the smaller wavelength of the edge plasmons compared to the 2D ones (Eq. 1) is the effective reduction of the Drude weight at the edges, where free carriers exist only on one side. The electric field of the edge plasmons decays exponentially away from the edge.
5 Similar to 2D surface plasmons, the 1D edge modes are launched by the AFM tip and can be bounced back by reflectors or scatterers. In Figure 4a, the sharp corners of the GNR serve as effective reflectors for the edge modes. For the purpose of quantitative analysis, we plot in Figure 4b line profiles taken along the red and black dashed lines in Figure 4a. Thus, the red profile reveals the edge oscillations (red curves) and whereas the black traces visualize fringes of 2D surface plasmons. We first focus to the top panel of Figure 4b, where the excitation frequency is set to be = 1160 cm -1. A quick inspection shows that the profile of the edge oscillations shares a similar line shape with those of the fringes of 2D plasmons despite their huge intensity difference. Both types of profiles reveal a number of peaks with two strongest ones (principal peaks, marked with arrows) close to the left and right reflectors (marked with dashed lines). As discussed in detail above, such a line shape is a signature of mode confinement between the left and right reflectors. Despite the above similarities, a closer inquiry into these profiles uncovers a number of differences. Specifically, the positions of the two principal peaks of the edge oscillations are slightly closer to the reflectors (black dashed lines). Also, more peaks appear in the profiles of the edge oscillations compared to those of the 2D plasmonic fringes. Indeed, we observed five peaks for the edge modes versus three peaks for the surface plasmon modes at = 1160 cm -1. The above mentioned observations are consistent with the notion of smaller wavelength of the edge modes compared to 2D surface plasmons. A quantitative estimation can be obtained by measuring the distances from the left and right principal peaks (marked with arrows) to their adjacent reflectors (dashed lines): DL and DR. The average value of the two measured distances (DL+DR)/2 is roughly proportional to the plasmon wavelength. Take = 1160 cm -1 for example, (DL+DR)/2 is 77 nm and 95 nm for edge and surface modes respectively, so the ratio between plasmon wavelengths of the two modes ep/ p at this frequency is about Similarly, we can estimate the ratios ep/ p to be 0.81, 0.82 for = 1100 and 1065 cm -1 respectively. These values roughly agree with the expectations of Eq. 1. The small deviation (~10%) might be due to a slightly different doping at the edges compared to the interior of graphene. Our hypothesis of edge plasmons is further verified by the frequency-dependence study of these edge oscillations (Figure 4b). From = 1160 cm -1 to 1065 cm -1 (Figure 4b), we found that the two principal peaks of edge mode profiles (red) move further away from the two corners and the total number of edge oscillations decreases. Both observations indicate an increased ep with decreasing frequency, which is consistent with the dispersion nature of edge plasmons. In fact, oscillations due to edge plasmons are not only observed close to sharp corners of GNRs. These oscillations appear in nearly all lithography-patterned graphene structures, but are rarely seen in exfoliated graphene flakes with natural, non-processed edges. Lithography patterning presumably creates much more edge defects (or roughness) compared to exfoliation. Although these defects are not clearly identified by our AFM possibly due to their small sizes, they could still serve as plasmon reflectors or scatterers (Figure S3a): a scenario analogous to atomic-scale grain boundaries in graphene 6. As an example, in Figure 4c we plot data for a patterned graphene micro-disk; signal oscillations surrounding the disk are seen in this image. In Figure 4d, we show zoom-in views of the micro-disk taken at several IR frequencies from the region defined by the red rectangle in Figure 4c. Here, there are three bright modes (marked with white arrows) within the field of view. Unlike the edge modes confined by the two sharp corners discussed above (Figure 4a,b), the positions of the modes surrounding the micro-disk (or any other patterned
6 structures away from sharp corners) do not show obvious frequency dependence. We believe these fixed-position modes are signatures of plasmon localization due to a high density ( ) of reflectors (edge defects here) per unit length. As demonstrated in Figure S4 (Supporting Information), strong localization could occur when 1/ is much smaller than ep and consequently the distribution of the localized modes is solely determined by the positions of the reflectors. Future studies combining atomic-resolution characterization tools with nano-ir imaging are necessary to correlate the structural properties and plasmonic responses of these edge defects. Note that edge defects possibly also exist close to the sharp corners in Fig. 4a, but they are much weaker plasmon reflectors compared to the corners due to their small sizes. As a result, sharp corners play a dominant role in the formation of nearby edge oscillations. Therefore, we didn t consider the effects due to defects in our analysis of the data of sharp corners in Fig. 4a,b. For completeness, we wish to mention several previous reports of edge plasmons in graphene nanostructures using optical and microwave spectroscopy These studies were facilitated by a drastic suppression of plasmonic losses in the presence of a quantizing magnetic field (note that Eq. 1 does not apply in such conditions 32,34-36 ). In contrast, the propagation length of the zero-field edge plasmons is not expected to exceed much that of the 2D plasmons. Zero-field edge plasmons have been however detected in other systems, e.g., metallic nanoplatelets, using electron energy-loss spectroscopy. 37,38 To the best of our knowledge, Figure 4 is the first visualization of the edge plasmons carried out by direct nano-ir imaging. In conclusion, we have systematically studied the confined plasmon modes inside GNRs on the Al2O3 substrates. Through IR nano-imaging experiments, we observed intriguing plasmon fringe patterns that evolve systematically with both the ribbon width and the excitation IR frequencies. In addition, confined geometry of GNRs leads to an enhancement of the plasmon field. Moreover, we demonstrate by spectroscopic imaging that substrate phonons play a major role in plasmon damping, and that Al2O3 offers a wide phonon-free region in the mid-ir where the plasmon damping is significantly reduced. Finally, we observed real-space signatures due to edge plasmons in graphene. Our numerical simulations suggest that distinct mode patterns due to both edge plasmons and bulk plasmons should appear in devices with smooth graphene edges (Figure S3c). Associated Content Supporting Information: Details of the experimental setup, sample preparation, data analysis and modeling. This material is available free of charge via the Internet at Author Information Corresponding Author * (Z.F) zfei@iastate.edu. Notes The authors declare no competing financial interest. Acknowledgment Authors acknowledge support from ONR and AFOSR. The development of scanning plasmon interferometry is supported by DOE-BES and ARO. DNB is supported by the
7 Gordon and Betty Moore Foundation s EPiQS Initiative through Grant GBMF4533. S.Z. and G.C.A.M.J acknowledge the financial support from the Young Wild Idea Grant of the Delft Centre for Materials and Delft Energy Initiative Fund, as well as Foundation for Fundamental Research on Matter (FOM) and Netherlands Organisation for Scientific Research (NWO). References (1) Atwater, A. H. Sci. Am. 2008, 296, (2) Grigorenko, A. N.; Polini, M.; Novoselov, K. S. Graphene plasmonics. Nature Photon. 2012, 6, 749. (3) Fei, Z.; Andreev, G. O.; Bao, W.; Zhang, L. M.; McLeod, A. S.; Wang, C.; Stewart, M. K.; Zhao, Z.; Dominguez, G.; Thiemens, M.; Fogler, M. M., Tauber, M. J.; Castro- Neto, A. H.; Lau, C. N.; Keilmann, F.; Basov, D. N. Nano Lett. 2011, 11, (4) Fei, Z.; Rodin, A. S.; Andreev, G. O.; Bao, W.; McLeod, A. S.; Wagner, M.; Zhang, L. M.; Zhao, Z.; Thiemens, M.; Dominguez, G.; Fogler, M. M.; Castro Neto, A. H.; Lau, C. N.; Keilmann, F.; Basov, D. N. Nature 2012, 487, (5) Chen, J.; Badioli, M.; Alonso-González, P.; Thongrattanasiri, S.; Huth, F.; Osmond, J.; Spasenović, M.; Centeno, A.; Pesquera, A.; Godignon, P.; Elorza, A. Z.; Camara, N.; García de Abajo, F. J. Nature 2012, 487, (6) Fei, Z.; Rodin, A. S.; Gannett, W.; Dai, S.; Regan, W.; Wagner, M.; Liu, M. K.; McLeod, A. S.; Dominguez, G.; Thiemens, M.; Castro Neto, A. H.; Keilmann, F.; Zettl, A.; Hillenbrand, R.; Fogler, M. M.; Basov, D. N. Nat. Nanotechnol. 2013, 8, (7) Basov, D. N.; Fogler, M. M.; Lanzara, A.; Wang, F.; Zhang, Y. Rev. Mod. Phys. 2014, 86, 959. (8) Alonso-González, P.; Nikitin, A. Y.; Golmar, F.; Centeno, A.; Pesquera, A.; Velez, S.; Chen, J.; Navickaite, G.; Koppens, F.; Zurutuza, A.; Casanova, F.; Hueso, L. E.; Hillenbrand, R. Science 2014, 344, (9) Gerber, J. A.; Berweger, S.; O Callahan, B. T.; Raschke, M. B. Phys. Rev. Lett. 2014, 113, (10) Woessner, G.; Lundeberg, M. B., Gao, Y.; Principi, A.; Alonso-González, P.; Carrega, M.; Watanabe, K.; Taniguchi, T.; Vignale, G.; Polini, M.; Hone, J.; Hillenbrand, R.; Koppens, F. H. L. Nature Mater. 2015, 14, (11) Fei, Z.; Iwinski, E. G.; Ni, G. X.; Zhang, L. M.; Bao, W.; Rodin, A. S.; Lee, Y.; Wagner, M.; Liu, M. K.; Dai, S.; Goldflam, M. D.; Thiemens, M.; Keilmann, F.; Lau, C. N.; Castro-Neto, A. H.; Fogler, M. M.; Basov, D. N. Nano Lett. 2015, 15, (12) Goldflam, M. D.; Ni, G. X.; Post, K. W.; Fei, Z.; Yeo, Y.; Tan, J. Y.; Rodin, A. S.; Chapler, B. C.; O zyilmaz, B.; Castro Neto, A. H.; Fogler, M. M.; Basov, D. N. Nano Lett. 2015, 15, (13) Ju, L.; Geng, B.; Horng, J.; Girit, C.; Martin, M.; Hao, Z.; Bechtel, H. A.; Liang, X.; Zettl, A.; Shen, Y. R.; Wang, F. Nat. Nanotechnol. 2011, 6, (14) Yan, H.; Li, X.; Chandra, B.; Tulevski, G.; Wu, Y.; Freitag, M.; Zhu, W.; Avouris, P.; Xia, F. Nature Nanotech. 2012, 7, (15) Yan, H.; Low, T.; Zhu, W.; Wu, Y.; Freitag, M.; Li, X.; Guinea, F.; Avouris, P.; Xia, F. Nature Photon. 2013, 7,
8 (16) V. W. Brar, M. S. Jang, M. Sherrott, J. J. Lopez and H. Atwater. Nano Lett. 13, 2541 (2013). (17) Otsuji, T.; Propov, V.; Ryzhii, V. J. Phys. D: Appl. Phys. 2014, 47, (18) Low, T.; Avouris, P. ACS Nano 2014, 8, (19) Allen, S. J.; Tsui, D. C.; Logan, R. A. Phys. Rev. Lett. 1977, 38, 980. (20) Li, Y.; Yan, H.; Farmer, D. B.; Meng, X.; Zhu, W.; Osgood, R. M.; Heinz, T. F.; Avouris, P. Nano Lett. 2014, 14, (21) Rodrigo, D.; Limaj, O.; Janner, D.; Etezadi, D.; de Abajo, F. J. G.; Pruneri, V.; Altug, H. Science 2015, 349, (22) Andersen, D. R. J. Opt. Soc. Am. B 2010, 27, (23) Freitag, M.; Low, T.; Zhu, W.; Yan, H.; Xia, F.; Avouris, P. Nature Comm. 2013, 4, (24) Dai, S.; Ma, Q.; Liu, M. K.; Andersen, T.; Fei, Z.; Goldflam, M. D.; Wagner, M.; Watanabe, K.; Taniguchi, T.; Thiemens, M.; Keilmann, F.; Janssen, G. C. A. M.; Zhu, S-E.; Jarillo-Herrero, P.; Fogler, M. M.; Basov, D. N. Nature Nanotech. 2015, 10, (25) Fang, Z.; Wang, Y.; Schlather, A. E.; Liu, Z.; Ajayan, P. M.; de Abajo, F. J. G.; Nordlander, P.; Zhu, X.; Halas, N. J. Nano Lett. 2014, 14, (26) Keilmann, F.; Amarie, S. J. Infrared Milli. Terahz. Waves 2012, 33, 479. (27) V. E. Calado, S. Zhu, S. Goswami, Q. Xu, K. Watanabe, T. Taniguchi, G.C.A.M. Janssen and L.M.K. Vandersypen. Appl. Phys. Lett. 2014, 104, (28) Dai, S.; Fei, Z.; Ma, Q.; Rodin, A. S.; Wagner, M.; McLeod, A. S.; Liu, M. K. Gannett, W.; Regan, W.; Watanabe, K.; Taniguchi, T.; Thiemens, M.; Dominguez, G.; Castro Neto, A. H.; Zettl, A.; Keilmann, F.; Jarillo-Herrero, P.; Fogler, M. M.; Basov, D. N. Science 2014, 343, (29) Wagner, M.; Fei, Z.; McLeod, A. S.; Rodin, A. S.; Bao, W.; Iwinski, E. G.; Zhao, Z.; Goldflam, M.; Liu, M. K.; Dominguez, G.; Thiemens, M.; Fogler, M. M.; Castro Neto, A. H.; Lau, C. N.; Amarie, S.; Keilmann, F.; Basov, D. N. Nano Lett. 2014, 14, (30) Zhang, L. M.; Andreev, G. O.; Fei, Z.; McLeod, A. S.; Dominguez, G.; Thiemens, M.; Castro-Neto, A. H.; Basov, D. N.; Fogler, M. M. Phys. Rev. B 2012, 85, (31) Dubrovkin, A.; Tao, J.; Yu, X. C.; Zheludev, N.; Wang, Q. J. Scientific Reports 2015, 5, (32) Principi, A.; Carrega, M.; Lundeberg, M. B.; Woessner, A.; Koppens, F. H. L.; Vignale, G.; Polini, M. Phys. Rev. B 2014, 90, (33) Volkov, V. A.; Mikhailov, S. A. Sov. Phys. JETP 1988, 67, (34) Nikitin, A. Y.; Guinea, F.; García-Vidal, F. J.; Martín-Moreno, L. Phys. Rev. B 2011, 84, (35) Crassee, I.; Orlita, M.; Potemski, M.; Walter, A. L.; Ostler, M.; Seyller, T.; Gaponenko, I.; Chen, J.; Kuzmenko, A. B. Nano Lett. 2012, 12, (36) Poumirol, J. M.; Yu, W.; Chen, X.; Berger, C.; de Heer, W. A.; Smith, M. L.; Ohta, T.; Pan, W.; Goerbig, M. O.; Smirnov, D.; Jiang, Z. Phys. Rev. Lett. 2013, 110, (37) Yan, H.; Li, Z.; Li, X.; Zhu, W.; Avouris, P.; Xia, F. Nano. Lett. 2012, 12, (38) Gu, L.; Sigle, W.; Koch, C. T.; Ögüt, B.; van Aken, P. A.; Talebi, N.; Vogelgesang, R.; Mu, J.; Wen, X.; Mao, J. Phys. Rev. B 2011, 83,
9 (39) Schmidt, F. -P.; Ditlbacher, H.; Hohenester, U.; Hohenau, A.; Hofer, F.; Krenn, J. R. Nature Comm. 2014, 5, Figure Captions Figure 1. Nano-IR imaging of confined plasmons inside GNRs. (a) Schematic of a nano- IR imaging experiment. A metalized AFM tip is illuminated with IR light launching plasmons waves inside a GNR on the Al2O3 substrate. (b) The AFM phase image of GNR arrays with various widths. The darker parts of the AFM phase image correspond to graphene. (c-f) Near-field data images of GNRs with widths W = 480, 380, 270 and 155 nm at = 1184 cm 1. White dashed lines mark the boundaries of GNRs. All data were acquired at ambient conditions. (g-j) Line profiles taken perpendicular to GNRs along the red dashed lines in c-f. Black dashed lines mark the boundaries of the ribbons. The red/green arrows mark the positions of the principal/inner fringes. The blue arrows in (j) mark the full width at half maximum of the single fringe. Figure 2. Spectroscopic nano-imaging of the confined plasmonic modes inside GNRs. (a) Broadband map of IR near-field amplitude s(x, ) taken with a broadband pulse laser source along the red dashed line in Figure 1c. (b) Horizontal line cuts (black curves) taken from the broadband map at several discrete IR frequencies ( = 890, 935, 1065, 1120 and 1184 cm -1 ) marked with white arrows in panel (a). The blue curves display modeling results obtained as described in the text. (c) Line profiles (black curves) of IR near-field amplitude s( ) taken with CW lasers at several discrete frequencies = 890, 935, 1065, 1120 and 1184 cm -1 along the red dashed line in Figure 1c. The blue curves display modeling results obtained as described in the text. At all panels, veridical dashed lines mark the boundaries of the GNR and near-field amplitude s( ) is normalized to that of the Al2O3 substrate. Figure 3. a, The dispersion plot of graphene plasmons on the Al2O3 substrate, where we plot the imaginary part of the reflection coefficient rp(q, ω) with a chemical potential of μ = 2700 cm 1. The purple data points are extracted Re(qp) at various excitation frequencies obtained by fitting the fringe profiles in Figure 2b,c. b, The damping rate p of graphene plasmons extracted by fitting both the CW and broadband profiles in Figure 2b,c, respectively. c, Nano-IR spectra of bare Al2O3 substrate and large-scale graphene on Al2O3. Figure 4. Nano-IR imaging of edge plasmons. a, Near-field images of a cross-cut GNR (lateral width W = 480 nm) at three different IR frequencies. White dashed lines mark the boundaries of the cross-cut GNR. b, Line profiles of 2D surface plasmon modes (along the black dashed line) and 1D edge modes (along the red dashed line) taken directly from a. Dashed lines mark the left and right boundaries of the ribbon. The arrows mark the principal peaks in the profiles. c, Near-field image of a patterned graphene micro-disk taken at = 1160 cm -1. d, Near-field images of a zoom-in region of c (defined by the red rectangle) taken at four different IR frequencies.


10


11
12


13
14 Supporting Information of Edge and Surface Plasmons in Graphene Nanoribbons Z. Fei* 1,2, M. D. Goldflam 1, J.-S. Wu 1, S. Dai 1, M. Wagner 1, A. S. McLeod 1, M. K. Liu 3, K. W. Post 1, S. Zhu 4, G.C.A.M. Janssen 4, M. M. Fogler 1, D. N. Basov 1 1 Department of Physics, University of California, San Diego, La Jolla, California 92093, USA 2 Department of Physics and Astronomy, Iowa State University, Ames, Iowa 50011, USA 3 Department of Physics, Stony Brook University, Stony Brook, New York, 11790, USA 4 Department of Precision and Microsystems Engineering, Delft University of Technology, Mekelweg 2, 2628 CD Delft, Netherland * (Z.F.) zfei@iastate.edu 1. Experimental Setup In order to perform nano-infrared (IR) imaging of graphene plasmons, we employed the scattering-type scanning near-field optical microscopy (s-snom). Our s-snom apparatus (Neaspec) is based on an atomic force microscope (AFM) operating in the tapping mode. Measurements were acquired at an AFM tapping frequency of 270 khz and a tapping amplitude of about 60 nm. As illustrated in Figure 1a, we utilized a metalized AFM probe, which is illuminated by a p-polarized mid-ir beam from either continuous wave (CW) lasers (Daylightsolutions) or broadband sources. The latter is based on the difference-frequency-generation (DFG) technique described in detail in Ref. 1. The broadband pulses generated by the DFG system has a pulse width of about 100 fs and they are continuously tunable in a wide mid-ir range ( cm -1 ). The illuminated AFM tip (Figure 1a in the main text) generates strong near fields with a wide range of in-plane momenta q. 2 These momenta could exceed the far-field wavevector by two orders of magnitude, thus allowing for energy transfer and momentum matching between the incident photons and excited plasmons. 2 The standard observable of an s-snom experiment is s: the near-field scattering amplitude demodulated at the n th (n = 2 in the current work) harmonics of the AFM tip oscillation. 2. Sample preparation Our graphene nanoribbons (GNRs) were patterned by electron beam lithography on high quality graphene single crystals grown by the chemical vapor deposition (CVD) method. 3 The mobility of these single crystals is comparable to exfoliated microcrystals 4 and their typical sizes exceed 100 m (Figure S1), sufficient for a wide range of technological applications. These CVD graphene crystals were then transferred to aluminum oxide (Al2O3) substrates grown by atomic layer deposition on silicon wafers. In order to determine the optical properties of Al2O3, we performed mid-ir ellipsometry on our wafers. Thus obtained dielectric function of Al2O3 is given in Figure S2, where one can see an optical phonon resonance below 1000 cm -1. The corresponding transverse (TO), surface (SO) and longitudinal (LO) phonon frequencies are at = 629, 830 and 924 cm -1, respectively. The near-field resonance of Al2O3 substrate shown in the nano-ftir plot (Figure 3c in the main text) is at the surface optical phonon frequency.
 and imaginary ( 2) parts of the dielectric function of Al2O3 determined through ellipsometry.")
15 Figure S1. Optical microscopy image of a typical large area CVD graphene microcrystal. The substrate here is the standard SiO2/Si wafer that gives the best optical contrast. Figure S2. Real ( 1) and imaginary ( 2) parts of the dielectric function of Al2O3 determined through ellipsometry. The dashed lines mark respectively the transverse optical phonon (TO), surface optical phonon (SO) and longitudinal optical phonon (LO) frequencies. 3. Numerical modeling of plasmon fringe profiles In order to model the fringes profiles of two-dimensional (2D) surface plasmons confined inside GNRs, we model our AFM tip as a metallic spheroid: the length of the spheroid is 2L and the radius of curvature at the tip ends is a. Here, a is set to be 25 nm according to the manufacturer and L is not a sensitive parameter so long as L >> a. The scattering amplitude s (before demodulation) scales with the total radiating dipole (pz) of the spheroid. Therefore, in order to fit the line profiles perpendicular to the fringes inside GNRs, we need to calculate pz at different spatial coordinates (x, z) of the lower end of the AFM tip. Here, x is the in-plane coordinate perpendicular to the GNRs and z is the out-ofplane coordinate parallel to the AFM tip. By calculating pz at different z, we are able to perform demodulation of the scattering amplitude s and get different harmonics of the scattering signal. While calculating pz at different x allows us to plot the modeling profiles of near-field amplitude. The symmetry along the ribbon direction (y direction) of our straight GNRs saves us orders of magnitude time and efforts in modeling the plasmon
16 fringes profiles, which makes it practical to fit the essential parameters of graphene plasmons by exploring the broad parameter space. In the current work, the scattering amplitude s is normalized to that of bare Al2O3 substrate, so it has a relative unit (rel. unit). The dielectric function 1( ) + i 2( ) of Al2O3 (Figure S2) we used for the modeling was determined by ellipsometry. 4. Damping of graphene plasmons In the main text, we introduced our real-space analysis of graphene plasmon damping close to the substrate phonon. In fact, plasmon damping has also been discussed in previous spectroscopic study of GNRs. 5 Here, we want to discuss in detail the two methods and their conclusions. In the spectroscopic work 5, damping analysis is done based on linewidth analysis of plasmon resonance peaks of GNRs. The damping rate obtained in this way (labeled as 1) is thus inversely proportional to resonance lifetime. In our nano-ir imaging work, damping analysis was done by fitting the real-space data and thus the extracted damping rate (labeled as 2) is inversely related to the mode propagation length. The outcomes of the two analyses are not equivalent and are seemingly contradictory to each other. For example, according to Ref. 5, the damping rate ( 1) is lower close to the substrate phonon. Nevertheless, data and analysis in the current work conclude that the damping rate ( 2) is much higher close to the substrate phonon. In order to explain the contradiction, we need to understand the relation the two damping rates: 1 to 2. They are of course not equal to each other as they are measured in different units. One has to consider the mode velocity (vp = d /dq) to connect the two damping rates: 1 ~ vp 2. Close to the substrate phonon, the dispersion curve becomes flat (vp 0), so 1 drops despite of an increased 2. Therefore, our real-space imaging study provides a complimentary view on graphene plasmon damping. 5. Further discussion of edge plasmons Edge plasmons are one dimensional (1D) modes propagating strictly along the edges of 2D conductors such as graphene. Similar to the conventional 2D surface plasmons, the edge plasmons are launched by the near-field probe of the s-snom. These edge modes could be reflected back when encountering reflectors thus causing interference, which can be captured by the s-snom as edge oscillations. We discussed two types of reflectors in the main text of the paper. Type-1 reflectors are sharp corners (Fig. 4a,b) that can be seen clearly from AFM topography. Type-2 reflectors (Fig. 4c,d and also illustrated in Fig. S3a) are possibly small edge defects created by lithography patterning that are not easily identified by AFM. Type-1 reflectors have well defined positions. Moreover, they are much more efficient reflectors compared to the latter ones, thus generating higher-intensity edge oscillations that dominate over those due to type-2 reflectors. Therefore, we chose edge oscillations close to the sharp corners for quantitative analysis (Fig. 4a,b). Indeed, the edge oscillations between two separated sharp corners show obvious frequency dependence (Fig. 4b), consistent with the dispersion nature of edge plasmons. The edge oscillations due to small edge defects (e.g. around a micro-disk, Fig. 4c,d and Fig. S3a) are much more difficult to analyze quantitatively. They may depend on the plasmon wavelength as well as the locations, sizes and shapes of these defects. We have carefully examined both the topography and near-field images of our data. Future studies
.")
17 combining high-resolution techniques (e.g. STM) with nano-ir imaging are necessary to uncover the properties of these defects. Figure S3. a, Qualitative explanation of the edge oscillations in Figure 4c,d of the main text as a superposition of many standing waves created by edge plasmons reflected off multiple random defects (stars). b, The proposed scheme to directly launch and detect edge plasmons. c, Numerically calculated Ez field map excited inside a graphene disk by a metallic antenna. The antenna has a triangular shape (shown schematically in b) and its sharp tip touches the disk at point (0, 0). The excited 1D edge modes and 2D surface plasmons are visible. 6. Numerical modelling of edge plasmons The physics of the zero-field edge plasmons in graphene may be explored in future studies using samples with clean, natural edges. The launching of edge modes can be achieved with the help of antenna-like structures (Figure S3b). As illustrated in Figure S3b, when the metallic sharp antenna is illuminated by the incident IR beam, the strong confined near fields close to the end of the antenna could launch plasmon waves inside adjacent graphene structure with smooth graphene edges. Our numerical simulations suggest that distinct mode patterns due to both 1D edge plasmons and 2D surface plasmons should appear in graphene (Figure S3c). As seen from Figure S3c, the wavelength of edge plasmons is smaller than that of surface plasmons in the graphene interior, which is consistent with eq. 1 in the main text. One can in principle map such mode pattern by using the s-snom. We were unable to determine exactly the locations, sizes and shapes of the small edge defects due to the limited resolution of the AFM. We speculate that the edge modes are localized based on the fact that the oscillations due to these defects do not show obvious frequency dependence (Figure 4d in the main text). As detailed below, localization of edge plasmons could occur when the density ( ) of the reflectors (defects) per unit length is so high that their reflector-to-reflector separation (~ 1/ ) is smaller than the wavelength of edge plasmons ( ep). A simple illustration is given in Figure S4, where we consider two defects with a separation of d ~1/ along the graphene edge (Figure S4a). When tiplaunched edge plasmons encounter the reflectors, they are partially reflected and also undergo a ~ phase shift. In Figure S4b, we show the (xtip, ep) dependent plasmon amplitude ( Ez ) map, where xtip is the location of the AFM tip. Every horizontal line cut of the map resembles what we measure in our nano-ir imaging experiment at a given IR frequency. The two white dashed lines mark the positions of the reflectors. One can see that when ep/d 1, there are two or more bright modes confined within the two reflectors, which is consistent with our observations of edge modes confined between two sharp
 consistent with our observation of the fixposition modes surrounding the micro-disk (Figure 4d).")
18 corners (Figure 4a,b). However, as ep/d increases above 1.5, there is only single bright mode appears at the center of the two reflectors. The position of this single bright mode does not change with ep (or IR frequency) consistent with our observation of the fixposition modes surrounding the micro-disk (Figure 4d). Moreover, we can also see that the intensity of the single plasmon mode between the two reflectors decreases with increasing ep (or decreasing IR frequency), which is also consistent with our experimental observation (Figure 4d). Figure S4. a, Illustration of a model for simulation of two reflectors (defects) at the graphene edge. b, Simulated (xtip, ep) dependent amplitude ( Ez ) map of edge plasmons created by the two reflectors in a. References (1) Keilmann, F.; Amarie, S. J. Infrared Milli. Terahz. Waves 2012, 33, 479. (2) Fei, Z.; Andreev, G. O.; Bao, W.; Zhang, L. M.; McLeod, A. S.; Wang, C.; Stewart, M. K.; Zhao, Z.; Dominguez, G.; Thiemens, M.; Fogler, M. M., Tauber, M. J.; Castro-Neto, A. H.; Lau, C. N.; Keilmann, F.; Basov, D. N. Nano Lett. 2011, 11, (3) V. E. Calado, S. Zhu, S. Goswami, Q. Xu, K. Watanabe, T. Taniguchi, G.C.A.M. Janssen and L.M.K. Vandersypen. Appl. Phys. Lett. 2014, 104, (4) Fei, Z.; Rodin, A. S.; Andreev, G. O.; Bao, W.; McLeod, A. S.; Wagner, M.; Zhang, L. M.; Zhao, Z.; Thiemens, M.; Dominguez, G.; Fogler, M. M.; Castro Neto, A. H.; Lau, C. N.; Keilmann, F.; Basov, D. N. Nature 2012, 487, (5) Yan, H.; Low, T.; Zhu, W.; Wu, Y.; Freitag, M.; Li, X.; Guinea, F.; Avouris, P.; Xia, F. Nature Photon. 2013, 7,
Strong coupling in the far-infrared between graphene plasmons and the
 Strong coupling in the far-infrared between graphene plasmons and the surface optical phonons of silicon dioxide I. J. Luxmoore 1,a), C. H. Gan 1, P. Q. Liu 2, F. Valmorra 2, P. Li 1, J. Faist 2, and G.
Launching and control of graphene plasmon by nanoridge structures
 Supporting Information Launching and control of graphene plasmon by nanoridge structures Sanpon Vantasin, Yoshito Tanaka,* Tsutomu Shimura 1. Launching and stationary modes of single nanoridge structure
SUPPLEMENTARY INFORMATION
 In the format provided by the authors and unedited. SUPPLEMENTARY INFORMATION DOI: 10.1038/NPHOTON.017.65 Imaging exciton-polariton transport in MoSe waveguides F. Hu 1,, Y. Luan 1,, M. E. Scott 3, J.
Graphene-polymer multilayer heterostructure for terahertz metamaterials
 University of Wollongong Research Online Faculty of Engineering and Information Sciences - Papers: Part A Faculty of Engineering and Information Sciences 2013 Graphene-polymer multilayer heterostructure
Graphene Plasmon Enhanced Vibrational Sensing of Surface- Adsorbed Layers
 pubs.acs.org/nanolett Graphene Plasmon Enhanced Vibrational Sensing of Surface- Adsorbed Layers Yilei Li,, Hugen Yan, Damon B. Farmer, Xiang Meng,, Wenjuan Zhu, Richard M. Osgood,, Tony F. Heinz,, and
Surface plasmon modes in graphene wedge and groove waveguides
 Surface plasmon modes in graphene wedge and groove waveguides Penghong Liu, 1,2 Xinzheng Zhang, 1,2 Zenghong Ma, 1,2 Wei Cai, 1,2, Lei Wang, 1,2 and Jingjun Xu 1,2,3 1 The Key Laboratory of Weak-Light
Optical nano-imaging of gate-tuneable graphene plasmons
 Optical nano-imaging of gate-tuneable graphene plasmons Jianing Chen *,5,1, Michela Badioli *,2, Pablo Alonso-González *1, Suko Thongrattanasiri *,3, Florian Huth *1,6, Johann Osmond 2, Marko Spasenović
Hexagonal Boron Nitride Self-Launches Hyperbolic. Phonon Polaritons
 Hexagonal Boron Nitride Self-Launches Hyperbolic Phonon Polaritons Leonid Gilburd, Kris S. Kim, Kevin Ho, Daniel Trajanoski, Aniket Maiti,, Duncan Halverson, Sissi de Beer,, and Gilbert C. Walker, * Department
SUPPLEMENTARY INFORMATION
 doi:10.1038/nature11253 I. ORIGIN OF THE OBSERVED SPATIAL MODULATIONS The qualitative explanation of the observed interference patterns is as follows. The tip of the near-field nanoscope excites a circular
Highly Confined Tunable Mid-Infrared Plasmonics in Graphene Nanoresonators
 Supplementary Information for Highly Confined Tunable Mid-Infrared Plasmonics in Graphene Nanoresonators by Victor W. Brar, Min Seok Jang, Michelle Sherrott, Josue J. Lopez and Harry Atwater 1 Approximating
Monolayer Black Phosphorus
 Supporting Information: Localized Surface Plasmons in Nanostructured Monolayer Black Phosphorus Zizhuo Liu and Koray Aydin* Department of Electrical Engineering and Computer Science, Northwestern University,
arrays for mid-infrared plasmonics
 Scalable and tunable periodic graphene nano-hole arrays for mid-infrared plasmonics Kavitha K. Gopalan*, Bruno Paulillo*, David M.A. Mackenzie +, Daniel Rodrigo*, Nestor Bareza*, Patrick R. Whelan +, Abhay
Wednesday 3 September Session 3: Metamaterials Theory (16:15 16:45, Huxley LT308)
") Session 3: Metamaterials Theory (16:15 16:45, Huxley LT308) (invited) TBC Session 3: Metamaterials Theory (16:45 17:00, Huxley LT308) Light trapping states in media with longitudinal electric waves D McArthur,
Session 3: Metamaterials Theory (16:15 16:45, Huxley LT308) (invited) TBC Session 3: Metamaterials Theory (16:45 17:00, Huxley LT308) Light trapping states in media with longitudinal electric waves D McArthur,
Surface plasmon polaritons (SPPs) are optical modes
 are optical modes") pubs.acs.org/nanolett Highly Confined Tunable Mid-Infrared Plasmonics in Graphene Nanoresonators Victor W. Brar,, Min Seok Jang, Michelle Sherrott, Josue J. Lopez, and Harry A. Atwater*,, Thomas J. Watson
pubs.acs.org/nanolett Highly Confined Tunable Mid-Infrared Plasmonics in Graphene Nanoresonators Victor W. Brar,, Min Seok Jang, Michelle Sherrott, Josue J. Lopez, and Harry A. Atwater*,, Thomas J. Watson
Bends and splitters in graphene nanoribbon waveguides
 Downloaded from orbit.dtu.dk on: Dec 20, 2017 Bends and splitters in graphene nanoribbon waveguides Zhu, Xiaolong; Yan, Wei; Mortensen, N. Asger; Xiao, Sanshui Published in: Optics Express Link to article,
Monolayer 2D systems can interact
 Substrate-Sensitive Mid-infrared Photoresponse in Graphene Marcus Freitag,,^, * Tony Low,,^ Luis Martin-Moreno,,^ Wenjuan Zhu, Francisco Guinea, and Phaedon Avouris IBM T.J. Watson Research Center, Yorktown
Electronically Tunable Perfect Absorption in Graphene
 Electronically Tunable Perfect Absorption in Graphene Seyoon Kim 1,, Min Seok Jang 1,2,, Victor W. Brar 1,3,4,, Kelly W. Mauser 1, and Harry A. Atwater 1,3,* * haa@caltech.edu Equally contributed authors
Gate-tuning of graphene plasmons revealed by infrared nano-imaging
 Gate-tuning of graphene plasmons revealed by infrared nano-imaging Z. Fei 1, A. S. Rodin 1, G. O. Andreev 1, W. Bao,3, A. S. McLeod 1, M. Wagner 1, L. M. Zhang 4, Z. Zhao, M. Thiemens 5, G. Dominguez 6,
Coupling-Enhanced Broadband Mid-Infrared Light Absorption in Graphene Plasmonic Nanostructures
 Coupling-Enhanced Broadband Mid-Infrared Light Absorption in Graphene Plasmonic Nanostructures Bingchen Deng, Qiushi Guo, Cheng Li, Haozhe Wang, Xi Ling, Damon B. Farmer, Shu-jen Han, Jing Kong, and Fengnian
UC San Diego UC San Diego Electronic Theses and Dissertations
 UC San Diego UC San Diego Electronic Theses and Dissertations Title Hyperbolic phonon polaritons in hexagonal boron nitride Permalink https://escholarship.org/uc/item/3kk8j51p Author Dai, Siyuan Publication
Controlling Graphene Ultrafast Hot Carrier Response from Metal-like. to Semiconductor-like by Electrostatic Gating
 Controlling Graphene Ultrafast Hot Carrier Response from Metal-like to Semiconductor-like by Electrostatic Gating S.-F. Shi, 1,2* T.-T. Tang, 1 B. Zeng, 1 L. Ju, 1 Q. Zhou, 1 A. Zettl, 1,2,3 F. Wang 1,2,3
nano-ftir: Material Characterization with Nanoscale Spatial Resolution
 neaspec presents: neasnom microscope nano-ftir: Material Characterization with Nanoscale Spatial Resolution AMC Workshop 2017 6th of June Dr. 2017 Tobias Gokus Company neaspec GmbH leading experts of nanoscale
Supporting Information. by Hexagonal Boron Nitride
 Supporting Information High Velocity Saturation in Graphene Encapsulated by Hexagonal Boron Nitride Megan A. Yamoah 1,2,, Wenmin Yang 1,3, Eric Pop 4,5,6, David Goldhaber-Gordon 1 * 1 Department of Physics,
Resonance perfect absorption by exciting hyperbolic phonon polaritons in 1D hbn gratings
 Vol. 25, No. 7 3 Apr 2017 OPTICS EXPRESS 7791 Resonance perfect absorption by exciting hyperbolic phonon polaritons in 1D hbn gratings BO ZHAO1,2,3 AND ZHUOMIN M. ZHANG1,4 1 G.W. Woodruff School of Mechanical
Hybrid Surface-Phonon-Plasmon Polariton Modes in Graphene /
 Supplementary Information: Hybrid Surface-Phonon-Plasmon Polariton Modes in Graphene / Monolayer h-bn stacks Victor W. Brar 1,2, Min Seok Jang 3,, Michelle Sherrott 1, Seyoon Kim 1, Josue J. Lopez 1, Laura
Plasmon polaritons, the light-driven collective oscillation of
 pubs.acs.org/nanolett Plasmon Phonon Coupling in Large-Area Graphene Dot and Antidot Arrays Fabricated by Nanosphere Lithography Xiaolong Zhu,, Weihua Wang,, Wei Yan,, Martin B. Larsen,, Peter Bøggild,,
Supporting Information
 Supporting Information Light emission near a gradient metasurface Leonard C. Kogos and Roberto Paiella Department of Electrical and Computer Engineering and Photonics Center, Boston University, Boston,
Supplementary Figure S1. AFM characterizations and topographical defects of h- BN films on silica substrates. (a) (c) show the AFM height
 (c) show the AFM height") Supplementary Figure S1. AFM characterizations and topographical defects of h- BN films on silica substrates. (a) (c) show the AFM height topographies of h-bn film in a size of ~1.5µm 1.5µm, 30µm 30µm
Supplementary Figure S1. AFM characterizations and topographical defects of h- BN films on silica substrates. (a) (c) show the AFM height topographies of h-bn film in a size of ~1.5µm 1.5µm, 30µm 30µm
Highly Sensitive and Wide-Band Tunable Terahertz Response of Plasma Wave based on Graphene Field Effect Transistors
 Supplementary Information Highly Sensitive and Wide-Band Tunable Terahertz Response of Plasma Wave based on Graphene Field Effect Transistors Lin Wang, Xiaoshuang Chen *, Anqi Yu, Yang Zhang, Jiayi Ding
Supporting Information Available:
 Supporting Information Available: Photoresponsive and Gas Sensing Field-Effect Transistors based on Multilayer WS 2 Nanoflakes Nengjie Huo 1, Shengxue Yang 1, Zhongming Wei 2, Shu-Shen Li 1, Jian-Bai Xia
Supplementary Information for. Vibrational Spectroscopy at Electrolyte Electrode Interfaces with Graphene Gratings
 Supplementary Information for Vibrational Spectroscopy at Electrolyte Electrode Interfaces with Graphene Gratings Supplementary Figure 1. Simulated from pristine graphene gratings at different Fermi energy
Supplementary Figure 1 Magneto-transmission spectra of graphene/h-bn sample 2 and Landau level transition energies of three other samples.
 Supplementary Figure 1 Magneto-transmission spectra of graphene/h-bn sample 2 and Landau level transition energies of three other samples. (a,b) Magneto-transmission ratio spectra T(B)/T(B 0 ) of graphene/h-bn
Supplementary Information. Experimental Evidence of Exciton Capture by Mid-Gap Defects in CVD. Grown Monolayer MoSe2
 Supplementary Information Experimental Evidence of Exciton Capture by Mid-Gap Defects in CVD Grown Monolayer MoSe2 Ke Chen 1, Rudresh Ghosh 2,3, Xianghai Meng 1, Anupam Roy 2,3, Joon-Seok Kim 2,3, Feng
Metamaterials refer to artificial structures with properties
 pubs.acs.org/journal/apchd5 Tunable Terahertz Meta-Surface with Graphene Cut-Wires Yuancheng Fan,*, Nian-Hai Shen,*, Thomas Koschny, and Costas M. Soukoulis, Key Laboratory of Space Applied Physics and
Supplementary Figure 1 Schematics of an optical pulse in a nonlinear medium. A Gaussian optical pulse propagates along z-axis in a nonlinear medium
 Supplementary Figure 1 Schematics of an optical pulse in a nonlinear medium. A Gaussian optical pulse propagates along z-axis in a nonlinear medium with thickness L. Supplementary Figure Measurement of
Ultrafast Lateral Photo-Dember Effect in Graphene. Induced by Nonequilibrium Hot Carrier Dynamics
 1 Ultrafast Lateral Photo-Dember Effect in Graphene Induced by Nonequilibrium Hot Carrier Dynamics Chang-Hua Liu, You-Chia Chang, Seunghyun Lee, Yaozhong Zhang, Yafei Zhang, Theodore B. Norris,*,, and
SENSITIVITY ENHANCEMENT OF A D-SHAPE SPR-POF LOW-COST SENSOR USING GRAPHENE
 International Journal of Education and Research Vol. No. November 03 SENSITIVITY ENHANCEMENT OF A D-SHAPE SPR-POF LOW-COST SENSOR USING GRAPHENE Ramona GALATUS, Lorant SZOLGA, Emil VOICULESCU Technical
Self-Doping Effects in Epitaxially-Grown Graphene. Abstract
 Self-Doping Effects in Epitaxially-Grown Graphene D.A.Siegel, 1,2 S.Y.Zhou, 1,2 F.ElGabaly, 3 A.V.Fedorov, 4 A.K.Schmid, 3 anda.lanzara 1,2 1 Department of Physics, University of California, Berkeley,
Black phosphorus: A new bandgap tuning knob
 Black phosphorus: A new bandgap tuning knob Rafael Roldán and Andres Castellanos-Gomez Modern electronics rely on devices whose functionality can be adjusted by the end-user with an external knob. A new
Imaging electrostatically confined Dirac fermions in graphene
 Imaging electrostatically confined Dirac fermions in graphene quantum dots 3 4 5 Juwon Lee, Dillon Wong, Jairo Velasco Jr., Joaquin F. Rodriguez-Nieva, Salman Kahn, Hsin- Zon Tsai, Takashi Taniguchi, Kenji
Supplementary Information
 Electronic Supplementary Material (ESI) for Nanoscale. This journal is The Royal Society of Chemistry 2014 Supplementary Information Large-scale lithography-free metasurface with spectrally tunable super
Nonlinear Electrodynamics and Optics of Graphene
 Nonlinear Electrodynamics and Optics of Graphene S. A. Mikhailov and N. A. Savostianova University of Augsburg, Institute of Physics, Universitätsstr. 1, 86159 Augsburg, Germany E-mail: sergey.mikhailov@physik.uni-augsburg.de
Monolayer Semiconductors
 Monolayer Semiconductors Gilbert Arias California State University San Bernardino University of Washington INT REU, 2013 Advisor: Xiaodong Xu (Dated: August 24, 2013) Abstract Silicon may be unable to
Scattering-type near-field microscopy for nanoscale optical imaging
 Scattering-type near-field microscopy for nanoscale optical imaging Rainer Hillenbrand Nano-Photonics Group Max-Planck-Institut für Biochemie 82152 Martinsried, Germany Infrared light enables label-free
Raman spectroscopy at the edges of multilayer graphene
 Raman spectroscopy at the edges of multilayer graphene Q. -Q. Li, X. Zhang, W. -P. Han, Y. Lu, W. Shi, J. -B. Wu, P. -H. Tan* State Key Laboratory of Superlattices and Microstructures, Institute of Semiconductors,
Nanoscale optical circuits: controlling light using localized surface plasmon resonances
 Nanoscale optical circuits: controlling light using localized surface plasmon resonances T. J. Davis, D. E. Gómez and K. C. Vernon CSIRO Materials Science and Engineering Localized surface plasmon (LSP)
Plasmonic eigenmodes in individual and bow-tie. graphene nanotriangles
 Plasmonic eigenmodes in individual and bow-tie graphene nanotriangles Weihua Wang,, Thomas Christensen,, Antti-Pekka Jauho,, Kristian S. Thygesen,, Martijn Wubs,, and N. Asger Mortensen,, DTU Fotonik,
Introduction to Scanning Probe Microscopy Zhe Fei
 Introduction to Scanning Probe Microscopy Zhe Fei Phys 590B, Apr. 2019 1 Outline Part 1 SPM Overview Part 2 Scanning tunneling microscopy Part 3 Atomic force microscopy Part 4 Electric & Magnetic force
Supplementary Figure 1. Selected area electron diffraction (SAED) of bilayer graphene and tblg. (a) AB
 of bilayer graphene and tblg. (a) AB") Supplementary Figure 1. Selected area electron diffraction (SAED) of bilayer graphene and tblg. (a) AB stacked bilayer graphene (b), (c), (d), (e), and (f) are twisted bilayer graphene with twist angle
Supplementary Figure 1. Selected area electron diffraction (SAED) of bilayer graphene and tblg. (a) AB stacked bilayer graphene (b), (c), (d), (e), and (f) are twisted bilayer graphene with twist angle
Magneto-plasmonic effects in epitaxial graphene
 Magneto-plasmonic effects in epitaxial graphene Alexey Kuzmenko University of Geneva Graphene Nanophotonics Benasque, 4 March 13 Collaborators I. Crassee, N. Ubrig, I. Nedoliuk, J. Levallois, D. van der
Spatially resolving density-dependent screening around a single charged atom in graphene
 Supplementary Information for Spatially resolving density-dependent screening around a single charged atom in graphene Dillon Wong, Fabiano Corsetti, Yang Wang, Victor W. Brar, Hsin-Zon Tsai, Qiong Wu,
Superconductivity Induced Transparency
 Superconductivity Induced Transparency Coskun Kocabas In this paper I will discuss the effect of the superconducting phase transition on the optical properties of the superconductors. Firstly I will give
The Dielectric Function of a Metal ( Jellium )
") The Dielectric Function of a Metal ( Jellium ) Total reflection Plasma frequency p (10 15 Hz range) Why are Metals Shiny? An electric field cannot exist inside a metal, because metal electrons follow the
The Dielectric Function of a Metal ( Jellium ) Total reflection Plasma frequency p (10 15 Hz range) Why are Metals Shiny? An electric field cannot exist inside a metal, because metal electrons follow the
Raman spectroscopy study of rotated double-layer graphene: misorientation angle dependence of electronic structure
 Supplementary Material for Raman spectroscopy study of rotated double-layer graphene: misorientation angle dependence of electronic structure Kwanpyo Kim 1,2,3, Sinisa Coh 1,3, Liang Z. Tan 1,3, William
Ultrafast and Nanoscale Plasmonic Phenomena in Exfoliated Graphene Revealed by Infrared Pump Probe Nanoscopy
 pubs.acs.org/nanolett Ultrafast and Nanoscale Plasmonic Phenomena in Exfoliated Graphene Revealed by Infrared Pump Probe Nanoscopy Martin Wagner, Zhe Fei, Alexander S. McLeod, Aleksandr S. Rodin,,# Wenzhong
Supplemental Materials
 Supplemental Materials On the modeling of graphene layer by a thin dielectric Modeling graphene as a D surface having an appropriate value of surface conductivity σ is an accurate approach for a semiclassical
Surface plasmons are fundamental collective modes of electrons. Infrared Nanoscopy of Dirac Plasmons at the Graphene SiO 2 Interface
 pubs.acs.org/nanolett Infrared Nanoscopy of Dirac Plasmons at the Graphene SiO 2 Interface Zhe Fei,*,,O Gregory O. Andreev,*,,O Wenzhong Bao, Lingfeng M. Zhang,, Alexander S. McLeod, Chen Wang, Margaret
Supporting Information for: Ultrafast Nanoimaging of the Photoinduced Phase Transition Dynamics in VO 2
 Supporting Information for: Ultrafast Nanoimaging of the Photoinduced Phase Transition Dynamics in VO 2 Sven A. Dönges, 1, Omar Khatib, 1, Brian T. O Callahan, 1 Joanna M. Atkin, 2 Jae Hyung Park, 3 David
Supplementary Figure 2 Photoluminescence in 1L- (black line) and 7L-MoS 2 (red line) of the Figure 1B with illuminated wavelength of 543 nm.
 and 7L-MoS 2 (red line) of the Figure 1B with illuminated wavelength of 543 nm.") PL (normalized) Intensity (arb. u.) 1 1 8 7L-MoS 1L-MoS 6 4 37 38 39 4 41 4 Raman shift (cm -1 ) Supplementary Figure 1 Raman spectra of the Figure 1B at the 1L-MoS area (black line) and 7L-MoS area (red
PL (normalized) Intensity (arb. u.) 1 1 8 7L-MoS 1L-MoS 6 4 37 38 39 4 41 4 Raman shift (cm -1 ) Supplementary Figure 1 Raman spectra of the Figure 1B at the 1L-MoS area (black line) and 7L-MoS area (red
Supplementary Information for Atomically Phase-Matched Second-Harmonic Generation. in a 2D Crystal
 Supplementary Information for Atomically Phase-Matched Second-Harmonic Generation in a 2D Crystal Mervin Zhao 1, 2, Ziliang Ye 1, 2, Ryuji Suzuki 3, 4, Yu Ye 1, 2, Hanyu Zhu 1, Jun Xiao 1, Yuan Wang 1,
Supplemental material: Transient thermal characterization of suspended monolayer MoS 2
 Supplemental material: Transient thermal characterization of suspended monolayer MoS Robin J. Dolleman,, David Lloyd, Martin Lee, J. Scott Bunch,, Herre S. J. van der Zant, and Peter G. Steeneken, Kavli
arxiv: v1 [cond-mat.mes-hall] 9 Mar 2016
![arxiv: v1 [cond-mat.mes-hall] 9 Mar 2016](/thumbs/72/68000826.jpg "arxiv: v1 [cond-mat.mes-hall] 9 Mar 2016") Dynamically controllable graphene three-port arxiv:1603.02936v1 [cond-mat.mes-hall] 9 Mar 2016 circulator Victor Dmitriev, Wagner Castro,, and Clerisson Nascimento Department of Electrical Engineering,
Dynamically controllable graphene three-port arxiv:1603.02936v1 [cond-mat.mes-hall] 9 Mar 2016 circulator Victor Dmitriev, Wagner Castro,, and Clerisson Nascimento Department of Electrical Engineering,
Ultrasensitive Plasmonic Detection of Molecules with Graphene
 pubs.acs.org/journal/apchd5 Ultrasensitive Plasmonic Detection of Molecules with Graphene Damon B. Farmer,*, Phaedon Avouris, Yilei Li,, Tony F. Heinz,, and Shu-Jen Han IBM T. J. Watson Research Center,
Supporting Information. Nanoscale control of rewriteable doping patterns in pristine graphene/boron nitride heterostructures
 Supporting Information Nanoscale control of rewriteable doping patterns in pristine graphene/boron nitride heterostructures Jairo Velasco Jr. 1,5,, Long Ju 1,, Dillon Wong 1,, Salman Kahn 1, Juwon Lee
Simulated Study of Plasmonic Coupling in Noble Bimetallic Alloy Nanosphere Arrays
 CHAPTER 4 Simulated Study of Plasmonic Coupling in Noble Bimetallic Alloy Nanosphere Arrays 4.1 Introduction In Chapter 3, the noble bimetallic alloy nanosphere (BANS) of Ag 1-x Cu x at a particular composition
Strong light matter coupling in two-dimensional atomic crystals
 SUPPLEMENTARY INFORMATION DOI: 10.1038/NPHOTON.2014.304 Strong light matter coupling in two-dimensional atomic crystals Xiaoze Liu 1, 2, Tal Galfsky 1, 2, Zheng Sun 1, 2, Fengnian Xia 3, Erh-chen Lin 4,
Supporting Online Material for
 www.sciencemag.org/cgi/content/full/320/5874/356/dc1 Supporting Online Material for Chaotic Dirac Billiard in Graphene Quantum Dots L. A. Ponomarenko, F. Schedin, M. I. Katsnelson, R. Yang, E. W. Hill,
Graphene photodetectors with ultra-broadband and high responsivity at room temperature
 SUPPLEMENTARY INFORMATION DOI: 10.1038/NNANO.2014.31 Graphene photodetectors with ultra-broadband and high responsivity at room temperature Chang-Hua Liu 1, You-Chia Chang 2, Ted Norris 1.2* and Zhaohui
Nanoplasmonics: Classical down to the Nanometer Scale
 Supporting Information Nanoplasmonics: Classical down to the Nanometer Scale Huigao Duan #, Antonio I. Fernández-Domínguez 2#, Michel Bosman #, Stefan A. Maier 2* & Joel K. W. Yang * Institute of Materials
Supplementary information for. plasmonic nanorods interacting with J-aggregates.
 Supplementary information for Approaching the strong coupling limit in single plasmonic nanorods interacting with J-aggregates. by Gülis Zengin, Göran Johansson, Peter Johansson, Tomasz J. Antosiewicz,
Optical cavity modes in gold shell particles
 9 Optical cavity modes in gold shell particles Gold (Au) shell particles with dimensions comparable to the wavelength of light exhibit a special resonance, with a tenfold field enhancement over almost
Multiple Fano Resonances Structure for Terahertz Applications
 Progress In Electromagnetics Research Letters, Vol. 50, 1 6, 2014 Multiple Fano Resonances Structure for Terahertz Applications Hadi Amarloo *, Daniel M. Hailu, and Safieddin Safavi-Naeini Abstract A new
Continuous Growth of Hexagonal Graphene and Boron Nitride In-Plane Heterostructures by Atmospheric Pressure Chemical Vapor Deposition
 SUPPORTING INFORMATION FOR Continuous Growth of Hexagonal Graphene and Boron Nitride In-Plane Heterostructures by Atmospheric Pressure Chemical Vapor Deposition Gang Hee Han 1, 3, Julio A. Rodríguez-Manzo
A Study on the Suitability of Indium Nitride for Terahertz Plasmonics
 A Study on the Suitability of Indium Nitride for Terahertz Plasmonics Arjun Shetty 1*, K. J. Vinoy 1, S. B. Krupanidhi 2 1 Electrical Communication Engineering, Indian Institute of Science, Bangalore,
Surface atoms/molecules of a material act as an interface to its surrounding environment;
 1 Chapter 1 Thesis Overview Surface atoms/molecules of a material act as an interface to its surrounding environment; their properties are often complicated by external adsorbates/species on the surface
Nanoscale IR spectroscopy of organic contaminants
 The nanoscale spectroscopy company The world leader in nanoscale IR spectroscopy Nanoscale IR spectroscopy of organic contaminants Application note nanoir uniquely and unambiguously identifies organic
Supporting information. Unidirectional Doubly Enhanced MoS 2 Emission via
 Supporting information Unidirectional Doubly Enhanced MoS 2 Emission via Photonic Fano Resonances Xingwang Zhang, Shinhyuk Choi, Dake Wang, Carl H. Naylor, A. T. Charlie Johnson, and Ertugrul Cubukcu,,*
Graphene conductivity mapping by terahertz time-domain reflection spectroscopy
 Graphene conductivity mapping by terahertz time-domain reflection spectroscopy Xiaodong Feng, Min Hu *, Jun Zhou, and Shenggang Liu University of Electronic Science and Technology of China Terahertz Science
Optical nano-imaging of gate-tuneable graphene plasmons
 Optical nano-imaging of gate-tuneable graphene plasmons Jianing Chen *,5,1, Michela Badioli *,2, Pablo Alonso-González *1, Suko Thongrattanasiri *,3, Florian Huth *1,6, Johann Osmond 2, Marko Spasenović
Observation of coupled plasmon-polariton modes of plasmon waveguides for electromagnetic energy transport below the diffraction limit
 Mat. Res. Soc. Symp. Proc. Vol. 722 2002 Materials Research Society Observation of coupled plasmon-polariton modes of plasmon waveguides for electromagnetic energy transport below the diffraction limit
SUPPLEMENTARY INFORMATION
 DOI: 1.138/NNANO.211.214 Control over topological insulator photocurrents with light polarization J.W. McIver*, D. Hsieh*, H. Steinberg, P. Jarillo-Herrero and N. Gedik SI I. Materials and device fabrication
Multi-cycle THz pulse generation in poled lithium niobate crystals
 Laser Focus World April 2005 issue (pp. 67-72). Multi-cycle THz pulse generation in poled lithium niobate crystals Yun-Shik Lee and Theodore B. Norris Yun-Shik Lee is an assistant professor of physics
Reduction of Fermi velocity in folded graphene observed by resonance Raman spectroscopy
 Reduction of Fermi velocity in folded graphene observed by resonance Raman spectroscopy Zhenhua Ni, Yingying Wang, Ting Yu, Yumeng You, and Zexiang Shen* Division of Physics and Applied Physics, School
Plasmons in dimensionally mismatched Coulomb coupled graphene systems
 Plasmons in dimensionally mismatched Coulomb coupled graphene systems S. M. Badalyan, A. A. Shylau, and A. P. Jauho Center for Nanostructured Graphene (CNG), Department of Micro and Nanotechnology, Technical
Supplementary Information for Solution-Synthesized Chevron Graphene Nanoribbons Exfoliated onto H:Si(100)
") Supplementary Information for Solution-Synthesized Chevron Graphene Nanoribbons Exfoliated onto H:Si(100) Adrian Radocea,, Tao Sun,, Timothy H. Vo, Alexander Sinitskii,,# Narayana R. Aluru,, and Joseph
Supplementary Information for Solution-Synthesized Chevron Graphene Nanoribbons Exfoliated onto H:Si(100) Adrian Radocea,, Tao Sun,, Timothy H. Vo, Alexander Sinitskii,,# Narayana R. Aluru,, and Joseph
Supplementary Figure 1 Experimental setup for crystal growth. Schematic drawing of the experimental setup for C 8 -BTBT crystal growth.
 Supplementary Figure 1 Experimental setup for crystal growth. Schematic drawing of the experimental setup for C 8 -BTBT crystal growth. Supplementary Figure 2 AFM study of the C 8 -BTBT crystal growth
Plasmonics. The long wavelength of light ( μm) creates a problem for extending optoelectronics into the nanometer regime.
 creates a problem for extending optoelectronics into the nanometer regime.") Plasmonics The long wavelength of light ( μm) creates a problem for extending optoelectronics into the nanometer regime. A possible way out is the conversion of light into plasmons. They have much shorter
Plasmonics The long wavelength of light ( μm) creates a problem for extending optoelectronics into the nanometer regime. A possible way out is the conversion of light into plasmons. They have much shorter
SUPPLEMENTARY INFORMATION
 Supplementary Information: Photocurrent generation in semiconducting and metallic carbon nanotubes Maria Barkelid 1*, Val Zwiller 1 1 Kavli Institute of Nanoscience, Delft University of Technology, Delft,
SUPPLEMENTARY INFORMATION
 A Stable Three-dimensional Topological Dirac Semimetal Cd 3 As 2 Z. K. Liu, J. Jiang, B. Zhou, Z. J. Wang, Y. Zhang, H. M. Weng, D. Prabhakaran, S. -K. Mo, H. Peng, P. Dudin, T. Kim, M. Hoesch, Z. Fang,
photonic crystals School of Space Science and Physics, Shandong University at Weihai, Weihai , China
 Enhanced absorption in heterostructures with graphene and truncated photonic crystals Yiping Liu 1, Lei Du 1, Yunyun Dai 2, Yuyu Xia 2, Guiqiang Du 1,* Guang Lu 1, Fen Liu 1, Lei Shi 2, Jian Zi 2 1 School
1 Introduction. Shenyang Huang, Chaoyu Song, Guowei Zhang and Hugen Yan* Graphene plasmonics: physics and potential applications
 Nanophotonics 2016; aop Review article Open Access Shenyang Huang, Chaoyu Song, Guowei Zhang and Hugen Yan* Graphene plasmonics: physics and potential applications DOI 10.1515/nanoph-2016-0126 Received
Ultrafast Dynamics of Surface Plasmons in InAs by Time-Resolved Infrared Nanospectroscopy
 pubs.acs.org/nanolett Ultrafast Dynamics of Surface Plasmons in InAs by Time-Resolved Infrared Nanospectroscopy Martin Wagner, Alexander S. McLeod, Scott J. Maddox, Zhe Fei, Mengkun Liu, Richard D. Averitt,,
Nanomaterials and their Optical Applications
 Nanomaterials and their Optical Applications Winter Semester 2012 Lecture 04 rachel.grange@uni-jena.de http://www.iap.uni-jena.de/multiphoton Lecture 4: outline 2 Characterization of nanomaterials SEM,
graphene nano-optoelectronics Frank Koppens ICFO, The institute of photonic sciences, Barcelona
 graphene nano-optoelectronics Frank Koppens ICFO, The institute of photonic sciences, Barcelona Graphene research at ICFO Frank Koppens: group Nano-optoelectronics (~100% graphene) Nano-optics and plasmonics
Graphene plasmonics is a relatively new research area that
 pubs.acs.org/nanolett Plasmon Plasmon Hybridization and Bandwidth Enhancement in Nanostructured Graphene Damon B. Farmer,*, Daniel Rodrigo,, Tony Low, and Phaedon Avouris IBM T. J. Watson Research Center,
Quantum Condensed Matter Physics Lecture 12
 Quantum Condensed Matter Physics Lecture 12 David Ritchie QCMP Lent/Easter 2016 http://www.sp.phy.cam.ac.uk/drp2/home 12.1 QCMP Course Contents 1. Classical models for electrons in solids 2. Sommerfeld
Ultrafast and Nanoscale Plasmonic Phenomena in Exfoliated Graphene Revealed by Infrared Pump-Probe Nanoscopy
 Supporting Information Ultrafast and Nanoscale Plasmonic Phenomena in Exfoliated Graphene Revealed by Infrared Pump-Probe Nanoscopy Martin Wagner, Zhe Fei, Alexander S. McLeod, Aleksandr S. Rodin,I, Wenzhong
Supplementary Information. Boron nitride nanoresonators for phonon-enhanced molecular vibrational spectroscopy at the strong coupling limit
 Supplementary Information Boron nitride nanoresonators for phonon-enhanced molecular vibrational spectroscopy at the strong coupling limit Marta Autore 1, Peining Li 1, Irene Dolado 1, Francisco J. Alfaro-Mozaz
Lecture 10: Surface Plasmon Excitation. 5 nm
 Excitation Lecture 10: Surface Plasmon Excitation 5 nm Summary The dispersion relation for surface plasmons Useful for describing plasmon excitation & propagation This lecture: p sp Coupling light to surface
Biosensing based on slow plasmon nanocavities
 iosensing based on slow plasmon nanocavities. Sepulveda, 1, Y. Alaverdyan,. rian, M. Käll 1 Nanobiosensors and Molecular Nanobiophysics Group Research Center on Nanoscience and Nanotechnolog (CIN)CSIC-ICN