The DFI Mid-UV Laser + :
|
|
|
- Cecily Short
- 5 years ago
- Views:
Transcription


1 The DFI Mid-UV Laser + : The solution for efficient and conclusive screening of mounted and unmounted D-Z colour diamonds of all shapes and all sizes Thomas Hainschwang 1) and Franck Notari 2) thomas.hainschwang@ggtl-lab.org franck.notari@ggtl-lab.org 1) GGTL Laboratories Liechtenstein 2) GGTL Laboratories Switzerland

2 DFI Mid-UV Laser + : The Instrument - DFI Mid-UV Laser + is an efficient screening instrument based on UV luminescence imaging and spectroscopy plus Raman spectroscopy. - 5 different UV excitation bands from 230 nm to 420 nm - 1 laser excitation - NOT automated - All sizes and shapes - Mounted and lose diamonds - Results usually directly in identification nat/synth/imit - Testing at RT and LNT possible
 3) 405 nm laser Raman spectroscopy Luminescence imaging, PL and Raman")
3 The DFI - Working Principles Distinction of diamonds, synthetic diamonds and imitations based on: 1) Luminescence color, intensity and distribution (Laser- or UV-induced), phosphorescence 2) Photoluminescence spectroscopy (Laser- or UV-excited, samples at room temperature or at liquid nitrogen temperature [77K]) 3) 405 nm laser Raman spectroscopy Luminescence imaging, PL and Raman spectroscopy are all done at the same time.
 After a few weeks of melee screening practice an average technician can work through 2500 to 3500 stones per hour.")
4 The DFI - Capacities and Requirements 1) After a three to five day training a technician can solve virtually all problems in D-Z colour diamond screening. 2) After a few weeks of melee screening practice an average technician can work through 2500 to 3500 stones per hour. 3) Technician needs only common sense and some logic, no requirement for a degree in earth sciences or physics necessary. 4) Working at low temperature is straight forward, easy and not dangerous.
5 Advantages of Raman- and Luminescence- Based Techniques used by the DFI - Raman and luminescence spectroscopy, luminescence imaging. - Non-destructive methods. - Applicable for very small samples, nearly no size limitation. - For transparent and opaque stones of all shapes and sizes, loose or mounted in jewellery. - Typically much faster, sensitive and accurate than absorption or SWUV based methods. - Distinguishes natural diamonds from synthetics ad imitations, and identifies them directly. At room temperature only very few undeterminable stones, at low temperature practically no undeterminable stones.


6 DFI Screening VS Other Screening Systems Diamonds rejected via other systems (47 stones), all identified as natural by room temperature DFI analysis. 3 stones isolated by DFI as well were the only type IIa and IIb diamonds in the parcel. Undeterminable at room temperature, but identified as natural by DFI at LNT. While other systems reject 50 samples as being potentially synthetic, the room temperature DFI luminescence based screening isolates only 3 stones, actually the only real type IIa and IIb diamonds out of the 50 stones. By low temperature DFI testing these three samples are equally identified as natural diamonds.
7 APPLICATION EXAMPLES


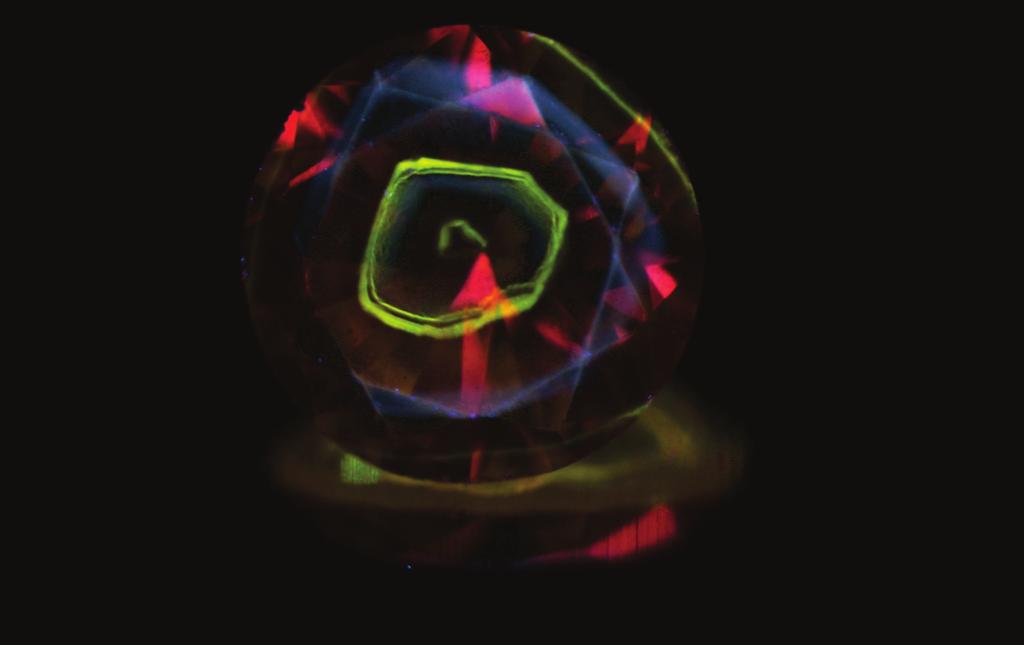
8 The DFI Fluorescence Imaging: Natural Diamond

9 The DFI Fluorescence Imaging and Spectroscopy: Natural Diamonds


10 The DFI Fluorescence Imaging and Spectroscopy: As-grown HPHT Synthetic Diamond First and second order Raman 880 nm Nickel defects


11 The DFI Fluorescence Imaging and Spectroscopy: As-Grown CVD Synthetic Diamond

12 The DFI Fluorescence Imaging and Spectroscopy: HPHT Treated CVD Synthetic Diamond
13 The DFI Raman Spectroscopy: Diamond VS Imitations
14 Technical Data and Available Options Excitation sources Microscope Camera Spectrometer High power broadband source filtered to permit up to 6 different UV excitation bands. High power 405 nm violet laser. Leica Trinocular Microscope, 7.5 to 70x. Leica CCD camera with 5 megapixel resolution and thermoelectrically cooled detector. Standard configuration CCD Type, irradiance calibrated Czerny-Turner spectrometer with cooled detector, spectral range 200 to 1100 nm, resolution 1.3 nm. 5 different excitation bands and 1 laser, single channel spectrometer, setup for room and low temperature imaging and spectroscopy, accessories and five day training for room and low temperature photoluminescence spectroscopy and imaging. Weights and dimensions: 70 kilograms total weight; dimensions (L x W x H): 70 x 60 x 90 cm Available options Multichannel spectrometer for higher resolution spectroscopy. Extended spectral Database with two years updates One additional excitation band of choice. Spectral database for room temperature spectroscopy or low temperature spectroscopy.
15 Support and Database - Quasi-permanent support by Dr Thomas Hainschwang and Franck Notari. - Extended Database, with scientific documentation, with commented and indexed spectra and reference spectra in.irr8 format. Two years updates included. - Our policy is to support and help our customers as efficiently as possible according to their specific needs.

16 GGTL Laboratories, 2016
Chemistry 524--Final Exam--Keiderling May 4, :30 -?? pm SES
 Chemistry 524--Final Exam--Keiderling May 4, 2011 3:30 -?? pm -- 4286 SES Please answer all questions in the answer book provided. Calculators, rulers, pens and pencils are permitted. No open books or
Saltwater cultured pearls from Pinctada maxima
 NOTES & NEW TECHNIQUES SPECTRAL CHARACTERISTICS OF NATURAL-COLOR SALTWATER CULTURED PEARLS FROM PINCTADA MAXIMA Stefanos Karampelas Natural-color saltwater cultured pearls (SWCPs) from Pinctada maxima
Supplementary Figure 1 Comparison of single quantum emitters on two type of substrates:
 Supplementary Figure 1 Comparison of single quantum emitters on two type of substrates: a, Photoluminescence (PL) spectrum of localized excitons in a WSe 2 monolayer, exfoliated onto a SiO 2 /Si substrate
RAMAN SPECTROSCOPY OF INK ON PAPER
 RAMAN SPECTROSCOPY OF INK ON PAPER Thomas ANDERMANN Bundeskriminalamt, Wiesbaden, Germany ABSTRACT: Blue and black ballpoint pen as well as blue, black, green and red fluid inks on paper are examined by
Supporting Information for. Near infrared-to-blue photon upconversion by exploiting direct. S-T absorption of a molecular sensitizer
 Electronic Supplementary Material (ESI) for Journal of Materials Chemistry C. This journal is The Royal Society of Chemistry 2017 Supporting Information for Near infrared-to-blue photon upconversion by
Chapter 6 Photoluminescence Spectroscopy
 Chapter 6 Photoluminescence Spectroscopy Course Code: SSCP 4473 Course Name: Spectroscopy & Materials Analysis Sib Krishna Ghoshal (PhD) Advanced Optical Materials Research Group Physics Department, Faculty
Wire%4%Training%Modules%Compilation%! The!following!modules!are!in!this!compilation:!! TM001!! Introduction!to!Raman!Spectroscopy! TM002!!
 Wire%4%Training%Modules%Compilation% Thefollowingmodulesareinthiscompilation: TM001 IntroductiontoRamanSpectroscopy TM002 IntroductiontoWiReandSystemstart?up TM003 Sampleviewingandconfigurationchange TM004
Resonance Raman measurements utilizing a deep UV source
 Resonance Raman measurements utilizing a deep UV source Adam Willitsford a, C. Todd Chadwick b, Hans Hallen b, and C. Russell Philbrick a a The Pennsylvania State University, Department of Electrical Engineering,
Clark Atlanta University Center for Surface Chemistry and Catalysis Instrument Capabilities
 Center for Surface Chemistry and Catalysis Instrument Capabilities For information contact: Dr. Eric Mintz Research Center for Science and Technology Clark Atlanta University Atlanta, Georgia 30314 Phone:
IR Spectrography - Absorption. Raman Spectrography - Scattering. n 0 n M - Raman n 0 - Rayleigh
 RAMAN SPECTROSCOPY Scattering Mid-IR and NIR require absorption of radiation from a ground level to an excited state, requires matching of radiation from source with difference in energy states. Raman
Chem Homework Set Answers
 Chem 310 th 4 Homework Set Answers 1. Cyclohexanone has a strong infrared absorption peak at a wavelength of 5.86 µm. (a) Convert the wavelength to wavenumber.!6!1 8* = 1/8 = (1/5.86 µm)(1 µm/10 m)(1 m/100
C101-E145 TALK LETTER. Vol. 17
 C101-E145 TALK LETTER Vol. 17 UV-VIS Spectroscopy and Fluorescence Spectroscopy (Part 1 of 2) ------- 02 Applications: Spectrofluorophotometers Used in a Variety of Fields ------- 06 Q&A: Is there a way
Chemistry 524--Final Exam--Keiderling Dec. 12, pm SES
 Chemistry 524--Final Exam--Keiderling Dec. 12, 2002 --4-8 pm -- 238 SES Please answer all questions in the answer book provided. Calculators, rulers, pens and pencils are permitted plus one 8.5 x 11 sheet
DETERMINATION OF RELATIVE FLUORESCENCE QUANTUM YIELD USING THE AGILENT CARY ECLIPSE
 FOOD ANALYSIS DETERMINATION OF RELATIVE FLUORESCENCE QUANTUM YIELD USING THE AGILENT CARY ECLIPSE Solutions for Your Analytical Business Markets and Applications Programs Authors Sangeetha Ramesan Co-Authors
The wavelength reconstruction from toroidal spectrometer image data
 Computational Methods and Experimental Measurements XIII 165 The wavelength reconstruction from toroidal spectrometer image data J. Blazej 1, M. Tamas 1, L. Pina 1, A. Jancarek 1, S. Palinek 1, P. Vrba
ORMS HARS. SpectrA LAB EQUIPMENTS Optical Rotation Resolution nm Wavelength Range 0.1nm Wavelength Resolution -70 C Cooling 10 Vacuum
 All Products are manufactured and marketed by Opto-Mechatronics Pvt. Ltd HARS ADVANCED RESEARCH SYSTEMS & SOLUTIONS FARADAY & KERR OPTO-MECHATRONICS PVT.LTD OPTICAL ROTATION MEASUREMENT SYSTEM 0-3 0.005
Analytical Spectroscopy Review
 Analytical Spectroscopy Review λ = wavelength ν = frequency V = velocity = ν x λ = 2.998 x 10 8 m/sec = c (in a vacuum) ν is determined by source and does not change as wave propogates, but V can change
Singlet. Fluorescence Spectroscopy * LUMO
 Fluorescence Spectroscopy Light can be absorbed and re-emitted by matter luminescence (photo-luminescence). There are two types of luminescence, in this discussion: fluorescence and phosphorescence. A
L E A. Laser Elemental Analyzer
 L E A Laser Elemental Analyzer The Future of handheld analysis The LEA is a hand-held analyzer which uses a low power laser beam to provide instant, on-site, elemental fingerprinting of materials. The
Raman spectroscopy at non-ambient conditions: I - Experimental set-up and a case study (anydrous mineral)
") Raman spectroscopy at non-ambient conditions: I - Experimental set-up and a case study (anydrous mineral) Il contributo della spettroscopia Raman allo studio dei minerali in condizioni non ambientali:
Raman spectroscopy at non-ambient conditions: I - Experimental set-up and a case study (anydrous mineral) Il contributo della spettroscopia Raman allo studio dei minerali in condizioni non ambientali:
Chapter 15 Molecular Luminescence Spectrometry
 Chapter 15 Molecular Luminescence Spectrometry Two types of Luminescence methods are: 1) Photoluminescence, Light is directed onto a sample, where it is absorbed and imparts excess energy into the material
ICP-3000 Inductively Coupled Plasma Optical Emission Spectrometer
 Inductively Coupled Plasma Optical Emission Spectrometer Inductively Coupled Plasma Optical Emission Spectrometer Inductively Coupled Plasma Optical Emission Spectrometer is powerful simultaneous full
Molecular Luminescence Spectroscopy
 Molecular Luminescence Spectroscopy In Molecular Luminescence Spectrometry ( MLS ), molecules of the analyte in solution are excited to give a species whose emission spectrum provides information for qualitative
ECE280: Nano-Plasmonics and Its Applications. Week8
 ECE280: Nano-Plasmonics and Its Applications Week8 Surface Enhanced Raman Scattering (SERS) and Surface Plasmon Amplification by Stimulated Emission of Radiation (SPASER) Raman Scattering Chandrasekhara
DAY LABORATORY EXERCISE: SPECTROSCOPY
 AS101 - Day Laboratory: Spectroscopy Page 1 DAY LABORATORY EXERCISE: SPECTROSCOPY Goals: To see light dispersed into its constituent colors To study how temperature, light intensity, and light color are
integrating-sphere-construction-kits
 MODULAR INTEGRATING SPHERE CONCEPT Individually configurable integrating spheres - Made simple with the UM construction kit system from Gigahertz-Optik GmbH https://www.gigahertz-optik.de/en-a/products/cat/
Because light behaves like a wave, we can describe it in one of two ways by its wavelength or by its frequency.
 Light We can use different terms to describe light: Color Wavelength Frequency Light is composed of electromagnetic waves that travel through some medium. The properties of the medium determine how light
Process Analytical Technology Diagnosis, Optimization and Monitoring of Chemical Processes
 FRAUNHOFER INSTITUTe FoR Chemical Technology ICT Process Analytical Technology Diagnosis, Optimization and Monitoring of Chemical Processes Process Analytical Technology Diagnosis, Optimization and Monitoring
Science Drivers. Spectroscopic Sensors. In Situ Sensors. Development of autonomous and remote platforms
 Science Drivers In Situ Sensors Spectroscopic Sensors Development of autonomous and remote platforms ROVs, AUVs Cabled observatories Desire to analyze targets with discrete stability regions in the deep
C101-E107B UV Shimadzu UV-VIS-NIR Spectrophotometer
 C101-E107B UV-3600 Shimadzu UV-VIS-NIR Spectrophotometer High sensitivity, high resolution, and an ultra-low stray-light level achieved with the latest technology lead the way to new solutions. UV-3600
Advanced Spectroscopy Laboratory
 Advanced Spectroscopy Laboratory - Raman Spectroscopy - Emission Spectroscopy - Absorption Spectroscopy - Raman Microscopy - Hyperspectral Imaging Spectroscopy FERGIELAB TM Raman Spectroscopy Absorption
Analyzer for Determination of the Composition of Deposits in Nuclear Power Plants
 A Portable Remote Chemical Analyzer for Determination of the Composition of Deposits in Nuclear Power Plants Jack Roberts 1, 1) Symphotic TII Corporation 1 Introduction A large electricity producer identified
Technical Procedure for Glass Refractive Index Measurement System 3 (GRIM 3)
") Technical Procedure for Glass Refractive Index Measurement System 3 (GRIM 3) 1.0 Purpose - This technical procedure shall be followed for the operation of the GRIM 3. 2.0 Scope - This procedure applies
Technical Procedure for Glass Refractive Index Measurement System 3 (GRIM 3) 1.0 Purpose - This technical procedure shall be followed for the operation of the GRIM 3. 2.0 Scope - This procedure applies
CHEM Outline (Part 15) - Luminescence 2013
 - Luminescence 2013") CHEM 524 -- Outline (Part 15) - Luminescence 2013 XI. Molecular Luminescence Spectra (Chapter 15) Kinetic process, competing pathways fluorescence, phosphorescence, non-radiative decay Jablonski diagram
CHEM 524 -- Outline (Part 15) - Luminescence 2013 XI. Molecular Luminescence Spectra (Chapter 15) Kinetic process, competing pathways fluorescence, phosphorescence, non-radiative decay Jablonski diagram
Demonstrating the Value of Data Fusion
 Demonstrating the Value of Data Fusion Thomas I. Dearing 1 Wesley Thompson and Brian Marquardt 1 Carl Rechsteiner Jr. 2 1. Applied Physics Labs, University of Washington 2. Chevron Energy Technology, Richmond
Multi-color broadband visible light source via GaN hexagonal. annular structure
 Multi-color broadband visible light source via GaN hexagonal annular structure Young-Ho Ko 1[+], Jie Song 2, Benjamin Leung 2, Jung Han 2 and Yong-Hoon Cho 1* 1 Department of Physics, Korea Advanced Institute
SPECTROSCOPIC EVIDENCE OF GE POL HPHT-TREATED NATURAL TYPE IIA DIAMONDS
 NOTES AND NEW TECHNIQUES SPECTROSCOPIC EVIDENCE OF GE POL HPHT-TREATED NATURAL TYPE IIA DIAMONDS By David Fisher and Raymond A. Spits Results from spectroscopic analyses of GE POL high-pressure high-temperature
AS 101: Day Lab #2 Summer Spectroscopy
 Spectroscopy Goals To see light dispersed into its constituent colors To study how temperature, light intensity, and light color are related To see spectral lines from different elements in emission and
LIBSlab ANALYZERS ANALYZERS
 ANALYZERS ANALYZERS Chemical multi-elemental analysis with LIBS in modular benchtop design LIBSlab LIBSpector compact sample chamber for the LIBS analysis of solid, liquid and gaseous samples. Sample chamber
LIDAR. Natali Kuzkova Ph.D. seminar February 24, 2015
 LIDAR Natali Kuzkova Ph.D. seminar February 24, 2015 What is LIDAR? Lidar (Light Detection And Ranging) is an optical remote sensing technology that measures distance by illuminating a target with a laser
Optical and THz investigations of mid-ir materials exposed
 Optical and THz investigations of mid-ir materials exposed to alpha particle irradiation Dan Sporea 1*, Laura Mihai 1, Adelina Sporea 1, Ion Vâţã 2 1 National Institute for Laser, Plasma and Radiation
DOWNLOAD OR READ : INFRARED AND RAMAN SPECTROSCOPY CONCEPTS AND APPLICATIONS PDF EBOOK EPUB MOBI
 DOWNLOAD OR READ : INFRARED AND RAMAN SPECTROSCOPY CONCEPTS AND APPLICATIONS PDF EBOOK EPUB MOBI Page 1 Page 2 infrared and raman spectroscopy concepts and applications infrared and raman spectroscopy
Modern Techniques in Applied Molecular Spectroscopy
 Modern Techniques in Applied Molecular Spectroscopy Edited by FRANCIS M. MIRABELLA Equistar Chemicals, LP A Wiley-Interscience Publication JOHN WILEY & SONS, INC. New York Chichester Weinheim Brisbane
Supplementary Information
 Supplementary Information Supplementary Figure 1. fabrication. A schematic of the experimental setup used for graphene Supplementary Figure 2. Emission spectrum of the plasma: Negative peaks indicate an
IntelliCal FAQ Revised 9/27/12
 IntelliCal FAQ Revised 9/27/12 IntelliCal Intelligent spectral calibration routine from Princeton Instruments, available with 64-bit LightField data acquisition software. Q. What is IntelliCal? Figure
Toward Clean Suspended CVD Graphene
 Electronic Supplementary Material (ESI) for RSC Advances. This journal is The Royal Society of Chemistry 2016 Supplemental information for Toward Clean Suspended CVD Graphene Alexander Yulaev 1,2,3, Guangjun
Nouvelles approches de mise en œuvre de la spectroscopie NIR et Raman pour le suivi de la qualité des produits industriels en ligne ou at-line
 Nouvelles approches de mise en œuvre de la spectroscopie NIR et Raman pour le suivi de la qualité des produits industriels en ligne ou at-line INDustrial Analyser Technologies SRS, Raman, UV VIS NIR Dr.F
Introduction to Fourier Transform Infrared Spectroscopy
 molecular spectroscopy Introduction to Fourier Transform Infrared Spectroscopy Part of Thermo Fisher Scientific Introduction What is FT-IR? FT-IR stands for Fourier Transform InfraRed, the preferred method
Applying Energy Levels to Luminescence
 Name: LUMINESCENCE It s Cool Light! Class: Visual Quantum Mechanics ACTIVITY 4 Applying Energy Levels to Luminescence Goal With the help of energy levels diagrams, we have been able to use the spectra
Chem 524 Lecture Notes CD (Section 18) update 2011
 update 2011") Chem 5 Lecture Notes CD (Section 8) update For HTML of 5 notes, click here XV. Circular Dichroism A. Differential absorption of left and right circular polarized light by molecular transition. Measure
Chem 5 Lecture Notes CD (Section 8) update For HTML of 5 notes, click here XV. Circular Dichroism A. Differential absorption of left and right circular polarized light by molecular transition. Measure
Widely Tunable and Intense Mid-Infrared PL Emission from Epitaxial Pb(Sr)Te Quantum Dots in a CdTe Matrix
Te Quantum Dots in a CdTe Matrix") Widely Tunable and Intense Mid-Infrared PL Emission from Epitaxial Pb(Sr)Te Quantum Dots in a Matrix S. Kriechbaumer 1, T. Schwarzl 1, H. Groiss 1, W. Heiss 1, F. Schäffler 1,T. Wojtowicz 2, K. Koike 3,
Widely Tunable and Intense Mid-Infrared PL Emission from Epitaxial Pb(Sr)Te Quantum Dots in a Matrix S. Kriechbaumer 1, T. Schwarzl 1, H. Groiss 1, W. Heiss 1, F. Schäffler 1,T. Wojtowicz 2, K. Koike 3,
Electromagnetic spectra
 Properties of Light Waves, particles and EM spectrum Interaction with matter Absorption Reflection, refraction and scattering Polarization and diffraction Reading foci: pp 175-185, 191-199 not responsible
LabRAM HR Evolution. Research Raman Made Easy!
 LabRAM HR Evolution Research Raman Made Easy! Cutting-Edge Applications with the La LabRAM HR Life sciences Deeply involved in Raman spectroscopy for decades, HORIBA Scientific has been providing an extensive
Spectroscopy. Page 1 of 8 L.Pillay (2012)
") Spectroscopy Electromagnetic radiation is widely used in analytical chemistry. The identification and quantification of samples using electromagnetic radiation (light) is called spectroscopy. Light has
Spectroscopy Electromagnetic radiation is widely used in analytical chemistry. The identification and quantification of samples using electromagnetic radiation (light) is called spectroscopy. Light has
Characterisation & Use of Array Spectrometers
 Characterisation & Use of Array Spectrometers Mike Shaw, Optical Technologies & Scientific Computing Team, National Physical Laboratory, Teddington Middlesex, UK 1 Overview Basic design and features of
1 WHAT IS SPECTROSCOPY?
 1 WHAT IS SPECTROSCOPY? 1.1 The Nature Of Electromagnetic Radiation Anyone who has been sunburnt will know that light packs a punch: in scientific terms, it contains considerable amounts of energy. All
Whole Tablet Measurements Using the Frontier Tablet Autosampler System
 a p p l i c a t i o n N O T E Whole Tablet Measurements Using the Frontier Tablet Autosampler System FT-NIR Spectroscopy Introduction Recent advances in NIR technology have changed the ways in which both
Ultraviolet-Visible and Infrared Spectrophotometry
 Ultraviolet-Visible and Infrared Spectrophotometry Ahmad Aqel Ifseisi Assistant Professor of Analytical Chemistry College of Science, Department of Chemistry King Saud University P.O. Box 2455 Riyadh 11451
Annex E: Laboratory premises
 Aalto University School of Electrical Engineering Metrology Research Institute Tomi Pulli Petri Kärhä Annex E: Laboratory premises Version 1.2 24/11/2017 Annex E: Laboratory premises Page 2 (5) 1. Location
A GEMOLOGICAL STUDY OF A COLLECTION OF
 A GEMOLOGICAL STUDY OF A COLLECTION OF CHAMELEON DIAMONDS Thomas Hainschwang, Dusan Simic, Emmanuel Fritsch, Branko Deljanin, Sharrie Woodring, and Nicholas DelRe Chameleon diamonds are among the rarest
Spectroscopy II Introduction: Spectrophotometry and Fluorometry
 Introduction: Spectrophotometry and Fluorometry In this experiment you will use the SpectroVis Plus (a small computer controlled Spectrophotometer + Fluorometer) to: Measure the Transmission and Absorbance
Application of Raman Spectroscopy for Noninvasive Detection of Target Compounds. Kyung-Min Lee
 Application of Raman Spectroscopy for Noninvasive Detection of Target Compounds Kyung-Min Lee Office of the Texas State Chemist, Texas AgriLife Research January 24, 2012 OTSC Seminar OFFICE OF THE TEXAS
Temperature-dependent spectroscopic analysis of F 2 + ** and F 2 + **-like color centers in LiF
 Journal of Luminescence 91 (2000) 147 153 Temperature-dependent spectroscopic analysis of F 2 + ** and F 2 + **-like color centers in LiF Neil W. Jenkins a, *, Sergey B. Mirov a, Vladimir V. Fedorov b
Lab 11: Must what goes in be the same as what comes out? Spectroscopy & Fluorescence in Chlorophyll.
 Lab 11: Must what goes in be the same as what comes out? Spectroscopy & Fluorescence in Chlorophyll. Introduction to Fluorescence: Fluorescence is one of the possible mechanisms for emission of light by
QuantumMCA QuantumNaI QuantumGe QuantumGold
 QuantumMCA QuantumNaI QuantumGe QuantumGold Berkeley Nucleonics Corporation (San Rafael, CA) and Princeton Gamma Tech (Princeton, NJ) have partnered to offer gamma spectroscopy with either germanium or
Model Answer (Paper code: AR-7112) M. Sc. (Physics) IV Semester Paper I: Laser Physics and Spectroscopy
 M. Sc. (Physics) IV Semester Paper I: Laser Physics and Spectroscopy") Model Answer (Paper code: AR-7112) M. Sc. (Physics) IV Semester Paper I: Laser Physics and Spectroscopy Section I Q1. Answer (i) (b) (ii) (d) (iii) (c) (iv) (c) (v) (a) (vi) (b) (vii) (b) (viii) (a) (ix)
Model Answer (Paper code: AR-7112) M. Sc. (Physics) IV Semester Paper I: Laser Physics and Spectroscopy Section I Q1. Answer (i) (b) (ii) (d) (iii) (c) (iv) (c) (v) (a) (vi) (b) (vii) (b) (viii) (a) (ix)
Snowy Range Instruments
 Snowy Range Instruments Cary 81 2000 W Hg Arc JY U-1000 5 W Ar + Laser DL Solution 852 200 mw SnRI CBEx 785 100 mw What is Raman Spectroscopy? Raman spectroscopy is a form of molecular spectroscopy. It
The Raman Spectroscopy of Graphene and the Determination of Layer Thickness
 Application Note: 52252 The Raman Spectroscopy of Graphene and the Determination of Layer Thickness Mark Wall, Ph.D., Thermo Fisher Scientific, Madison, WI, USA Key Words DXR Raman Microscope 2D Band D
Which Optistat is right for you?
 OPTISTAT Optistat liquid cryogen optical cryostats for spectroscopy Which Optistat is right for you? Our easy to use, compact and efficient Optistat cryostats offer a wide range of options to suit most
Charge transfer effects, thermo- and photochromism in single crystal CVD synthetic diamond
 Charge transfer effects, thermo- and photochromism in single crystal CVD synthetic diamond R U A Khan 1, P M Martineau 1, B L Cann 2, M E Newton 2 and D. J. Twitchen 3 1 Diamond Trading Company, DTC Research
The Future of Spectroscopy
 The Future of Spectroscopy M. Darby Dyar Dept. of Astronomy Mount Holyoke College Senior Scientist Planetary Science Institute The Holy Grail: Accurate Mineralogy Derived from Spectroscopy http://www.movie-roulette.com/photos_big/monty-python-and-the-holy-grail-4-1.jpeg
Optical Properties of Thin Semiconductor Films
 Optical Properties of Thin Semiconductor Films Grolik Benno,KoppJoachim October, 31st 2003 1 Introduction Optical experiments provide a good way of examining the properties of semiconductors. Particulary
Supporting Information for:
 Supporting Information for: High Efficiency Low-Power Upconverting Soft Materials Jae-Hyuk Kim, Fan Deng, Felix N. Castellano,*, and Jae-Hong Kim*, School of Civil and Environmental Engineering, Georgia
Temperature Dependent Optical Band Gap Measurements of III-V films by Low Temperature Photoluminescence Spectroscopy
 Temperature Dependent Optical Band Gap Measurements of III-V films by Low Temperature Photoluminescence Spectroscopy Linda M. Casson, Francis Ndi and Eric Teboul HORIBA Scientific, 3880 Park Avenue, Edison,
Ultraviolet-Visible and Infrared Spectrophotometry
 Ultraviolet-Visible and Infrared Spectrophotometry Ahmad Aqel Ifseisi Assistant Professor of Analytical Chemistry College of Science, Department of Chemistry King Saud University P.O. Box 2455 Riyadh 11451
Supplementary Information
 Electronic Supplementary Material (ESI) for Physical Chemistry Chemical Physics. This journal is the Owner Societies 2015 Supplementary Information Vertical Heterostructures of MoS2 and Graphene Nanoribbons
The luminescence of diamond-i
 Curr. Sci. 19 357-363 (1950) The luminescence of diamond-i SIR C V RAMAN 1. Introduction' No less than seventy-five distinct papers which concerned themselves with the structure and properties of diamond
 Spectral infrared analysis in thermal cameras with diffraction gratings by R. Olbrycht*, B. Więcek* and M. Kałuża* * Lodz Univ. of Technology, Institute of Electronics, Poland, robert.olbrycht@p.lodz.pll
How to measure packaging-induced strain in high-brightness diode lasers?
 How to measure packaging-induced strain in high-brightness diode lasers? Jens W. Tomm Max-Born-Institut für Nichtlineare Optik und Kurzzeitspektroskopie Berlin Max-Born-Str. 2 A, D-12489 Berlin, Germany
Advanced Undergraduate Laboratory Course PHY442/542
 Advanced Undergraduate Laboratory Course PHY442/542 Burcin Bayram Department of Physics Miami University Oxford, Ohio Originally supported by: NSF-ILI, NSF, MU College of Arts and Science, & Department
Photoluminescence Spectrometer (FLS980)
") Photoluminescence Spectrometer (FLS980) Instrument Summary: The Edinburgh Instruments FLS980 photoluminescence spectrometer offers both steady state and time resolved (lifetime) fluorescence spectroscopy
Photoluminescence Spectrometer (FLS980) Instrument Summary: The Edinburgh Instruments FLS980 photoluminescence spectrometer offers both steady state and time resolved (lifetime) fluorescence spectroscopy
Classification of spectroscopic methods
 Introduction Spectroscopy is the study of the interaction between the electromagnetic radiation and the matter. Spectrophotometry is the measurement of these interactions i.e. the measurement of the intensity
Introduction to Fourier Transform Infrared Spectroscopy
 Introduction to Fourier Transform Infrared Spectroscopy Introduction What is FTIR? FTIR stands for Fourier transform infrared, the preferred method of infrared spectroscopy. In infrared spectroscopy, IR
Supplementary Figure 1 Interlayer exciton PL peak position and heterostructure twisting angle. a, Photoluminescence from the interlayer exciton for
 Supplementary Figure 1 Interlayer exciton PL peak position and heterostructure twisting angle. a, Photoluminescence from the interlayer exciton for six WSe 2 -MoSe 2 heterostructures under cw laser excitation
Luminescence transitions. Fluorescence spectroscopy
 Luminescence transitions Fluorescence spectroscopy Advantages: High sensitivity (single molecule detection!) Measuring increment in signal against a dark (zero) background Emission is proportional to excitation
Surface crack detection using infrared thermography and ultraviolet excitation
 Surface crack detection using infrared thermography and ultraviolet excitation * University West, SE-461 86 Trollhättan, Sweden, Anna.Runnemalm@hv.se by A. Runnemalm* and P. Broberg* Abstract High signal
Fourier Transform Infrared. Spectrometry
 Fourier Transform Infrared. Spectrometry Second Editio n PETER R. GRIFFITH S JAMES A. de HASETH PREFACE x v CHAPTER 1 INTRODUCTION TO VIBRATIONAL SPECTROSCOPY 1 1.1. Introduction 1 1.2. Molecular Vibrations
Ch 313 FINAL EXAM OUTLINE Spring 2010
 Ch 313 FINAL EXAM OUTLINE Spring 2010 NOTE: Use this outline at your own risk sometimes a topic is omitted that you are still responsible for. It is meant to be a study aid and is not meant to be a replacement
Mira Metrohm Instant Raman Analyzer. Always ready to measure
 Mira Metrohm Instant Raman Analyzer Always ready to measure Robust and handy materials identification 02 The Metrohm Instant Raman Analyzers (Mira) are handheld, high-performance Raman spectrometers for
High Resolution Photoemission Study of the Spin-Dependent Band Structure of Permalloy and Ni
 High Resolution Photoemission Study of the Spin-Dependent Band Structure of Permalloy and Ni K. N. Altmann, D. Y. Petrovykh, and F. J. Himpsel Department of Physics, University of Wisconsin, Madison, 1150
SWOrRD. For direct detection of specific materials in a complex environment
 SWOrRD For direct detection of specific materials in a complex environment SWOrRD Swept Wavelength Optical resonant Raman Detector RAMAN EFFECT Raman scattering or the Raman effect ( /rɑːmən/) is the inelastic
Signal to Noise Comparison of IS-Instruments Ltd High Throughput OEM Spectrometer and a Czerny Turner Instrument. July 2013
 Signal to Noise Comparison of IS-Instruments Ltd High Throughput OEM Spectrometer and a Czerny Turner Instrument July 2013 EXECUTIVE SUMMARY IS-Instrument s new range of High Étendue Spectrometers (HES)
Supplementary documents
 Supplementary documents Low Threshold Amplified Spontaneous mission from Tin Oxide Quantum Dots: A Instantiation of Dipole Transition Silence Semiconductors Shu Sheng Pan,, Siu Fung Yu, Wen Fei Zhang,
Smart Sensing Embedded Spectroscopy Platform Botlek studiegroep 06-april-2017
 Smart Sensing Embedded Spectroscopy Platform Botlek studiegroep 06-april-2017 W. Karremans Personal introduction Background: Process Analysis DSM AKZO Nobel Chemicals Aspenpharma 2016: Sales Engineer Elscolab
Fourier transform infrared spectroscopy (FTIR) is a method used to obtain an infrared
 is a method used to obtain an infrared") Fourier Transform Infrared Spectroscopy: Low Density Polyethylene, High Density Polyethylene, Polypropylene and Polystyrene Eman Mousa Alhajji North Carolina State University Department of Materials Science
Fourier Transform Infrared Spectroscopy: Low Density Polyethylene, High Density Polyethylene, Polypropylene and Polystyrene Eman Mousa Alhajji North Carolina State University Department of Materials Science
Application of IR Raman Spectroscopy
 Application of IR Raman Spectroscopy 3 IR regions Structure and Functional Group Absorption IR Reflection IR Photoacoustic IR IR Emission Micro 10-1 Mid-IR Mid-IR absorption Samples Placed in cell (salt)
PC Laboratory Raman Spectroscopy
 PC Laboratory Raman Spectroscopy Schedule: Week of September 5-9: Student presentations Week of September 19-23:Student experiments Learning goals: (1) Hands-on experience with setting up a spectrometer.
Laboratory Exercise. Atomic Spectra A Kirchoff Potpourri
 1 Name: Laboratory Exercise Atomic Spectra A Kirchoff Potpourri Purpose: To examine the atomic spectra from several gas filled tubes and understand the importance of spectroscopy to astronomy. Introduction
Supporting Information
 Supporting Information Activating Room Temperature Long Afterglow of Carbon Dots via Covalent Fixation Kai Jiang,, Yuhui Wang, Congzhong Cai, and Hengwei Lin*, Key Laboratory of Graphene Technologies and
Light or the Electromagnetic spectrum.
 Light or the Electromagnetic spectrum www.nasa.gov Diffraction and Light When passed through a prism or grating, light is separated into its component wavelengths This looks like a rainbow in visible light