Department of Chemistry IIT Kharagpur. Biochemical Techniques Laboratory (CY49006)
|
|
|
- Kerry Herbert O’Neal’
- 5 years ago
- Views:
Transcription
1 Department of Chemistry IIT Kharagpur Biochemical Techniques Laboratory (CY49006) Name of the Experiments 1 Agarose Electrophoresis of Food Dyes 2 Protein Structure Analysis 3 Protein Denaturation Studies 4 Enzyme Kinetics and Inhibition Studies 5 Determination of the pi of an Amino Acid
2 Experiment No. 1 Agarose Electrophoresis of Food Dyes Introduction Molecules can be separated by chromatography based on the polarity (hydrophobic or hydrophilic) of the molecule and the polarity of the solvent. Some molecules actually have a net charge or can become charged in a solvent at a specific ph. Molecules with a net charge can be separated in an electric field by a procedure known as electrophoresis. Electrophoresis is a common laboratory technique used for the separation of macromolecules such as proteins, DNA, and RNA. The mobility of a molecule during electrophoresis depends on the net charge of the molecule, the intensity of the electrical field, and how freely the molecule can pass through the pores (sieving action) within the gel matrix. Electrophoresis is nearly always carried out in a gel. Gels serve as molecular sieves that assist the separation of molecules. Molecules with a net positive charge (cationic) will migrate to the negative (black) electrode while molecules with a net negative charge will migrate to the positive (red) electrode. If the voltage drop across the gel is increased (electrical field is strengthened) the molecules will migrate more quickly. Experiment Commercial Food dyes will be provided to you and an unknown sample. You are to determine the components of the unknown sample from the electrophoresis pattern obtained. The experiment will be conducted at two ph values to evaluate the dye characteristics. Procedure Preparation of gel Weigh out 0.50 grams of agarose and add to a 250-mL Erlenmeyer flask (conical flask) containing 25 ml of your assigned buffer. Place the flask containing the undissolved agarose on a hot plate and swirl until the agarose is completely dissolved. Your solution should be clear. Pour the solution into the gel-bed while it is still molten (it will solidify when cooled to about 40 C). Pour the gel to a depth of 3 to 5 mm. While the solution is still molten, place the comb in the middle slot which is used to form wells for loading samples once the gel has set. The comb used in this experiment produces 8 wells. Leave the gel at room temperature for at least 20 minutes to fully gel. During this time set up the electrophoresis unit. Obtain additional buffer, of the same ph, that will be placed in the reservoir of the electrophoresis device.
3 Loading the gel After the gel has cooled, remove the comb from the gel by pulling the comb steadily and slowly straight up from the horizontal gel. Pour enough of the reservoir buffer into the chamber to just cover the gel. There has to be sufficient reservoir buffer that the gel is actually submerged and the sample wells are full of buffer. Use a clean micropipette tip for each dye. Using micropipettes load 15µl of each of the 4 dyes into 4 separate wells formed within the gel. Do not puncture the bottom of the well with your micropipette and inject sample under the gel. Load 15 µl of the unknown mixture into another well. Running the gel 1. Place the plastic safety cover over the electrophoresis apparatus. Attach the electrode wires from the power supply to the electrodes of the reservoir. 2. Turn on the power supply and set the voltage to 150 volts. 3. Allow the electrophoresis to proceed for minutes. 4. Shut the power supply off, remove the electrode wires and inspect the gel without removing it. Decide if you want to let it run longer or not. If not, then remove the gel and rinse it briefly with water. 5. Examine the gel on a white-light box if required. Observation Table: No. Sample Name Mass (amu) Identify unknown Sample ph = ph = Distance R f Charge Charge/ Mass Distance R f Charge Charge/ Mass Results: 1. Study the gel pattern and sketch it. Label the diagram clearly. 2. Determine the relative movement (R f ) of the bands by determining the ratio of the distance of the centre of the band to the total length of the gel. 3. Based on the information about the structure of the known dyes, plot a graph of the R f value vs the charge/mass ratio. From this information determine the charge/mass ratio of the unknown dye.

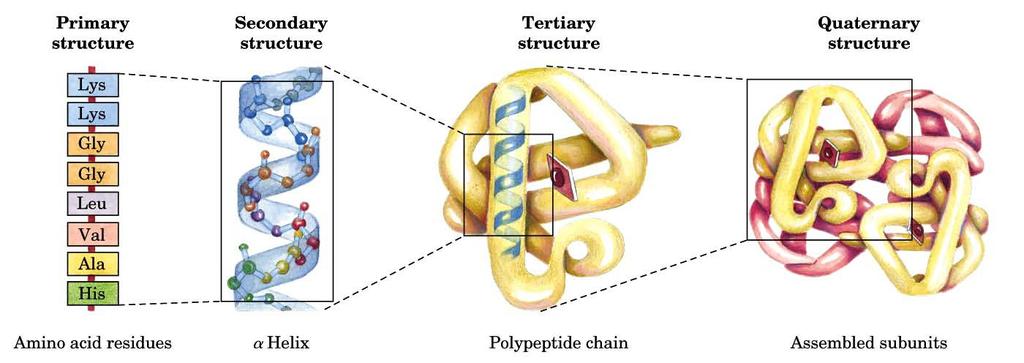
4 Experiment No. 2 Protein Structure Analysis Introduction PyMOL is a powerful molecular visualization package from DeLano Scientific, LLC. PyMOL is increasingly being used for very advanced molecular graphics applications in research laboratories and in the pharmaceutical industry. You will use PyMOL to view molecular structures and to make distance measurements. Display a Molecule PyMOL reads.pdb files, which come from the Protein Data Bank (PDB). These files are used to describe the 3D structure of any molecule, not just proteins but also nucleic acids (like RNA and DNA) and even small molecules. Click on Start to go the Programs menu where you will find PyMOL. Start the program by double clicking on the icon. TWO windows will open up one with a command line prompt and the other a viewer window. PyMOL allows the user to easily manipulate the orientation of the molecule with respect to the viewer. The easiest way is to use the mouse to do this. Move the molecule around to see how the structure rotates in the window. Distance Measurements (To find the distance use the measurement wizard) 1. Access the wizard by clicking on the Wizard menu and then choose the Measurement option. 2. You will be prompted in the upper left corner of the molecule-display region to select the first atom of interest. To select an atom, as shown in the Mouse region of the display, left click on the atom in the molecular display part of the window. When you have successfully selected an atom, a little pink square will appear on that atom. 3. Next choose the second atom. Left-click on another atom in the molecule to complete the measurement. 4. You will see a yellow dashed vector drawn between the two atoms you selected and a measurement in Angstroms drawn above it. The view menu lists the various objects that are displayed at a given time. In our display at present there is only one molecule, so there is just one named object.
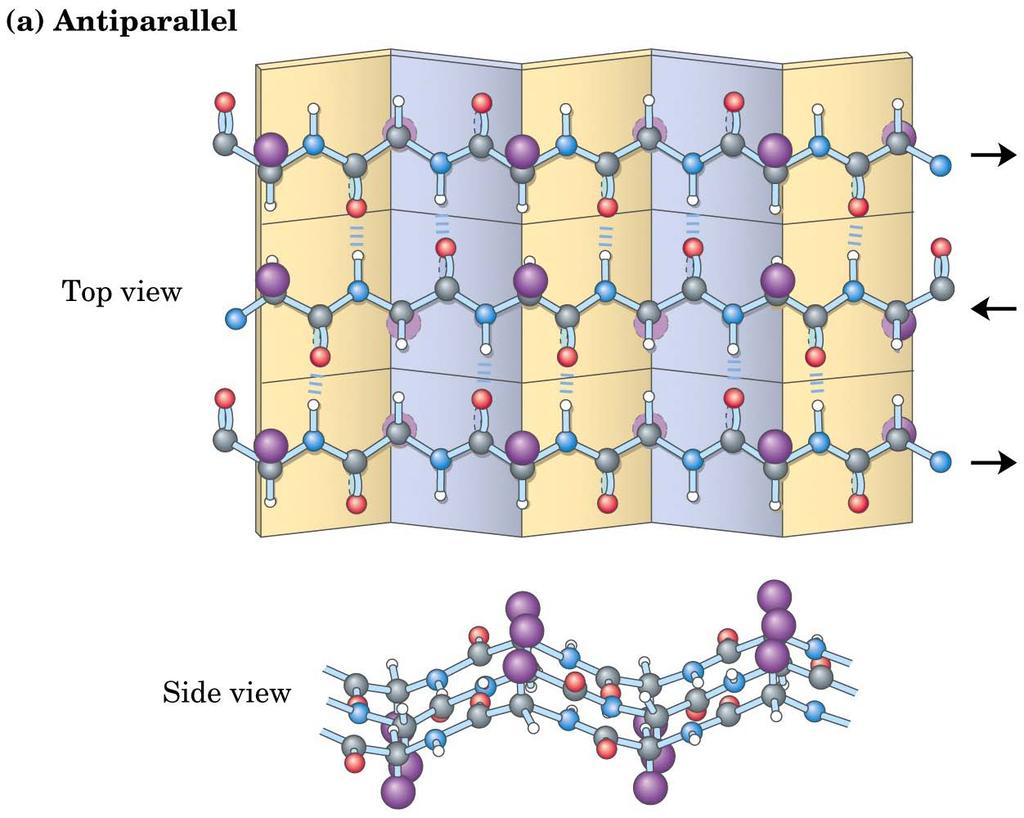
5 The view menu shows five popup menus to the right of each listed object: In order, let's call these the A, S, H, L, and C(rainbow) menus. If you left-click on these and drag down, you will be able to choose various options from the pop-up menu that comes up. The A (Action) menu allows the user to control the view of the molecule. The main option you might use is zoom, which resets the size of the molecule to fit in the display The S (Show) menu shows different modes of viewing a molecule. The lines and spheres options are the ones that we will use at first. The H (Hide) menu hides the different modes. So if you have both lines and spheres modes turned on (using the S menu), clicking H and then selecting one of the modes turns one of them off. The L (Labels) menu controls different ways of labeling the molecule. The C (Color/rainbow) menu chooses different styles of coloring the different elements in the molecule. Procedure: You will be given a protein file (PDB file) e.g.1crn 1. Determine the number of each amino acid type present in the protein and record your results in a table. Calculate the percentage occurrence of each residue type in the protein. To select a specific residue name in the command line - write: Select resn ALA (if you want to select ALA residues only) You can then color them differently to help you count them more easily use the C menu on the right side panel to color it. 2. Identify the helices and sheets present in the protein. Determine the percentage of residues present as helices and sheets and calculate the percentage present as random structure. 3. Calculate the distances from the N-terminus to the C-terminus of each helix and determine the pitch 4. Calculate the distances from the N-terminus to the C-terminus of each strand and determine the average distance between the Cα atoms for each strand 5. Construct a helical wheel of the helices present to determine the amphipathic nature of the helix if present. 6. From the number of aromatic residues present in the protein estimate the extinction coefficient of the protein. Results: Reports all results in tabular form
6 Observation Tables: Table 1 SNo Amino Acid Occurrence in PDB ID Occurrence in PDB ID Std Occurrence # # % (%) Table 2 PDB ID Year of PDB entry Method of str. determination & resolution Total # of Residues # of residues helices sheets # of % of # of % of residues residues residues disulphide links Charge at ph 7 Table 3 PDB ID Helix Start End # of residues Helical length # of turns Pitch Plot: Draw helical wheels for one helix from each PDB Table 4 PDB ID sheets Start End Strand 1 Strand 2 Strand 1 Strand 2 # of residues strand length C - C distance (in pairs) st nd rd 4 th Avg. Directionality ( or anti )
7 Experiment No. 3 Protein Denaturation Studies Disruption of the noncovalent interactions will lead to unfolding of the protein with reversible or irreversible denaturation. It is believed that hydrophobic collapse is a key driving force for protein folding resulting in the formation of a hydrophobic core with the polar surface interacting with the solvent. Fundamental constraints of protein structures, φ and ψ angles dictate possible polypeptide backbone conformations. Both local and nonlocal interactions play a role in protein folding. Apart from these hydrophobic interactions and hydrogen bonding play an important role. Factors that cause denaturation are (i) Temperature and (ii) Denaturants such as acid, urea and Guanidinium Hydrochloride (GuHCl) In this experiment you will follow the effect of urea (up to 8 M) on protein unfolding by viscosity and fluorescence measurements. Unfolding may also follow a two-state mechanism. You will use two different proteins for the two sets of experiments. For viscosity measurements use the viscometer (5ml/10ml) and add the denaturant mix thoroughly and then measure the time taken. Calculate the viscosity by comparing with the viscosity for water. For fluorescence measurements, you need a much smaller volume of sample you will do this experiment with a different protein. The excitation wavelength used will be 295 nm with emission set at 350 nm for Tryptophan residues in proteins. Mix specific proportions of solutions indicated and record your measurements. A sample table is given note that the volumes used are the same in each case (the x and y values will differ based on the experiment being performed)
8 Determine the ΔG for unfolding from the equation: ΔG = -RTlnK = -RTln[(yN -y)/(y-yd)] where K is the equilibrium constant, y is the observed value of the parameter used to follow unfolding, yn and yd are the values of y characteristic of the native and denatured conformations respectively (these are functions of urea concentration: y = a + b[urea]). Plot ΔG as a function of denaturant concentration and extrapolate to 0M urea concentration to determine the ΔG of unfolding in water.
9 Observation Table: No. Protein Sol Denaturant Sol (ml) Vol (ml) Conc (M) 1. 0 (water; for blank reading) 2. x y 0 M 3. x y 1 M x y 2 M Viscosity Fluoresence Y N -Y Y-Y D K=(Y N -Y)/(Y-Y D ) Plots: 1. Viscosity vs Conc. of denaturant 2. vs Conc. of denaturant Result: From ΔG vs denaturant conc. plot extrapolate to 0M conc. the ΔG o of unfolding = of protein in water Concentration of denaturant at f N = f D from plot 1 Concentration of denaturant at f N = f D from plot 2 Slope of the vs Conc. of denaturant plot ΔG o of Protein Denaturation in presence of the denaturant =
10
11 When a slice of apple is exposed to air, it quickly turns brown. This is because the enzyme o- diphenol oxidase catalyzes the oxidation of phenols in the apple to dark-colored products. The V max and the Michaelis-Menten constant (K m ) for this enzyme are to be determined. Procedure: With catechol as the substrate. The enzyme converts it into o-quinone, which is then further oxidized to dark products. when it acts in the presence of a competitive inhibitor when it acts in the presence of a noncompetitive inhibitor Grind up pieces of apple and centrifuge the resulting soup. The supernatant is your enzyme preparation. Because of the speed with which colored products are formed, we can use the intensity of the color as a measure of product formation. No Inhibitor 1. Set up five tubes (Tubes A to D) with different concentrations of catechol (the substrate). 2. Add a fixed amount of enzyme preparation to Tube A and measure the change in absorbance (Optical Density) at 540 nm at 1 minute intervals for several minutes. 3. Record the average change in OD 540 per minute (Δ OD 540 ). Since the OD is directly proportional to the concentration of the products, we can use it as a measure of the rate or velocity of the reaction (V i ). 4. Repeat with the other three tubes. Effect of para-hydroxybenzoic benzoic acid and phenylthiourea Repeat the above procedure adding a fixed amount of a solution of any one of the above compounds to each of the four tubes.
12 Observation Tables: Table 1: Without Inhibitor Volume No. Enzyme Substrate Buffer Total [S] 1/[S] V o 1/V o Table 2: With Inhibitor 1 Volume No. [S] 1/[S] V o 1/V Enzyme Substrate Buffer Total o Table 3: With Inhibitor 2 Volume No. [S] 1/[S] V o 1/V Enzyme Substrate Buffer Total o Plot Lineweaver-Burke plots to determine the kinetic parameters in each case. Plots: 1. Vo vs [S] for all three experiments (in one graph paper) 2. 1/Vo vs 1/[S] for all three experiments (in one graph paper) Results: Condition K M V max Without Inhibitor With Inhibitor 1 With Inhibitor 2 Inhibitor type Explain what you observe. What type of inhibitors are the two compounds?
13
14 Amino acid titration Fill a burette with standard NaOH solution. Rinse and dry the ph electrode and submerge it in the solution containing protonated amino acid. RECORD THE INITIAL ph OF THE SOLUTION. Initiate the ph titration by adding 0.5 ml of NaOH solution, stirring the solution thoroughly, and reading the ph. After each ph reading, record the total added volume of NaOH and the ph. Continue adding NaOH 0.50 ml at a time until the total added volume is about 80% of the total required to titrate the -COOH proton. At this point, add NaOH in smaller increments of first 0.20, then 0.10 ml. Continue adding NaOH incrementally until you are past the -COOH equivalence point (ph is approximately 8 or greater). Go back to adding NaOH 0.5 ml at a time until you have added 80% of the amount required to titrate the -NH 3 + proton. At this point, add smaller increments as above until you are past the equivalence point (ph is approximately 12). Repeat the titration at least once. Method II: Transfer exactly 25 ml of a 0.1 M amino acid solution to a clean, 100ml beaker. Place a thoroughly rinsed teflon-coated stirring bar into the beaker and place the beaker on a magnetic stirrer. Insert the rinsed electrode of the ph meter into the solution and record the starting ph. Obtain ~50 ml of 1 N HCl. With the stirrer turned on, add 0.2 ml HCl using an appropriate pipettor, wait for the ph value to stabilize on the ph meter and record the ph. Again add 0.2 ml HCl while stirring, record the ph and so on. A graph of ph versus milliliters HCl added should be made during the experiment as well as recording the data in tabular form. Continue the titration until the solution reaches a ph of 1.5. Remove the electrode from the solution, wash, and insert it into a beaker of distilled water. Rinse the electrode. Transfer exactly 25 ml of the same amino acid solution into a clean, 100 ml beaker. Place a teflon coated stirring bar into the beaker and place the beaker on the magnetic stirrer. Insert the rinsed electrode of the ph meter into the solution and record the starting ph. Obtain ~50 ml of 1N NaOH. With the stirrer turned on, add 0.2 ml NaOH using an appropriate pipettor, wait for the ph value to stabilize on the ph meter and record the ph. Again add 0.2 ml NaOH while stirring, record the ph and so on. A graph of ph versus milliliters NaOH added should be made during the experiment as well as recording the data in tabular form. Continue the titration until the solution reaches a ph of Remove the electrode from the solution, wash and insert it into a beaker of distilled water. Plot a graph for each case and determine the pi of the amino acid provided.
15 Observation Tables: (A) Amino Acid: Table 1: Method 1 Vol of NaOH ph Vol of NaOH ph Vol of NaOH ph Vol of NaOH ph Table 2: Method 2 Vol of NaOH ph Vol of NaOH ph Vol of HCl ph Vol of HCl ph Vol of HCl ph (B) Amino Acid: Table 3: Method 1 Vol of NaOH ph Vol of NaOH ph Vol of NaOH ph Vol of NaOH ph Table 4: Method 2 Vol of NaOH ph Vol of NaOH ph Vol of HCl ph Vol of HCl ph Vol of HCl ph Plots for each Amino Acid: 1. ph vs Vol of NaOh (Method1) 2. ph/ V vs Vol of NaOH (Method 2) 3. ph vs Vol of HCl and Vol of NaOH (Method 2) Result: Report the pi of the amino acids


16 Appendix Food Dyes Bromocresol green Safranin O Bromophenol blue Crystal Violet Brilliant blue
17 Properties and Conventions Associated with the Standard Amino Acids
18

19

20
21

22


23
Student Guide. bluegel TM Electrophoresis Rainbow Lab. 1. Synopsis
 bluegel TM Electrophoresis Rainbow Lab Student Guide Contents 1. Synopsis p. 1 2. Background p. 2 3. Student laboratory guide p. 7 4. Student data table p. 13 5. Study questions p. 14 1. Synopsis In this
THE DYE/INDICATOR LAB SEPARATION OF MOLECULES USING AGAROSE GEL ELECTROPHORESIS
 THE DYE/INDICATOR LAB SEPARATION OF MOLECULES USING AGAROSE GEL ELECTROPHORESIS OBJECTIVES: YOU WILL BE ABLE TO PERFORM THE FOLLOWING ACTIVITIES. Make and load the wells of an agarose gel. Electrophorese
Soil Cation Analysis Using High-Performance Capillary Zone Electrophoresis Last Modified: October 20, 2006
 Soil Cation Analysis Using High-Performance Capillary Zone Electrophoresis Last Modified: October 20, 2006 Introduction: Capillary electrophoresis (CE) is a relatively new, but rapidly growing separation
Determination of the Equivalent Weight and the K a or K b for a Weak Acid or Base
 INTRODUCTION Determination of the Equivalent Weight and the K a or K b for a Weak Acid or Base Chemists frequently make use of the equivalent weight (eq. wt.) as the basis for volumetric calculations.
Titration of Acids and Bases
 Exercise 3 Page 1 Illinois Central College CHEMISTRY 132 Titration of Acids and Bases Name: Equipment 1-25 ml burette 1-pH electrode 1-50 and 1-150 ml beaker 1-stir plate and stir bar 1-Vernier Interface
Determination of the Equivalent Weight and Ionization Constant of a Weak Acid
 Determination of the Equivalent Weight and Ionization Constant of a Weak Acid Introduction: The object of this experiment will be to determine the ionization constant, K a, and the equivalent weight of
Experimental Procedure
 Experimental Procedure Overview The ph meter is used in conjunction with a titration apparatus and a standardized sodium hydroxide solution to determine the molar concentration of a weak acid solution
Protein separation and characterization
 Address:800 S Wineville Avenue, Ontario, CA 91761,USA Website:www.aladdin-e.com Email USA: tech@aladdin-e.com Email EU: eutech@aladdin-e.com Email Asia Pacific: cntech@aladdin-e.com Protein separation
BSc and MSc Degree Examinations
 Examination Candidate Number: Desk Number: BSc and MSc Degree Examinations 2018-9 Department : BIOLOGY Title of Exam: Molecular Biology and Biochemistry Part I Time Allowed: 1 hour and 30 minutes Marking
1-50 ml beaker stirring rod 1-10 ml beaker 0.10 M NaOH (1 ml) calibrated plastic dropper (1 ml) 50 ml dispensing burette (for Crystal Violet)
 calibrated plastic dropper (1 ml) 50 ml dispensing burette (for Crystal Violet)") Exercise 2 Page 1 Illinois Central College CHEMISTRY 132 Name: Kinetics, Part II. Equipment Objectives. 1-50 ml beaker stirring rod 1-10 ml beaker 0.10 M NaOH (1 ml) calibrated plastic dropper (1 ml) 1.5x10⁻⁵
Exercise 2 Page 1 Illinois Central College CHEMISTRY 132 Name: Kinetics, Part II. Equipment Objectives. 1-50 ml beaker stirring rod 1-10 ml beaker 0.10 M NaOH (1 ml) calibrated plastic dropper (1 ml) 1.5x10⁻⁵
Thermodynamics and the Solubility of Sodium Tetraborate Decahydrate
 Thermodynamics and the Solubility of Sodium Tetraborate Decahydrate In this experiment you, as a class, will determine the solubility of sodium tetraborate decahydrate (Na 2 B 4 O 7 10 H 2 O or Na 2 [B
Conductometric Titration & Gravimetric Determination of a Precipitate
 Conductometric Titration & Gravimetric Determination of a Precipitate Experiment 9 In this experiment, you will monitor conductivity during the reaction between sulfuric acid, H2SO4, and barium hydroxide,
1 st European Union Science Olympiad in Dublin, Ireland. task B
 1 st European Union Science Olympiad in Dublin, Ireland task B Task B The Properties of Proteins Introduction In this task you will investigate some of the properties of proteins. Proteins consist of a
Shown below is a sample titration curve for a diprotic acid. Note the two equivalence points.
 EXPERIMENT 9 Titration Curve for a Polyprotic Acid INTRODUCTION Other than by strength and concentration, another way of classifying acids involves the number of H + ions an acid can donate. A monoprotic
Chemistry 1B Experiment 17 89
 Chemistry 1B Experiment 17 89 17 Thermodynamics of Borax Solubility Introduction In this experiment, you will determine the values of H and S for the reaction which occurs when borax (sodium tetraborate
Molecular Rainbow Dye Electrophoresis Student Materials
 Dye Electrophoresis Student Materials Introduction. 2 Pre-Lab Questions 4 Lab Protocol. 5 Data Collection Worksheet 6 Post-Lab Questions and Analysis.. 7 Last updated: 10/23/2017 Introduction Take just
ph Measurement and its Applications
 ph Measurement and its Applications Objectives: To measure the ph of various solutions using indicators and ph meters. To perform a ph titration. To create and study buffer solutions. To determine the
Biochemistry. Biochemical Techniques. 01 Electrophoresis : Basic Concepts
 Description of Module Subject Name Paper Name 12 Module Name/Title 01 Electrophoresis: Basic Concept 1. Objectives 1.1 To understand basic concept of electrophoresis 1.2 To explain what determines charge
A Study of Beer s Law Prelab
 1. What is the purpose of this experiment? A Study of Beer s Law Prelab 2. Using the absorbance versus wavelength curve given in Figure I, determine the approximate value of max of the dye used to construct
Chromatography Lab # 4
 Chromatography Lab # 4 Chromatography is a method for separating mixtures based on differences in the speed at which they migrate over or through a stationary phase which means that a complex mixture will
iworx Sample Lab Experiment GB-2: Membrane Permeability
 Experiment GB-2: Membrane Permeability Exercise 1: Movement of Small Positive Ions Across a Membrane Aim: To determine if small, positively charged, hydrogen ions can move across a membrane from a region
TITRATION CURVES INTRODUCTION. Read and/or review Sections 4.10 and 16.7 in your textbook.
 1 TITRATION CURVES Copyright: Department of Chemistry, University of Idaho, Moscow, ID 83844-2343. 2013. INTRODUCTION Read and/or review Sections 4.10 and 16.7 in your textbook. In an acid - base titration,
# 12 ph-titration of Strong Acids with Strong Bases
 # 12 ph-titration of Strong Acids with Strong Bases Purpose: A strong acid solution is titrated with a strong base solution. A titration curve is then used to determine the endpoint and find the concentration
POTENTIOMETRIC TITRATIONS & SOLUBILITY EQUILIBRIA
 POTENTIOMETRIC TITRATIONS & SOLUBILITY EQUILIBRIA Introduction In this experiment, students will familiarize themselves with potentiometric titration, practice using the first derivative to find the equivalence
Potentiometric measurement of ph
 Potentiometric measurement of ph Determination of ph can be done by simple colorimetric methods using acid-base indicators (ph test strips). Nevertheless, the precision of such methods is mostly insufficient.
Standardizing a Solution of Sodium Hydroxide. Evaluation copy
 Standardizing a Solution of Sodium Hydroxide Computer 6 It is often necessary to test a solution of unknown concentration with a solution of a known, precise concentration. The process of determining the
Synthesis of Benzoic Acid
 E x p e r i m e n t 5 Synthesis of Benzoic Acid Objectives To use the Grignard reagent in a water free environment. To react the Grignard reagent with dry ice, CO 2(s). To assess the purity of the product
Experiment 7: ACID-BASE TITRATION: STANDARDIZATION OF A SOLUTION
 Experiment 7: ACID-BASE TITRATION: STANDARDIZATION OF A SOLUTION Purpose: Determine molarity of a solution of unknown concentration by performing acid-base titrations Performance Goals: Apply the concepts
SDS-PAGE (Sodium Dodecyl Sulfate Polyacrylamide Gel Electrophoresis):
:") SDS-PAGE (Sodium Dodecyl Sulfate Polyacrylamide Gel Electrophoresis): Aim: SDS-PAGE (Sodium Dodecyl Sulfate Polyacrylamide Gel Electrophoresis) is one of the common methods used in the molecular biology
SDS-PAGE (Sodium Dodecyl Sulfate Polyacrylamide Gel Electrophoresis): Aim: SDS-PAGE (Sodium Dodecyl Sulfate Polyacrylamide Gel Electrophoresis) is one of the common methods used in the molecular biology
Determination of an Equilibrium Constant
 Last updated 1/29/2014 - GES Learning Objectives Students will be able to: Determine the numerical value of an equilibrium constant from measured concentrations of all reaction species. Use an absorption
LABORATORY 2. ENZYME CATALYSIS
 LABORATORY 2 STUDENT GUIDE LABORATORY 2. ENZYME CATALYSIS Objectives In this laboratory, you will observe the role of an enzyme (catalase) in conversion of hydrogen peroxide (H 2 O 2 ) to water and oxygen
Exploration of Protein Folding
 Exploration of Protein Folding Question: What conditions affect the folding of a protein? Pre-lab reading Atkins & Jones (5 th ed.): Sections 5.1 5.5; 9.8 9.9; and Section 19.13 Safety and Waste Disposal
Aspirin Lab By Maya Parks Partner: Ben Seufert 6/5/15, 6/8/15
 Aspirin Lab By Maya Parks Partner: Ben Seufert 6/5/15, 6/8/15 Abstract: This lab was performed to synthesize acetyl salicylic acid or aspirin from a carboxylic acid and an alcohol. We had learned in class
Experimental Procedure. Lab 406
 Experimental Procedure Lab 406 Overview This experiment is to be complete in cooperation with other chemists/chemist groups in the laboratory. In PART A, a standardized solution of hydrochloric acid is
K a Acid Dissociation Constant Minneapolis Community and Technical College Principles of Chemistry II, C1152 v.9.13
 K a Acid Dissociation Constant Minneapolis Community and Technical College Principles of Chemistry II, C1152 v.9.13 I. Introduction Acetic Acid Monoprotic acetic acid, CH 3 COOH is sometimes written as
Ka of Unknown Acid In this experiment you will determine the Ka of an unknown acid by titration with the sodium hydroxide.
 Ka of Unknown Acid In this experiment you will determine the Ka of an unknown acid by titration with the sodium hydroxide. Because you will be titrating an unknown acid again, you will be using many of
POLYPHOSPHORIC ACID ASSAY
 POLYPHOSPHORIC ACID ASSAY Introduction This Technical Information Report describes the sampling technique and method of analysis recommended to perform rapid and reliable polyphosphoric acid assays for
Ka Acid Dissociation Constant Minneapolis Community and Technical College Principles of Chemistry II, C1152 v.1.16
 Ka Acid Dissociation Constant Minneapolis Community and Technical College Principles of Chemistry II, C1152 v.1.16 I. Introduction Monoprotic acetic acid, CH 3 COOH is sometimes written as HCH 3 COO, HC
Pymol Practial Guide
 Pymol Practial Guide Pymol is a powerful visualizor very convenient to work with protein molecules. Its interface may seem complex at first, but you will see that with a little practice is simple and powerful
Determination of the K a of a Weak Acid and the K b of a Weak Base from ph Measurements
 Experiment 6 Determination of the K a of a Weak Acid and the K b of a Weak Base from ph Measurements Pre-Lab Assignment Before coming to lab: Read the lab thoroughly. Answer the pre-lab questions that
LAB 05 Enzyme Action
 LAB 05 Enzyme Action Objectives: Name the substrate and products of the peroxidase-catalyzed reaction. To understand the terms: enzyme, activation energy, active site, ph, and denaturation. Distinguish
Experiment 2: The Beer-Lambert Law for Thiocyanatoiron (III)
") Chem 1B Saddleback College Dr. White 1 Experiment 2: The Beer-Lambert Law for Thiocyanatoiron (III) Objectives To use spectroscopy to relate the absorbance of a colored solution to its concentration. To
Chem 1B Saddleback College Dr. White 1 Experiment 2: The Beer-Lambert Law for Thiocyanatoiron (III) Objectives To use spectroscopy to relate the absorbance of a colored solution to its concentration. To
Enzyme Catalysis Lab
 AP Biology Name: Enzyme Catalysis Lab Objectives In this laboratory, you will observe the role of an enzyme (catalase) in conversion of hydrogen peroxide (H 2 O 2 ) to water and oxygen determine the rate
The Determination of an Equilibrium Constant
 The Determination of an Equilibrium Constant Chemistry 102 10 Chemical reactions occur to reach a state of equilibrium. The equilibrium state can be characterized by quantitatively defining its equilibrium
POTENTIOMETRIC TITRATIONS & SOLUBILITY EQUILIBRIA. Background
 POTENTIOMETRIC TITRATIONS & SOLUBILITY EQUILIBRIA Background In this experiment, students will familiarize themselves with potentiometric titration, practice using the first derivative to find the equivalence
12.01 Determination of the isoelectric point of an amino acid (glycine)
") Biochemistry LEB 12 Determination of the isoelectric point of an amino acid (glycine) What you can learn about Isoelectric point Acidic anions Basic cations Zwitterions Equivalence (inflection) points
Biochemistry LEB 12 Determination of the isoelectric point of an amino acid (glycine) What you can learn about Isoelectric point Acidic anions Basic cations Zwitterions Equivalence (inflection) points
IODINE CLOCK REACTION KINETICS
 Name: Section Chemistry 104 Laboratory University of Massachusetts Boston IODINE CLOCK REACTION KINETICS PRELAB ASSIGNMENT Calculate the initial concentration of H 2 O 2 that exists immediately after mixing
Water Hardness and Softening (Bring a water sample from home) Minneapolis Community and Technical College Principles of Chemistry II, C1152 v.2.
 Minneapolis Community and Technical College Principles of Chemistry II, C1152 v.2.") Water Hardness and Softening (Bring a water sample from home) Minneapolis Community and Technical College Principles of Chemistry II, C1152 v.2.16 I. Introduction Hard Water and Water Softening Water that
Water Hardness and Softening (Bring a water sample from home) Minneapolis Community and Technical College Principles of Chemistry II, C1152 v.2.16 I. Introduction Hard Water and Water Softening Water that
THE IDENTIFICATION OF A SOLID ORGANIC ACID
 THE IDENTIFICATIN F A SLID RGANIC ACID The volumetric procedure called a titration is a powerful tool in analytical chemistry. Not only does the process give the concentration of an unknown solution, but
Experiment 2: The Beer-Lambert Law for Thiocyanatoiron (III)
") Chem 1B Dr. White 11 Experiment 2: The Beer-Lambert Law for Thiocyanatoiron (III) Objectives To use spectroscopy to relate the absorbance of a colored solution to its concentration. To prepare a Beer s
Chem 1B Dr. White 11 Experiment 2: The Beer-Lambert Law for Thiocyanatoiron (III) Objectives To use spectroscopy to relate the absorbance of a colored solution to its concentration. To prepare a Beer s
SYNTHESIS OF AN AZO DYE revisited (1 or 2 credits)
") SYNTHESIS OF AN AZO DYE revisited (1 or 2 credits) This lab you can revisit the fist experiment of this quarter and synthesize more azo dyes of your choice. The old procedure is given below followed by
SYNTHESIS OF AN AZO DYE revisited (1 or 2 credits) This lab you can revisit the fist experiment of this quarter and synthesize more azo dyes of your choice. The old procedure is given below followed by
Acid-Base ph Titration Introduction
 Electronic Supplementary Material (ESI) for Chemistry Education Research and Practice. This journal is The Royal Society of Chemistry 2016 Appendix B: Example of Traditional Investigation Acid-Base ph
Rate Law Determination of the Crystal Violet Reaction. Evaluation copy
 Rate Law Determination of the Crystal Violet Reaction Computer 30 In this experiment, you will observe the reaction between crystal violet and sodium hydroxide. One objective is to study the relationship
The Synthesis and Analysis of Aspirin
 The Synthesis and Analysis of Aspirin Computer 22 Aspirin, the ubiquitous pain reliever, goes by the chemical name acetylsalicylic acid. One of the compounds used in the synthesis of aspirin is salicylic
Table of Contents. Purpose... 2 Background... 2 Prelab Questions... 3 Procedure:... 3 Calculations:... 4
 Table of Contents Purpose... 2 Background... 2 Prelab Questions... 3 Procedure:... 3 Calculations:... 4 CHM 212 Experiment 4 Determination of the Ka of Potassium Hydrogen Phthalate (KHP) Using a Gran Plot
Lab #6: CARBOXYLIC ACIDS LAB
 lab Lab #6: CARBOXYLIC ACIDS LAB Name PART I: Preparation of Carboxylic Acids (a) Oxidation of an Aldehyde by Oxygen from the Air: Benzaldehyde is an aromatic aldehyde with a familiar odor. On a clean,
RATE LAW DETERMINATION OF CRYSTAL VIOLET HYDROXYLATION
 Rate Law Determination of Crystal Violet Hydroxylation Revised 5/22/12 RATE LAW DETERMINATION OF CRYSTAL VIOLET HYDROXYLATION Adapted from "Chemistry with Computers" Vernier Software, Portland OR, 1997
Acid-Base Titration. Evaluation copy
 Acid-Base Titration Computer 7 A titration is a process used to determine the volume of a solution that is needed to react with a given amount of another substance. In this experiment, your goal is to
CHEMICAL SEPARATION EXPERIMENT 2
 CHEMICAL SEPARATION EXPERIMENT 2 INTRODUCTION The term analysis in chemistry usually refer to the quantitative and qualitative determination of the components of a sample. Qualitative refering to the identity
EXPERIMENT 5 ACID-BASE TITRATION
 EXPERIMENT 5 ACID-BASE TITRATION INTRODUCTION Much of chemistry and biology is concerned with the behavior of acids and bases. Acids and bases are participants in many reactions in nature, and many reactions
Chemistry 119: Experiment 4. Titrimetric Determination of Acetic Acid Samples And Preparation of Youden Plot
 Chemistry 119: Experiment 4 Titrimetric Determination of Acetic Acid Samples And Preparation of Youden Plot In this experiment standard sodium hydroxide solution is used to titrimetrically determine acetic
Lab 3: The titration of amino acids
 Chemistry 123 Objective: Lab 3: The titration of amino acids Introduction: Alpha amino acids are the building blocks of proteins. Almost all proteins consist of various combinations of the same 20 amino
C q T q C T. Heat is absorbed by the system H > 0 endothermic Heat is released by the system H < 0 exothermic
 PLEASE REORD ALL DATA DIRETLY INTO YOUR LAB NOTEBOOKS Introduction Heating a substance is one of the simplest processes carried out in the chemical laboratory, and is usually accompanied by a rise in the
Peroxidase Enzyme Lab
 Peroxidase Enzyme Lab An enzyme is a type of protein known as a biological catalyst. A catalyst speeds up chemical reactions by lowering the activation energy required. Enzymes, biological catalysts carry
Experiment#1 Beer s Law: Absorption Spectroscopy of Cobalt(II)
") : Absorption Spectroscopy of Cobalt(II) OBJECTIVES In successfully completing this lab you will: prepare a stock solution using a volumetric flask; use a UV/Visible spectrometer to measure an absorption
: Absorption Spectroscopy of Cobalt(II) OBJECTIVES In successfully completing this lab you will: prepare a stock solution using a volumetric flask; use a UV/Visible spectrometer to measure an absorption
Experimental Procedure. Lab 406
 Experimental Procedure Lab 406 Overview A large number of qualitative tests and observations are performed. The effects that concentration changes and temperature changes have on a system at equilibrium
EXPERIMENT NINE Part I - The Standardization of Thiosulfate Solutions
 EXPERIMENT NINE Part I - The Standardization of Thiosulfate Solutions In general, thiosulfate solutions are standardized by indirect methods, Primary-standard oxidizing agents such as KIO 3, As 2 O 3,
GRIGNARD REACTION Synthesis of Benzoic Acid
 1 GRIGNARD REACTION Synthesis of Benzoic Acid In the 1920 s, the first survey of the acceleration of chemical transformations by ultrasound was published. Since then, many more applications of ultrasound
QuickZyme Hydroxyproline Assay
 QuickZyme Hydroxyproline Assay December 2015 This package insert must be read in its entirety before using this product. FOR RESEARCH USE ONLY. NOT FOR USE IN DIAGNOSTIC PROCEDURES. Introduction Dysregulation
TWO ENZYME CATALYSIS OVERVIEW OBJECTIVES INTRODUCTION
 TWO ENZYME CATALYSS OVERVEW n this lab you will: 1. observe the conversion of hydrogen peroxide (H 2 0 2 ) to water and oxygen gas by the enzyme catalase, and 2. measure the amount of oxygen generated
Chemical Kinetics: Integrated Rate Laws. ** updated Procedure for Spec 200 use **
 Chemical Kinetics: Integrated Rate Laws ** updated Procedure for Spec 200 use ** *DISCLAIMER: It is highly recommended that students bring in their own computers to lab this week to use excel. There may
Viewing and Analyzing Proteins, Ligands and their Complexes 2
 2 Viewing and Analyzing Proteins, Ligands and their Complexes 2 Overview Viewing the accessible surface Analyzing the properties of proteins containing thousands of atoms is best accomplished by representing
Enzyme Catalysis. Objectives
 Name/Group # Student Guide Date AP Biology Laboratory 2 Enzyme Catalysis Observe the action of an enzyme Objectives Determine the rate of an enzyme-catalyzed reaction Study the characteristics of an enzyme-mediated
CH 112 Special Assignment #4 Chemistry to Dye for: Part C
 CH 112 Special Assignment #4 Chemistry to Dye for: Part C PRE-LAB ASSIGNMENT: Make sure that you read this handout and bring the essentials to lab with you. Review Light, energy and color (pp 17-18), Measuring
Ascorbic Acid Titration of Vitamin C Tablets
 Ascorbic Acid Titration of Vitamin C Tablets Part A. Preparation of Vitamin C Tablet Solutions 1. Obtain two vitamin C tablets. Place a plastic weighing boat on the balance, and press zero to tare the
Tex-620-J, Determining Chloride and Sulfate Contents in Soil
 Contents in Soil Contents: Section 1 Overview...2 Section 2 Sample Preparation...3 Section 3 Ion Chromatography Method...5 Section 4 Wet Chemical Method...9 Section 5 Archived Versions...15 Texas Department
Acid-Base Titration Acetic Acid Content of Vinegar
 Acid-Base Titration Acetic Acid Content of Vinegar Prelab Assignment Read the entire lab. Write an objective and any hazards associated with this lab in your laboratory notebook. On a separate sheet of
using simple distillation and paper chromatography practical to obtain a
 2.11 Core practical: Investigate the composition of inks using simple distillation and paper chromatography Paper 1 & 2 Topic 1 What do you need to be able to do? Practical: Description Investigate the
O H 3 O 1 1 A. O 1 1 OH (K w
 CHAPTER 8 Acid Base Titration Curves Objectives The objectives of this experiment are to: Understand the titration curves for the following solutions: a strong acid: hydrochloric acid, HCl. a weak acid:
GETTING THE END POINT TO APPROXIMATE. Two hours
 Chem 1312 Handout Experiment ONE Laboratory Time Required Special Equipment and Supplies Objective Safety First Aid GETTING THE END POINT TO APPROXIMATE THE EQUIVALENCE POINT Two hours Balance Potassium
CHEMISTRY 206 Experiment 4: A KINETIC STUDY
 CHEMISTRY 206 Experiment 4: A KINETIC STUDY Instructor s Informal Preamble Chemists are interested in figuring out how reactions happen (i.e., mechanisms), and how quickly they occur (i.e., rates). Both
EXPERIMENT: LIMITING REAGENT. NOTE: Students should have moles of reactants in DATASHEET converted into masses in grams prior to the lab period.
 Revised 12/2015 EXPERIMENT: LIMITING REAGENT Chem 1104 Lab NOTE: Students should have moles of reactants in DATASHEET converted into masses in grams prior to the lab period. INTRODUCTION Limiting reactant
PreLAD: b. KHP is a monoprotic acid, what are the number of moles of ionizable H + in the approximately 0.25 g of KHP?
 LAD G.1 (pg! 1 of 6! ) What % of vinegar is really acetic acid? Name Per What part of the solution is really HC2H3O2 aka CH3COOH? What is the Ka of acetic acid? Introduction: The acid in vinegar is acetic
INTRODUCTION TO ACIDS, BASES AND TITRATION
 Experiment INTRODUCTION TO ACIDS, BASES AND TITRATION The CCLI Initiative Computers in chemistry Laboratory Instruction LEARNING OBJECTIVES The objectives of this experiment are to... introduce the nature
Titration of a strong acid with a strong base with Cobra4
 Titration of a strong acid with a strong base with Cobra4 TEC Related topics Strong and weak acids and bases, ph value, titration curves, equivalence point, potentiometry. Principle Hydrochloric acid is
Principles of Thin Layer Chromatography
 REVISED & UPDATED Edvo-Kit #113 Principles of Thin Layer Chromatography Experiment Objective: The objective of this experiment is to gain an understanding of the theory and methods of thin layer chromatography.
CHEM 254 EXPERIMENT 5. Solubility and Enthalpy of Fusion of Ammonium Oxalate in Water
 CHEM 254 EXPERIMENT 5 Solubility and Enthalpy of Fusion of Ammonium Oxalate in Water In general solubility (g/100 ml) is defined as amount of substance that dissolved in a given solvent at a given temperature.
Equilibrium and Ionic Strength Effects
 Equilibrium and Ionic Strength Effects Objectives You will determine the thermodynamic equilibrium constant for the reaction between iron(iii) ion and thiocyanate ion to form iron(iii)-thiocyanate. Fe
Thermodynamics Enthalpy of Reaction and Hess s Law
 P.O. Box 219 Batavia, Illinois 60510 1-800-452-1261 flinn@flinnsci.com Visit our website at: www.flinnsci.com 2003 Flinn Scientific, Inc. All Rights Reserved. Your Safer Source for Science Supplies Thermodynamics
To see how this data can be used, follow the titration of hydrofluoric acid against sodium hydroxide:
 Weak Acid Titration v010516 You are encouraged to carefully read the following sections in Tro (3 rd ed.) to prepare for this experiment: Sec 4.8, pp 168-174 (Acid/Base Titrations), Sec 16.4, pp 769-783
Kinetics of Crystal Violet Bleaching
 Kinetics of Crystal Violet Bleaching Authors: V. C. Dew and J. M. McCormick* From Update March 12, 2013 with revisions Nov. 29, 2016 Introduction Chemists are always interested in whether a chemical reaction
Synthesis and Analysis of a Coordination Compound
 Synthesis and Analysis of a Coordination Compound In addition to forming salts with anions, transition metal cations can also associate with neutral molecules (and ions) through a process called ligation.
Chem 2115 Experiment #7. Volumetric Analysis & Consumer Chemistry Standardization of an unknown solution, analysis of vinegar & antacid tablets
 Chem 2115 Experiment #7 Volumetric Analysis & Consumer Chemistry Standardization of an unknown solution, analysis of vinegar & antacid tablets OBJECTIVE: The goals of this experiment are to learn titration
The Thermodynamics of the Solubility of Borax
 Experiment 10 Pre-Lab Assignment Before coming to lab: Read the lab thoroughly. Answer the pre-lab questions that appear at the end of this lab exercise. The questions should be answered on a separate
LS1a Fall 2014 Problem Set #2 Due Monday 10/6 at 6 pm in the drop boxes on the Science Center 2 nd Floor
 LS1a Fall 2014 Problem Set #2 Due Monday 10/6 at 6 pm in the drop boxes on the Science Center 2 nd Floor Note: Adequate space is given for each answer. Questions that require a brief explanation should
Practical 1 Procedure Iron by Titrimetry
 Practical 1 Procedure Iron by Titrimetry Introduction This experiment quantifies Fe 2+, ferrous iron, by reacting it with ceric sulphate in a 1:1 reaction, i.e. one mole of ferrous iron reacts with one
Bomb Calorimetry. Read the lab thoroughly. Answer the pre-lab questions that appear at the end of this lab exercise.
 Experiment 12 Bomb Calorimetry Pre-Lab Assignment Before coming to lab: Read the lab thoroughly. Answer the pre-lab questions that appear at the end of this lab exercise. Purpose A bomb calorimeter will
1iI1E. The Determination of 0 an Equilibrium Constant [LU. Computer
 Computer The Determination of 0 an Equilibrium Constant Chemical reactions occur to reach a state of equilibrium. The equilibrium state can be characterized by quantitatively defining its equilibrium constant,
Experiment 32C APPLICATIONS OF ACID-BASE EQUILIBRIA
 Experiment 32C APPLICATIONS OF ACID-BASE EQUILIBRIA FV 23Feb18 MATERIALS: 50 ml buret (2), 25 ml graduated cylinder (2), 50 ml beaker (2), 150 ml beaker (2), small plastic vials (6), stirring rods (2),
we might also expect the reaction rate to be influenced by ph. In fact, the rate has been reported to follow the rate law:
 KINETICS Objective: The objective of this lab is to measure the rate of iron oxidation, to determine the order of the reaction, and thereby to gain familiarity with rate laws in both the differential and