Binding of transcription factors adapts to resolve information-energy tradeoff
|
|
|
- Randall Hawkins
- 5 years ago
- Views:
Transcription
1 Binding of transcription factors adapts to resolve information-energy tradeoff Yonatan Savir 1,*, Jacob Kagan 2 and Tsvi Tlusty 3,* 1 Department of Systems Biology, Harvard Medical School, Boston, 02115, USA 2 Department of Mathematics, Weizmann Institute of Science, Rehovot 76100, Israel 3 Simons Center for Systems Biology, Institute for Advanced Study, Princeton, New Jersey 08540, USA * Correspondence: tlusty@ias.edu, yonatan_savir@hms.harvard.edu Abstract We examine the binding of transcription factors to DNA in terms of an information transfer problem. The input of the noisy channel is the biophysical signal of a factor bound to a DNA site, and the output is a distribution of probable DNA sequences at this site. This task involves an inherent tradeoff between the information gain and the energetics of the binding interaction high binding energies provide higher information gain but hinder the dynamics of the system as factors are bound too tightly. We show that adaptation of the binding interaction towards increasing information transfer under a general energy constraint implies that the information gain per specific binding energy at each base-pair is maximized. We analyze hundreds of prokaryote and eukaryote transcription factors from various organisms to evaluate the discrimination energies. We find that, in accordance with our theoretical argument, binding energies nearly maximize the information gain per energy. This work suggests the adaptation of information gain as a generic design principle of molecular recognition systems. Keywords: transcription regulation networks, transcription factor, molecular recognition, molecular information channels, protein specificity. 1 Introduction The binding of transcription factors (TFs) to specific DNA sites is essential to the regulation of gene expression [1]. TFs have to cope with the task of recognizing a specific DNA subsequence within long strands, often containing numerous similar subsequences. The main determinant of TF specificity is the sequence-specific DNA binding energy, termed discrimination energy [2, 3]. The proper function of the transcription regulation network requires that the TFs accommodate two conflicting needs: on the one hand, specificity favors high discrimination energies, on the other hand, search time and dynamical flexibility of the network favors low binding energies [4-6]. 1
2 TF specificity is an extensively studied field [7]. Many studies take a biophysical approach by relating the occurrence of a TF on a DNA site to the corresponding binding free energy [2, 3, 8-15]. To estimate the absolute binding probability, one has to also take into account the TF concentration (the chemical potential) [8]. However, this concentration dependence cancels out in relative binding probabilities considered in the present work, where it suffices to evaluate solely the discrimination energy [7]. The discrimination energy is the free energy difference between the main target motif and other, similar DNA motifs. It can be estimated from binding motif statistics under the assumption of an additive discrimination energy, where the contribution of each base pair (bp) is summed independently [2, 16]. The resulting discrimination energy per bp, ε, is in the range of ε 2-4 k B T. [17, 18], which is consistent with experimental results [19]. The particular value of the discrimination energy, ε, raises the question as to whether it is the outcome of biophysical constraints or perhaps of adaptation to improve the performance of the transcription regulation network. Values of ε 2 k B T per bp, in a 15-bp long TF binding site were suggested to achieve both specific and fast recognition [4, 5]. However, besides the search time, there could be other factors which counterbalance the specificity. Recent studies suggest that the dynamics of signaling molecules play a role in regulation [6, 20]. For example, the dynamics of the yeast TF Msn2 can vary between transient increase to pulses, leading to different responses [21]. These types of dynamic control could be hindered if the binding energies are too high. The existence of multiple tradeoffs raises the question of whether the values of discrimination energies are the result of some universal tradeoff or that adaptation is specific to the each case by itself. In this work, we take an alternative information theory approach that is not sensitive to the underlying dynamic control considerations (such as avoiding long search time). We formulate the problem as an optimization problem in which the information regarding the sequence is maximized under a general energy constraint. Then, per given value of overall energy, we derive a simple expression for the discrimination energy that maximizes the information obtained by a binding event. We show that this amounts to maximizing the information gain per discrimination energy for each bp. To test this argument, we evaluate the discrimination energies and target length from the binding motif distribution of hundreds of TFs from prokaryotes and eukaryotes. The analyzed data suggest that the discrimination energies are distributed around this optimal value. 2 Optimal information gain under energy constraint Upon binding to a DNA site, a TF conveys information regarding the sequence identity of that site. In other words, it reduces the uncertainty regarding the bound sequence by sharpening the probability distribution of possible DNA sequences (Fig. 1A). In the following, we quantify the information regarding this DNA sequence gained by the knowledge that it is bound by a TF. In a randomly distributed genome, a TF that recognizes a site of length N bp can in principle bind to any of the 4 N 2
3 possible target sequences. Each possible sequence is specified by a vector s = {s k }, k = 1,, N, where s k is the base at position k. We consider a simple two-state model, where at each position k there is a favored consensus base c k, and any of the three possible mismatches between the bp s k and its consensus c k, incurs an energy cost ε k [2, 5]. The overall binding energy is therefore linear, N E( s ) k ( sk, ck ), (1) k 1 where the zero energy is set at an all-mismatch state and a perfect match yields a discrimination energy E(s = c) = k ε k (in units of k B T). In a random genome, the probability that a bound TF is bound to a sequence s = {s k }, p(s) P(s TF bound) is given by the Boltzmann factor, which decomposes into a product of position probabilities, E ( s) N k ( sk, ck ) e e p( s ) p( sk), p( sk), (2) k Z e 3 k 1 E ( s) k where the partition function is Z e e 3 s k. Prior to binding, the entropy of a random N-bp sequence is H 0 = 2N bits, whereas after binding it is reduced to H b = s p(s) log 2 p(s) bits. The overall information regarding the DNA sequence gained by observing a bound TF is therefore I N H H 2 N p( s) log p( s ) (3) 0 b 2 s By substitution of the probability (2) in the information (3), we find that I N (in bits) is a sum over contributions from each bp, 2 N I 2 N p( s )log p( s ) N k h k s h1 k1 N N N N N 2 N p( sh )log 2 p( sk ) 2 p( sk )log 2 p( sk ) I( k ), k 1 s h1 k 1 sk k 1 (4) where the bp contributions are given by, 1 4 k I( ) 2 p( s )log p( s ) ln. k k ln 2 3 e 13e (5) k k 2 k sk 3
4 As expected, the information vanishes at the limit of small discrimination energies, ε k = 0, since no sequence is favored. At the other extreme of large discrimination energies, ε k, the TF is most likely to bind to the consensus sequence with gained information of 2N bits. The information curve I(ε) (5) takes a sigmoidal shape saturating around ε 7 k B T (Fig. 1B). Transcription factors (TFs) operate in a complex biophysical environment with many opposing demands. The discrimination energy has to be large enough to discern between numerous sequences, as well as to prevent spontaneous detachment from the DNA, and yet, it has to be also small enough to allow dynamic flexibility. Proteins with high binding energy will tend to get trapped along the DNA rendering feedback and control inefficient. The length N of the biding site may also vary and is likely to coevolve with the overall energy E. Such energetic constraints may vary among different species resulting in diverse values of E [17]. Assuming that the total discrimination energy E is governed by external constraints, such as TF concentrations, genome length, regulation network topology and DNA packing, we consider the following optimization problem: Given a constraint over E, what should be the discrimination energy profile ε k, and length N that yield maximal information I N? The optimal profile is found by maximizing the Lagrangian, L = I N λe = k I(ε k ) λ k ε k, with respect to ε k. The solution is given by the condition di(ε k )/dε k = λ. The optimal profile is therefore ε k = ε*, and to find its length N, we maximize I N = N I(E/N) with respect to N (Fig. 1B, 1C). The optimal value ε* maximizes the information gain per energy of each bp, I/ε (Fig 1D), di N d E d I N I 0 0. (6) dn dn N d The solution of (6) is k * 3.35 k T, N* E / *. (7) B The optimal length N* therefore scales linearly with the energy E, and the maximal information gain is I(ε*)/ε* 0.42 bits/k B T. At the optimal configuration, the sequence probability (2) scales exponentially in the number of mismatches m = N k δ(s k,c k ), m * e p( s ). * E / * (8) 1 3e A useful measure for the optimality of information transfer is the information I N per given energy E normalized by its maximum, N * I N ( E) I ( ) / F ( ). I ( E) I ( *) / * (9) 4
5 Thus, the measure to be optimized has a twofold interpretation: maximizing the information under energy constraint is equivalent to optimizing the information per bp per energy (Fig 1D). The simple optimization argument predicts that the measured distributions of discrimination energies will be centered around the peak at F(ε*) = 1. The information gain is close to maximal, F(ε) 90%, in the range ε = k B T peaking at 3.35 k B T. Such a range enables tuning of each bp to accommodate specific biophysical requirements. In the following, this optimality prediction is examined by evaluating the discrimination energy from TF binding statistics. We note that the simplified two-state model we apply disregards possible interactions among the positions of the binding site (linear binding energy, (1)-(2)), which are known to be relevant in inferring the binding of specific TFs [22, 23]. We use this approximation since our aim here is to elucidate the basic information gain mechanism. Nevertheless, our information gain argument can be extended to the general case of non-linear binding energy with corresponding analysis of the binding motifs. 3 Inferring discrimination energies from motif statistics The outcome of an ideal TF binding assay is a list of S sequences where the TF binds. The binding motif is characterized by the frequency matrix, whose entries n kb are the occurrence of nucleotide b at position k. A non-uniform k-th row of the matrix indicates a tendency of the TF to bind specific nucleotides more than others, namely a non-zero discrimination energy ε k. Measurements of direct TF binding such as protein binding microarrays (PBMs) [24] and systematic evolution of ligands by exponential enrichment (SELEX) [25] allow one to infer the biophysical binding parameters [9, 12]. An indirect approach to estimate bp frequency of a binding motif is via bioinformatics methods, which basically align known binding sites with ones from other genomes. While this method is useful in predicting binding sequences, the conservation of binding sites is not directly related to binding energies and mixes biophysical properties with evolutionary dynamics [14, 15]. A non-uniform distribution of binding sites might result from sampling errors, and not from actual discrimination energy. To account for this inherent sampling noise, one has to evaluate the null distribution that yields an observed energy value (Fig 2A, 2B). Figure 2B illustrates how some positions have frequencies that fall within what is expected from a random model. To filter out the effect of noise, we use the KL null distribution, which is in our case the one of evenly distributed base-pairs for a given sample size (Fig 2B, 2C). The average value of the null distribution can be easily calculated without simulations. Thus, for the sake of reproducibility, we use it a basis for our cutoff (Fig 2C). A binding position is considered significant only if its D KL exceeds that of S samples drawn from a random nucleotide distribution [26]. N denotes the number of significant positions, the effective length of the binding site. 5
6 Once the significant positions are determined, the discrimination energies are evaluated. The standard method infers the binding probability p kb p(s k = b) from the n kb matrix using uniform distribution as a Bayesian prior [2], which yields a Dirichlet distribution, Prob( p x ) Di({ n 1},{ x }) x. (10) n kb kb kb kb kb kb b A, C, G, T The resulting expected binding probabilities are Ep kb = (n kb + 1)/ c (n kc + 1) = (n kb + 1)/(S + 4), which amounts to adding a pseudo count to all entries of the occurrence matrix, n kb n kb + 1. While a common estimator of the discrimination energies is the logarithm of the expected probability, ε kb = ln Ep kb [2, 3, 7, 17], a better estimator is the expected logarithm of the probability, E ln p ( n 1) ( S 4), (11) kb kb kb where ψ is the digamma function. At each position k, the average discrimination energy ε k is estimated by the average difference between the maximal ε kb and the three other values, 1 3 max( ). (12) k kb kc c The total discrimination energy, E, is given by summing over all significant positions, E = k ε k. It is noteworthy that the sample size S may significantly bias the data. The maximal discrimination energy is obtained when all sequences exhibit the same consensus, n kb = S. The resulting estimator for the discrimination energy (11) is bounded by the sample size, ( S ) ( S 1) (1) H ( S ), (13) max where H(S) is the harmonic number. Similarly, the log-likelihood bound is ε max (S) = ln(s + 1). Figures 2E and 2F demonstrate how analyzing databases with small sample size may bias the energy estimates. For example, the data from Harbison et al. [27] exhibit energies in the vicinity of the sampling bound, thereby strongly biasing the distribution (Fig 2E). In contrast, the RegulonDB database [28] shows a general trend independent of sampling size (Fig 2F). Hence, to eliminate any potential bias due to small samples, we employ a conservative approach: we first remove all the energies whose error bars exceed the bound ε max (S). Then, we set a cutoff to eliminate data points with low sampling. 4 Specific binding energies are nearly optimal In this study, we analyzed studies of direct TF binding measurements (Fig. 3) and databases that are based on bioinformatics (Fig.4). Figure 3 shows the results from protein binding microarrays (PBMs) 6
7 [29-34] and a HT-SELEX human TF study, [30]. Figure 4 shows an analysis of TF specificities databases, a eukaryotic database, [35], and two bacterial prokaryote databases [28, 36]. Taking into account the sampling limitations, we inferred the discrimination energies ε k for a few hundred TFs from several databases in different organisms. Figure 5 shows that the results of Figures 3 and 4 are practically insensitive to the cutoff choice for significant positions. Moreover, it demonstrates that, beyond the average energy, the whole distribution of energies of a single protein also tends to fall within the optimal regime. We find that the discrimination energies are distributed around the optimal value ε* 3.35 k B T expected from maximizing the information gain I/ε (7). In accord, we find that the overall discrimination energy E scales linearly with target length N. In other words, the discrimination energy per bp, ε = E/N, is roughly the same for all TFs of a given species regardless of their target length (Fig. 3, Fig 5). The ε-distributions are well within the optimal regime where the information gain is more the 80% of its maximal value, I(ε*)/ε* 0.42 bits/k B T. The data reveals a difference between prokaryotes and eukaryotes: the discrimination energies of prokaryotes tend to be lower than those of eukaryotes. These results place the prokaryotes on the less specific side of the tradeoff, whereas the eukaryotes tend to gain more information at an energetic cost. 5 Discussion Transcription factors (TFs), as well as other DNA-binding proteins, operate in a complex environment under many conflicting constraints, such as rate vs. specificity or accuracy vs. efficiency [37-40]. In general, the discrimination energy E has to be large enough to discern between various sequences and to avoid early unbinding from the DNA, and yet small enough to prevent jamming of binding sites. These constraints depend on many factors, such as TF concentration, genome size and packing, cell state, the architecture of the regulation network, TF cooperativity etc. Here, we presented an information theory approach, which reconciles these conflicting tasks by assuming hierarchal adaptation: The overall discrimination energy E is determined by the performance constraints mentioned above. Once E is determined, it is partitioned among the DNA bps such that the overall information gained I N is maximal. We showed that this is equivalent to maximizing the local information gain per discrimination energy I/ε by setting the local discrimination energy ε around an optimal value ε* 3.35 k B T. This simple argument is consistent with detailed analysis of hundreds of TFs from prokaryotes and eukaryotes. The observation of a variance in the distribution of ε values around ~3 k B T, suggests that they are not the outcome of physical limitations but rather of adaptation. Given that the total discrimination energy is constrained, we show that in order to maximize the information I N, all species should have similar discrimination energy per bp. This of course is a coarse grained approximation, which disregards many relevant details of the transcription regulation system. For example, global TFs are designed 7
8 to bind to many different DNA sites, and TF specificity may be enhanced by cooperativity. There are also error correction and proofreading mechanisms that compensate for potential binding errors. On the other hand, high binding energy could have negative outcomes. For example, high binding energies generally require larger binding molecules and larger DNA sites, which are both costly to produce and maintain. As a result, we find that the information gain per energy I/ε is a relevant measure for the TF performance. Previous estimates of the discrimination energies in the range of ε 2-3 k B T per bp [17] are consistent with our analysis. However, the present study differs in two major points: we have not used motifs whose energies are severely biased due to small sample size, and we have filtered out insignificant positions in the binding sequence which exhibit random bp statistics. While previous work discussed the tradeoff between specificity and search time [5], in the present study we discuss a general scenario in which the overall binding energy is constrained, without specifying the concrete mechanism for this limitation, such as increased search time. Our work thus provides a design principle for understating the shaping of discrimination energy profiles of other sequence-binding proteins in nature and in artificial settings. Figure Legends Figure 1. Information gain under energy constraints. (A) Once a transcription factor is bound to the DNA, it reduces the uncertainty regarding the sequence that it is bound to. The information per bp on the bound sequence I, given that the protein is bound, depends on the discrimination energy per bp, ε (Eq. (5)). When ε = 0, binding is random and the information vanishes. At the other extreme of high ε, I approaches 2 bits, as there are 4 possible bases. (B) The total information I N as a function of the total discrimination energy E and the number of sequence positions N is color coded. Since high energy could have negative consequences, we consider the optimal information gain under a given energy constraint (dashes lines). The sequence length that provides maximal information I N per given energy N*(E) is denoted by the black solid line. (C) Cross sections of constant energy from (B) as a function of ε = E/N exhibit a maximum at the same value ε* 3.35 k B T. (D) The normalized cross sections of information gain at constant energy collapse onto the same curve, which is the normalized information gain per bp per energy I/ε. Figure 2 Inferring discrimination energies. (A) The Kullback-Leibler (KL) distance of the human factor ELK1 nucleotide distribution relative to a random distribution. The discrimination energy ε the energy loss due to deviation from the most frequent nucleotide is evaluated from the frequency of nucleotides in the different positions (Eq. (12)). (B) In some positions, non-zero energy may be an 8
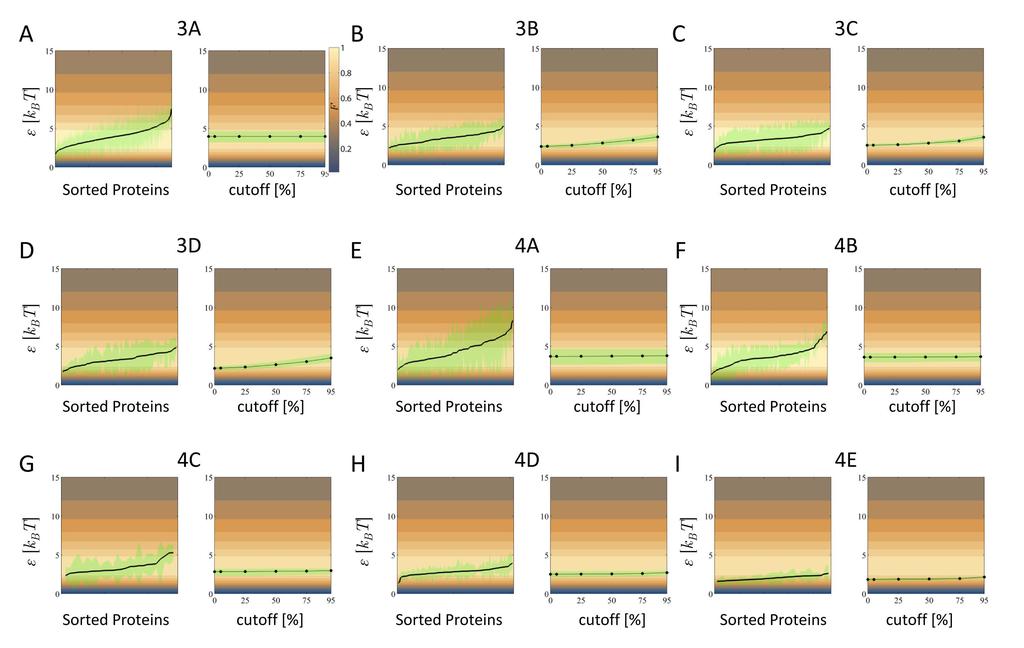
9 artifact of sampling error and not of actual binding. The red histogram is the distribution of the KLdistance, D KL, of equally distributed bases given the sample size, while the black histogram is the D KL distribution of the protein. Some positions fall within the noise distribution. (C) The dependence of the D KL values of 50% (blue circles), 75% (orange circles) and 95% (green circles) percentile of the noise distribution as a function of sample size. The red line is the twice the average of the noise distribution (the red horizontal line on 2A). We consider only significant positions with D KL above twice the average D KL of a binding motif with random distribution and the same sample size (red horizontal line). In the case of ELK1, the first three positions are insignificant. (D) The dependence of the average ε on the cutoff for significant positions. (E) Distribution of discrimination energies ε (left) and their dependence on the number of samples S (right), for a data from Harbison et al.[27]. In this dataset, all the TFs have S = 20 samples and maximal observable value is ε max (S) 3.6 k B T (left, red vertical line). The distribution is truncated at ε max (S), and is therefore biased towards lower ε values. (F) Analysis of a dataset from the ReguolonDB database [41] samples. The red line denotes the maximal inferred value of the ε max (S) (13). To avoid bias due to low sampling that results in truncation of the discrimination energy, we consider only TFs with large enough samples (red points). Figure 3: The distribution of average discrimination energy per base-pair based on direct TF measurements. Each panel depicts the distribution of discrimination energies, ε (left, blue) overlaid with the normalized information per energy per base-pair, F(ε). The red circles denote the range of standard deviation of the ε distribution. The right panel shows the total discrimination energy E and the sequence length N overlaid on the color coded contour plot of F(ε). (A) Human HT-SELEX measurements from Jolma et al., S >100 [30] (B) PBM measurements for mouse TFs from Badis et al. [32]. (C) PBM measurements for mouse TFs from Berger et al. [34] (D) PBM measurements for yeast TFs from Zhu et al [42]. For the PBM data we have used S = 28. Figure 4: The distribution of average discrimination energy per base-pair from computational databases. Each panel depicts the distribution of discrimination energies, ε (left, blue) overlaid with the normalized information per energy per base-pair, F(ε). The red circles denote the range of standard deviation of the ε distribution. The right panel shows the total discrimination energy, E and the sequence length N overlaid on the color coded contour plot of F(ε). (A) (C) TFs from the JASPAR database, S >100 [35] (D) TFs from the RegTransBase database, S >10 [36] (E) TFs from the RegulonDB database, S >10 [41]. Figure 5: Variation of base-pair energy and the dependence of the average ε on the significant position cutoff. Each panel relates to data presented in Figures 3 and 4, as denoted by its title. In the left hand side, the proteins are sorted according to their average ε (black line). For each protein, each base-pair may have a different value of ε. The green shaded area covers the values of the distribution which are within the 25%-75% percentile (as in standard box-plot). The right hand side shows the 9
10 dependence of the average ε values on the cutoff for significant positions (black line). The green shaded area covers the protein distribution around the average. (Note that on the left hand side the average is over base-pairs per protein, whereas on the right hand side, the average is over proteins per cutoff) (A) Human HT-SELEX measurements from Jolma et al., S >100 [30] (B) PBM measurements for mouse TFs from Badis et al. [32]. (C) PBM measurements for mouse TFs from Berger et al. [34] (D) PBM measurements for yeast TFs from Zhu et al. [42] (E) (G) TFs from the JASPAR database, S >100 [35] (H) TFs from the RegTransBase database, S >10 [36] (I) TFs from the RegulonDB database, S >10 [41]. References 1. Spitz, F. and E.E. Furlong, Transcription factors: from enhancer binding to developmental control. Nature Reviews Genetics, (9): p Berg, O.G. and P.H. von Hippel, Selection of DNA binding sites by regulatory proteins: Statistical-mechanical theory and application to operators and promoters. Journal of molecular biology, (4): p Stormo, G.D. and D.S. Fields, Specificity, free energy and information content in protein DNA interactions. Trends in biochemical sciences, (3): p Lassig, M., From biophysics to evolutionary genetics: statistical aspects of gene regulation. BMC Bioinformatics, Suppl 6: p. S7. 5. Gerland, U., J.D. Moroz, and T. Hwa, Physical constraints and functional characteristics of transcription factor DNA interaction. Proceedings of the National Academy of Sciences, (19): p Purvis, J.E. and G. Lahav, Encoding and decoding cellular information through signaling dynamics. Cell, (5): p Stormo, G.D., Modeling the specificity of protein-dna interactions. Quantitative Biology, (2): p Djordjevic, M., A.M. Sengupta, and B.I. Shraiman, A biophysical approach to transcription factor binding site discovery. Genome research, (11): p Foat, B.C., A.V. Morozov, and H.J. Bussemaker, Statistical mechanical modeling of genomewide transcription factor occupancy data by MatrixREDUCE. Bioinformatics, (14): p. e141-e von Hippel, P.H., On the molecular bases of the specificity of interaction of transcriptional proteins with genome DNA, in Biological regulation and development. 1979, Springer. p Von Hippel, P.H. and O.G. Berg, On the specificity of DNA-protein interactions. Proceedings of the National Academy of Sciences, (6): p Kinney, J.B., G. Tkačik, and C.G. Callan, Precise physical models of protein DNA interaction from high-throughput data. Proceedings of the National Academy of Sciences, (2): p Kinney, J.B., et al., Using deep sequencing to characterize the biophysical mechanism of a transcriptional regulatory sequence. Proceedings of the National Academy of Sciences, (20): p Mustonen, V. and M. Lässig, Evolutionary population genetics of promoters: predicting binding sites and functional phylogenies. Proceedings of the National Academy of Sciences of the United States of America, (44): p Mustonen, V., et al., Energy-dependent fitness: a quantitative model for the evolution of yeast transcription factor binding sites. Proceedings of the National Academy of Sciences, (34): p
11 16. Benos, P.V., M.L. Bulyk, and G.D. Stormo, Additivity in protein-dna interactions: how good an approximation is it? Nucleic Acids Res, (20): p Wunderlich, Z. and L.A. Mirny, Different gene regulation strategies revealed by analysis of binding motifs. Trends Genet, (10): p Zhao, Y., D. Granas, and G.D. Stormo, Inferring binding energies from selected binding sites. PLoS computational biology, (12): p. e Maerkl, S.J. and S.R. Quake, A systems approach to measuring the binding energy landscapes of transcription factors. Science, (5809): p Behar, M. and A. Hoffmann, Understanding the temporal codes of intra-cellular signals. Current opinion in genetics & development, (6): p Hao, N. and E.K. O'Shea, Signal-dependent dynamics of transcription factor translocation controls gene expression. Nature structural & molecular biology, (1): p Santolini, M., T. Mora, and V. Hakim, A general pairwise interaction model provides an accurate description of in vivo transcription factor binding sites. PloS one, (6): p. e Zhao, Y., et al., Improved models for transcription factor binding site identification using nonindependent interactions. Genetics, (3): p Mukherjee, S., et al., Rapid analysis of the DNA-binding specificities of transcription factors with DNA microarrays. Nature genetics, (12): p Tuerk, C. and L. Gold, Systematic evolution of ligands by exponential enrichment: RNA ligands to bacteriophage T4 DNA polymerase. Science, (4968): p Schneider, T.D., et al., Information content of binding sites on nucleotide sequences. J Mol Biol, (3): p Harbison, C.T., et al., Transcriptional regulatory code of a eukaryotic genome. Nature, (7004): p Gama-Castro, S., et al., RegulonDB (version 6.0): gene regulation model of Escherichia coli K-12 beyond transcription, active (experimental) annotated promoters and Textpresso navigation. Nucleic acids research, (suppl 1): p. D120-D Weirauch, M.T., et al., Determination and inference of eukaryotic transcription factor sequence specificity. Cell, (6): p Jolma, A., et al., DNA-binding specificities of human transcription factors. Cell, (1): p Grove, C.A., et al., A multiparameter network reveals extensive divergence between C. elegans bhlh transcription factors. Cell, (2): p Badis, G., et al., Diversity and complexity in DNA recognition by transcription factors. Science, (5935): p Noyes, M.B., et al., Analysis of homeodomain specificities allows the family-wide prediction of preferred recognition sites. Cell, (7): p Berger, M.F., et al., Variation in homeodomain DNA binding revealed by high-resolution analysis of sequence preferences. Cell, (7): p Mathelier, A., et al., JASPAR 2014: an extensively expanded and updated open-access database of transcription factor binding profiles. Nucleic acids research, 2013: p. gkt Cipriano, M.J., et al., RegTransBase a database of regulatory sequences and interactions based on literature: a resource for investigating transcriptional regulation in prokaryotes. BMC genomics, (1): p Savir, Y., et al., Balancing speed and accuracy of polyclonal T cell activation: a role for extracellular feedback. BMC Syst Biol, : p Savir, Y. and T. Tlusty, The Ribosome as an Optimal Decoder: A Lesson in Molecular Recognition. Cell, (2): p Savir, Y. and T. Tlusty, RecA-mediated homology search as a nearly optimal signal detection system. Mol Cell, (3): p Savir, Y., et al., Cross-species analysis traces adaptation of Rubisco toward optimality in a low-dimensional landscape. Proc Natl Acad Sci U S A, (8): p
12 41. Salgado, H., et al., RegulonDB v8. 0: omics data sets, evolutionary conservation, regulatory phrases, cross-validated gold standards and more. Nucleic acids research, (D1): p. D203-D Zhu, C., et al., High-resolution DNA-binding specificity analysis of yeast transcription factors. Genome research, (4): p
13
14

15

16
17
Graph Alignment and Biological Networks
 Graph Alignment and Biological Networks Johannes Berg http://www.uni-koeln.de/ berg Institute for Theoretical Physics University of Cologne Germany p.1/12 Networks in molecular biology New large-scale
Different gene regulation strategies revealed by analysis of binding motifs
 Different gene regulation strategies revealed by analysis of binding motifs The MIT Faculty has made this article openly available. Please share how this access benefits you. Your story matters. Citation
L3.1: Circuits: Introduction to Transcription Networks. Cellular Design Principles Prof. Jenna Rickus
 L3.1: Circuits: Introduction to Transcription Networks Cellular Design Principles Prof. Jenna Rickus In this lecture Cognitive problem of the Cell Introduce transcription networks Key processing network
Gene regulation: From biophysics to evolutionary genetics
 Gene regulation: From biophysics to evolutionary genetics Michael Lässig Institute for Theoretical Physics University of Cologne Thanks Ville Mustonen Johannes Berg Stana Willmann Curt Callan (Princeton)
Measuring TF-DNA interactions
 Measuring TF-DNA interactions How is Biological Complexity Achieved? Mediated by Transcription Factors (TFs) 2 Regulation of Gene Expression by Transcription Factors TF trans-acting factors TF TF TF TF
Why transcription factor binding sites are ten nucleotides long
 Genetics: Published Articles Ahead of Print, published on August 10, 2012 as 10.1534/genetics.112.143370 Why transcription factor binding sites are ten nucleotides long Alexander J. Stewart, Joshua B.
Supporting Information
 Supporting Information Weghorn and Lässig 10.1073/pnas.1210887110 SI Text Null Distributions of Nucleosome Affinity and of Regulatory Site Content. Our inference of selection is based on a comparison of
Fundamentally different strategies for transcriptional regulation are revealed by information-theoretical analysis of binding motifs
 Fundamentally different strategies for transcriptional regulation are revealed by information-theoretical analysis of binding motifs Zeba Wunderlich 1* and Leonid A. Mirny 1,2 1 Biophysics Program, Harvard
Different gene regulation strategies revealed by analysis of binding motifs
 Acknowledgements We thank members of the Zhang laboratory and three anonymous reviewers for valuable comments. This work was supported by research grants from the National Institutes of Health to J.Z.
Modeling Motifs Collecting Data (Measuring and Modeling Specificity of Protein-DNA Interactions)
") Modeling Motifs Collecting Data (Measuring and Modeling Specificity of Protein-DNA Interactions) Computational Genomics Course Cold Spring Harbor Labs Oct 31, 2016 Gary D. Stormo Department of Genetics
Modeling Motifs Collecting Data (Measuring and Modeling Specificity of Protein-DNA Interactions) Computational Genomics Course Cold Spring Harbor Labs Oct 31, 2016 Gary D. Stormo Department of Genetics
Discovering MultipleLevels of Regulatory Networks
 Discovering MultipleLevels of Regulatory Networks IAS EXTENDED WORKSHOP ON GENOMES, CELLS, AND MATHEMATICS Hong Kong, July 25, 2018 Gary D. Stormo Department of Genetics Outline of the talk 1. Transcriptional
Bioinformatics Chapter 1. Introduction
 Bioinformatics Chapter 1. Introduction Outline! Biological Data in Digital Symbol Sequences! Genomes Diversity, Size, and Structure! Proteins and Proteomes! On the Information Content of Biological Sequences!
Bi 8 Lecture 11. Quantitative aspects of transcription factor binding and gene regulatory circuit design. Ellen Rothenberg 9 February 2016
 Bi 8 Lecture 11 Quantitative aspects of transcription factor binding and gene regulatory circuit design Ellen Rothenberg 9 February 2016 Major take-home messages from λ phage system that apply to many
Introduction to Bioinformatics
 CSCI8980: Applied Machine Learning in Computational Biology Introduction to Bioinformatics Rui Kuang Department of Computer Science and Engineering University of Minnesota kuang@cs.umn.edu History of Bioinformatics
With rapid advances in the sequencing and annotation of entire
 Physical constraints and functional characteristics of transcription factor DNA interaction Ulrich Gerland, J. David Moroz, and Terence Hwa Department of Physics, University of California at San Diego,
RIBOSOME: THE ENGINE OF THE LIVING VON NEUMANN S CONSTRUCTOR
 RIBOSOME: THE ENGINE OF THE LIVING VON NEUMANN S CONSTRUCTOR IAS 2012 Von Neumann s universal constructor Self-reproducing machine: constructor + tape (1948/9). Program on tape: (i) retrieve parts from
Gibbs Sampling Methods for Multiple Sequence Alignment
 Gibbs Sampling Methods for Multiple Sequence Alignment Scott C. Schmidler 1 Jun S. Liu 2 1 Section on Medical Informatics and 2 Department of Statistics Stanford University 11/17/99 1 Outline Statistical
A genomic-scale search for regulatory binding sites in the integration host factor regulon of Escherichia coli K12
 The integration host factor regulon of E. coli K12 genome 783 A genomic-scale search for regulatory binding sites in the integration host factor regulon of Escherichia coli K12 M. Trindade dos Santos and
Simulation of the Evolution of Information Content in Transcription Factor Binding Sites Using a Parallelized Genetic Algorithm
 Simulation of the Evolution of Information Content in Transcription Factor Binding Sites Using a Parallelized Genetic Algorithm Joseph Cornish*, Robert Forder**, Ivan Erill*, Matthias K. Gobbert** *Department
Position-specific scoring matrices (PSSM)
") Regulatory Sequence nalysis Position-specific scoring matrices (PSSM) Jacques van Helden Jacques.van-Helden@univ-amu.fr Université d ix-marseille, France Technological dvances for Genomics and Clinics
Regulatory Sequence nalysis Position-specific scoring matrices (PSSM) Jacques van Helden Jacques.van-Helden@univ-amu.fr Université d ix-marseille, France Technological dvances for Genomics and Clinics
Optimal Design of a Molecular Recognizer: Molecular Recognition as a Bayesian Signal Detection Problem Yonatan Savir and Tsvi Tlusty
 390 IEEE JOURNAL OF SELECTED TOPICS IN SIGNAL PROCESSING, VOL. 2, NO. 3, JUNE 2008 Optimal Design of a Molecular Recognizer: Molecular Recognition as a Bayesian Signal Detection Problem Yonatan Savir and
INTERACTIVE CLUSTERING FOR EXPLORATION OF GENOMIC DATA
 INTERACTIVE CLUSTERING FOR EXPLORATION OF GENOMIC DATA XIUFENG WAN xw6@cs.msstate.edu Department of Computer Science Box 9637 JOHN A. BOYLE jab@ra.msstate.edu Department of Biochemistry and Molecular Biology
Computational Biology: Basics & Interesting Problems
 Computational Biology: Basics & Interesting Problems Summary Sources of information Biological concepts: structure & terminology Sequencing Gene finding Protein structure prediction Sources of information
Genomic Arrangement of Regulons in Bacterial Genomes
 l Genomes Han Zhang 1,2., Yanbin Yin 1,3., Victor Olman 1, Ying Xu 1,3,4 * 1 Computational Systems Biology Laboratory, Department of Biochemistry and Molecular Biology and Institute of Bioinformatics,
Introduction to Bioinformatics
 Systems biology Introduction to Bioinformatics Systems biology: modeling biological p Study of whole biological systems p Wholeness : Organization of dynamic interactions Different behaviour of the individual
Inferring Protein-Signaling Networks
 Inferring Protein-Signaling Networks Lectures 14 Nov 14, 2011 CSE 527 Computational Biology, Fall 2011 Instructor: Su-In Lee TA: Christopher Miles Monday & Wednesday 12:00-1:20 Johnson Hall (JHN) 022 1
Lecture 8: Temporal programs and the global structure of transcription networks. Chap 5 of Alon. 5.1 Introduction
 Lecture 8: Temporal programs and the global structure of transcription networks Chap 5 of Alon 5. Introduction We will see in this chapter that sensory transcription networks are largely made of just four
Dynamic optimisation identifies optimal programs for pathway regulation in prokaryotes. - Supplementary Information -
 Dynamic optimisation identifies optimal programs for pathway regulation in prokaryotes - Supplementary Information - Martin Bartl a, Martin Kötzing a,b, Stefan Schuster c, Pu Li a, Christoph Kaleta b a
Identification and annotation of promoter regions in microbial genome sequences on the basis of DNA stability
 Annotation of promoter regions in microbial genomes 851 Identification and annotation of promoter regions in microbial genome sequences on the basis of DNA stability VETRISELVI RANGANNAN and MANJU BANSAL*
Tiffany Samaroo MB&B 452a December 8, Take Home Final. Topic 1
 Tiffany Samaroo MB&B 452a December 8, 2003 Take Home Final Topic 1 Prior to 1970, protein and DNA sequence alignment was limited to visual comparison. This was a very tedious process; even proteins with
networks in molecular biology Wolfgang Huber
 networks in molecular biology Wolfgang Huber networks in molecular biology Regulatory networks: components = gene products interactions = regulation of transcription, translation, phosphorylation... Metabolic
10-810: Advanced Algorithms and Models for Computational Biology. microrna and Whole Genome Comparison
 10-810: Advanced Algorithms and Models for Computational Biology microrna and Whole Genome Comparison Central Dogma: 90s Transcription factors DNA transcription mrna translation Proteins Central Dogma:
CAP 5510: Introduction to Bioinformatics CGS 5166: Bioinformatics Tools. Giri Narasimhan
 CAP 5510: Introduction to Bioinformatics CGS 5166: Bioinformatics Tools Giri Narasimhan ECS 254; Phone: x3748 giri@cis.fiu.edu www.cis.fiu.edu/~giri/teach/bioinfs15.html Describing & Modeling Patterns
56:198:582 Biological Networks Lecture 8
 56:198:582 Biological Networks Lecture 8 Course organization Two complementary approaches to modeling and understanding biological networks Constraint-based modeling (Palsson) System-wide Metabolism Steady-state
Quantitative modeling and data analysis of SELEX experiments
 Quantitative modeling and data analysis of SELEX experiments Marko Djordjevic, 1,2, and Anirvan M. Sengupta 3 1 Department of Physics, Columbia University, New York, NY 10027 2 Mathematical Biosciences
Sequence analysis and comparison
 The aim with sequence identification: Sequence analysis and comparison Marjolein Thunnissen Lund September 2012 Is there any known protein sequence that is homologous to mine? Are there any other species
Dynamics of the Mixed Feedback Loop Integrated with MicroRNA
 The Second International Symposium on Optimization and Systems Biology (OSB 08) Lijiang, China, October 31 November 3, 2008 Copyright 2008 ORSC & APORC, pp. 174 181 Dynamics of the Mixed Feedback Loop
The binding of transcription factors (TFs) to specific sites is a
 to specific sites is a") Evolutionary comparisons suggest many novel camp response protein binding sites in Escherichia coli C. T. Brown* and C. G. Callan, Jr. *Division of Biology, California Institute of Technology, Pasadena,
Evolutionary comparisons suggest many novel camp response protein binding sites in Escherichia coli C. T. Brown* and C. G. Callan, Jr. *Division of Biology, California Institute of Technology, Pasadena,
SUPPLEMENTARY INFORMATION
 Supplementary information S3 (box) Methods Methods Genome weighting The currently available collection of archaeal and bacterial genomes has a highly biased distribution of isolates across taxa. For example,
Deciphering regulatory networks by promoter sequence analysis
 Bioinformatics Workshop 2009 Interpreting Gene Lists from -omics Studies Deciphering regulatory networks by promoter sequence analysis Elodie Portales-Casamar University of British Columbia www.cisreg.ca
Local Alignment Statistics
 Local Alignment Statistics Stephen Altschul National Center for Biotechnology Information National Library of Medicine National Institutes of Health Bethesda, MD Central Issues in Biological Sequence Comparison
BME 5742 Biosystems Modeling and Control
 BME 5742 Biosystems Modeling and Control Lecture 24 Unregulated Gene Expression Model Dr. Zvi Roth (FAU) 1 The genetic material inside a cell, encoded in its DNA, governs the response of a cell to various
arxiv: v1 [q-bio.bm] 20 Dec 2007
![arxiv: v1 [q-bio.bm] 20 Dec 2007](/thumbs/93/111959027.jpg "arxiv: v1 [q-bio.bm] 20 Dec 2007") Abstract arxiv:0712.3467v1 [q-bio.bm] 20 Dec 2007 The mean time required by a transcription factor (TF) or an enzyme to find a target in the nucleus is of prime importance for the initialization of transcription,
Abstract arxiv:0712.3467v1 [q-bio.bm] 20 Dec 2007 The mean time required by a transcription factor (TF) or an enzyme to find a target in the nucleus is of prime importance for the initialization of transcription,
Fitness landscapes and seascapes
 Fitness landscapes and seascapes Michael Lässig Institute for Theoretical Physics University of Cologne Thanks Ville Mustonen: Cross-species analysis of bacterial promoters, Nonequilibrium evolution of
Cell biology traditionally identifies proteins based on their individual actions as catalysts, signaling
 Lethality and centrality in protein networks Cell biology traditionally identifies proteins based on their individual actions as catalysts, signaling molecules, or building blocks of cells and microorganisms.
Matrix-based pattern discovery algorithms
 Regulatory Sequence Analysis Matrix-based pattern discovery algorithms Jacques.van.Helden@ulb.ac.be Université Libre de Bruxelles, Belgique Laboratoire de Bioinformatique des Génomes et des Réseaux (BiGRe)
How much non-coding DNA do eukaryotes require?
 How much non-coding DNA do eukaryotes require? Andrei Zinovyev UMR U900 Computational Systems Biology of Cancer Institute Curie/INSERM/Ecole de Mine Paritech Dr. Sebastian Ahnert Dr. Thomas Fink Bioinformatics
Quantitative Bioinformatics
 Chapter 9 Class Notes Signals in DNA 9.1. The Biological Problem: since proteins cannot read, how do they recognize nucleotides such as A, C, G, T? Although only approximate, proteins actually recognize
Computational Cell Biology Lecture 4
 Computational Cell Biology Lecture 4 Case Study: Basic Modeling in Gene Expression Yang Cao Department of Computer Science DNA Structure and Base Pair Gene Expression Gene is just a small part of DNA.
Markov Models & DNA Sequence Evolution
 7.91 / 7.36 / BE.490 Lecture #5 Mar. 9, 2004 Markov Models & DNA Sequence Evolution Chris Burge Review of Markov & HMM Models for DNA Markov Models for splice sites Hidden Markov Models - looking under
MATHEMATICAL MODELS - Vol. III - Mathematical Modeling and the Human Genome - Hilary S. Booth MATHEMATICAL MODELING AND THE HUMAN GENOME
 MATHEMATICAL MODELING AND THE HUMAN GENOME Hilary S. Booth Australian National University, Australia Keywords: Human genome, DNA, bioinformatics, sequence analysis, evolution. Contents 1. Introduction:
Lecture 4: Transcription networks basic concepts
 Lecture 4: Transcription networks basic concepts - Activators and repressors - Input functions; Logic input functions; Multidimensional input functions - Dynamics and response time 2.1 Introduction The
CHAPTER : Prokaryotic Genetics
 CHAPTER 13.3 13.5: Prokaryotic Genetics 1. Most bacteria are not pathogenic. Identify several important roles they play in the ecosystem and human culture. 2. How do variations arise in bacteria considering
Cluster Analysis of Gene Expression Microarray Data. BIOL 495S/ CS 490B/ MATH 490B/ STAT 490B Introduction to Bioinformatics April 8, 2002
 Cluster Analysis of Gene Expression Microarray Data BIOL 495S/ CS 490B/ MATH 490B/ STAT 490B Introduction to Bioinformatics April 8, 2002 1 Data representations Data are relative measurements log 2 ( red
Statistical mechanics of biological processes
 Statistical mechanics of biological processes 1 Modeling biological processes Describing biological processes requires models. If reaction occurs on timescales much faster than that of connected processes
Biology. Biology. Slide 1 of 26. End Show. Copyright Pearson Prentice Hall
 Biology Biology 1 of 26 Fruit fly chromosome 12-5 Gene Regulation Mouse chromosomes Fruit fly embryo Mouse embryo Adult fruit fly Adult mouse 2 of 26 Gene Regulation: An Example Gene Regulation: An Example
BMD645. Integration of Omics
 BMD645 Integration of Omics Shu-Jen Chen, Chang Gung University Dec. 11, 2009 1 Traditional Biology vs. Systems Biology Traditional biology : Single genes or proteins Systems biology: Simultaneously study
Computational methods for predicting protein-protein interactions
 Computational methods for predicting protein-protein interactions Tomi Peltola T-61.6070 Special course in bioinformatics I 3.4.2008 Outline Biological background Protein-protein interactions Computational
3.B.1 Gene Regulation. Gene regulation results in differential gene expression, leading to cell specialization.
 3.B.1 Gene Regulation Gene regulation results in differential gene expression, leading to cell specialization. We will focus on gene regulation in prokaryotes first. Gene regulation accounts for some of
A rule of seven in Watson-Crick base-pairing of mismatched sequences
 A rule of seven in Watson-Crick base-pairing of mismatched sequences Ibrahim I. Cisse 1,3, Hajin Kim 1,2, Taekjip Ha 1,2 1 Department of Physics and Center for the Physics of Living Cells, University of
GLOBEX Bioinformatics (Summer 2015) Genetic networks and gene expression data
 Genetic networks and gene expression data") GLOBEX Bioinformatics (Summer 2015) Genetic networks and gene expression data 1 Gene Networks Definition: A gene network is a set of molecular components, such as genes and proteins, and interactions between
GLOBEX Bioinformatics (Summer 2015) Genetic networks and gene expression data 1 Gene Networks Definition: A gene network is a set of molecular components, such as genes and proteins, and interactions between
Evidence for dynamically organized modularity in the yeast protein-protein interaction network
 Evidence for dynamically organized modularity in the yeast protein-protein interaction network Sari Bombino Helsinki 27.3.2007 UNIVERSITY OF HELSINKI Department of Computer Science Seminar on Computational
Motifs and Logos. Six Introduction to Bioinformatics. Importance and Abundance of Motifs. Getting the CDS. From DNA to Protein 6.1.
 Motifs and Logos Six Discovering Genomics, Proteomics, and Bioinformatics by A. Malcolm Campbell and Laurie J. Heyer Chapter 2 Genome Sequence Acquisition and Analysis Sami Khuri Department of Computer
Small RNA in rice genome
 Vol. 45 No. 5 SCIENCE IN CHINA (Series C) October 2002 Small RNA in rice genome WANG Kai ( 1, ZHU Xiaopeng ( 2, ZHONG Lan ( 1,3 & CHEN Runsheng ( 1,2 1. Beijing Genomics Institute/Center of Genomics and
SUPPLEMENTARY INFORMATION
 Supplementary information S1 (box). Supplementary Methods description. Prokaryotic Genome Database Archaeal and bacterial genome sequences were downloaded from the NCBI FTP site (ftp://ftp.ncbi.nlm.nih.gov/genomes/all/)
The physical language of molecular codes: A rate-distortion approach to the evolution and emergence of biological codes
 The physical language of molecular codes: A rate-distortion approach to the evolution and emergence of biological codes (Invited Paper) Tsvi Tlusty Department of Physics of Complex Systems Weizmann Institute
Lecture 4: Evolutionary Models and Substitution Matrices (PAM and BLOSUM)
") Bioinformatics II Probability and Statistics Universität Zürich and ETH Zürich Spring Semester 2009 Lecture 4: Evolutionary Models and Substitution Matrices (PAM and BLOSUM) Dr Fraser Daly adapted from
Bioinformatics II Probability and Statistics Universität Zürich and ETH Zürich Spring Semester 2009 Lecture 4: Evolutionary Models and Substitution Matrices (PAM and BLOSUM) Dr Fraser Daly adapted from
Bio 119 Bacterial Genomics 6/26/10
 BACTERIAL GENOMICS Reading in BOM-12: Sec. 11.1 Genetic Map of the E. coli Chromosome p. 279 Sec. 13.2 Prokaryotic Genomes: Sizes and ORF Contents p. 344 Sec. 13.3 Prokaryotic Genomes: Bioinformatic Analysis
Genomics and bioinformatics summary. Finding genes -- computer searches
 Genomics and bioinformatics summary 1. Gene finding: computer searches, cdnas, ESTs, 2. Microarrays 3. Use BLAST to find homologous sequences 4. Multiple sequence alignments (MSAs) 5. Trees quantify sequence
Name: SBI 4U. Gene Expression Quiz. Overall Expectation:
 Gene Expression Quiz Overall Expectation: - Demonstrate an understanding of concepts related to molecular genetics, and how genetic modification is applied in industry and agriculture Specific Expectation(s):
Casting Polymer Nets To Optimize Molecular Codes
 Casting Polymer Nets To Optimize Molecular Codes The physical language of molecules Mathematical Biology Forum (PRL 2007, PNAS 2008, Phys Bio 2008, J Theo Bio 2007, E J Lin Alg 2007) Biological information
Supplemental Material
 Supplemental Material S1. Alignment of promoter sequences Figure S1 shows the alignment of the promoter regions of the E. coli wild isolates sequenced. Figure S1. Promoter alignment of the sequenced strains.
Chapter 7: Regulatory Networks
 Chapter 7: Regulatory Networks 7.2 Analyzing Regulation Prof. Yechiam Yemini (YY) Computer Science Department Columbia University The Challenge How do we discover regulatory mechanisms? Complexity: hundreds
arxiv: v1 [q-bio.mn] 7 Nov 2018
![arxiv: v1 [q-bio.mn] 7 Nov 2018](/thumbs/90/102608433.jpg "arxiv: v1 [q-bio.mn] 7 Nov 2018") Role of self-loop in cell-cycle network of budding yeast Shu-ichi Kinoshita a, Hiroaki S. Yamada b a Department of Mathematical Engineering, Faculty of Engeneering, Musashino University, -- Ariake Koutou-ku,
Role of self-loop in cell-cycle network of budding yeast Shu-ichi Kinoshita a, Hiroaki S. Yamada b a Department of Mathematical Engineering, Faculty of Engeneering, Musashino University, -- Ariake Koutou-ku,
arxiv:physics/ v2 [physics.bio-ph] 9 Sep 2002
![arxiv:physics/ v2 [physics.bio-ph] 9 Sep 2002](/thumbs/90/104140810.jpg "arxiv:physics/ v2 [physics.bio-ph] 9 Sep 2002") Physical Constraints and Functional Characteristics of Transcription Factor-DNA Interaction Ulrich Gerland, J. David Moroz, and Terence Hwa Department of Physics, University of California at San Diego,
Physical Constraints and Functional Characteristics of Transcription Factor-DNA Interaction Ulrich Gerland, J. David Moroz, and Terence Hwa Department of Physics, University of California at San Diego,
Quantitative Biology Lecture 3
 23 nd Sep 2015 Quantitative Biology Lecture 3 Gurinder Singh Mickey Atwal Center for Quantitative Biology Summary Covariance, Correlation Confounding variables (Batch Effects) Information Theory Covariance
Basic modeling approaches for biological systems. Mahesh Bule
 Basic modeling approaches for biological systems Mahesh Bule The hierarchy of life from atoms to living organisms Modeling biological processes often requires accounting for action and feedback involving
6.047 / Computational Biology: Genomes, Networks, Evolution Fall 2008
 MIT OpenCourseWare http://ocw.mit.edu 6.047 / 6.878 Computational Biology: Genomes, Networks, Evolution Fall 2008 For information about citing these materials or our Terms of Use, visit: http://ocw.mit.edu/terms.
Supplementary materials Quantitative assessment of ribosome drop-off in E. coli
 Supplementary materials Quantitative assessment of ribosome drop-off in E. coli Celine Sin, Davide Chiarugi, Angelo Valleriani 1 Downstream Analysis Supplementary Figure 1: Illustration of the core steps
Effects of Gap Open and Gap Extension Penalties
 Brigham Young University BYU ScholarsArchive All Faculty Publications 200-10-01 Effects of Gap Open and Gap Extension Penalties Hyrum Carroll hyrumcarroll@gmail.com Mark J. Clement clement@cs.byu.edu See
12-5 Gene Regulation
 12-5 Gene Regulation Fruit fly chromosome 12-5 Gene Regulation Mouse chromosomes Fruit fly embryo Mouse embryo Adult fruit fly Adult mouse 1 of 26 12-5 Gene Regulation Gene Regulation: An Example Gene
Measuring Colocalization within Fluorescence Microscopy Images
 from photonics.com: 03/01/2007 http://www.photonics.com/article.aspx?aid=39341 Measuring Colocalization within Fluorescence Microscopy Images Two-color fluorescence-based methods are uncovering molecular
Computational Genomics. Reconstructing dynamic regulatory networks in multiple species
 02-710 Computational Genomics Reconstructing dynamic regulatory networks in multiple species Methods for reconstructing networks in cells CRH1 SLT2 SLR3 YPS3 YPS1 Amit et al Science 2009 Pe er et al Recomb
Biol478/ August
 Biol478/595 29 August # Day Inst. Topic Hwk Reading August 1 M 25 MG Introduction 2 W 27 MG Sequences and Evolution Handouts 3 F 29 MG Sequences and Evolution September M 1 Labor Day 4 W 3 MG Database
Inferring the in vivo looping properties of DNA
 1 Inferring the in vivo looping properties of DNA Leonor Saiz, J. Miguel Rubi *, and Jose M. G. Vilar Integrative Biological Modeling Laboratory, Computational Biology Program, Memorial Sloan-Kettering
O 3 O 4 O 5. q 3. q 4. Transition
 Hidden Markov Models Hidden Markov models (HMM) were developed in the early part of the 1970 s and at that time mostly applied in the area of computerized speech recognition. They are first described in
Alignment. Peak Detection
 ChIP seq ChIP Seq Hongkai Ji et al. Nature Biotechnology 26: 1293-1300. 2008 ChIP Seq Analysis Alignment Peak Detection Annotation Visualization Sequence Analysis Motif Analysis Alignment ELAND Bowtie
Supplementary material to Whitney, K. D., B. Boussau, E. J. Baack, and T. Garland Jr. in press. Drift and genome complexity revisited. PLoS Genetics.
 Supplementary material to Whitney, K. D., B. Boussau, E. J. Baack, and T. Garland Jr. in press. Drift and genome complexity revisited. PLoS Genetics. Tree topologies Two topologies were examined, one favoring
Dr. Amira A. AL-Hosary
 Phylogenetic analysis Amira A. AL-Hosary PhD of infectious diseases Department of Animal Medicine (Infectious Diseases) Faculty of Veterinary Medicine Assiut University-Egypt Phylogenetic Basics: Biological
The Physical Language of Molecules
 The Physical Language of Molecules How do molecular codes emerge and evolve? International Workshop on Bio Soft Matter Tokyo, 2008 Biological information is carried by molecules Self replicating information
Topic 4: Equilibrium binding and chemical kinetics
 Topic 4: Equilibrium binding and chemical kinetics Outline: Applications, applications, applications use Boltzmann to look at receptor-ligand binding use Boltzmann to look at PolII-DNA binding and gene
An optimized energy potential can predict SH2 domainpeptide
 An optimized energy potential can predict SH2 domainpeptide interactions Running Title Predicting SH2 interactions Authors Zeba Wunderlich 1, Leonid A. Mirny 2 Affiliations 1. Biophysics Program, Harvard
Chapter 15 Active Reading Guide Regulation of Gene Expression
 Name: AP Biology Mr. Croft Chapter 15 Active Reading Guide Regulation of Gene Expression The overview for Chapter 15 introduces the idea that while all cells of an organism have all genes in the genome,
Comparative genomics: Overview & Tools + MUMmer algorithm
 Comparative genomics: Overview & Tools + MUMmer algorithm Urmila Kulkarni-Kale Bioinformatics Centre University of Pune, Pune 411 007. urmila@bioinfo.ernet.in Genome sequence: Fact file 1995: The first
Inferring Models of cis-regulatory Modules using Information Theory
 Inferring Models of cis-regulatory Modules using Information Theory BMI/CS 776 www.biostat.wisc.edu/bmi776/ Spring 28 Anthony Gitter gitter@biostat.wisc.edu These slides, excluding third-party material,
Exhaustive search. CS 466 Saurabh Sinha
 Exhaustive search CS 466 Saurabh Sinha Agenda Two different problems Restriction mapping Motif finding Common theme: exhaustive search of solution space Reading: Chapter 4. Restriction Mapping Restriction
Proteomics Systems Biology
 Dr. Sanjeeva Srivastava IIT Bombay Proteomics Systems Biology IIT Bombay 2 1 DNA Genomics RNA Transcriptomics Global Cellular Protein Proteomics Global Cellular Metabolite Metabolomics Global Cellular
Predicting Protein Functions and Domain Interactions from Protein Interactions
 Predicting Protein Functions and Domain Interactions from Protein Interactions Fengzhu Sun, PhD Center for Computational and Experimental Genomics University of Southern California Outline High-throughput
Effects of Different Burst Form on Gene Expression Dynamic and First-Passage Time
 Advanced Studies in Biology, Vol. 9, 2017, no. 2, 91-100 HIKARI Ltd, www.m-hikari.com https://doi.org/10.12988/asb.2017.726 Effects of Different Burst Form on Gene Expression Dynamic and First-Passage
Introduction to Information Theory
 Introduction to Information Theory Gurinder Singh Mickey Atwal atwal@cshl.edu Center for Quantitative Biology Kullback-Leibler Divergence Summary Shannon s coding theorems Entropy Mutual Information Multi-information