High intensity rainfall estimation in New Zealand
|
|
|
- Sheryl Short
- 6 years ago
- Views:
Transcription

1 Water New Zealand 31 st October 2013 High intensity rainfall estimation in New Zealand Graeme Horrell Engineering Hydrologist,
2 Contents High Intensity Rainfall Design System (HIRDS Version 1) HIRDS Version 2 HIRDS Version 3 HIRDS V3 assessment by Regional Councils Comparison with Council guidelines for storm water runoff HIRDS upgrade International collaboration

3 Statistics of extreme rainfall play a vital role in engineering practice from the perspective of mitigation and protection of infrastructure and human life from flooding River flood flow analysis are preferred, but analysis of rainfall data is often more convenient due to the finer spatial nature of rainfall recording networks


4 Origins Rainfall frequency analysis as a design tool has developed over the years in New Zealand Seelye 1947 Robertson 1963 Tomlinson HIRDS V Thompson HIRDS V Pearson and Henderson 1998 Thompson HIRDS V Thompson HIRDS V3 2010

5 Tomlinson manually read daily raingauges 180 automatic raingauges Conversion of annual maximum: daily manual to 24 hour maximum, 1.14 daily manual to 48 hour maximum, 1.07 daily manual to 72 hour maximum, 1.04 Extreme value type 1 (EV1) - Gumbel distribution Some values fitted extreme value type II (EV2) outliers Estimated any duration storm rainfalls for any return period up to 100 year
 of return period 5")
6 Return period conversion table 12 to 72 hour duration factor graph Christchurch Other maps 10-minute return period of 5 years 1-hour return period of 5 years 6-hour return period of 5 years Tomlinson s, South Island map of 24-hour rainfall (mm) of return period 5 years.
7 Thompson 1992 Converted Tomlinson s 1980 maps, graphs and tables into a computer based procedure User enters location coordinates to obtain a table with 10 durations from 10 minutes to 72 hours and up to the 100 year period. First version of the High Intensity Rainfall Design System, HIRDS.
 distribution to the annual maximum series,")
8 Pearson and Henderson 1998 Looked in detail at the Tomlinson (1980) outliers removed from the EV1 (Gumbel) frequency analysis manually read daily raingauges 150 automatic raingauges Frequency analysis on 1, 6, and 24 hour durations Fitted the Generalised Extreme Value (GEV) distribution to the annual maximum series, using the method of L-moments (Hosking 1990). Concluded that for hydrological design that deleting outliers and using the EV1 distribution leads to underestimation of design storm rainfalls for many New Zealand regions. For these regions annual maxima of 24-hour rainfalls tend toward the Extreme Value Type II (EV2) distribution.
9 Dimensionless (maxima divided by mean) Gumbel plot of 83 series of eastern Southland annual maximum 24-hour duration storm rainfalls, with fitted EV2 (curve) and EV1 (line) distributions
10 Thompson manually read daily raingauges 682 automatic raingauges Version 2 was also a computer based procedure requiring site coordinates. Conversion of 1, 2 and 3 day annual maximum same as Tomlinson Used an index rainfall the median annual maximum rainfall for each duration The regional growth curves were derived using a generalised extreme value distribution combined with probability weighted moment estimation. Mapped regional frequency growth curves that are common to every site within a prescribed region Mapping of the index rainfall involved fitting a trivariate thin-plate spline to three independent variables longitude, latitude, and site elevation. Design rainfalls for any site are simply the product of the index rainfall (median) and the regional rainfall growth curve

11 Latest version Thompson 2010 Elements of HIRDS version 3 Free output from Web site
12 Thompson manually read daily raingauges 1036 automatic raingauges Very similar to Thompson 2002, Regional Councils data included Closed sites in close vicinity combined The introduction of data stratification based upon 3 principal meteorological processes, convective, stratiform and a mixture of both. A regional dimensionless growth curve based on the Generalised Extreme Value (GEV), and using goodness of fit test for the GEV (Ailliot et al., 2009), Gumbel (EV1), and Generalised Logistic (GLO) distributions rather than probability weighted moments used in HIRDS version 2. Mapping of median annual maximum rainfall and parameters of the regional growth curves, covered New Zealand using thin-plate smoothing ANUSPLIN splines (Hutchinson 1995, 2000), at a 2km x 2km grid, and using L moments statistics, resulted in 10 surfaces each representing the 10 durations from 10 minutes to 72 hours, and were extended to a maximum Average Recurrence Interval (ARI) of 100 years.

13 Enter address Or map coordinates Enter site name optional -projected temperature change Web address Go Output table format


14 Cropp wettest raingauge in New Zealand 12,000 mm per year
15
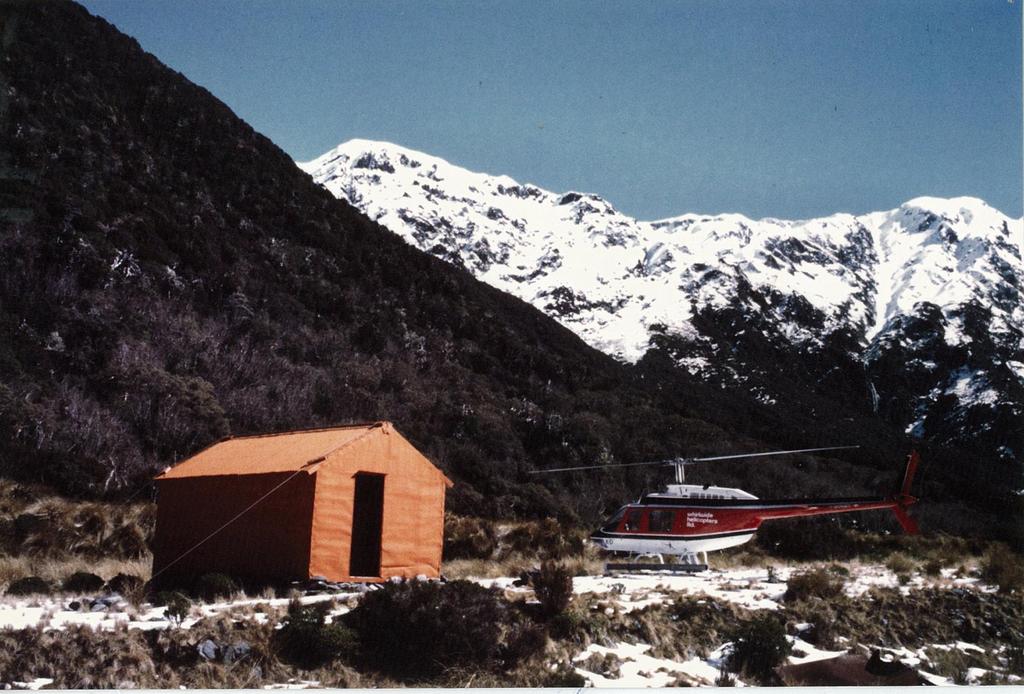
16 Cropp Hut
17 Duration Rainfall depth (mm) ARI (y) aep 10m 20m 30m 60m 2h 6h 12h 24h 48h 72h
18 HIRDS version 3 assessment by Regional Councils
19 Background The previous HIRDS version 2 was not fully accepted by many Regional Councils Jeff Watson of Horizons wanted version 3 validated by Regional Councils to prove it was fit for purpose before it was released. HIRDS Version 3 incorporates rainfall intensity data from Regional Councils
20 Pilot of HIRDS V3 tested by key Regional Councils Peter Blackwood, Horizons Craig Goodier, Hawkes Bay Regional Council Tony Oliver, Toby Kay, Peter West, Environment Canterbury Northland Regional Council Environment Bay of Plenty

21 Peter Blackwood s comments The trends are all good I had found that generally HIRDS v2 seemed to underestimate at higher return periods by up to 10-15%. In most cases this software seems to provide an increase to more expected values Palmerston North and Pahiatua are exceptions, however there maybe explanations for these Moawhango Lake

22 Shorter durations with lesser return periods were different to v1, an example was North of Mahia, the 1 hour (5 year) Ver mm Ver 1-40 mm. Aware it is based on data up to 1977 Craig Goodier s comments Waikaremoana Previously been advised not to use version 2 He is comfortable with HIRDS ver 1 and used this to compare with ver 3. Ver 3 was okay in the longer return periods and longer durations
23 Tony Oliver s comments Luke Creek Overall v3 is a lot better than v2, which generally under estimated by ~ 30%. I Consider achieving agreement within % for rainfall analysis (including extreme events) is fairly good.

24 Toby Kay s conclusions It is concluded that HIRDS v3 has reduced the observed difference between rainfall depths calculated from at site frequency analysis of intensity gauges and HIRDS v2. HIRDS v3 gives rainfall depths that are 18% greater than HIRDS v2 for daily rainfall sites. This compares with a 9% increase established from at site frequency analysis. Takahue at Te Rore HIRDS v3 gives rainfall depths 9% greater than v2 for intensity gauge sites. This is close to the estimated increase in storm rainfall between 2002 and 2009 (10% increase from frequency analysis all durations)

25 Toby Kay s conclusions (cont) Further assessment and comparison is recommended for other long term records in Northland, but it seems reasonable at this stage to use HIRDS v3 without correction for all catchments in the Priority Rivers Flood Risk Reduction Project. Whilst HIRDS v3 may appear to give conservative estimates in relation to the analysis of daily rain gauge data, depths given by HIRDS v3 correlate well with frequency analysis undertaken for automatic gauges.
26 Peter West s comments In the Bay of Plenty we ve perceived a commonly occurring coastal rain type that causes higher design intensities close to the coast. I can see the desired effect represented on the HIRDS v3 fitted maps. General improvement with V3 over V1 But some gauges not so close, I expect the situation is due to our short record as almost all gauges installed in 1990.
27 Comparison with Council guidelines for storm water runoff Christchurch city Tony Oliver Botanic Gardens Whilst 1 hour and 48 hour had good agreement the 6 12 and 24 hour for 10 to 50 year ARI were 10 to 15 % more for HIRDS v3 than 2009 NIWA study
28 Comparison with Council guidelines for storm water runoff Auckland city TP108 (1999) significant heterogenic growth factors Revised (2008) now homogeneous Further revision (2011) - also homogenous HIRDS V3 agreed with the TP108 (1999) but not 2008 and 2011 updates new updates underestimate the 24 hour 100 year ARI by 30 % when compared to HIRDS V3 Note a 18 % increase for this duration and ARI occurred in Northland
29 Summary - comparison with Council guidelines for storm water runoff Data length at site local analysis, used all information - HIRDS requires a sufficient data length - comparison over different analysis periods - last 10 years less stormy, except in Northland, therefore recent raingauges may influence results - HIRDS joins sites if within 500 m to extend record length Region of influence Local analysis may use a different methodology to test for homogeneity for the grouping of rainfall stations in the frequency analysis
30 Improved method to determine the shape factor used in frequency distributions HIRDS v3 versus HIRDS v2 differences Approximately 10 additional years of data 28% increase in the number of daily manual raingauges 52% increase in the number of automatic raingauges Region of influence selection is more thorough
31 HIRDS upgrade Collaboration with Regional, City and District Councils Improve coverage Include recent storms Include historic paper records
32 Seelye Robertson Number of raingauges Tomlinson Ver 1 Thompson Thompson Ver 2 Thompson ver 3 HIRDS upgrade (cont) Rain gauges used in analysis Manual stations Recording gauges Year study completed
33 HIRDS upgrade (cont) Extend the average recurrence interval to 250 year return period Area reduction curves Temporal patterns or design storm Enable users to download maps from web page Provide a comprehensive list of raingauges used Interdecadal Pacific Oscillation (IPO)?

34 Rainfall (mm) Combined impact of climate variability (IPO) and change on South Island alpine rainfall Negative IPO La Niña-like phase Positive IPO - El Niño-like phase Negative IPO La Niña-like phase Positive IPO - El Niño-like phase Negative IPO La Niña-like phase This is best estimate today, but it s very uncertain! Year
35 International collaboration NIWA working with Centre for Ecology and Hydrology, Wallingford, UK, sharing new methods. Rainfall intensity also a component of the UNESCO IHP Asia Pacific FRIEND (APFRIEND) project on Flood Design. NIWA s 2012 Memorandum of understanding with the Korea Institute of construction Technology (KICT) South Korea. My graeme.horrell@niwa.co.nz
PLANNED UPGRADE OF NIWA S HIGH INTENSITY RAINFALL DESIGN SYSTEM (HIRDS)
") PLANNED UPGRADE OF NIWA S HIGH INTENSITY RAINFALL DESIGN SYSTEM (HIRDS) G.A. Horrell, C.P. Pearson National Institute of Water and Atmospheric Research (NIWA), Christchurch, New Zealand ABSTRACT Statistics
PLANNED UPGRADE OF NIWA S HIGH INTENSITY RAINFALL DESIGN SYSTEM (HIRDS) G.A. Horrell, C.P. Pearson National Institute of Water and Atmospheric Research (NIWA), Christchurch, New Zealand ABSTRACT Statistics
New Intensity-Frequency- Duration (IFD) Design Rainfalls Estimates
 Design Rainfalls Estimates") New Intensity-Frequency- Duration (IFD) Design Rainfalls Estimates Janice Green Bureau of Meteorology 17 April 2013 Current IFDs AR&R87 Current IFDs AR&R87 Current IFDs - AR&R87 Options for estimating
New Intensity-Frequency- Duration (IFD) Design Rainfalls Estimates Janice Green Bureau of Meteorology 17 April 2013 Current IFDs AR&R87 Current IFDs AR&R87 Current IFDs - AR&R87 Options for estimating
New design rainfalls. Janice Green, Project Director IFD Revision Project, Bureau of Meteorology
 New design rainfalls Janice Green, Project Director IFD Revision Project, Bureau of Meteorology Design Rainfalls Design Rainfalls Severe weather thresholds Flood forecasting assessing probability of rainfalls
High Intensity Rainfall Design System
 High Intensity Rainfall Design System Version 4 Prepared for Envirolink August 2018 Prepared by: Trevor Carey-Smith Roddy Henderson Shailesh Singh For any information regarding this report please contact:
Flood hydrology of the Mangaroa River MARCH 2005
 Flood hydrology of the Mangaroa River MARCH 2005 MARCH 2005 Flood hydrology of the Mangaroa River Laura Watts Contents Summary 1 1. Introduction 2 2. Catchment description 3 3. Data availability and quality
Updated Precipitation Frequency Estimates for Minnesota
 1 Updated Precipitation Frequency Estimates for Minnesota Presenter: Authors: (alphabetical order) Sanja Perica, Director Hydrometeorological Design Studies Center (HDSC), Office of Hydrology, National
Tool 2.1.2: Modelling future heavy rainfall
 Impacts of Climate Change on Urban Infrastructure & the Built Environment A Toolbox Tool 2.1.2: Modelling future heavy rainfall Author(s) J. Sturman 1, H. McMillan 2, S. Poyck 2, R. Ibbitt 2, R. Woods
Percentage of normal rainfall for August 2017 Departure from average air temperature for August 2017
 New Zealand Climate Update No 219, August 2017 Current climate August 2017 Overall, mean sea level pressure was lower than normal over and to the west of New Zealand during August while higher than normal
More flood disasters in New Zealand
 Journal of Hydrology (NZ) 49 (2): 69-78 2010 New Zealand Hydrological Society (2010) More flood disasters in New Zealand Graeme M. Smart and Alistair I. McKerchar National Institute of Water & Atmospheric
Lecture 2: Precipitation
 2-1 GEOG415 Lecture 2: Precipitation Why do we study precipitation? Precipitation measurement -- depends on the study purpose. Non-recording (cumulative) Recording (tipping bucket) Important parameters
Inflow Forecasting for Hydro Catchments. Ross Woods and Alistair McKerchar NIWA Christchurch
 Inflow Forecasting for Hydro Catchments Ross Woods and Alistair McKerchar NIWA Christchurch Inflows Water flowing into hydro storages Usually measured by monitoring the levels and outflows from hydro storages
NRC Workshop - Probabilistic Flood Hazard Assessment Jan 2013
 Regional Precipitation-Frequency Analysis And Extreme Storms Including PMP Current State of Understanding/Practice Mel Schaefer Ph.D. P.E. MGS Engineering Consultants, Inc. Olympia, WA NRC Workshop - Probabilistic
Presented at WaPUG Spring Meeting 1 st May 2001
 Presented at WaPUG Spring Meeting 1 st May 21 Author: Richard Allitt Richard Allitt Associates Ltd 111 Beech Hill Haywards Heath West Sussex RH16 3TS Tel & Fax (1444) 451552 1. INTRODUCTION The Flood Estimation
New Zealand Climate Update No 226, April 2018 Current climate March 2018
 New Zealand Climate Update No 226, April 2018 Current climate March 2018 March 2018 was characterised by significantly higher pressure than normal to the east of New Zealand. This pressure pattern, in
RAINFALL DURATION-FREQUENCY CURVE FOR UNGAGED SITES IN THE HIGH RAINFALL, BENGUET MOUNTAIN REGION IN THE PHILIPPINES
 RAINFALL DURATION-FREQUENCY CURVE FOR UNGAGED SITES IN THE HIGH RAINFALL, BENGUET MOUNTAIN REGION IN THE PHILIPPINES GUILLERMO Q. TABIOS III Department of Civil Engineering, University of the Philippines
JUNE 2004 Flood hydrology of the Waiwhetu Stream
 JUNE 2004 Flood hydrology of the Waiwhetu Stream Laura Watts Resource Investigations Contents 1. Introduction 1 2. Catchment description 2 3. Data availability and quality 3 3.1 Rainfall data 3 3.2 Water
NIWA Outlook: March-May 2015
 March May 2015 Issued: 27 February 2015 Hold mouse over links and press ctrl + left click to jump to the information you require: Overview Regional predictions for the next three months: Northland, Auckland,
NIWA Outlook: October - December 2015
 October December 2015 Issued: 1 October 2015 Hold mouse over links and press ctrl + left click to jump to the information you require: Overview Regional predictions for the next three months: Northland,
RADAR Rainfall Calibration of Flood Models The Future for Catchment Hydrology? A Case Study of the Stanley River catchment in Moreton Bay, Qld
 RADAR Rainfall Calibration of Flood Models The Future for Catchment Hydrology? A Case Study of the Stanley River catchment in Moreton Bay, Qld A 1 Principal Engineer, Water Technology Pty Ltd, Brisbane,
STRUCTURAL ENGINEERS ASSOCIATION OF OREGON
 STRUCTURAL ENGINEERS ASSOCIATION OF OREGON P.O. Box 3285 PORTLAND, OR 97208 503.753.3075 www.seao.org E-mail: jane@seao.org 2010 OREGON SNOW LOAD MAP UPDATE AND INTERIM GUIDELINES FOR SNOW LOAD DETERMINATION
ANALYSIS OF RAINFALL DATA FROM EASTERN IRAN ABSTRACT
 ISSN 1023-1072 Pak. J. Agri., Agril. Engg., Vet. Sci., 2013, 29 (2): 164-174 ANALYSIS OF RAINFALL DATA FROM EASTERN IRAN 1 M. A. Zainudini 1, M. S. Mirjat 2, N. Leghari 2 and A. S. Chandio 2 1 Faculty
LITERATURE REVIEW. History. In 1888, the U.S. Signal Service installed the first automatic rain gage used to
 LITERATURE REVIEW History In 1888, the U.S. Signal Service installed the first automatic rain gage used to record intensive precipitation for short periods (Yarnell, 1935). Using the records from this
New Zealand Climate Update No 221, October 2017 Current climate October 2017
 New Zealand Climate Update No 221, October 2017 Current climate October 2017 October 2017 was characterised by higher than normal sea level pressure over New Zealand and the surrounding seas. This consistent
Extreme rainfall in Cumbria, November 2009 an assessment of storm rarity
 Extreme rainfall in Cumbria, November 2009 an assessment of storm rarity Lisa Stewart 1, Dave Morris 1, David Jones 1 and Peter Spencer 2 1 Centre for Ecology and Hydrology, Wallingford, UK; 2 Environment
NIWA Outlook: September October November 2013
 September-November 2013 Issued: 30 August 2013 Hold mouse over links and press ctrl + left click to jump to the information you require: Overview Regional predictions for the next three months: Northland,
New Zealand Climate Update No 222, November 2017 Current climate November 2017
 New Zealand Climate Update No 222, November 2017 Current climate November 2017 November 2017 was characterised by higher than normal sea level pressure over New Zealand and the surrounding seas, particularly
NIWA Outlook: April June 2019
 April June 2019 Issued: 28 March 2019 Hold mouse over links and press ctrl + left click to jump to the information you require: Outlook Summary Regional predictions for the next three months Northland,
USGS ATLAS. BACKGROUND
 USGS ATLAS. BACKGROUND 1998. Asquith. DEPTH-DURATION FREQUENCY OF PRECIPITATION FOR TEXAS. USGS Water-Resources Investigations Report 98 4044. Defines the depth-duration frequency (DDF) of rainfall annual
Systematic errors and time dependence in rainfall annual maxima statistics in Lombardy
 Systematic errors and time dependence in rainfall annual maxima statistics in Lombardy F. Uboldi (1), A. N. Sulis (2), M. Cislaghi (2), C. Lussana (2,3), and M. Russo (2) (1) consultant, Milano, Italy
Craig Thompson 25 February 2010 Revision 1 11 March 2011
 HIRDS.V3: High Intensity Rainfall Design System The method underpinning the development of regional frequency analysis of extreme rainfalls for New Zealand Craig Thompson 5 February 010 Revision 1 11 March
Leon Creek Watershed October 17-18, 1998 Rainfall Analysis Examination of USGS Gauge Helotes Creek at Helotes, Texas
 Leon Creek Watershed October 17-18, 1998 Rainfall Analysis Examination of USGS Gauge 8181400 Helotes Creek at Helotes, Texas Terrance Jackson MSCE Candidate University of Texas San Antonio Abstract The
USSD Conference, Denver 2016
 USSD Conference, Denver 2016 M Schaefer, MGS Engineering Consultants K Neff, TVA River Operations C Jawdy, TVA River Operations S Carney, Riverside Technology B Barker, MGS Engineering Consultants G Taylor,
Percentage of normal rainfall for April 2018 Departure from average air temperature for April 2018
 New Zealand Climate Update No 227, May 2018 Current climate April 2018 Overall, April 2018 was characterised by lower pressure than normal over and to the southeast of New Zealand. Unlike the first three
Estimating Probable Maximum Precipitation for Linau River Basin in Sarawak
 Estimating Probable Maximum Precipitation for Linau River Basin in Sarawak M. Hussain, S. Nadya and F.J. Chia Hydropower Development Division, Sarawak Energy Berhad, 93050, Kuching, Sarawak, Malaysia Date
Tool 2.1.4: Inundation modelling of present day and future floods
 Impacts of Climate Change on Urban Infrastructure & the Built Environment A Toolbox Tool 2.1.4: Inundation modelling of present day and future floods Authors M. Duncan 1 and G. Smart 1 Affiliation 1 NIWA,
Summary report for Ruamāhanga Whaitua Committee The climate of the Ruamāhanga catchment
 Summary report for Ruamāhanga Whaitua Committee The climate of the Ruamāhanga catchment The Tararua and Rimutaka ranges have a large influence on the climate of the Ruamāhanga catchment. The ranges shelter
Changes to Extreme Precipitation Events: What the Historical Record Shows and What It Means for Engineers
 Changes to Extreme Precipitation Events: What the Historical Record Shows and What It Means for Engineers Geoffrey M Bonnin National Oceanic and Atmospheric Administration National Weather Service Office
Climatic Change Implications for Hydrologic Systems in the Sierra Nevada
 Climatic Change Implications for Hydrologic Systems in the Sierra Nevada Part Two: The HSPF Model: Basis For Watershed Yield Calculator Part two presents an an overview of why the hydrologic yield calculator
Coastal Hazard and Climate-Change Risk Exposure in New Zealand: Comparing Regions and Urban Areas
 Presented at the FIG Working Week 2016, May 2-6, 2016 in Christchurch, New Zealand Coastal Hazard and Climate-Change Risk Exposure in New Zealand: Comparing Regions and Urban Areas Rob Bell, Ryan Paulik
Design Flood Estimation in Ungauged Catchments: Quantile Regression Technique And Probabilistic Rational Method Compared
 Design Flood Estimation in Ungauged Catchments: Quantile Regression Technique And Probabilistic Rational Method Compared N Rijal and A Rahman School of Engineering and Industrial Design, University of
Flood Inundation Analysis by Using RRI Model For Chindwin River Basin, Myanmar
 Flood Inundation Analysis by Using RRI Model For Chindwin River Basin, Myanmar Aye Aye Naing Supervisor : Dr. Miho Ohara MEE14625 Dr. Duminda Perera Dr. Yoshihiro Shibuo ABSTRACT Floods occur during the
1. TEMPORAL CHANGES IN HEAVY RAINFALL FREQUENCIES IN ILLINOIS
 to users of heavy rainstorm climatology in the design and operation of water control structures. A summary and conclusions pertaining to various phases of the present study are included in Section 8. Point
STUDY OF FIXED-DURATION DESIGN RAINFALLS IN AUSTRALIAN RAINFALL RUNOFF AND JOINT PROBABILITY BASED DESIGN RAINFALLS
 STUDY OF FIXED-DURATION DESIGN RAINFALLS IN AUSTRALIAN RAINFALL RUNOFF AND JOINT PROBABILITY BASED DESIGN RAINFALLS ABDUR RAUF and ATAUR RAHMAN School of Engineering and Industrial Design, University of
Regional overview Autumn 2016
 Autumn 2016 (March to May inclusive) was drier than average for most of the region. The south and east of the Wairarapa were the driest areas with west coast areas being the wettest. Autumn rainfall The
RAINFALL FREQUENCY ANALYSIS FOR NEW BRAUNFELS, TX (or Seems like we ve been having lots of 100-yr storms)
") RAINFALL FREQUENCY ANALYSIS FOR NEW BRAUNFELS, TX (or Seems like we ve been having lots of 100-yr storms) Presented By: SAUL NUCCITELLI, PE, CFM (LAN) BLAKE KRONKOSKY, EIT (LAN) JIM KLEIN, PE (CITY OF
RAINFALL FREQUENCY ANALYSIS FOR NEW BRAUNFELS, TX (or Seems like we ve been having lots of 100-yr storms) Presented By: SAUL NUCCITELLI, PE, CFM (LAN) BLAKE KRONKOSKY, EIT (LAN) JIM KLEIN, PE (CITY OF
Flood Frequency Mapping using Multirun results from Infoworks RS applied to the river basin of the Yser, Belgium
 Flood Frequency Mapping using Multirun results from Infoworks RS applied to the river basin of the Yser, Belgium Ir. Sven Verbeke Aminal, division Water, Flemish Government, Belgium Introduction Aminal
THIN PLATE SMOOTHING SPLINE INTERPOLATION OF DAILY RAINFALL FOR NEW ZEALAND USING A CLIMATOLOGICAL RAINFALL SURFACE
 INTERNATIONAL JOURNAL OF CLIMATOLOGY Int. J. Climatol. 26: 2097 2115 (2006) Published online 5 May 2006 in Wiley InterScience (www.interscience.wiley.com).1350 THIN PLATE SMOOTHING SPLINE INTERPOLATION
Reservoir safety long return period rainfall
 Reservoir safety long return period rainfall E.J. STEWART, Centre for Ecology & Hydrology, Wallingford, UK D.A. JONES, Centre for Ecology & Hydrology, Wallingford, UK C. SVENSSON, Centre for Ecology &
Climate reality - actual and expected
 Climate reality - actual and expected 13 Climate reality - actual and expected J. SALINGER NIWA, P O Box 109 695, Newmarket, Auckland j.salinger@niwa.co.nz Abstract New Zealand average surface temperatures
Wainui Beach Management Strategy (WBMS) Summary of Existing Documents. GNS Tsunami Reports
 Summary of Existing Documents. GNS Tsunami Reports") Wainui Beach Management Strategy (WBMS) Summary of Existing Documents GNS Tsunami Reports a) Review of Tsunami Hazard and Risk in New Zealand ( National Risk Report ) b) Review of New Zealand s Preparedness
Wainui Beach Management Strategy (WBMS) Summary of Existing Documents GNS Tsunami Reports a) Review of Tsunami Hazard and Risk in New Zealand ( National Risk Report ) b) Review of New Zealand s Preparedness
IT S TIME FOR AN UPDATE EXTREME WAVES AND DIRECTIONAL DISTRIBUTIONS ALONG THE NEW SOUTH WALES COASTLINE
 IT S TIME FOR AN UPDATE EXTREME WAVES AND DIRECTIONAL DISTRIBUTIONS ALONG THE NEW SOUTH WALES COASTLINE M Glatz 1, M Fitzhenry 2, M Kulmar 1 1 Manly Hydraulics Laboratory, Department of Finance, Services
NSW Ocean Water Levels
 NSW Ocean Water Levels B Modra 1, S Hesse 1 1 Manly Hydraulics Laboratory, NSW Public Works, Sydney, NSW Manly Hydraulics Laboratory (MHL) has collected ocean water level and tide data on behalf of the
Regionalization for one to seven day design rainfall estimation in South Africa
 FRIEND 2002 Regional Hydrology: Bridging the Gap between Research and Practice (Proceedings of (he fourth International l-'riknd Conference held at Cape Town. South Africa. March 2002). IAI IS Publ. no.
Floodplain Risk Management in Dungog after the April 2015 Super Storm. Presentation Outline
 Presentation Outline Floodplain Risk Management in after the April 2015 Super Storm Rohan Hudson, Royal HaskoningDHV FMA 2017 Preparing for the Next Great Flood 17th May 2017 Background and Flood Mechanisms
NEW ZEALAND WEATHER. BRIEF REVIEW OF THE WEATHER WINTER 1991 (Fig. 1) CONTRASTING RAINFALL, COLD IN THE SOUTH-WEST OF THE SOUTH ISLAND
 CONTRASTING RAINFALL, COLD IN THE SOUTH-WEST OF THE SOUTH ISLAND") Weather and Climate (1992) 12: 47-52 47 NEW ZEALAND WEATHER BRIEF REVIEW OF THE WEATHER (Fig. 1) CONTRASTING RAINFALL, COLD IN THE SOUTH-WEST OF THE SOUTH ISLAND An El Nino event (negative phase of the
Weather and Climate (1992) 12: 47-52 47 NEW ZEALAND WEATHER BRIEF REVIEW OF THE WEATHER (Fig. 1) CONTRASTING RAINFALL, COLD IN THE SOUTH-WEST OF THE SOUTH ISLAND An El Nino event (negative phase of the
Aurora Bell*, Alan Seed, Ross Bunn, Bureau of Meteorology, Melbourne, Australia
 15B.1 RADAR RAINFALL ESTIMATES AND NOWCASTS: THE CHALLENGING ROAD FROM RESEARCH TO WARNINGS Aurora Bell*, Alan Seed, Ross Bunn, Bureau of Meteorology, Melbourne, Australia 1. Introduction Warnings are
New Zealand Climate Update No 223, January 2018 Current climate December 2017
 New Zealand Climate Update No 223, January 2018 Current climate December 2017 December 2017 was characterised by higher than normal sea level pressure over New Zealand and the surrounding seas. This pressure
CLIMATE CHANGE ADAPTATION BY MEANS OF PUBLIC PRIVATE PARTNERSHIP TO ESTABLISH EARLY WARNING SYSTEM
 CLIMATE CHANGE ADAPTATION BY MEANS OF PUBLIC PRIVATE PARTNERSHIP TO ESTABLISH EARLY WARNING SYSTEM By: Dr Mamadou Lamine BAH, National Director Direction Nationale de la Meteorologie (DNM), Guinea President,
Results of Intensity-Duration- Frequency Analysis for Precipitation and Runoff under Changing Climate
 Results of Intensity-Duration- Frequency Analysis for Precipitation and Runoff under Changing Climate Supporting Casco Bay Region Climate Change Adaptation RRAP Eugene Yan, Alissa Jared, Julia Pierce,
Weather Satellite Data Applications for Monitoring and Warning Hazard at BMKG
 The 5th Meeting of the Coordinating Group of the RA II WIGOS Satellite Project 21 October 2017, Vladivostok city, Russky Island, Russia Far Eastern Federal University Weather Satellite Data Applications
8.1.2 Climate Projections
 Chapter 8 Nauru 167 8.1 Climate Summary 8.1.1 Current Climate Over the past half century it is likely that there has been a warming air temperature trend at Nauru which is partly associated with warming
Analysing River Discharge Data for Flood Analysis
 Analysing River Discharge Data for Flood Analysis This suggested response provides answers to the eleven questions posed on the web-site. Your report should have covered all of this material. (A) Produce
INCA-CE achievements and status
 INCA-CE achievements and status Franziska Strauss Yong Wang Alexander Kann Benedikt Bica Ingo Meirold-Mautner INCA Central Europe Integrated nowcasting for the Central European area This project is implemented
New NOAA Precipitation-Frequency Atlas for Wisconsin
 New NOAA Precipitation-Frequency Atlas for Wisconsin #215966 Presentation to the Milwaukee Metropolitan Sewerage District Technical Advisory Team January 16, 2014 Michael G. Hahn, P.E., P.H. SEWRPC Chief
The Use of Synthetic Floods for Defining the Regulated Volume Duration Frequency Curves for the Red River at Fargo, ND
 The Use of Synthetic Floods for Defining the Regulated Volume Duration Frequency Curves for the Red River at Fargo, ND Prepared by the USACE - St. Paul District Hydrology & Water Management Section June
REQUIREMENTS FOR WEATHER RADAR DATA. Review of the current and likely future hydrological requirements for Weather Radar data
 WORLD METEOROLOGICAL ORGANIZATION COMMISSION FOR BASIC SYSTEMS OPEN PROGRAMME AREA GROUP ON INTEGRATED OBSERVING SYSTEMS WORKSHOP ON RADAR DATA EXCHANGE EXETER, UK, 24-26 APRIL 2013 CBS/OPAG-IOS/WxR_EXCHANGE/2.3
Preliminary assessment of LAWR performance in tropical regions with high intensity convective rainfall
 Preliary assessment of LAWR performance in tropical regions with high intensity convective rainfall Chris Nielsen: DHI Water and Environment (Malaysia), Fanny Dugelay, Universitéde Nice Sophia Antipolis,
Intensity-Duration-Frequency (IDF) Curves Example
 Curves Example") Intensity-Duration-Frequency (IDF) Curves Example Intensity-Duration-Frequency (IDF) curves describe the relationship between rainfall intensity, rainfall duration, and return period (or its inverse, probability
Intensity-Duration-Frequency (IDF) Curves Example Intensity-Duration-Frequency (IDF) curves describe the relationship between rainfall intensity, rainfall duration, and return period (or its inverse, probability
Extreme Rain all Frequency Analysis for Louisiana
 78 TRANSPORTATION RESEARCH RECORD 1420 Extreme Rain all Frequency Analysis for Louisiana BABAK NAGHAVI AND FANG XIN Yu A comparative study of five popular frequency distributions and three parameter estimation
NEW ZEALAND WEATHER. BRIEF REVIEW OF WINTER AND SPRING 1990 WINTER 1990 (Fig. 1) Weather and Climate (1991) 11: 31-36
 Weather and Climate (1991) 11: 31-36") Weather and Climate (1991) 11: 31-36 31 NEW ZEALAND WEATHER BRIEF REVIEW OF WINTER AND SPRING 1990 WINTER 1990 (Fig. 1) Winter 1990 was very dry in the far south. Northeasterlies brought sunny conditions
Weather and Climate (1991) 11: 31-36 31 NEW ZEALAND WEATHER BRIEF REVIEW OF WINTER AND SPRING 1990 WINTER 1990 (Fig. 1) Winter 1990 was very dry in the far south. Northeasterlies brought sunny conditions
Typical Hydrologic Period Report (Final)
") (DELCORA) (Final) November 2015 (Updated April 2016) CSO Long-Term Control Plant Update REVISION CONTROL REV. NO. DATE ISSUED PREPARED BY DESCRIPTION OF CHANGES 1 4/26/16 Greeley and Hansen Pg. 1-3,
(DELCORA) (Final) November 2015 (Updated April 2016) CSO Long-Term Control Plant Update REVISION CONTROL REV. NO. DATE ISSUED PREPARED BY DESCRIPTION OF CHANGES 1 4/26/16 Greeley and Hansen Pg. 1-3,
Waipatiki Catchment Flood Hazard Analysis. June 2008 AM 08/04 HBRC Plan Number 4029
 Waipatiki Catchment Flood Hazard Analysis June 2008 AM 08/04 HBRC Plan Number 4029 Asset Management Group Technical Report ISSN 1174 3085 Engineering Section Waipatiki Catchment: Flood Hazard Analysis
REPORT DOCUMENTATION FORM
 1 Report Number Special Report 9:23:83 Rainfall Frequency Study for Oahu: Option 1-preparation of Rainfall Frequency Maps 8Author(s)' Dr. Thomas W. Giambelluca Dr. L. Stephen Lau Dr. Yu-Si Fok Dr. Thomas
Estimation of probable maximum floods from the southern Alps, New Zealand
 Extreme Hydroloeical Events: Precipitation, Floods and Droughts (Proceedings of the Yokohama Symposium, July 1993). IAHSPubf.no. 213, 1993. 299 Estimation of probable maximum floods from the southern Alps,
FLORA: FLood estimation and forecast in complex Orographic areas for Risk mitigation in the Alpine space
 Natural Risk Management in a changing climate: Experiences in Adaptation Strategies from some European Projekts Milano - December 14 th, 2011 FLORA: FLood estimation and forecast in complex Orographic
A New Probabilistic Rational Method for design flood estimation in ungauged catchments for the State of New South Wales in Australia
 21st International Congress on Modelling and Simulation Gold Coast Australia 29 Nov to 4 Dec 215 www.mssanz.org.au/modsim215 A New Probabilistic Rational Method for design flood estimation in ungauged
How Significant is the BIAS in Low Flow Quantiles Estimated by L- and LH-Moments?
 How Significant is the BIAS in Low Flow Quantiles Estimated by L- and LH-Moments? Hewa, G. A. 1, Wang, Q. J. 2, Peel, M. C. 3, McMahon, T. A. 3 and Nathan, R. J. 4 1 University of South Australia, Mawson
The Development of Intensity-Duration Frequency Curve for Ulu Moyog and Kaiduan Station of Sabah
 Transactions on Science and Technology Vol. 4, No. 2, 149-156, 2017 The Development of Intensity-Duration Frequency Curve for Ulu Moyog and Kaiduan Station of Sabah Nicklos Jefrin 1 *, Nurmin Bolong 1,
Analysis of meteorological measurements made over three rainy seasons in Sinazongwe District, Zambia.
 Analysis of meteorological measurements made over three rainy seasons in Sinazongwe District, Zambia. 1 Hiromitsu Kanno, 2 Hiroyuki Shimono, 3 Takeshi Sakurai, and 4 Taro Yamauchi 1 National Agricultural
Improved rainfall estimates and forecasts for urban hydrological applications
 Improved rainfall estimates and forecasts for urban hydrological applications Innovyze User Days - Drainage and Flooding User Group Wallingford, 20 th June 2013 Contents 1. Context 2. Radar rainfall processing
FLOOD HAZARD AND RISK ASSESSMENT IN MID- EASTERN PART OF DHAKA, BANGLADESH
 FLOOD HAZARD AND RISK ASSESSMENT IN MID- EASTERN PART OF DHAKA, BANGLADESH Muhammad MASOOD MEE07180 Supervisor: Prof. Kuniyoshi TAKEUCHI ABSTRACT An inundation simulation has been done for the mid-eastern
National Report of New Zealand
 National Report of New Zealand Prepared for GLOSS Training Course Tokyo May 2006 Glen Rowe Data Analyst Hydrographic Services Land Information New Zealand National Office 160 Lambton Quay Wellington New
A Comparison of Rainfall Estimation Techniques
 A Comparison of Rainfall Estimation Techniques Barry F. W. Croke 1,2, Juliet K. Gilmour 2 and Lachlan T. H. Newham 2 SUMMARY: This study compares two techniques that have been developed for rainfall and
Chapter 5 CALIBRATION AND VERIFICATION
 Chapter 5 CALIBRATION AND VERIFICATION This chapter contains the calibration procedure and data used for the LSC existing conditions model. The goal of the calibration effort was to develop a hydraulic
Rainfall Analysis. Prof. M.M.M. Najim
 Rainfall Analysis Prof. M.M.M. Najim Learning Outcome At the end of this section students will be able to Estimate long term mean rainfall for a new station Describe the usage of a hyetograph Define recurrence
Comparing rainfall interpolation techniques for small subtropical urban catchments
 Comparing rainfall interpolation techniques for small subtropical urban catchments 1 Y. Knight. 1 B. Yu, 1 G. Jenkins and 2 K. Morris 1 School of Environmental Engineering, Griffith University, Nathan,
The Matata debris flows, 18 May 2005
 Monitoring, Simulation, Prevention and Remediation of Dense and Debris Flows 363 The Matata debris flows, 18 May 2005 T. Bassett Tonkin & Taylor Ltd, Auckland, New Zealand Abstract In May 2005 the eastern
High Intensity Rainfall and Potential Impacts of Climate Change in the Waiohine Catchment
 High Intensity Rainfall and Potential Impacts of Climate Change in the Waiohine Catchment NIWA Client Report: WLG29-5 February 29 NIWA Project: WRC931/1 High Intensity Rainfall and Potential Impacts of
Rainfall Frequency Estimation in England and Wales
 f r e j e c t 3 ) Rainfall Frequency Estimation in England and Wales Phase la: Survey Institute of Hydrology Crowmarsh Gifford Wallingford Oxfordshire 0X10 8BB NRA N ation al Rivers Authority R&D Note
Temporal changes in annual rainfall in the Top End of Australia
 Hydro-climatology: Variability and Change (Proceedings of symposium J-H02 held during IUGG2011 in Melbourne, Australia, July 2011) (IAHS Publ. 344, 2011). 57 Temporal changes in annual rainfall in the
A High Resolution Daily Gridded Rainfall Data Set ( ) for Mesoscale Meteorological Studies
 for Mesoscale Meteorological Studies") National Climate Centre Research Report No: 9/2008 A High Resolution Daily Gridded Rainfall Data Set (1971-2005) for Mesoscale Meteorological Studies M. Rajeevan and Jyoti Bhate National Climate Centre
National Climate Centre Research Report No: 9/2008 A High Resolution Daily Gridded Rainfall Data Set (1971-2005) for Mesoscale Meteorological Studies M. Rajeevan and Jyoti Bhate National Climate Centre
A Ngari Director Cook Islands Meteorological Service
 WORLD METEOROLOGICAL ORGANIZATION REGIONAL SEMINAR ON CLIMATE SERVICES IN REGIONAL ASSOCIATION V (SOUTH-WEST PACIFIC) Honiara, Solomon Islands, 1-4 November 2011 A Ngari Director Cook Islands Meteorological
Rainfall Analysis in Mumbai using Gumbel s Extreme Value Distribution Model
 Rainfall Analysis in Mumbai using Gumbel s Extreme Value Distribution Model S. Sangita Mishra 1, M. Solapure 2, R. Satpathy 3, K. Phadtare 4, S. Pawar 5 1 Assistant Professor, 2,3,4,5 Undergraduate students
MAXIMUM WIND GUST RETURN PERIODS FOR OKLAHOMA USING THE OKLAHOMA MESONET. Andrew J. Reader Oklahoma Climatological Survey, Norman, OK. 2.
 J3.14 MAXIMUM WIND GUST RETURN PERIODS FOR OKLAHOMA USING THE OKLAHOMA MESONET Andrew J. Reader Oklahoma Climatological Survey, Norman, OK 1. Introduction It is well known that Oklahoma experiences convective
2017 Fall Conditions Report
 2017 Fall Conditions Report Prepared by: Hydrologic Forecast Centre Date: November 15, 2017 Table of Contents TABLE OF FIGURES... ii EXECUTIVE SUMMARY... 1 BACKGROUND... 4 SUMMER AND FALL PRECIPITATION...
SHORT COMMUNICATION EXPLORING THE RELATIONSHIP BETWEEN THE NORTH ATLANTIC OSCILLATION AND RAINFALL PATTERNS IN BARBADOS
 INTERNATIONAL JOURNAL OF CLIMATOLOGY Int. J. Climatol. 6: 89 87 (6) Published online in Wiley InterScience (www.interscience.wiley.com). DOI:./joc. SHORT COMMUNICATION EXPLORING THE RELATIONSHIP BETWEEN
1990 Intergovernmental Panel on Climate Change Impacts Assessment
 1990 Intergovernmental Panel on Climate Change Impacts Assessment Although the variability of weather and associated shifts in the frequency and magnitude of climate events were not available from the
Assessment of rainfall observed by weather radar and its effect on hydrological simulation performance
 386 Hydrology in a Changing World: Environmental and Human Dimensions Proceedings of FRIED-Water 2014, Montpellier, France, October 2014 (IAHS Publ. 363, 2014). Assessment of rainfall observed by weather
Precipitation Intensity-Duration- Frequency Analysis in the Face of Climate Change and Uncertainty
 Precipitation Intensity-Duration- Frequency Analysis in the Face of Climate Change and Uncertainty Supporting Casco Bay Region Climate Change Adaptation RRAP Eugene Yan, Alissa Jared, Edom Moges Environmental
Intensity-Duration-Frequency Curves and Regionalisation
 Intensity-Duration-Frequency Curves and Regionalisation A. S. Wayal Kiran Menon* Associate Professor, Civil & Environmental Engg, VJTI, Mumbai PG Student, M. Tech. Environmental Engg, VJTI, Mumbai Abstract