A Global Water Budget Assessment
|
|
|
- Egbert Higgins
- 6 years ago
- Views:
Transcription

 Acknowledgements: Global Soil Wetness Project Phase 2 (GSWP-2) Model Participants")
1 A Global Water Budget Assessment C. Adam Schlosser and Xiang Gao Joint Program on the Science and Policy of Global Change (JP Tech. Report #179, and accepted with minor revisions to J. of Hydrometeorology) Acknowledgements: Global Soil Wetness Project Phase 2 (GSWP-2) Model Participants as well as Paul Dirmeyer (COLA) and Taikan Oki (U. of Tokyo) Chung-Lin Shie (GSSTF2b) Bob Adler, George Huffman and Co. for GPCPV2.1
2 Modern-Era Global Assessment Units kg/yr Precipitation Evaporation P-E Land Ocean 1.05E+17 ± 0.02E+17 GOLD1: 0.64E+17 ~4.0E E+17 ± 0.02E+17 GOLD2: 0.62E+17 ~4.2E E+17 ± 0.06E E E E+17 ± 0.04E E E+16 Global GPCP 4.85E+17 ± 0.06E+17 CMAP 4.74E+17 ± 0.04E+17 GSSTF2+GOLD 5.03E+17 HOAPS+GOLD 4.56E+17 ~ 2.4E+16 ~ 2.4E+16 from Schlosser and Houser, 2007 GLOBAL ANNUAL MEAN PRECIPITATION AND EVAPORATION BALANCE TO ~5%. DOES UNCERTAINTY IN GLOBAL LAND EVAPOTRANSPIRATION HELP OR HINDER?

3 Modern Era Annual Budget Can confidence in our estimates of land evapotranspiration constrain this budget? from Schlosser and Houser, 2007
4 The Second Global Soil Wetness Project (GSWP-2) (DIRMEYER ET AL., 2006, BAMS) AN ENVIRONMENTAL MODELING RESEARCH ACTIVITY TO COMPARE AND EVALUATE 10-YEAR ( ) SIMULATIONS OF GLOBAL SURFACE STATE VARIABLES AND FLUXES BY A BROAD RANGE OF LAND SURFACE MODELS UNDER CONTROLLED CONDITIONS (EXTERNALLY SPECIFIED SURFACE FORCINGS AND STANDARDIZED SOIL AND VEGETATION DISTRIBUTIONS).
5 GSWP-2 Participating Models Name Institute Nation Time step Vertical Structure 1 CLM2-TOP U. Texas USA 1hE 5mS 2 10W 10T 5S HY-SSiB GSFC USA 30m 3W 2T 2S ISBA Météo France / CNRM France 5m 3W 2T 1S Mosaic NASA / GSFC / HSB USA 30m 3W 2T 1S MOSES2 Met Office UK 30m 4W 4T 1S NOAH NOAA / NCEP / EMC USA 15m 4W 4T 1S NSIPP-Catchment NASA / GSFC / GMAO USA 20m 3W 6T 3S SiBUC SSiBCOLA Kyoto U. IGES / COLA Japan USA 1h 30m 3W 2T 1S 6W 6T 1S SWAP Russian Academy of Sciences / IWP Russia 3h 2W 1T 1S VISA U. Texas USA 3hE 5mS 2 10W 10T 5S LaD NOAA / GFDL USA 30m 1W 18T 1S ORCHIDEE IPSL France 1h 4W 7T 1S Sland U. Maryland USA 20m 1W 2T 0S BucketIIS U. Tokyo Japan 3h 1W 1T 1S LAND MODELS ARE USED IN GLOBAL CLIMATE AND WEATHER MODELS NEWS FOR PI Meeting, RESEARCH Dec. 2-3, 2009AND PREDICTION


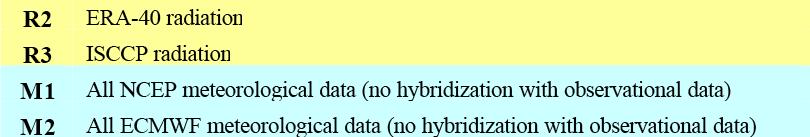
6 GSWP-2 Simulation Experiments
.")
7 MODEL RANGE IS LARGER THAN SENSITIVITY TO UNCERTAINTY IN THE ATMOSPHERIC FORCINGS (I.E. PRECIPITATION AND RADIATION).
8 CONSISTENCY OF IMPLIED GLOBAL OCEAN EVAPORATION Land Evaporation Global Precipitation Antarctica GSWP-2 GPCP CMAP 7.41E ±0.08E ±0.15E ±0.09E+17 Ocean Evaporation GPCP GSWP-2* CMAP GSWP-2* HOAPS3 GSSTF2 4.24±0.15E ±0.09E E E+17 RESIDUAL OF GLOBAL PRECIPITATION AND LAND EVAPORATION (GSWP-2 PLUS ANTARCTICA) FALLS WITHIN INDEPENDENT ESTIMATES OF GLOBAL OCEAN EVAPORATION. Units in kg/year


9
 of GSWP-2 Evapotranspiration Baseline Simulations")
10 GSWP-2 Annual Latent Heat Flux (W/m 2 ) Baseline Simulations Multi-Mean Model Mean Dirmeyer et al., 2006 AREAS OF PROMINENT SCATTER IN TROPICS AND NORTHERN HIGH LATITUDES Standard Deviation (mm/day) of GSWP-2 Evapotranspiration Baseline Simulations SOURCES OF MODEL INCONSISTENCY: SEASONAL? AND/OR INTER-ANNUAL?

11 Consistency in Evapotranspiration Results from Global Soil Wetness Project Phase 2 (GSWP-2) Inter-Model Correlation of Evapotranspiration Unfiltered Timeseries Annual Cycle Removed SCATTER (I.E. RMS DIFFERENCES AMONGST MODELS) RESULT OF SEASONAL INCONSISTENCIES IN TROPICS AND INCONSISTENCIES OF INTERANNUAL VARIATIONS AT HIGH (NORTHERN) LATITUDES. LOCATIONS OF MOST SIGNIFICANT MODEL INCONSISTENCIES WITH LOW DENSITY OF STATION DATA. Schlosser and Gao, 2009

12 Consistency in Runoff Simulations Global Soil Wetness Project Phase 2 (GSWP-2) Inter-Model Correlation of Runoff Unfiltered Timeseries SIMILAR TO EVAPOTRANSPIRATION, A DECAY IN CONSENSUS AMONG THE MODELS IN THE INTER- ANNUAL VARIATIONS OF RUNOFF AT HIGH LATITUDES IS FOUND. ALSO AGREEMENT IN THIS IMPORTANT HYDROLOGIC FLUX IS NOT AS ROBUST AS COMPARED TO EVAPOTRANSPIRATION. Annual Cycle Removed
13 DATA SYNTHESIS PRECIPITATION ( ): GLOBAL PRECIPITATION CLIMATOLOGY PROJECT (GPCP): ADLER ET AL., (2003) VERSIONS 2.0 AND 2.1 CPC MERGED ANALYSIS OF PRECIPITATION (CMAP): XIE AND ARKIN (1997) OCEAN EVAPORATION ( ): GODDARD SATELLITE-BASED SURFACE TURBULENT FLUXES VERSION 2 GSSTF2: CHOU ET AL., (2003) GSSTF2B: CHUNG-LIN SHIE, PERSONAL COMMUNICATION HAMBURG OCEAN ATMOSPHERE PARAMETERS AND FLUXES FROM SATELLITES HOAPS-G: BENTAMY ET AL. (2003) AND FAIRALL ET AL. (1996) VERSIONS 2.0 AND 3.0 LAND EVAPORATION: GLOBAL SOIL WETNESS PROJECT PHASE 2 (GSWP2): GLOBAL LAND MODELS FORCED WITH ISLSCP II DATA AT 1 RESOLUTION Atmospheric Budget: dq / dt = E P div(q t ) for global-scale analysis, Div(Q t ) ~ 0 and dq / dt = E P PRECIPITABLE WATER ( NEAR PRESENT): NASA GLOBAL WATER VAPOR PROJECT (NVAP): VONDER HARR ET AL. (2003) AIRS/AMSR-E: E. FETZER AND NEWS COLLABORATORS

14 Balance & Consistency of Global Annual Fluxes
 1988-1999")
15 GSSTF2b - GSSTF2 (W/m 2 ) Averages
16 GPCP2.1 - GPCP2.0 (mm/day) Averages
17 5.40E+17!""#$%&'(!")*&+!*,*+!")*&(-./*"0+!")*&(!""#$+!*,*%& E E E E E E E
 for")
 ~ 0 and dq / dt")
18 Atmospheric Budget: dq / dt = E P div(q t ) for global-scale analysis, Div(Q t ) ~ 0 and dq / dt = E P
19 3.0E+15 Global E-P Fluxes and Atmospheric Storage Change (kg/month) Mean Annual Cycle: E E E E E E E E E E+15 Jan!"#$%&'()$"%*!$+$, Feb Mar Apr May!"#$%&!""-.*!$+$, Jun Jul Aug Sep Oct /0)$, Nov Dec Jan!"#$%&!""-.%1*!$+$0%23, NEWS PI Meeting, )45", Dec. 2-3, 2009
20 CLOSING REMARKS GSWP-2 EVAPOTRANSPIRATION ESTIMATES CONSTRAIN A MODERN-ERA GLOBAL WATER BUDGET TO WITHIN ±2.5%, BUT CANNOT EXPLAIN THE IMBALANCE. INCONSISTENCIES IN SEASONAL VARIATIONS SEEN. INTER-MODEL TEMPORAL INCONSISTENCIES ARE LARGEST FOR (NORTHERN) HIGH LATITUDE INTER-ANNUAL VARIATIONS AS WELL AS FOR THE INTER-SEASONAL VARIATIONS IN THE TROPICS. LARGEST IMPROVEMENTS IN MODEL-BASED ESTIMATES WILL BE DELIVERED THROUGH REFINEMENTS IN THE NUMERICAL RECIPES - NOT IMPROVEMENTS IN ATMOSPHERIC FORCING. VARIATIONS OF ATMOSPHERIC STORAGE ARE ROUGHLY 0.01% OF GLOBAL PRECIPITATION OR EVAPORATION. THUS, THE SCATTER OF THE GSWP-2 EVAPOTRANSPIRATION (2.5%) SEEMS QUITE UNSATISFACTORY. HOWEVER - RIGOROUS ERROR ESTIMATES IN WATER VAPOR RETRIEVALS REMAIN ELUSIVE. EMPHASIS TO IMPROVE HIGH-LATITUDE (COLD-SEASON) PROCESSES, AS LOW DENSITY OF DATA EXISTS. FUTURE FIELD EXPERIMENTS NEED TO AUGMENT THE LOW DATA-DENSITY AREAS, AND MUST SATISFY MULTITUDE OF OBSERVATIONAL REQUIREMENTS SPANNING BIOGEOPHYSICAL AND BIOGEOCHEMICAL PROCESSES: CARBON CYCLING AND THE BIOGEOCHEMISTRY OF PEATLANDS AND THE DOMINANT PLANT-TYPE OF PEATLANDS: BRYOPHYTES (I.E. NON-VASCULAR PLANTS WITH NO ROOTS OR VASCULAR SYSTEMS). SNOW, FROZEN SOIL & INTERPLAY WITH NON-FROZEN SOIL HYDRO-THERMAL PROCESSES
Information Server for the Global Soil Wetness Project Phase II
 1 Information Server for the Global Soil Wetness Project Phase II *T. Oki, N. Hanasaki, Y. Shen, S. Kanae, K. Masuda, and P.A. Dirmeyer *Institute of Industrial Science, University of Tokyo Asian Water
Analysis of multi-year global evapotranspiration datasets and IPCC AR4 model simulations: Results from the LandFlux-EVAL project
 ETH Zürich Analysis of multi-year global evapotranspiration datasets and AR4 model simulations: Results from the LandFlux-EVAL project Brigitte Mueller S. I. Seneviratne, C. Jimenez, T. Corti, W. Dorigo,
Impacts of climate change on flooding in the river Meuse
 Impacts of climate change on flooding in the river Meuse Martijn Booij University of Twente,, The Netherlands m.j.booij booij@utwente.nlnl 2003 in the Meuse basin Model appropriateness Appropriate model
Presentation Overview. Southwestern Climate: Past, present and future. Global Energy Balance. What is climate?
 Southwestern Climate: Past, present and future Mike Crimmins Climate Science Extension Specialist Dept. of Soil, Water, & Env. Science & Arizona Cooperative Extension The University of Arizona Presentation
Chiang Rai Province CC Threat overview AAS1109 Mekong ARCC
 Chiang Rai Province CC Threat overview AAS1109 Mekong ARCC This threat overview relies on projections of future climate change in the Mekong Basin for the period 2045-2069 compared to a baseline of 1980-2005.
GAMINGRE 8/1/ of 7
 FYE 09/30/92 JULY 92 0.00 254,550.00 0.00 0 0 0 0 0 0 0 0 0 254,550.00 0.00 0.00 0.00 0.00 254,550.00 AUG 10,616,710.31 5,299.95 845,656.83 84,565.68 61,084.86 23,480.82 339,734.73 135,893.89 67,946.95
Climate Variability in South Asia
 Climate Variability in South Asia V. Niranjan, M. Dinesh Kumar, and Nitin Bassi Institute for Resource Analysis and Policy Contents Introduction Rainfall variability in South Asia Temporal variability
Today s Lecture: Land, biosphere, cryosphere (All that stuff we don t have equations for... )
") Today s Lecture: Land, biosphere, cryosphere (All that stuff we don t have equations for... ) 4 Land, biosphere, cryosphere 1. Introduction 2. Atmosphere 3. Ocean 4. Land, biosphere, cryosphere 4.1 Land
Today s Lecture: Land, biosphere, cryosphere (All that stuff we don t have equations for... ) 4 Land, biosphere, cryosphere 1. Introduction 2. Atmosphere 3. Ocean 4. Land, biosphere, cryosphere 4.1 Land
1. Header Land-Atmosphere Predictability Using a Multi-Model Strategy Paul A. Dirmeyer (PI) Zhichang Guo (Co-I) Final Report
 Zhichang Guo (Co-I) Final Report") 1. Header Land-Atmosphere Predictability Using a Multi-Model Strategy Paul A. Dirmeyer (PI) Zhichang Guo (Co-I) Final Report 2. Results and Accomplishments Output from multiple land surface schemes (LSS)
1. Header Land-Atmosphere Predictability Using a Multi-Model Strategy Paul A. Dirmeyer (PI) Zhichang Guo (Co-I) Final Report 2. Results and Accomplishments Output from multiple land surface schemes (LSS)
Description of Precipitation Retrieval Algorithm For ADEOS II AMSR
 Description of Precipitation Retrieval Algorithm For ADEOS II Guosheng Liu Florida State University 1. Basic Concepts of the Algorithm This algorithm is based on Liu and Curry (1992, 1996), in which the
Climate Change and Arizona s Rangelands: Management Challenges and Opportunities
 Climate Change and Arizona s Rangelands: Management Challenges and Opportunities Mike Crimmins Climate Science Extension Specialist Dept. of Soil, Water, & Env. Science & Arizona Cooperative Extension
GLOBAL LAND DATA ASSIMILATION SYSTEM (GLDAS) PRODUCTS FROM NASA HYDROLOGY DATA AND INFORMATION SERVICES CENTER (HDISC) INTRODUCTION
 PRODUCTS FROM NASA HYDROLOGY DATA AND INFORMATION SERVICES CENTER (HDISC) INTRODUCTION") GLOBAL LAND DATA ASSIMILATION SYSTEM (GLDAS) PRODUCTS FROM NASA HYDROLOGY DATA AND INFORMATION SERVICES CENTER (HDISC) Hongliang Fang, Patricia L. Hrubiak, Hiroko Kato, Matthew Rodell, William L. Teng,
GLOBAL LAND DATA ASSIMILATION SYSTEM (GLDAS) PRODUCTS FROM NASA HYDROLOGY DATA AND INFORMATION SERVICES CENTER (HDISC) Hongliang Fang, Patricia L. Hrubiak, Hiroko Kato, Matthew Rodell, William L. Teng,
Climatic and Ecological Conditions in the Klamath Basin of Southern Oregon and Northern California: Projections for the Future
 Climatic and Ecological Conditions in the Klamath Basin of Southern Oregon and Northern California: Projections for the Future A Collaborative Effort by: CLIMATE LEADERSHIP INITIATIVE INSTITUTE FOR A SUSTAINABLE
Global Ocean Freshwater Flux Components from Satellite, Re-analysis and In-Situ Climatologies
 Global Ocean Freshwater Flux Components from Satellite, Re-analysis and In-Situ Climatologies Axel Andersson1, Christian Klepp2, Stephan Bakan1, Karsten Fennig3, Jörg Schulz4 1 Max-Planck-Institut für
Supplementary Figure S1: Uncertainty of runoff changes Assessments of. R [mm/yr/k] for each model and the ensemble mean.
![Supplementary Figure S1: Uncertainty of runoff changes Assessments of. R [mm/yr/k] for each model and the ensemble mean.](/thumbs/91/104794017.jpg "Supplementary Figure S1: Uncertainty of runoff changes Assessments of. R [mm/yr/k] for each model and the ensemble mean.") Supplementary Figure S1: Uncertainty of runoff changes Assessments of R [mm/yr/k] for each model and the ensemble mean. 1 Supplementary Figure S2: Schematic diagrams of methods The top panels show uncertainty
Supplementary Figure S1: Uncertainty of runoff changes Assessments of R [mm/yr/k] for each model and the ensemble mean. 1 Supplementary Figure S2: Schematic diagrams of methods The top panels show uncertainty
Land Data Assimilation at NCEP NLDAS Project Overview, ECMWF HEPEX 2004
 Dag.Lohmann@noaa.gov, Land Data Assimilation at NCEP NLDAS Project Overview, ECMWF HEPEX 2004 Land Data Assimilation at NCEP: Strategic Lessons Learned from the North American Land Data Assimilation System
Global Climates. Name Date
 Global Climates Name Date No investigation of the atmosphere is complete without examining the global distribution of the major atmospheric elements and the impact that humans have on weather and climate.
Technical Note: Hydrology of the Lake Chilwa wetland, Malawi
 Technical Note: Hydrology of the Lake Chilwa wetland, Malawi Matthew McCartney June 27 Description Lake Chilwa is located in the Southern region of Malawi on the country s eastern boarder with Mozambique
An Overview of Atmospheric Analyses and Reanalyses for Climate
 An Overview of Atmospheric Analyses and Reanalyses for Climate Kevin E. Trenberth NCAR Boulder CO Analysis Data Assimilation merges observations & model predictions to provide a superior state estimate.
Estimating Evaporation : Principles, Assumptions and Myths. Raoul J. Granger, NWRI
 Estimating Evaporation : Principles, Assumptions and Myths Raoul J. Granger, NWRI Evaporation So what is it anyways? Evaporation is the phenomenon by which a substance is converted from the liquid or solid
2009 Progress Report To The National Aeronautics and Space Administration NASA Energy and Water Cycle Study (NEWS) Program
 Program") 2009 Progress Report To The National Aeronautics and Space Administration NASA Energy and Water Cycle Study (NEWS) Program Proposal Title: Grant Number: PI: The Challenges of Utilizing Satellite Precipitation
2009 Progress Report To The National Aeronautics and Space Administration NASA Energy and Water Cycle Study (NEWS) Program Proposal Title: Grant Number: PI: The Challenges of Utilizing Satellite Precipitation
Climate Change or Climate Variability?
 Climate Change or Climate Variability? Key Concepts: Greenhouse Gas Climate Climate change Climate variability Climate zones Precipitation Temperature Water cycle Weather WHAT YOU WILL LEARN 1. You will
REGIONAL CLIMATE SIMULATION OVER ASIA UNDER THE GLOBAL WARMING NESTED IN THE CCSR/NIES AGCM
 REGIONAL CLIMATE SIMULATION OVER ASIA UNDER THE GLOBAL WARMING NESTED IN THE CCSR/NIES AGCM KOJI DAIRAKU Atmospheric Environment Division, National Institute for Environmental Studies, 16-2 Onogawa Tsukuba,
The Cryosphere Radiative Effect in CESM. Justin Perket Mark Flanner CESM Polar Climate Working Group Meeting Wednesday June 19, 2013
 The Cryosphere Radiative Effect in CESM Justin Perket Mark Flanner CESM Polar Climate Working Group Meeting Wednesday June 19, 2013 Cryosphere Radiative Effect (CrRE) A new diagnostic feature is available
Assimilation of satellite derived soil moisture for weather forecasting
 Assimilation of satellite derived soil moisture for weather forecasting www.cawcr.gov.au Imtiaz Dharssi and Peter Steinle February 2011 SMOS/SMAP workshop, Monash University Summary In preparation of the
6.2 VALIDATION OF THE GSWP2 BASELINE SIMULATION. Kenji Tanaka, Kazuaki Yorozu, Ryo Hamabe, Shuichi Ikebuchi Kyoto University, Japan
 6.2 VALIDATION OF THE GSWP2 BASELINE SIMULATION Kenji Tanaka, Kazuaki Yorozu, Ryo Hamabe, Shuichi Ikebuchi Kyoto University, Japan 1. INTRODUCTION Global Soil Wetness Project (GSWP) is open to anyone with
Climatography of the United States No
 Climate Division: AK 5 NWS Call Sign: ANC Month (1) Min (2) Month(1) Extremes Lowest (2) Temperature ( F) Lowest Month(1) Degree s (1) Base Temp 65 Heating Cooling 90 Number of s (3) Jan 22.2 9.3 15.8
Inter-linkage case study in Pakistan
 7 th GEOSS Asia Pacific Symposium GEOSS AWCI Parallel Session: 26-28 May, 2014, Tokyo, Japan Inter-linkage case study in Pakistan Snow and glaciermelt runoff modeling in Upper Indus Basin of Pakistan Maheswor
Interaction of North American Land Data Assimilation System and National Soil Moisture Network: Soil Products and Beyond
 Interaction of North American Land Data Assimilation System and National Soil Moisture Network: Soil Products and Beyond Youlong Xia 1,2, Michael B. Ek 1, Yihua Wu 1,2, Christa Peters-Lidard 3, David M.
Land Analysis in the NOAA CFS Reanalysis. Michael Ek, Ken Mitchell, Jesse Meng Helin Wei, Rongqian Yang, and George Gayno
 Land Analysis in the NOAA CFS Reanalysis Michael Ek, Ken Mitchell, Jesse Meng Helin Wei, Rongqian Yang, and George Gayno 1 Outline CFS Reanalysis execution Land surface model upgrade from OSU to Noah LIS/GLDAS
The Global Precipitation Climatology Project (GPCP) CDR AT NOAA: Research to Real-time Climate Monitoring
 CDR AT NOAA: Research to Real-time Climate Monitoring") The Global Precipitation Climatology Project (GPCP) CDR AT NOAA: Research to Real-time Climate Monitoring Robert Adler, Matt Sapiano, Guojun Gu University of Maryland Pingping Xie (NCEP/CPC), George Huffman
The Global Precipitation Climatology Project (GPCP) CDR AT NOAA: Research to Real-time Climate Monitoring Robert Adler, Matt Sapiano, Guojun Gu University of Maryland Pingping Xie (NCEP/CPC), George Huffman
Atmospheric Sciences 321. Science of Climate. Lecture 14: Surface Energy Balance Chapter 4
 Atmospheric Sciences 321 Science of Climate Lecture 14: Surface Energy Balance Chapter 4 Community Business Check the assignments HW #4 due Today, HW#5 is posted Quiz Today on Chapter 3, too. Mid Term
Atmospheric circulation analysis for seasonal forecasting
 Training Seminar on Application of Seasonal Forecast GPV Data to Seasonal Forecast Products 18 21 January 2011 Tokyo, Japan Atmospheric circulation analysis for seasonal forecasting Shotaro Tanaka Climate
A preliminary study of global water and energy cycles in a NASA reanalysis system
 A preliminary study of global water and energy cycles in a NASA reanalysis system Junye Chen (1,2) and Michael G. Bosilovich (2) 1 ESSIC, University of Maryland; 2 GMAO, GSFC NASA 1 INTRODUCTION Global
Supporting Information for Relation of the double-itcz bias to the atmospheric energy budget in climate models
 GEOPHYSICAL RESEARCH LETTERS Supporting Information for Relation of the double-itcz bias to the atmospheric energy budget in climate models Ori Adam 1, Tapio Schneider 1,2, Florent Brient 1, and Tobias
A Report on a Statistical Model to Forecast Seasonal Inflows to Cowichan Lake
 A Report on a Statistical Model to Forecast Seasonal Inflows to Cowichan Lake Prepared by: Allan Chapman, MSc, PGeo Hydrologist, Chapman Geoscience Ltd., and Former Head, BC River Forecast Centre Victoria
Climate also has a large influence on how local ecosystems have evolved and how we interact with them.
 The Mississippi River in a Changing Climate By Paul Lehman, P.Eng., General Manager Mississippi Valley Conservation (This article originally appeared in the Mississippi Lakes Association s 212 Mississippi
Investigate the influence of the Amazon rainfall on westerly wind anomalies and the 2002 Atlantic Nino using QuikScat, Altimeter and TRMM data
 Investigate the influence of the Amazon rainfall on westerly wind anomalies and the 2002 Atlantic Nino using QuikScat, Altimeter and TRMM data Rong Fu 1, Mike Young 1, Hui Wang 2, Weiqing Han 3 1 School
Climate Modeling Research & Applications in Wales. John Houghton. C 3 W conference, Aberystwyth
 Climate Modeling Research & Applications in Wales John Houghton C 3 W conference, Aberystwyth 26 April 2011 Computer Modeling of the Atmosphere & Climate System has revolutionized Weather Forecasting and
Turbulent fluxes. Sensible heat flux. Momentum flux = Wind stress ρc D (U-U s ) 2. Latent heat flux. ρc p C H (U-U s ) (T s -T a )
 2. Latent heat flux. ρc p C H (U-U s ) (T s -T a )") Intertropical ocean-atmosphere coupling in a state of the art Earth System Model: Evaluating the representation of turbulent air-sea fluxes in IPSL-CM5A Alina Găinuşă-Bogdan, Pascale Braconnot Laboratoire
Intertropical ocean-atmosphere coupling in a state of the art Earth System Model: Evaluating the representation of turbulent air-sea fluxes in IPSL-CM5A Alina Găinuşă-Bogdan, Pascale Braconnot Laboratoire
The 2 nd phase of the Global Land-Atmosphere Coupling Experiment. Randal Koster GMAO, NASA/GSFC
 The 2 nd phase of the Global Land-Atmosphere Coupling Experiment Randal Koster GMAO, NASA/GSFC randal.d.koster@nasa.gov GLACE-1 was a successful international modeling project that looked at soil moisture
Geostatistical Analysis of Rainfall Temperature and Evaporation Data of Owerri for Ten Years
 Atmospheric and Climate Sciences, 2012, 2, 196-205 http://dx.doi.org/10.4236/acs.2012.22020 Published Online April 2012 (http://www.scirp.org/journal/acs) Geostatistical Analysis of Rainfall Temperature
Climate Roles of Land Surface
 Lecture 5: Land Surface and Cryosphere (Outline) Climate Roles Surface Energy Balance Surface Water Balance Sea Ice Land Ice (from Our Changing Planet) Surface Albedo Climate Roles of Land Surface greenhouse
Seasonal Hydrometeorological Ensemble Prediction System: Forecast of Irrigation Potentials in Denmark
 Seasonal Hydrometeorological Ensemble Prediction System: Forecast of Irrigation Potentials in Denmark Diana Lucatero 1*, Henrik Madsen 2, Karsten H. Jensen 1, Jens C. Refsgaard 3, Jacob Kidmose 3 1 University
Quenching the Valley s thirst: The connection between Sierra Nevada snowpack & regional water supply
 Quenching the Valley s thirst: The connection between Sierra Nevada snowpack & regional water supply Roger Bales, UC Merced Snow conditions Snow & climate change Research directions Sierra Nevada snow
Impact of sea surface temperatures on African climate. Alessandra Giannini
 Impact of sea surface temperatures on African climate Alessandra Giannini alesall@iri.columbia.edu Outline: Intro/Motivation: demand-driven science, use of seasonal climate prediction, adaptation to climate
2016 Meteorology Summary
 2016 Meteorology Summary New Jersey Department of Environmental Protection AIR POLLUTION AND METEOROLOGY Meteorology plays an important role in the distribution of pollution throughout the troposphere,
Implementation of Land Information System in the NCEP Operational Climate Forecast System CFSv2. Jesse Meng, Michael Ek, Rongqian Yang, Helin Wei
 Implementation of Land Information System in the NCEP Operational Climate Forecast System CFSv2 Jesse Meng, Michael Ek, Rongqian Yang, Helin Wei 1 Outline NCEP CFSRR Land component CFSv1 vs CFSv2 Land
GPC Exeter forecast for winter Crown copyright Met Office
 GPC Exeter forecast for winter 2015-2016 Global Seasonal Forecast System version 5 (GloSea5) ensemble prediction system the source for Met Office monthly and seasonal forecasts uses a coupled model (atmosphere
Inter- Annual Land Surface Variation NAGS 9329
 Annual Report on NASA Grant 1 Inter- Annual Land Surface Variation NAGS 9329 PI Stephen D. Prince Co-I Yongkang Xue April 2001 Introduction This first period of operations has concentrated on establishing
Climatography of the United States No
 Month (1) Min (2) Month(1) Extremes Lowest (2) Temperature ( F) Lowest Month(1) Degree s (1) Base Temp 65 Heating Cooling 100 Number of s (3) Jan 63.9 39.3 51.6 86 1976 16 56.6 1986 20 1976 2 47.5 1973
Climatography of the United States No
 Temperature ( F) Month (1) Min (2) Month(1) Extremes Lowest (2) Lowest Month(1) Degree s (1) Base Temp 65 Heating Cooling 100 Number of s (3) Jan 32.8 21.7 27.3 62 1918 1 35.8 1983-24 1950 29 10.5 1979
GKSS. The Inter-Continental Transferability Study. as part of CEOP/GEWEX FORSCHUNGSZENTRUM PAGE
 The Inter-Continental Transferability Study as part of CEOP/GEWEX 1 Objectives Study the transferability of regional climate models to areas of different climate regimes (RHP domains) Apply CEOP data (satellite,
Simulations of Lake Processes within a Regional Climate Model
 Simulations of Lake Processes within a Regional Climate Model Jiming Jin Departments of Watershed Sciences and Plants, Soils, and Climate Utah State University, Logan, Utah Utah State University 850 Faculty
Fine-scale climate projections for Utah from statistical downscaling of global climate models
 Fine-scale climate projections for Utah from statistical downscaling of global climate models Thomas Reichler Department of Atmospheric Sciences, U. of Utah thomas.reichler@utah.edu Three questions A.
Climatography of the United States No
 Climate Division: CA 4 NWS Call Sign: Month (1) Min (2) Month(1) Extremes Lowest (2) Temperature ( F) Lowest Month(1) Degree s (1) Base Temp 65 Heating Cooling 100 Number of s (3) Jan 55.6 39.3 47.5 77
Climatography of the United States No
 Climate Division: CA 5 NWS Call Sign: Month (1) Min (2) Month(1) Extremes Lowest (2) Temperature ( F) Lowest Month(1) Degree s (1) Base Temp 65 Heating Cooling 100 Number of s (3) Jan 56.6 36.5 46.6 81
Climatography of the United States No
 Climate Division: CA 1 NWS Call Sign: Month (1) Min (2) Month(1) Extremes Lowest (2) Temperature ( F) Lowest Month(1) Degree s (1) Base Temp 65 Heating Cooling 100 Number of s (3) Jan 57.9 38.9 48.4 85
Climatography of the United States No
 Climate Division: CA 5 NWS Call Sign: Month (1) Min (2) Month(1) Extremes Lowest (2) Temperature ( F) Lowest Month(1) Degree s (1) Base Temp 65 Heating Cooling 100 Number of s (3) Jan 44.8 25.4 35.1 72
Climatography of the United States No
 Climate Division: CA 4 NWS Call Sign: Month (1) Min (2) Month(1) Extremes Lowest (2) Temperature ( F) Lowest Month(1) Degree s (1) Base Temp 65 Heating Cooling 100 Number of s (3) Jan 49.4 37.5 43.5 73
Climatography of the United States No
 Climate Division: CA 6 NWS Call Sign: Month (1) Min (2) Month(1) Extremes Lowest (2) Temperature ( F) Lowest Month(1) Degree s (1) Base Temp 65 Heating Cooling 100 Number of s (3) Jan 69.4 46.6 58.0 92
Climatography of the United States No
 Climate Division: CA 4 NWS Call Sign: Month (1) Min (2) Month(1) Extremes Lowest (2) Temperature ( F) Lowest Month(1) Degree s (1) Base Temp 65 Heating Cooling 1 Number of s (3) Jan 58.5 38.8 48.7 79 1962
Climatography of the United States No
 Climate Division: CA 6 NWS Call Sign: Month (1) Min (2) Month(1) Extremes Lowest (2) Temperature ( F) Lowest Month(1) Degree s (1) Base Temp 65 Heating Cooling 1 Number of s (3) Jan 67.5 42. 54.8 92 1971
Climatography of the United States No
 Climate Division: CA 1 NWS Call Sign: Month (1) Min (2) Month(1) Extremes Lowest (2) Temperature ( F) Lowest Month(1) Degree s (1) Base Temp 65 Heating Cooling 1 Number of s (3) Jan 57.8 39.5 48.7 85 1962
Variability of Reference Evapotranspiration Across Nebraska
 Know how. Know now. EC733 Variability of Reference Evapotranspiration Across Nebraska Suat Irmak, Extension Soil and Water Resources and Irrigation Specialist Kari E. Skaggs, Research Associate, Biological
Amita Mehta and Ana Prados
 Building Capacity in Utilizing NASA Remote Sensing Observations in SWAT for Water Resources and Agricultural Management Applications Amita Mehta and Ana Prados NASA - University of Maryland Baltimore County
The Arctic Energy Budget
 The Arctic Energy Budget The global heat engine [courtesy Kevin Trenberth, NCAR]. Differential solar heating between low and high latitudes gives rise to a circulation of the atmosphere and ocean that
Climatography of the United States No
 Climate Division: ND 8 NWS Call Sign: BIS Month (1) Min (2) Month(1) Extremes Lowest (2) Temperature ( F) Lowest Month(1) Degree s (1) Base Temp 65 Heating Cooling 100 Number of s (3) Jan 21.1 -.6 10.2
Climatography of the United States No
 Climate Division: TN 1 NWS Call Sign: Month (1) Min (2) Month(1) Extremes Lowest (2) Temperature ( F) Lowest Month(1) Degree s (1) Base Temp 65 Heating Cooling 100 Number of s (3) Jan 47.6 24.9 36.3 81
Implications of Climate Change on Long Lead Forecasting and Global Agriculture. Ray Motha
 Implications of Climate Change on Long Lead Forecasting and Global Agriculture Ray Motha Source: http://www.coaps.fsu.edu/lib/climatoons/toon38.shtml ENSO Teleconnections 30 Observed Monthly Sea Surface
Climatography of the United States No
 Climate Division: CA 5 NWS Call Sign: FAT Month (1) Min (2) Month(1) Extremes Lowest (2) Temperature ( F) Lowest Month(1) Degree s (1) Base Temp 65 Heating Cooling 1 Number of s (3) Jan 53.6 38.4 46. 78
Missouri River Basin Water Management Monthly Update
 Missouri River Basin Water Management Monthly Update Participating Agencies 255 255 255 237 237 237 0 0 0 217 217 217 163 163 163 200 200 200 131 132 122 239 65 53 80 119 27 National Oceanic and Atmospheric
Climatography of the United States No
 Climate Division: CA 6 NWS Call Sign: 1L2 N Lon: 118 3W Month (1) Min (2) Month(1) Extremes Lowest (2) Temperature ( F) Lowest Month(1) Degree s (1) Base Temp 65 Heating Cooling 1 Number of s (3) Jan 63.7
Climatography of the United States No
 Climate Division: CA 5 NWS Call Sign: BFL Month (1) Min (2) Month(1) Extremes Lowest (2) Temperature ( F) Lowest Month(1) Degree s (1) Base Temp 65 Heating Cooling 1 Number of s (3) Jan 56.3 39.3 47.8
Aquarius Data Release V2.0 Validation Analysis Gary Lagerloef, Aquarius Principal Investigator H. Kao, ESR And Aquarius Cal/Val Team
 Aquarius Data Release V2.0 Validation Analysis Gary Lagerloef, Aquarius Principal Investigator H. Kao, ESR And Aquarius Cal/Val Team Analysis period: Sep 2011-Dec 2012 SMOS-Aquarius Workshop 15-17 April
What Measures Can Be Taken To Improve The Understanding Of Observed Changes?
 What Measures Can Be Taken To Improve The Understanding Of Observed Changes? Convening Lead Author: Roger Pielke Sr. (Colorado State University) Lead Author: David Parker (U.K. Met Office) Lead Author:
Evapo-transpiration Losses Produced by Irrigation in the Snake River Basin, Idaho
 Nov 7, 2007 DRAFT Evapo-transpiration Losses Produced by Irrigation in the Snake River Basin, Idaho Wendell Tangborn and Birbal Rana HyMet Inc. Vashon Island, WA Abstract An estimated 8 MAF (million acre-feet)
Technical Note: Hydrology of the Lukanga Swamp, Zambia
 Technical Note: Hydrology of the Lukanga Swamp, Zambia Matthew McCartney July 7 Description The Lukanga swamp is located approximately 5km west of the city of Kabwe, in the Central province of Zambia,
Promoting Rainwater Harvesting in Caribbean Small Island Developing States Water Availability Mapping for Grenada Preliminary findings
 Promoting Rainwater Harvesting in Caribbean Small Island Developing States Water Availability Mapping for Grenada Preliminary findings National Workshop Pilot Project funded by The United Nations Environment
Introduction to Climate ~ Part I ~
 2015/11/16 TCC Seminar JMA Introduction to Climate ~ Part I ~ Shuhei MAEDA (MRI/JMA) Climate Research Department Meteorological Research Institute (MRI/JMA) 1 Outline of the lecture 1. Climate System (
Assimilating Earth System Observations at NASA: MERRA and Beyond
 Assimilating Earth System Observations at NASA: MERRA and Beyond Siegfried Schubert, Michael Bosilovich, Michele Rienecker, Max Suarez, Ron Gelaro, Randy Koster, Julio Bacmeister, Ricardo Todling, Larry
Climatography of the United States No
 Climate Division: TN 3 NWS Call Sign: BNA Month (1) Min (2) Month(1) Extremes Lowest (2) Temperature ( F) Lowest Month(1) Degree s (1) Base Temp 65 Heating Cooling 100 Number of s (3) Jan 45.6 27.9 36.8
Course , General Circulation of the Earth's Atmosphere Prof. Peter Stone Section 4: Water Vapor Budget
 Course 12.812, General Circulation of the Earth's Atmosphere Prof. Peter Stone Section 4: Water Vapor Budget Water Vapor Distribution First let us look at the distribution of specific humidity, q. The
Changing Hydrology under a Changing Climate for a Coastal Plain Watershed
 Changing Hydrology under a Changing Climate for a Coastal Plain Watershed David Bosch USDA-ARS, Tifton, GA Jeff Arnold ARS Temple, TX and Peter Allen Baylor University, TX SEWRU Objectives 1. Project changes
Climatography of the United States No
 Climate Division: CA 5 NWS Call Sign: Elevation: 6 Feet Lat: 37 Month (1) Min (2) Month(1) Extremes Lowest (2) Temperature ( F) Lowest Month(1) Degree s (1) Base Temp 65 Heating Cooling 1 Number of s (3)
Climatography of the United States No
 Climate Division: CA 4 NWS Call Sign: Elevation: 2 Feet Lat: 37 Month (1) Min (2) Month(1) Extremes Lowest (2) Temperature ( F) Lowest Month(1) Degree s (1) Base Temp 65 Heating Cooling 1 Number of s (3)
Climatography of the United States No
 Climate Division: CA 4 NWS Call Sign: Elevation: 13 Feet Lat: 36 Month (1) Min (2) Month(1) Extremes Lowest (2) Temperature ( F) Lowest Month(1) Degree s (1) Base Temp 65 Heating Cooling 1 Number of s
Climatography of the United States No
 Climate Division: CA 5 NWS Call Sign: Elevation: 1,14 Feet Lat: 36 Month (1) Min (2) Month(1) Extremes Lowest (2) Temperature ( F) Lowest Month(1) Degree s (1) Base Temp 65 Heating Cooling 1 Number of
Introduction. Observed Local Trends. Temperature Rainfall Tropical Cyclones. Projections for the Philippines. Temperature Rainfall
 PAGASA-DOST ntroduction Observed Local Trends Temperature Rainfall Tropical Cyclones Projections for the Philippines Temperature Rainfall Climate Change ssue ncreased use of fossil fuel Global Warming
Interannual variation of MODIS NDVI in Lake Taihu and its relation to climate in submerged macrophyte region
 Yale-NUIST Center on Atmospheric Environment Interannual variation of MODIS NDVI in Lake Taihu and its relation to climate in submerged macrophyte region ZhangZhen 2015.07.10 1 Outline Introduction Data
Science Standard 1: Students analyze monthly precipitation and temperature records, displayed in bar charts, collected in metric units (mm).
.") Title: Precipitation Patterns across the Globe NSF GK-12 Fellow: Terry Legg Type of Lesson: STEM Grade Level(s): 4 th - 7 th grade This activity can be tailored to older, more advanced students by having
Title: Precipitation Patterns across the Globe NSF GK-12 Fellow: Terry Legg Type of Lesson: STEM Grade Level(s): 4 th - 7 th grade This activity can be tailored to older, more advanced students by having
The effect of ocean mixed layer depth on climate in slab ocean aquaplanet ABSTRACT
 Climate Dynamics manuscript No. (will be inserted by the editor) 1 2 The effect of ocean mixed layer depth on climate in slab ocean aquaplanet experiments. 3 Aaron Donohoe Dargan Frierson 4 5 Manuscript
1.0 Implications of using daily climatological wind speed prior to 1948
 Supplemental Material 1.0 Implications of using daily climatological wind speed prior to 1948 As detailed in the manuscript, NCEP-NCAR reanalysis wind data were used for the period 1948/01/01-2011/12/31.
Climatography of the United States No
 Climate Division: CA 6 NWS Call Sign: LAX Elevation: 1 Feet Lat: 33 Month (1) Min (2) Month(1) Extremes Lowest (2) Temperature ( F) Lowest Month(1) Degree s (1) Base Temp 65 Heating Cooling 1 Number of
Climatography of the United States No
 Climate Division: CA 6 NWS Call Sign: TOA Elevation: 11 Feet Lat: 33 2W Temperature ( F) Month (1) Min (2) Month(1) Extremes Lowest (2) Lowest Month(1) Degree s (1) Base Temp 65 Heating Cooling 1 Number
MET 3102-U01 PHYSICAL CLIMATOLOGY (ID 17901) Lecture 14
 Lecture 14") MET 3102-U01 PHYSICAL CLIMATOLOGY (ID 17901) Lecture 14 The hydrologic cycle evaporation vapor transport precipitation precipitation evaporation runoff Evaporation, precipitation, etc. in cm Vapor transported
MET 3102-U01 PHYSICAL CLIMATOLOGY (ID 17901) Lecture 14 The hydrologic cycle evaporation vapor transport precipitation precipitation evaporation runoff Evaporation, precipitation, etc. in cm Vapor transported
Combining sensor and forecast information to aid decision making: real-time determination of hydrological peat fire risk in Kalimantan
 Combining sensor and forecast information to aid decision making: real-time determination of hydrological peat fire risk in Kalimantan Jaap Schellekens Based on work by: Aljosja Hooijer, Ronald Vernimmen,
Eddy and Chlorophyll-a Structure in the Kuroshio Extension Detected from Altimeter and SeaWiFS
 14th Symposium on Integrated Observing and Assimilation Systems for the Atmosphere, Oceans, and Land Surface (IOAS-AOLS), AMS Atlanta, January 17-21, 21 Eddy and Chlorophyll-a Structure in the Kuroshio
Missouri River Basin Water Management Monthly Update
 Missouri River Basin Water Management Monthly Update Participating Agencies 255 255 255 237 237 237 0 0 0 217 217 217 163 163 163 200 200 200 131 132 122 239 65 53 80 119 27 National Oceanic and Atmospheric
Climate Validation of MERRA
 Climate Validation of MERRA Siegfried Schubert, Michael Bosilovich, Michele Rienecker, Max Suarez, Randy Koster, Yehui Chang, Derek Van Pelt, Larry Takacs, Man-Li Wu, Myong-In Lee, Scott Weaver, Junye