Seasonal Hydrometeorological Ensemble Prediction System: Forecast of Irrigation Potentials in Denmark
|
|
|
- Lionel O’Brien’
- 5 years ago
- Views:
Transcription

1 Seasonal Hydrometeorological Ensemble Prediction System: Forecast of Irrigation Potentials in Denmark Diana Lucatero 1*, Henrik Madsen 2, Karsten H. Jensen 1, Jens C. Refsgaard 3, Jacob Kidmose 3 1 University of Copenhagen, Copenhagen, Denmark 2 DHI, Horsholm, Denmark 3 GEUS, Copenhagen, Denmark HEPEX 10th Anniversary Workshop 26 June 2014 Maryland, USA Dias 1
2 OUTLINE HydroCast Project and Seasonal Forecasting Irrigation permissions in Denmark ECMWF Seasonal meteorological EPS System 4 For the near future Summary and Conclusions Dias 2


3 HydroCast Project and Seasonal Forecasting Objective: Develop and test new forecasting and DA tools that combine different data sources with meteorological and hydrological modelling to provide probabilistic hydrological forecasts Dias 3


4 Irrigation permissions in Denmark How are the extraction for irrigations permits now defined? Impact of -10% on median of yearly minimum streamflow Issued for 15 years Areas where extraction must be reduced due to exceeded impact on streamflow How are they expecting to define them? Dias 4
5 ECMWF Seasonal meteorological EPS System 4 TIME AVAILABILITY - 20 years reforecast data, Forecast every month (01/MM/YYYY) - 7 month forecast FIELDS AVAILABLE meter temperature, 6h, (deg K). Solar Radiation 228 Precipitation, 24 h, accumulated (mm). ENSEMBLES AVAILABLE 51 members (02,05,08,11) 15 members (rest) 24 April 2014 DMI, Copenhagen Dias 5
 Observations 10 km -")
 24 April 2014")
6 ECMWF Seasonal meteorological EPS System 4 EPS deg, -80 km northing (approx) Observations 10 km - Precipitation rate (mm/day) -Temperature (deg C) -Reference Evapotranspiration (mm/day) 24 April 2014 DMI, Copenhagen Dias 6
7 ECMWF Seasonal meteorological EPS System 4: Downscaling, bias correction Linear Scaling of precipitation and temperature (Teutschbein and Seibert, 2012) -> Corrects biases on the mean -> Simplest approach, straightforward to implement 24 April 2014 DMI, Copenhagen Dias 7 -> Monthly mean of daily precipitation, observed values m = 1, 2,..., 12 -> Monthly mean of daily precipitation, forecast values -> Raw forecast of daily precipitation -> Corrected forecast of daily precipitation

8 ECMWF Seasonal meteorological EPS System 4: PRECIPITATION Jan Feb Mar Apr May Jun Jul Aug Dias 8 Sep Oct Nov Dec

9 ECMWF Seasonal meteorological EPS System 4: TEMPERATURE Jan Feb Mar Apr May Jun Jul Aug Dias 9 Sep Oct Nov Dec
10 ECMWF Seasonal meteorological EPS System 4: Skill assessment Reliability Diagrams Brier Skill Score -> BSsys4 vs Bsclim Climatology -> 20 year observed data Verification experiments -Verification A: Raw vs corrected ensembles, different lead times - Verification B: Corrected ensembles, different seasons Probability thresholds -> a) <= below T b) >= above T (dry, cold) (wet, warm) - Verification C: Corrected ensembles, different regions in Denmark (west, east) Dias 10


 T uncorrected T")

11 BSS BSS Department of Geography & Geology ECMWF Seasonal meteorological EPS System 4: Skill assessment PCP uncorrected PCP corrected BSS Brier Skill Score for ECMWF S4 corrected not corrected Lead time (Month) T uncorrected T corrected BSS Brier Skill Score for ECMWF S4 corrected not corrected Dias Lead time (Month)

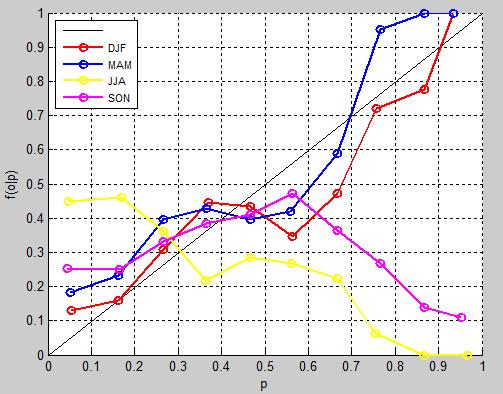
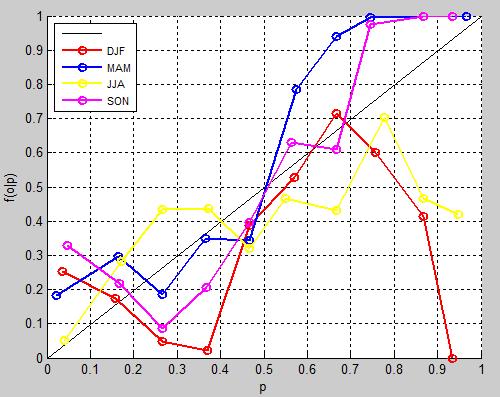
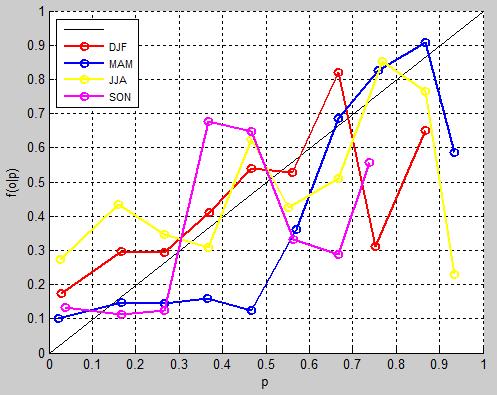
12 ECMWF Seasonal meteorological EPS System 4: Skill assessment, corrected PCP dry PCP wet T cold T warm Dias 12


13 For the near future Meteo Bias + Skill assessment Hydro modelling Risk Analysis Decision making for irrigation permissions -Other sophisticated bias correction methods? Dias 13
14 Conclusions and Summary Assessment of meteorological inputs: - Improvement of bias corrected ensembles - Good skill for the first month lead time, decreases as time evolves - Good skill for winter and spring precipitation, not so much for summer and autumn - Good skill for temperature, except warm temperatures during summer (further investigation) Combination of skillful meteo inputs + better initial conditions for better forecasting - Analysis of the influence of both How do we translate probabilistic information about discharge and groundwater levels into efficient irrigation permit amounts? - Decision making process - Meeting and continuous feedback between the researh team and with potential users Dias 14
15 Thank you! QUESTIONS? Dias 15
APPLICATIONS OF DOWNSCALING: HYDROLOGY AND WATER RESOURCES EXAMPLES
 APPLICATIONS OF DOWNSCALING: HYDROLOGY AND WATER RESOURCES EXAMPLES Dennis P. Lettenmaier Department of Civil and Environmental Engineering For presentation at Workshop on Regional Climate Research NCAR
GAMINGRE 8/1/ of 7
 FYE 09/30/92 JULY 92 0.00 254,550.00 0.00 0 0 0 0 0 0 0 0 0 254,550.00 0.00 0.00 0.00 0.00 254,550.00 AUG 10,616,710.31 5,299.95 845,656.83 84,565.68 61,084.86 23,480.82 339,734.73 135,893.89 67,946.95
Chiang Rai Province CC Threat overview AAS1109 Mekong ARCC
 Chiang Rai Province CC Threat overview AAS1109 Mekong ARCC This threat overview relies on projections of future climate change in the Mekong Basin for the period 2045-2069 compared to a baseline of 1980-2005.
Seasonal Climate Watch April to August 2018
 Seasonal Climate Watch April to August 2018 Date issued: Mar 23, 2018 1. Overview The El Niño-Southern Oscillation (ENSO) is expected to weaken from a moderate La Niña phase to a neutral phase through
Standardized Anomaly Model Output Statistics Over Complex Terrain.
 Standardized Anomaly Model Output Statistics Over Complex Terrain Reto.Stauffer@uibk.ac.at Outline statistical ensemble postprocessing introduction to SAMOS new snow amount forecasts in Tyrol sub-seasonal
YACT (Yet Another Climate Tool)? The SPI Explorer
? The SPI Explorer") YACT (Yet Another Climate Tool)? The SPI Explorer Mike Crimmins Assoc. Professor/Extension Specialist Dept. of Soil, Water, & Environmental Science The University of Arizona Yes, another climate tool for
YACT (Yet Another Climate Tool)? The SPI Explorer Mike Crimmins Assoc. Professor/Extension Specialist Dept. of Soil, Water, & Environmental Science The University of Arizona Yes, another climate tool for
Changing Hydrology under a Changing Climate for a Coastal Plain Watershed
 Changing Hydrology under a Changing Climate for a Coastal Plain Watershed David Bosch USDA-ARS, Tifton, GA Jeff Arnold ARS Temple, TX and Peter Allen Baylor University, TX SEWRU Objectives 1. Project changes
Seasonal Climate Watch June to October 2018
 Seasonal Climate Watch June to October 2018 Date issued: May 28, 2018 1. Overview The El Niño-Southern Oscillation (ENSO) has now moved into the neutral phase and is expected to rise towards an El Niño
Climatography of the United States No
 Climate Division: AK 5 NWS Call Sign: ANC Month (1) Min (2) Month(1) Extremes Lowest (2) Temperature ( F) Lowest Month(1) Degree s (1) Base Temp 65 Heating Cooling 90 Number of s (3) Jan 22.2 9.3 15.8
Climate Forecasts and Forecast Uncertainty
 Climate Forecasts and Forecast Uncertainty Holly Hartmann Department of Hydrology and Water Resources University of Arizona, Tucson 520-626-8523 hollyh@hwr.arizona.edu CLIMAS-SAHRA press briefing August
Assessment of Ensemble Forecasts
 Assessment of Ensemble Forecasts S. L. Mullen Univ. of Arizona HEPEX Workshop, 7 March 2004 Talk Overview Ensemble Performance for Precipitation Global EPS and Mesoscale 12 km RSM Biases, Event Discrimination
UPPLEMENT A COMPARISON OF THE EARLY TWENTY-FIRST CENTURY DROUGHT IN THE UNITED STATES TO THE 1930S AND 1950S DROUGHT EPISODES
 UPPLEMENT A COMPARISON OF THE EARLY TWENTY-FIRST CENTURY DROUGHT IN THE UNITED STATES TO THE 1930S AND 1950S DROUGHT EPISODES Richard R. Heim Jr. This document is a supplement to A Comparison of the Early
Seasonal Forecasts of River Flow in France
 Seasonal Forecasts of River Flow in France Laurent Dubus 1, Saïd Qasmi 1, Joël Gailhard 2, Amélie Laugel 1 1 EDF R&D (Research & Development Division) 2 EDF DTG (hydro-meteorological forecasting division)
Seasonal Climate Watch July to November 2018
 Seasonal Climate Watch July to November 2018 Date issued: Jun 25, 2018 1. Overview The El Niño-Southern Oscillation (ENSO) is now in a neutral phase and is expected to rise towards an El Niño phase through
Climate also has a large influence on how local ecosystems have evolved and how we interact with them.
 The Mississippi River in a Changing Climate By Paul Lehman, P.Eng., General Manager Mississippi Valley Conservation (This article originally appeared in the Mississippi Lakes Association s 212 Mississippi
Predictability of Sudden Stratospheric Warmings in sub-seasonal forecast models
 Predictability of Sudden Stratospheric Warmings in sub-seasonal forecast models Alexey Karpechko Finnish Meteorological Institute with contributions from A. Charlton-Perez, N. Tyrrell, M. Balmaseda, F.
J11.5 HYDROLOGIC APPLICATIONS OF SHORT AND MEDIUM RANGE ENSEMBLE FORECASTS IN THE NWS ADVANCED HYDROLOGIC PREDICTION SERVICES (AHPS)
") J11.5 HYDROLOGIC APPLICATIONS OF SHORT AND MEDIUM RANGE ENSEMBLE FORECASTS IN THE NWS ADVANCED HYDROLOGIC PREDICTION SERVICES (AHPS) Mary Mullusky*, Julie Demargne, Edwin Welles, Limin Wu and John Schaake
J11.5 HYDROLOGIC APPLICATIONS OF SHORT AND MEDIUM RANGE ENSEMBLE FORECASTS IN THE NWS ADVANCED HYDROLOGIC PREDICTION SERVICES (AHPS) Mary Mullusky*, Julie Demargne, Edwin Welles, Limin Wu and John Schaake
Climatography of the United States No
 Month (1) Min (2) Month(1) Extremes Lowest (2) Temperature ( F) Lowest Month(1) Degree s (1) Base Temp 65 Heating Cooling 100 Number of s (3) Jan 63.9 39.3 51.6 86 1976 16 56.6 1986 20 1976 2 47.5 1973
Climatography of the United States No
 Temperature ( F) Month (1) Min (2) Month(1) Extremes Lowest (2) Lowest Month(1) Degree s (1) Base Temp 65 Heating Cooling 100 Number of s (3) Jan 32.8 21.7 27.3 62 1918 1 35.8 1983-24 1950 29 10.5 1979
S e a s o n a l F o r e c a s t i n g f o r t h e E u r o p e a n e n e r g y s e c t o r
 S e a s o n a l F o r e c a s t i n g f o r t h e E u r o p e a n e n e r g y s e c t o r C3S European Climatic Energy Mixes (ECEM) Webinar 18 th Oct 2017 Philip Bett, Met Office Hadley Centre S e a s
Drought Monitoring in Mainland Portugal
 Drought Monitoring in Mainland Portugal 1. Accumulated precipitation since 1st October 2014 (Hydrological Year) The accumulated precipitation amount since 1 October 2014 until the end of April 2015 (Figure
Time Series Analysis
 Time Series Analysis A time series is a sequence of observations made: 1) over a continuous time interval, 2) of successive measurements across that interval, 3) using equal spacing between consecutive
Five years of limited-area ensemble activities at ARPA-SIM: the COSMO-LEPS system
 Five years of limited-area ensemble activities at ARPA-SIM: the COSMO-LEPS system Andrea Montani, Chiara Marsigli and Tiziana Paccagnella ARPA-SIM Hydrometeorological service of Emilia-Romagna, Italy 11
Supplementary appendix
 Supplementary appendix This appendix formed part of the original submission and has been peer reviewed. We post it as supplied by the authors. Supplement to: Lowe R, Stewart-Ibarra AM, Petrova D, et al.
Climatography of the United States No
 Climate Division: CA 4 NWS Call Sign: Month (1) Min (2) Month(1) Extremes Lowest (2) Temperature ( F) Lowest Month(1) Degree s (1) Base Temp 65 Heating Cooling 100 Number of s (3) Jan 55.6 39.3 47.5 77
Climatography of the United States No
 Climate Division: CA 5 NWS Call Sign: Month (1) Min (2) Month(1) Extremes Lowest (2) Temperature ( F) Lowest Month(1) Degree s (1) Base Temp 65 Heating Cooling 100 Number of s (3) Jan 56.6 36.5 46.6 81
Climatography of the United States No
 Climate Division: CA 1 NWS Call Sign: Month (1) Min (2) Month(1) Extremes Lowest (2) Temperature ( F) Lowest Month(1) Degree s (1) Base Temp 65 Heating Cooling 100 Number of s (3) Jan 57.9 38.9 48.4 85
Climatography of the United States No
 Climate Division: CA 5 NWS Call Sign: Month (1) Min (2) Month(1) Extremes Lowest (2) Temperature ( F) Lowest Month(1) Degree s (1) Base Temp 65 Heating Cooling 100 Number of s (3) Jan 44.8 25.4 35.1 72
Climatography of the United States No
 Climate Division: CA 4 NWS Call Sign: Month (1) Min (2) Month(1) Extremes Lowest (2) Temperature ( F) Lowest Month(1) Degree s (1) Base Temp 65 Heating Cooling 100 Number of s (3) Jan 49.4 37.5 43.5 73
Climatography of the United States No
 Climate Division: CA 6 NWS Call Sign: Month (1) Min (2) Month(1) Extremes Lowest (2) Temperature ( F) Lowest Month(1) Degree s (1) Base Temp 65 Heating Cooling 100 Number of s (3) Jan 69.4 46.6 58.0 92
Climatography of the United States No
 Climate Division: CA 4 NWS Call Sign: Month (1) Min (2) Month(1) Extremes Lowest (2) Temperature ( F) Lowest Month(1) Degree s (1) Base Temp 65 Heating Cooling 1 Number of s (3) Jan 58.5 38.8 48.7 79 1962
Climatography of the United States No
 Climate Division: CA 6 NWS Call Sign: Month (1) Min (2) Month(1) Extremes Lowest (2) Temperature ( F) Lowest Month(1) Degree s (1) Base Temp 65 Heating Cooling 1 Number of s (3) Jan 67.5 42. 54.8 92 1971
Climatography of the United States No
 Climate Division: CA 1 NWS Call Sign: Month (1) Min (2) Month(1) Extremes Lowest (2) Temperature ( F) Lowest Month(1) Degree s (1) Base Temp 65 Heating Cooling 1 Number of s (3) Jan 57.8 39.5 48.7 85 1962
A Report on a Statistical Model to Forecast Seasonal Inflows to Cowichan Lake
 A Report on a Statistical Model to Forecast Seasonal Inflows to Cowichan Lake Prepared by: Allan Chapman, MSc, PGeo Hydrologist, Chapman Geoscience Ltd., and Former Head, BC River Forecast Centre Victoria
Climatography of the United States No
 Climate Division: ND 8 NWS Call Sign: BIS Month (1) Min (2) Month(1) Extremes Lowest (2) Temperature ( F) Lowest Month(1) Degree s (1) Base Temp 65 Heating Cooling 100 Number of s (3) Jan 21.1 -.6 10.2
Climatography of the United States No
 Climate Division: TN 1 NWS Call Sign: Month (1) Min (2) Month(1) Extremes Lowest (2) Temperature ( F) Lowest Month(1) Degree s (1) Base Temp 65 Heating Cooling 100 Number of s (3) Jan 47.6 24.9 36.3 81
Climatography of the United States No
 Climate Division: CA 5 NWS Call Sign: FAT Month (1) Min (2) Month(1) Extremes Lowest (2) Temperature ( F) Lowest Month(1) Degree s (1) Base Temp 65 Heating Cooling 1 Number of s (3) Jan 53.6 38.4 46. 78
Climatography of the United States No
 Climate Division: CA 6 NWS Call Sign: 1L2 N Lon: 118 3W Month (1) Min (2) Month(1) Extremes Lowest (2) Temperature ( F) Lowest Month(1) Degree s (1) Base Temp 65 Heating Cooling 1 Number of s (3) Jan 63.7
Climatography of the United States No
 Climate Division: CA 5 NWS Call Sign: BFL Month (1) Min (2) Month(1) Extremes Lowest (2) Temperature ( F) Lowest Month(1) Degree s (1) Base Temp 65 Heating Cooling 1 Number of s (3) Jan 56.3 39.3 47.8
Conditional weather resampling for ensemble streamflow forecasting
 Conditional weather resampling for ensemble streamflow forecasting Joost Beckers, Albrecht Weerts (Deltares Delft) Edwin Welles (Deltares USA) Ann McManamon (BPA) HEPEX 10 th anniversary workshop Washington
Climatography of the United States No
 Climate Division: TN 3 NWS Call Sign: BNA Month (1) Min (2) Month(1) Extremes Lowest (2) Temperature ( F) Lowest Month(1) Degree s (1) Base Temp 65 Heating Cooling 100 Number of s (3) Jan 45.6 27.9 36.8
Climatography of the United States No
 Climate Division: CA 5 NWS Call Sign: Elevation: 6 Feet Lat: 37 Month (1) Min (2) Month(1) Extremes Lowest (2) Temperature ( F) Lowest Month(1) Degree s (1) Base Temp 65 Heating Cooling 1 Number of s (3)
Climatography of the United States No
 Climate Division: CA 4 NWS Call Sign: Elevation: 2 Feet Lat: 37 Month (1) Min (2) Month(1) Extremes Lowest (2) Temperature ( F) Lowest Month(1) Degree s (1) Base Temp 65 Heating Cooling 1 Number of s (3)
Climatography of the United States No
 Climate Division: CA 4 NWS Call Sign: Elevation: 13 Feet Lat: 36 Month (1) Min (2) Month(1) Extremes Lowest (2) Temperature ( F) Lowest Month(1) Degree s (1) Base Temp 65 Heating Cooling 1 Number of s
Climatography of the United States No
 Climate Division: CA 5 NWS Call Sign: Elevation: 1,14 Feet Lat: 36 Month (1) Min (2) Month(1) Extremes Lowest (2) Temperature ( F) Lowest Month(1) Degree s (1) Base Temp 65 Heating Cooling 1 Number of
5.2 PRE-PROCESSING OF ATMOSPHERIC FORCING FOR ENSEMBLE STREAMFLOW PREDICTION
 5.2 PRE-PROCESSING OF ATMOSPHERIC FORCING FOR ENSEMBLE STREAMFLOW PREDICTION John Schaake*, Sanja Perica, Mary Mullusky, Julie Demargne, Edwin Welles and Limin Wu Hydrology Laboratory, Office of Hydrologic
ALASKA REGION CLIMATE OUTLOOK BRIEFING. December 22, 2017 Rick Thoman National Weather Service Alaska Region
 ALASKA REGION CLIMATE OUTLOOK BRIEFING December 22, 2017 Rick Thoman National Weather Service Alaska Region Today s Outline Feature of the month: Autumn sea ice near Alaska Climate Forecast Basics Climate
Promoting Rainwater Harvesting in Caribbean Small Island Developing States Water Availability Mapping for Grenada Preliminary findings
 Promoting Rainwater Harvesting in Caribbean Small Island Developing States Water Availability Mapping for Grenada Preliminary findings National Workshop Pilot Project funded by The United Nations Environment
Climatography of the United States No
 Climate Division: CA 6 NWS Call Sign: LAX Elevation: 1 Feet Lat: 33 Month (1) Min (2) Month(1) Extremes Lowest (2) Temperature ( F) Lowest Month(1) Degree s (1) Base Temp 65 Heating Cooling 1 Number of
Variability and trends in daily minimum and maximum temperatures and in diurnal temperature range in Lithuania, Latvia and Estonia
 Variability and trends in daily minimum and maximum temperatures and in diurnal temperature range in Lithuania, Latvia and Estonia Jaak Jaagus Dept. of Geography, University of Tartu Agrita Briede Dept.
Climatography of the United States No
 Climate Division: CA 6 NWS Call Sign: TOA Elevation: 11 Feet Lat: 33 2W Temperature ( F) Month (1) Min (2) Month(1) Extremes Lowest (2) Lowest Month(1) Degree s (1) Base Temp 65 Heating Cooling 1 Number
Akira Ito & Staffs of seasonal forecast sector
 Exercise : Producing site-specific guidance using domestic data Akira Ito & Staffs of seasonal forecast sector Climate Prediction Division Japan Meteorological Agency TCC Training Seminar on One-month
Climatography of the United States No
 No. 2 1971-2 Asheville, North Carolina 2881 COOP ID: 46646 Climate Division: CA 4 NWS Call Sign: 8W Month (1) Min (2) Month(1) Extremes Lowest (2) Temperature ( F) Lowest Month(1) Degree s (1) Base Temp
Climatography of the United States No
 No. 2 1971-2 Asheville, North Carolina 2881 COOP ID: 4792 Climate Division: CA 6 NWS Call Sign: Month (1) Min (2) Month(1) Extremes Lowest (2) Temperature ( F) Lowest Month(1) Degree s (1) Base Temp 65
Climatography of the United States No
 Month (1) Min (2) Month(1) Extremes Lowest (2) Temperature ( F) Lowest Month(1) Degree s (1) Base Temp 65 Heating Cooling 100 Number of s (3) 42.6 24.2 33.4 79 1950 25 44.2 1974-16 1994 19 18.8 1977 977
Climatography of the United States No
 Month (1) Min (2) Month(1) Extremes Lowest (2) Temperature ( F) Lowest Month(1) Degree s (1) Base Temp 65 Heating Cooling 100 Number of s (3) Jan 54.3 40.1 47.2 75 1998 17 53.0 1995 18 1949 11 41.7 1972
Climatography of the United States No
 No. 2 1971-2 Asheville, North Carolina 2881 COOP ID: 43417 Climate Division: CA 4 NWS Call Sign: N Lon: 121 Month (1) Min (2) Month(1) Extremes Lowest (2) Temperature ( F) Lowest Month(1) Degree s (1)
Climatography of the United States No
 No. 2 1971-2 Asheville, North Carolina 2881 COOP ID: 4795 Climate Division: CA 6 NWS Call Sign: SBA Month (1) Min (2) Month(1) Extremes Lowest (2) Temperature ( F) Lowest Month(1) Degree s (1) Base Temp
Climatography of the United States No
 Climate Division: CA 6 NWS Call Sign: Month (1) Min (2) Month(1) Extremes Lowest (2) Temperature ( F) Lowest Month(1) Degree s (1) Base Temp 65 Heating Cooling 100 Number of s (3) Jan 51.5 35.0 43.3 80
Climatography of the United States No
 Climate Division: CA 5 NWS Call Sign: Month (1) Min (2) Month(1) Extremes Lowest (2) Temperature ( F) Lowest Month(1) Degree s (1) Base Temp 65 Heating Cooling 100 Number of s (3) 59.3 31.5 45.4 80 1976
Climatography of the United States No
 Climate Division: CA 7 NWS Call Sign: Month (1) Min (2) Month(1) Extremes Lowest (2) Temperature ( F) Lowest Month(1) Degree s (1) Base Temp 65 Heating Cooling 100 Number of s (3) 44.5 29.3 36.9 69 1951
Climatography of the United States No
 Climate Division: CA 2 NWS Call Sign: Month (1) Min (2) Month(1) Extremes Lowest (2) Temperature ( F) Lowest Month(1) Degree s (1) Base Temp 65 Heating Cooling 100 Number of s (3) 53.3 37.1 45.2 77 1962
Climatography of the United States No
 Climate Division: CA 2 NWS Call Sign: Month (1) Min (2) Month(1) Extremes Lowest (2) Temperature ( F) Lowest Month(1) Degree s (1) Base Temp 65 Heating Cooling 100 Number of s (3) 53.3 31.8 42.6 74+ 1975
Climatography of the United States No
 Climate Division: CA 2 NWS Call Sign: Month (1) Min (2) Month(1) Extremes Lowest (2) Temperature ( F) Lowest Month(1) Degree s (1) Base Temp 65 Heating Cooling 100 Number of s (3) 53.7 32.7 43.2 79 1962
Climatography of the United States No
 Climate Division: CA 6 NWS Call Sign: Month (1) Min (2) Month(1) Extremes Lowest (2) Temperature ( F) Lowest Month(1) Degree s (1) Base Temp 65 Heating Cooling 100 Number of s (3) 68.5 45.7 57.1 90 1971
Climatography of the United States No
 Climate Division: CA 7 NWS Call Sign: Month (1) Min (2) Month(1) Extremes Lowest (2) Temperature ( F) Lowest Month(1) Degree s (1) Base Temp 65 Heating Cooling 100 Number of s (3) 56.0 35.7 45.9 83 1975
Climatography of the United States No
 Climate Division: CA 7 NWS Call Sign: Month (1) Min (2) Month(1) Extremes Lowest (2) Temperature ( F) Lowest Month(1) Degree s (1) Base Temp 65 Heating Cooling 1 Number of s (3) 64.8 45.4 55.1 85 1971
Climatography of the United States No
 Climate Division: CA 7 NWS Call Sign: Month (1) Min (2) Month(1) Extremes Lowest (2) Temperature ( F) Lowest Month(1) Degree s (1) Base Temp 65 Heating Cooling 1 Number of s (3) 65.5 38.7 52.1 87 1962
Climatography of the United States No
 Climate Division: CA 7 NWS Call Sign: Month (1) Min (2) Month(1) Extremes Lowest (2) Temperature ( F) Lowest Month(1) Degree s (1) Base Temp 65 Heating Cooling 100 Number of s (3) 58.8 34.3 46.6 81+ 1948
Climatography of the United States No
 Climate Division: CA 7 NWS Call Sign: Month (1) Min (2) Month(1) Extremes Lowest (2) Temperature ( F) Lowest Month(1) Degree s (1) Base Temp 65 Heating Cooling 100 Number of s (3) 70.4 44.2 57.3 95 1971
Climatography of the United States No
 Climate Division: CA 1 NWS Call Sign: Month (1) Min (2) Month(1) Extremes Lowest (2) Temperature ( F) Lowest Month(1) Degree s (1) Base Temp 65 Heating Cooling 100 Number of s (3) Jan 52.4 35.4 43.9 69
Climatography of the United States No
 Climate Division: CA 4 NWS Call Sign: Month (1) Min (2) Month(1) Extremes Lowest (2) Temperature ( F) Lowest Month(1) Degree s (1) Base Temp 65 Heating Cooling 100 Number of s (3) Jan 61.9 42.0 52.0 89
Climatography of the United States No
 Climate Division: CA 2 NWS Call Sign: Month (1) Min (2) Month(1) Extremes Lowest (2) Temperature ( F) Lowest Month(1) Degree s (1) Base Temp 65 Heating Cooling 100 Number of s (3) Jan 55.6 38.8 47.2 81
Climatography of the United States No
 Climate Division: CA 2 NWS Call Sign: Month (1) Min (2) Month(1) Extremes Lowest (2) Temperature ( F) Lowest Month(1) Degree s (1) Base Temp 65 Heating Cooling 100 Number of s (3) Jan 53.5 37.6 45.6 78
Climatography of the United States No
 Climate Division: CA 6 NWS Call Sign: Month (1) Min (2) Month(1) Extremes Lowest (2) Temperature ( F) Lowest Month(1) Degree s (1) Base Temp 65 Heating Cooling 100 Number of s (3) Jan 66.1 38.3 52.2 91
Climatography of the United States No
 Climate Division: CA 1 NWS Call Sign: Month (1) Min (2) Month(1) Extremes Lowest (2) Temperature ( F) Lowest Month(1) Degree s (1) Base Temp 65 Heating Cooling 1 Number of s (3) Jan 56.2 4.7 48.5 79 1962
Climatography of the United States No
 Climate Division: CA 1 NWS Call Sign: Month (1) Min (2) Month(1) Extremes Lowest (2) Temperature ( F) Lowest Month(1) Degree s (1) Base Temp 65 Heating Cooling 100 Number of s (3) Jan 50.2 31.2 40.7 65+
Climatography of the United States No
 Climate Division: CA 4 NWS Call Sign: Month (1) Min (2) Month(1) Extremes Lowest (2) Temperature ( F) Lowest Month(1) Degree s (1) Base Temp 65 Heating Cooling 100 Number of s (3) Jan 61.4 33.1 47.3 82+
Drought forecasting and warning in Africa Some experiences & thoughts from the DEWFORA project
 Drought forecasting and warning in Africa Some experiences & thoughts from the DEWFORA project Micha Werner 1 & Gilbert Ouma 2 1 Deltares & UNESCO-IHE, the Netherlands 2 ICPAC & University of Nairobi,
2003 Water Year Wrap-Up and Look Ahead
 2003 Water Year Wrap-Up and Look Ahead Nolan Doesken Colorado Climate Center Prepared by Odie Bliss http://ccc.atmos.colostate.edu Colorado Average Annual Precipitation Map South Platte Average Precipitation
Climatography of the United States No
 No. 2 1971-2 Asheville, North Carolina 2881 COOP ID: 46175 Climate Division: CA 6 NWS Call Sign: 3L3 Elevation: 1 Feet Lat: 33 Month (1) Min (2) Month(1) Extremes Lowest (2) Temperature ( F) Lowest Month(1)
Climatography of the United States No
 No. 2 1971-2 Asheville, North Carolina 2881 COOP ID: 42713 Climate Division: CA 7 NWS Call Sign: Elevation: -3 Feet Lat: 32 Month (1) Min (2) Month(1) Extremes Lowest (2) Temperature ( F) Lowest Month(1)
Climatography of the United States No
 Climate Division: CA 4 NWS Call Sign: Month (1) Min (2) Month(1) Extremes Lowest (2) Temperature ( F) Lowest Month(1) Degree s (1) Base Temp 65 Heating Cooling 100 Number of s (3) Jan 56.4 43.6 50.0 77
Climatography of the United States No
 Climate Division: CA 7 NWS Call Sign: Month (1) Min (2) Month(1) Extremes Lowest (2) Temperature ( F) Lowest Month(1) Degree s (1) Base Temp 65 Heating Cooling 100 Number of s (3) Jan 54.4 36.9 45.7 77+
JMA s Seasonal Prediction of South Asian Climate for Summer 2018
 JMA s Seasonal Prediction of South Asian Climate for Summer 2018 Atsushi Minami Tokyo Climate Center (TCC) Japan Meteorological Agency (JMA) Contents Outline of JMA s Seasonal Ensemble Prediction System
Folsom Dam Water Control Manual Update Joint Federal Project, Folsom Dam
 Folsom Dam Water Control Manual Update Joint Federal Project, Folsom Dam Public Workshop May 25, 2016 Sacramento Library Galleria 828 I Street, Sacramento, CA US Army Corps of Engineers BUILDING STRONG
Climatography of the United States No
 Climate Division: SC 7 NWS Call Sign: CHS Month (1) Min (2) Month(1) Extremes Lowest (2) Temperature ( F) Lowest Month(1) Degree s (1) Base Temp 65 Heating Cooling 100 Number of s (3) Jan 58.9 36.9 47.9
Developing Operational MME Forecasts for Subseasonal Timescales
 Developing Operational MME Forecasts for Subseasonal Timescales Dan C. Collins NOAA Climate Prediction Center (CPC) Acknowledgements: Stephen Baxter and Augustin Vintzileos (CPC and UMD) 1 Outline I. Operational
LINKING SEASONAL FORECASTS TO USER NEEDS IN THE LIMPOPO BASIN IN SOUTHERN AFRICA
 LINKING SEASONAL FORECASTS TO USER NEEDS IN THE LIMPOPO BASIN IN SOUTHERN AFRICA Micha Werner 1,2* Patricia Trambauer 2 Hessel Winsemius 1 Shreedhar Maskey 2 Florian Pappenberger 3 Emanuel Dutra 3 Plus
Communicating Climate Change Consequences for Land Use
 Communicating Climate Change Consequences for Land Use Site: Prabost, Skye. Event: Kyle of Lochalsh, 28 th February 28 Further information: http://www.macaulay.ac.uk/ladss/comm_cc_consequences.html Who
Global Flood Awareness System GloFAS
 Global Flood Awareness System GloFAS Ervin Zsoter with the help of the whole EFAS/GloFAS team Ervin.Zsoter@ecmwf.int 1 Reading, 8-9 May 2018 What is GloFAS? Global-scale ensemble-based flood forecasting
DROUGHT IN MAINLAND PORTUGAL
 DROUGHT IN MAINLAND Ministério da Ciência, Tecnologia e Ensino Superior Instituto de Meteorologia, I. P. Rua C Aeroporto de Lisboa Tel.: (351) 21 844 7000 e-mail:informacoes@meteo.pt 1749-077 Lisboa Portugal
Constructing a typical meteorological year -TMY for Voinesti fruit trees region and the effects of global warming on the orchard ecosystem
 Constructing a typical meteorological year -TMY for Voinesti fruit trees region and the effects of global warming on the orchard ecosystem ARMEANU ILEANA*, STĂNICĂ FLORIN**, PETREHUS VIOREL*** *University
Hydrologic Ensemble Prediction: Challenges and Opportunities
 Hydrologic Ensemble Prediction: Challenges and Opportunities John Schaake (with lots of help from others including: Roberto Buizza, Martyn Clark, Peter Krahe, Tom Hamill, Robert Hartman, Chuck Howard,
Operational use of ensemble hydrometeorological forecasts at EDF (french producer of energy)
") Operational use of ensemble hydrometeorological forecasts at EDF (french producer of energy) M. Le Lay, P. Bernard, J. Gailhard, R. Garçon, T. Mathevet & EDF forecasters matthieu.le-lay@edf.fr SBRH Conference
Operational use of ensemble hydrometeorological forecasts at EDF (french producer of energy) M. Le Lay, P. Bernard, J. Gailhard, R. Garçon, T. Mathevet & EDF forecasters matthieu.le-lay@edf.fr SBRH Conference
Country Presentation-Nepal
 Country Presentation-Nepal Mt.Everest, Shiva Pd. Nepal, DHM South Asia Drought Monitor Workshop Dhaka Bangladesh 2 th April 215 Overview Brief Climatology Climate activities- DHM PPCR (Pilot Program for
ALASKA REGION CLIMATE OUTLOOK BRIEFING. June 22, 2018 Rick Thoman National Weather Service Alaska Region
 ALASKA REGION CLIMATE OUTLOOK BRIEFING June 22, 2018 Rick Thoman National Weather Service Alaska Region Today s Outline Feature of the month: Ocean Warmth Headed into Summer Climate Forecast Basics Climate
The Colorado Drought of 2002 in Perspective
 The Colorado Drought of 2002 in Perspective Colorado Climate Center Nolan Doesken and Roger Pielke, Sr. Prepared by Tara Green and Odie Bliss http://climate.atmos.colostate.edu Known Characteristics of
Precipitation verification. Thanks to CMC, CPTEC, DWD, ECMWF, JMA, MF, NCEP, NRL, RHMC, UKMO
 Precipitation verification Thanks to CMC, CPTEC, DWD, ECMWF, JMA, MF, NCEP, NRL, RHMC, UKMO Outline 1) Status of WGNE QPF intercomparisons 2) Overview of the use of recommended methods for the verification
Atmospheric circulation analysis for seasonal forecasting
 Training Seminar on Application of Seasonal Forecast GPV Data to Seasonal Forecast Products 18 21 January 2011 Tokyo, Japan Atmospheric circulation analysis for seasonal forecasting Shotaro Tanaka Climate