An integrated speleothem proxy and climate modeling study of the last deglacial climate in the Pacific Northwest
|
|
|
- Morgan Hawkins
- 5 years ago
- Views:
Transcription
1 An integrated speleothem proxy and climate modeling study of the last deglacial climate in the Pacific Northwest Jerry Potter UC Davis, University of Michigan, NASA GSFC Isabel Montanez, University of California Davis Jessica Oster, Vanderbilt University Bette Otto-Bliesner NCAR Nan Rosenbloom NCAR Pat Behling Center for Climatic Research, University of Wisconsin - Madison Paleoclimate Working Group, February 16, 2012
2 Outline Using speleothems as a proxy for climate change in the Pacific Northwest Comparing proxy data with the TRACE and other paleoclimate simulations The need for resolution Experimental design Using the TRACE restarts Bringing new tools to new users


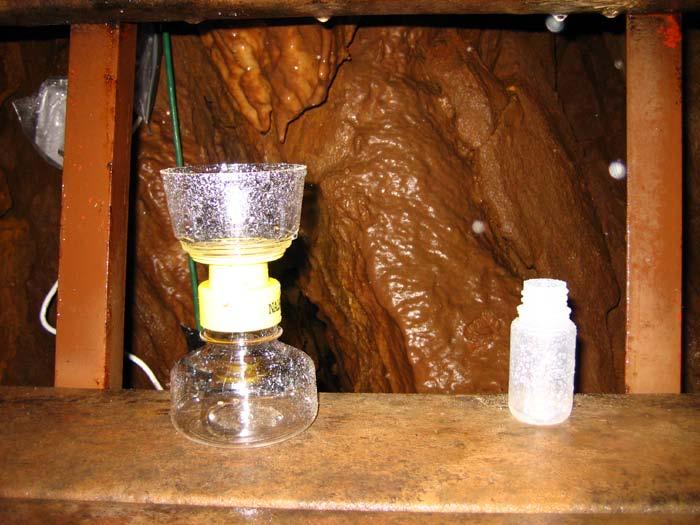
3 Stalagmite Records Cave Monitoring


4 How do speleothems record climate change? McLean s Cave Stalagmite Hiatus 56 ± 3 ka 61 ± 1 ka 63.4 ± 0.8 ka 66.6 ± 1 ka These deposits can be dated with U-series isotopes captured by the growing crystals to a precision of 1 to 2% of their ages Build a rock calendar of how cave conditions and the climate above changed through time 66.8 ± 1 ka 67.3 ± 1 ka


5 Sr content* Establishing the link between coolmoist and warm-dry conditions drier/warmer C isotope* O isotope* Greenland Ice Core -temperature Sierra Nevada Stalagmites - moisture Bølling-Allerød Younger Dryas It would be a useful test of paleoclimate models to compare with these and other proxy data


6 Transient Simulations: 21,000 years ago to the present Community Climate System Model, version 3 Atmospheric model T31 (~4 lat-lon), 26 levels Land model sub-grid land types dynamic vegetation Ocean model ~3 lat-lon, with resolution of ~0.6 in tropics and North Atlantic, 25 levels Sea ice model dynamics-thermodynamics Sea Ice x3 Ocean x3 Atmosphere 3.8 Land 3.8 DOE INCITE grant: Jaguar supercomputer simulated years per wall clock day Courtesy Bette Otto-Bliesner
7 Transient Forcings and Simulations DJF 30S (30N) JJA 30N Red: proxy data Blue: CCSM3 CO 2 AMOC Greenland Temp CH 4 Orbital insolation Forcings Greenhouse gases: CO 2, CH 4, N 2 O Ice sheet extents and heights Meltwater fluxes Three Simulations Baseline: all transients forcings 2 sensitivity simulations: 17-11ka * - Only orbital forcing changes - Only CO 2 forcing changes * All other forcings ice sheets, meltwater, CO 2 or orbital, held at 17ka values Courtesy Bette Otto-Bliesner
8 Cave data Sr content drier/ warmer TraCE-21,000 (Transient Climate Evolution of the last 21 kyr) run compared to proxy data C isotope Bølling-Allerød O isotope CCSM Younger Dryas Greenland Ice Core -temperature
9 Using the TraCE runs to look in detail at events in the past Proxy data gives us the opportunity to look at large changes in the climate and compare with model output Help sort out issues where proxy data disagrees Determine if the TraCE run get essence of the state of the climate in the past


10 Oster et al. have established the cave data likely shows increased precipitation in the Western US during the Last Glacial Maximum Last glacial Maximum IPCC Ar4 (DJF precip) Kim et al. (DJF)
11 Using the TraCE simulations to look in detail at periods of interest Surface temperature average over the Northern hemisphere from the TraCE simulation Younger Dryas Bølling Allerød Selected time slices
12 Need for higher resolution to study West Coast January Precipitation, mm/day 17Ka TraCE run TraCE T85 run
13 Rerunning time slices at T85 may provide the detail needed January Precipitation, mm/day 17Ka
14 Experimental design Extract the TRACE T31 (3.75 degree resolution) simulations for selected time periods, then regrid and rerun selected time slices at T85 (~ 1.4 degree resolution) Ocean temperature remain fixed to those calculated at T31 Short 5-year runs longer runs to follow Select daily DJF 500hPa geopotential height Smooth and calculate the variance
15 To help sort out the picture of paleoclimate we need an objective way to estimate storm tracks First attempt is to use an Eulerian measure the called dynamic storm track, which is defined as a region of enhanced standard deviation of the bandpass filtered 500-hPa geopotential height (Blackmon 1976; Wallace et al. 1988; Lau 1988). Limitations: Because of the time filtering of, the storm track is restricted to the characteristic time scale of synoptic cyclones; however, a considerable amount of synoptic-scale variability within this frequency band is not related to cyclones but to large-scale waves and high- pressure systems.
16 The Younger Dryas appears to have a stronger and expanded storm track Peak of the Bølling Allerød ~14.3 kya Peak of the Younger Dryas~12.2 kya Variance of the Filtered 500hPa geopotential heights x 1000 meters 2
 then project to a common reference (preserving size and")
 Preserves mean cyclone structure.")
17 Map Climatology of Midlatitude Storms (MCMS) Identify every cyclone and delineate it s extent (closed contours) then project to a common reference (preserving size and shape) and add to the stack to be averaged. Lagrangian versus the maps (Eulerian) Preserves mean cyclone structure. Recursive search seeded on center. Courtesy Mike Bauer NASA GISS
18 Other factors that may influence precipitation in the proxy record Atmospheric rivers Increase occurrence as the climate warms?


19 Occurrence of Atmospheric Rivers: an additional complication (Dettinger, 2009) Increased occurrence of ARs in future climate scenarios
20 The case of cooler-wetter and warmer-drier isn t settled Inconsistent picture of how the regional climate changes in western North America In some studies late Pleistocene cooling events in the North Atlantic region have been dry climates in the Sierra Nevada and western Great Basin regions (Oster at al.) Glacial (moraines) in California suggest drier during cool periods.. So do lakes Speleothem records suggest wetter during the cool periods Controversy not settled

21 New tools to help with analysis UV-CDAT

22

23

24
25 Skin temperature shows large effect of fresh water flux into North Atlantic
26 The noise here may indicate too short sample
An integrated speleothem proxy and climate modeling study of the last deglacial climate in the Pacific Northwest
 An integrated speleothem proxy and climate modeling study of the last deglacial climate in the Pacific Northwest Jerry Potter UC Davis, University of Michigan, NASA GSFC Isabel Montanez, University of
Sensitivity of the Younger Dryas climate to changes in freshwater, orbital, and greenhouse gas forcing in CESM1.
 OCE-1536630 EAR-0903071 Sensitivity of the Younger Dryas climate to changes in freshwater, orbital, and greenhouse gas forcing in CESM1. The 21 st Annual CESM Workshop Paleoclimate Working Group Taylor
Rapid Climate Change: Heinrich/Bolling- Allerod Events and the Thermohaline Circulation. By: Andy Lesage April 13, 2010 Atmos.
 Rapid Climate Change: Heinrich/Bolling- Allerod Events and the Thermohaline Circulation By: Andy Lesage April 13, 2010 Atmos. 6030 Outline Background Heinrich Event I/Bolling-Allerod Transition (Liu et
ATOC OUR CHANGING ENVIRONMENT
 ATOC 1060-002 OUR CHANGING ENVIRONMENT Class 22 (Chp 15, Chp 14 Pages 288-290) Objectives of Today s Class Chp 15 Global Warming, Part 1: Recent and Future Climate: Recent climate: The Holocene Climate
lecture 12 Paleoclimate
 lecture 12 Paleoclimate OVERVIEW OF EARTH S CLIMATIC HISTORY Geologic time scales http://www.snowballearth.org/index.html Features of the climate during the Cretaceous period the land-sea distribution
Exploring North Atlantic jet and storm track behaviour in glacial climates
 Exploring North Atlantic jet and storm track behaviour in glacial climates 23 January 2015 Ateliers de Modélisation de l Atmosphère, Toulouse H H H relationship between jets and storminess Pole L L H H
/ Past and Present Climate
 MIT OpenCourseWare http://ocw.mit.edu 12.842 / 12.301 Past and Present Climate Fall 2008 For information about citing these materials or our Terms of Use, visit: http://ocw.mit.edu/terms. Ice Sheet Paleoclimatology
(c) (a) (d) (b) JJA DJF. V850 Hulu Cave. V850 Hulu Cave V1000 V1000. Dongge Cave. Dongge Cave. Lake Huguang Maar.
 (a) (d) (b) JJA DJF. V850 Hulu Cave. V850 Hulu Cave V1000 V1000. Dongge Cave. Dongge Cave. Lake Huguang Maar.") NCEP-DOE (1981-2010) TraCE21ka (a) (c) JJA Dongge Cave V850 Hulu Cave Dongge Cave V850 Hulu Cave (b) (d) DJF Lake Huguang Maar V1000 Lake Huguang Maar V1000 Supplementary Figure 1 Climatology of EASM and
NCEP-DOE (1981-2010) TraCE21ka (a) (c) JJA Dongge Cave V850 Hulu Cave Dongge Cave V850 Hulu Cave (b) (d) DJF Lake Huguang Maar V1000 Lake Huguang Maar V1000 Supplementary Figure 1 Climatology of EASM and
Global Atmospheric Circulation
 Global Atmospheric Circulation Polar Climatology & Climate Variability Lecture 11 Nov. 22, 2010 Global Atmospheric Circulation Global Atmospheric Circulation Global Atmospheric Circulation The Polar Vortex
Climate Dynamics (PCC 587): Hydrologic Cycle and Global Warming
: Hydrologic Cycle and Global Warming") Climate Dynamics (PCC 587): Hydrologic Cycle and Global Warming D A R G A N M. W. F R I E R S O N U N I V E R S I T Y O F W A S H I N G T O N, D E P A R T M E N T O F A T M O S P H E R I C S C I E N C
Climate Dynamics (PCC 587): Hydrologic Cycle and Global Warming D A R G A N M. W. F R I E R S O N U N I V E R S I T Y O F W A S H I N G T O N, D E P A R T M E N T O F A T M O S P H E R I C S C I E N C
Weather and Climate Summary and Forecast Winter
 Weather and Climate Summary and Forecast Winter 2016-17 Gregory V. Jones Southern Oregon University February 7, 2017 What a difference from last year at this time. Temperatures in January and February
Exploration of California High Resolution Snowpack Modeling with Realistic Surface-Atmospheric Radiation Physics
 Exploration of California High Resolution Snowpack Modeling with Realistic Surface-Atmospheric Radiation Physics Chaincy Kuo, Alan Rhoades, Daniel Feldman Lawrence Berkeley National Laboratory AMS 15th
May Global Warming: Recent Developments and the Outlook for the Pacific Northwest
 Global Warming: Recent Developments and the Outlook for the Pacific Northwest Pat Bartlein Department of Geography University of Oregon (bartlein@uoregon.edu) http://geography.uoregon.edu/envchange/gwhr/
The North Atlantic Oscillation: Climatic Significance and Environmental Impact
 1 The North Atlantic Oscillation: Climatic Significance and Environmental Impact James W. Hurrell National Center for Atmospheric Research Climate and Global Dynamics Division, Climate Analysis Section
Climate Changes due to Natural Processes
 Climate Changes due to Natural Processes 2.6.2a Summarize natural processes that can and have affected global climate (particularly El Niño/La Niña, volcanic eruptions, sunspots, shifts in Earth's orbit,
High-Resolution MPAS Simulations for Analysis of Climate Change Effects on Weather Extremes
 High-Resolution MPAS Simulations for Analysis of Climate Change Effects on Weather Extremes ALLISON MICHAELIS, GARY LACKMANN, & WALT ROBINSON Department of Marine, Earth, and Atmospheric Sciences, North
Contribution of vegetation changes to dust decadal variability and its impact on tropical rainfall asymmetry
 Contribution of vegetation changes to dust decadal variability and its impact on tropical rainfall asymmetry Presented by Paul Ginoux Geophysical Fluid Dynamics Laboratory NOAA Barcelona Supercomputing
Reconstructing Past Droughts in Texas. Richard Casteel Jay Banner Jackson School of Geosciences Environmental Science Institute
 Reconstructing Past Droughts in Texas Richard Casteel Jay Banner Jackson School of Geosciences Environmental Science Institute Texas climate Outline Present and past droughts Drought reconstructions: Tree
Effects of climate change on water resources
 Effects of climate change on water resources Key Points Global climate has varied widely in the past. On time scales of tens to hundreds of millions of years, these changes were at least partly a result
Mozambique. General Climate. UNDP Climate Change Country Profiles. C. McSweeney 1, M. New 1,2 and G. Lizcano 1
 UNDP Climate Change Country Profiles Mozambique C. McSweeney 1, M. New 1,2 and G. Lizcano 1 1. School of Geography and Environment, University of Oxford. 2.Tyndall Centre for Climate Change Research http://country-profiles.geog.ox.ac.uk
When Did the Anthropocene Begin? Observations and Climate Model Simulations
 When Did the Anthropocene Begin? Observations and Climate Model Simulations by John Kutzbach University of Wisconsin-Madison March 31, 2011 Colleagues: W. Ruddiman, S. Vavrus, G. Philippon-Berrthier Main
Antigua and Barbuda. General Climate. Recent Climate Trends. UNDP Climate Change Country Profiles. Temperature
 UNDP Climate Change Country Profiles Antigua and Barbuda C. McSweeney 1, M. New 1,2 and G. Lizcano 1 1. School of Geography and Environment, University of Oxford. 2. Tyndall Centre for Climate Change Research
California 120 Day Precipitation Outlook Issued Tom Dunklee Global Climate Center
 California 120 Day Precipitation Outlook Issued 11-01-2008 Tom Dunklee Global Climate Center This is my second updated outlook for precipitation patterns and amounts for the next 4 s of the current rainy
Paleoclimate indicators
 Paleoclimate indicators Rock types as indicators of climate Accumulation of significant thicknesses of limestone and reef-bearing limestone is restricted to ~20º + - equator Gowganda tillite, Ontario
Rapid climate change in ice cores
 Rapid climate change in ice cores Liz Thomas British Antarctic Survey Overview Introduction to ice cores Evidence of rapid climate change in the Greenland ice cores DO events Younger Dryas 8.2 kyr cold
Temperature extremes in the United States: Quantifying the response to aerosols and greenhouse gases with implications for the warming hole
 Temperature extremes in the United States: Quantifying the response to aerosols and greenhouse gases with implications for the warming hole Nora Mascioli, Arlene Fiore, Michael Previdi, Gustavo Correa
NATS 101 Section 13: Lecture 32. Paleoclimate
 NATS 101 Section 13: Lecture 32 Paleoclimate Natural changes in the Earth s climate also occur at much longer timescales The study of prehistoric climates and their variability is called paleoclimate.
Extreme Weather and Climate Change: the big picture Alan K. Betts Atmospheric Research Pittsford, VT NESC, Saratoga, NY
 Extreme Weather and Climate Change: the big picture Alan K. Betts Atmospheric Research Pittsford, VT http://alanbetts.com NESC, Saratoga, NY March 10, 2018 Increases in Extreme Weather Last decade: lack
1 What Is Climate? TAKE A LOOK 2. Explain Why do areas near the equator tend to have high temperatures?
 CHAPTER 17 1 What Is Climate? SECTION Climate BEFORE YOU READ After you read this section, you should be able to answer these questions: What is climate? What factors affect climate? How do climates differ
We re living in the Ice Age!
 Chapter 18. Coping with the Weather: Causes and Consequences of Naturally Induce Climate Change 지구시스템의이해 We re living in the Ice Age! 1 Phanerozoic Climate 서늘해지고 더웠고 따뜻했고 3 Climate Rollercoaster 4 2 Time
Weather and Climate Summary and Forecast Summer 2017
 Weather and Climate Summary and Forecast Summer 2017 Gregory V. Jones Southern Oregon University August 4, 2017 July largely held true to forecast, although it ended with the start of one of the most extreme
Weather and Climate Summary and Forecast January 2018 Report
 Weather and Climate Summary and Forecast January 2018 Report Gregory V. Jones Linfield College January 5, 2018 Summary: A persistent ridge of high pressure over the west in December produced strong inversions
Today s Climate in Perspective: Hendrick Avercamp ( ) ~1608; Rijksmuseum, Amsterdam
 ~1608; Rijksmuseum, Amsterdam") Today s Climate in Perspective: Paleoclimate Evidence Hendrick Avercamp (1585-1634) ~1608; Rijksmuseum, Amsterdam Observations Instrumental surface temperature records? (Le Treut et al., 2007 IPCC AR4
Today s Climate in Perspective: Paleoclimate Evidence Hendrick Avercamp (1585-1634) ~1608; Rijksmuseum, Amsterdam Observations Instrumental surface temperature records? (Le Treut et al., 2007 IPCC AR4
Effects of climate change on water resources
 Effects of climate change on water resources Key Points Global climate has varied widely in the past. On time scales of tens to hundreds of millions of years, these changes were at least partly a result
The ocean s overall role in climate
 The ocean s overall role in climate - moderates climate in time (diurnally, annually) - redistributes heat spatially in the largescale ocean circulation - lower albedo (sea ice higher albedo) - dry atmosphere
Outline 23: The Ice Ages-Cenozoic Climatic History
 Outline 23: The Ice Ages-Cenozoic Climatic History Continental Glacier in Antarctica Valley Glaciers in Alaska, note the moraines Valley Glaciers in Alaska, note the moraines Mendenhall Glacier, Juneau,
6. What has been the most effective erosive agent in the climate system? a. Water b. Ice c. Wind
 Multiple Choice. 1. Heinrich Events a. Show increased abundance of warm-water species of planktic foraminifera b. Show greater intensity since the last deglaciation c. Show increased accumulation of ice-rafted
Climate Change 2007: The Physical Science Basis
 Climate Change 2007: The Physical Science Basis Working Group I Contribution to the IPCC Fourth Assessment Report Presented by R.K. Pachauri, IPCC Chair and Bubu Jallow, WG 1 Vice Chair Nairobi, 6 February
4.3 Climate (6.3.3) Explore this Phenomena. The same sun shines on the entire Earth. Explain why these two areas have such different climates.
 Explore this Phenomena. The same sun shines on the entire Earth. Explain why these two areas have such different climates.") Explore this Phenomena The same sun shines on the entire Earth. 4.3 Climate (6.3.3) Explain why these two areas have such different climates. 89 6.3.3 Climate Develop and use a model to show how unequal
Explore this Phenomena The same sun shines on the entire Earth. 4.3 Climate (6.3.3) Explain why these two areas have such different climates. 89 6.3.3 Climate Develop and use a model to show how unequal
Why build a climate model
 Climate Modeling Why build a climate model Atmosphere H2O vapor and Clouds Absorbing gases CO2 Aerosol Land/Biota Surface vegetation Ice Sea ice Ice sheets (glaciers) Ocean Box Model (0 D) E IN = E OUT
Cuba. General Climate. Recent Climate Trends. UNDP Climate Change Country Profiles. Temperature. C. McSweeney 1, M. New 1,2 and G.
 UNDP Climate Change Country Profiles Cuba C. McSweeney 1, M. New 1,2 and G. Lizcano 1 1. School of Geography and Environment, University of Oxford. 2. Tyndall Centre for Climate Change Research http://country-profiles.geog.ox.ac.uk
Weather and Climate Summary and Forecast February 2018 Report
 Weather and Climate Summary and Forecast February 2018 Report Gregory V. Jones Linfield College February 5, 2018 Summary: For the majority of the month of January the persistent ridge of high pressure
Why There Is Weather?
 Lecture 6: Weather, Music Of Our Sphere Weather and Climate WEATHER The daily fluctuations in atmospheric conditions. The atmosphere on its own can produce weather. (From Understanding Weather & Climate)
Weather and Climate Summary and Forecast November 2017 Report
 Weather and Climate Summary and Forecast November 2017 Report Gregory V. Jones Linfield College November 7, 2017 Summary: October was relatively cool and wet north, while warm and very dry south. Dry conditions
1 What Is Climate? TAKE A LOOK 2. Explain Why do areas near the equator tend to have high temperatures?
 CHAPTER 17 1 What Is Climate? SECTION Climate BEFORE YOU READ After you read this section, you should be able to answer these questions: What is climate? What factors affect climate? How do climates differ
Welcome to ATMS 111 Global Warming.
 Welcome to ATMS 111 Global Warming http://www.atmos.washington.edu/2010q1/111 Isotopic Evidence 16 O isotopes "light 18 O isotopes "heavy" Evaporation favors light Rain favors heavy Cloud above ice is
Multiple Choice Identify the choice that best completes the statement or answers the question.
 CH.15 practice TEST Multiple Choice Identify the choice that best completes the statement or answers the question. 1) The short-term state of the atmosphere is called a) climate. c) water cycle. b) weather.
SEVERE WEATHER AND FRONTS TAKE HOME QUIZ
 1. Most of the hurricanes that affect the east coast of the United States originally form over the A) warm waters of the Atlantic Ocean in summer B) warm land of the southeastern United States in summer
Some figures courtesy of: Chris Landsea National Hurricane Center, Miami. Intergovernmental Panel on Climate Change
 Hurricanes and Global Warming Pat Fitzpatrick Mississippi State University, GeoSystems Research Institute Some figures courtesy of: Chris Landsea National Hurricane Center, Miami Intergovernmental Panel
Presentation Overview. Southwestern Climate: Past, present and future. Global Energy Balance. What is climate?
 Southwestern Climate: Past, present and future Mike Crimmins Climate Science Extension Specialist Dept. of Soil, Water, & Env. Science & Arizona Cooperative Extension The University of Arizona Presentation
Current Climate Science and Climate Scenarios for Florida
 Current Climate Science and Climate Scenarios for Florida Daniel Bader and Vivien Gornitz Water Utilities and Climate Change Workshop Palm Beach County Water Utilities/ Water Research Foundation June 10,
Weather Atmospheric condition in one place during a limited period of time Climate Weather patterns that an area typically experiences over a long
 Weather Atmospheric condition in one place during a limited period of time Climate Weather patterns that an area typically experiences over a long period of time Many factors influence weather & climate
Weather and Climate Summary and Forecast December 2017 Report
 Weather and Climate Summary and Forecast December 2017 Report Gregory V. Jones Linfield College December 5, 2017 Summary: November was relatively cool and wet from central California throughout most of
The scientific basis for climate change projections: History, Status, Unsolved problems
 The scientific basis for climate change projections: History, Status, Unsolved problems Isaac Held, Princeton, Feb 2008 Katrina-like storm spontaneously generated in atmospheric model Regions projected
Lecture 2: Light And Air
 Lecture 2: Light And Air Earth s Climate System Earth, Mars, and Venus Compared Solar Radiation Greenhouse Effect Thermal Structure of the Atmosphere Atmosphere Ocean Solid Earth Solar forcing Land Energy,
Isotope modeling with CESM
 Isotope modeling with CESM Alexandra Jahn Depart. of Atmospheric and Oceanic Sciences & Institute for Arctic and Alpine Research University of Colorado at Boulder With contribu,ons from B. O3o- Bliesner
How might extratropical storms change in the future? Len Shaffrey National Centre for Atmospheric Science University of Reading
 How might extratropical storms change in the future? Len Shaffrey National Centre for Atmospheric Science University of Reading Extratropical storms Extratropical storms Strong winds, extreme waves, storm
Weather & Ocean Currents
 Weather & Ocean Currents Earth is heated unevenly Causes: Earth is round Earth is tilted on an axis Earth s orbit is eliptical Effects: Convection = vertical circular currents caused by temperature differences
Out of the Ice Age: How Indonesian Stalagmites Trace Changes in the Australasian Monsoon
 Out of the Ice Age: How Indonesian Stalagmites Trace Changes in the Australasian Monsoon 20th Anniversary Celebration NOAA Climate and Global Change Postdoctoral Program Dr. Michael L. Griffiths UC Irvine
Weather Atmospheric condition in one place during a limited period of time Climate Weather patterns that an area typically experiences over a long
 Weather Atmospheric condition in one place during a limited period of time Climate Weather patterns that an area typically experiences over a long period of time Many factors influence weather & climate
Characteristics of Storm Tracks in JMA s Seasonal Forecast Model
 Characteristics of Storm Tracks in JMA s Seasonal Forecast Model Akihiko Shimpo 1 1 Climate Prediction Division, Japan Meteorological Agency, Japan Correspondence: ashimpo@naps.kishou.go.jp INTRODUCTION
Today we will discuss global climate: how it has changed in the past, and how the current status and possible future look.
 Global Climate Change Today we will discuss global climate: how it has changed in the past, and how the current status and possible future look. If you live in an area such as the Mississippi delta (pictured)
Global Warming: The known, the unknown, and the unknowable
 Global Warming: The known, the unknown, and the unknowable Barry A. Klinger Jagadish Shukla George Mason University (GMU) Institute of Global Environment and Society (IGES) January, 2008, George Mason
Ben Harvey, Len Shaffrey, Tim Woollings. SRM Annual meeting, 2 nd November 2011
 Ben Harvey, Len Shaffrey, Tim Woollings SRM Annual meeting, 2 nd November 2011 Position within TEMPEST WP4 Integration and pull-through Lead Shaffrey WP1 Assessing Storms Lead Hodges Giuseppe Zappa WP2
Climate Change Scenarios in Southern California. Robert J. Allen University of California, Riverside Department of Earth Sciences
 Climate Change Scenarios in Southern California Robert J. Allen University of California, Riverside Department of Earth Sciences Overview Climatology of Southern California Temperature and precipitation
Speleothems and Climate Models
 Earth and Life Institute Georges Lemaître Centre for Earth and Climate Research Université catholique de Louvain, Belgium Speleothems and Climate Models Qiuzhen YIN Summer School on Speleothem Science,
Wind: Global Systems Chapter 10
 Wind: Global Systems Chapter 10 General Circulation of the Atmosphere General circulation of the atmosphere describes average wind patterns and is useful for understanding climate Over the earth, incoming
Global Climate Systems
 Global Climate Systems I. Earth s Climate A. Past Climate B. Present Climate and Classification 1. Climate components 2. Classification 3. Köppen Climate Classification 4. El Nino III. Global Climate Change
Weather and Climate Summary and Forecast August 2018 Report
 Weather and Climate Summary and Forecast August 2018 Report Gregory V. Jones Linfield College August 5, 2018 Summary: July 2018 will likely go down as one of the top five warmest July s on record for many
8. Climate changes Short-term regional variations
 8. Climate changes 8.1. Short-term regional variations By short-term climate changes, we refer here to changes occurring over years to decades. Over this timescale, climate is influenced by interactions
The NCAR CAM 3 simulation error of Arctic Sea Level Pressure
 The NCAR CAM 3 simulation error of Arctic Sea Level Pressure Muhtarjan Osman and Richard Grotjahn Department of Land, Air and Water Resources University of California, Davis Supported by NSF grant 0354545
Fig Major air masses of the world
 Fig. 9.3 Major air masses of the world CLASSIFICATION FOUR BASIC CATEGORIES OF AIR MASSES: POLAR - P ARCTIC - A TROPICAL - T EQUATORIAL - E TWO DESIGNATIONS OF SURFACE IN SOURCE REGION MARITIME - m. CONTINENTAL
What is the IPCC? Intergovernmental Panel on Climate Change
 IPCC WG1 FAQ What is the IPCC? Intergovernmental Panel on Climate Change The IPCC is a scientific intergovernmental body set up by the World Meteorological Organization (WMO) and by the United Nations
Will a warmer world change Queensland s rainfall?
 Will a warmer world change Queensland s rainfall? Nicholas P. Klingaman National Centre for Atmospheric Science-Climate Walker Institute for Climate System Research University of Reading The Walker-QCCCE
Lake Levels and Climate Change in Maine and Eastern North America during the last 12,000 years
 Maine Geologic Facts and Localities December, 2000 Lake Levels and Climate Change in Maine and Eastern North America during the last 12,000 years Text by Robert A. Johnston, Department of Agriculture,
Chapter outline. Reference 12/13/2016
 Chapter 2. observation CC EST 5103 Climate Change Science Rezaul Karim Environmental Science & Technology Jessore University of science & Technology Chapter outline Temperature in the instrumental record
The Climate System and Climate Models. Gerald A. Meehl National Center for Atmospheric Research Boulder, Colorado
 The Climate System and Climate Models Gerald A. Meehl National Center for Atmospheric Research Boulder, Colorado The climate system includes all components of the physical earth system that affect weather
Paleoclimate: What can the past tell us about the present and future? Global Warming Science February 14, 2012 David McGee
 Paleoclimate: What can the past tell us about the present and future? 12.340 Global Warming Science February 14, 2012 David McGee 1 Recent observed trends: Greenhouse gases Image courtesy of NOAA. 2 Recent
The Texas drought. Kingtse Mo Climate Prediction Center NWS/NCEP/NOAA
 The 2011-2012 Texas drought Kingtse Mo Climate Prediction Center NWS/NCEP/NOAA 1 outline Evolution of the 2011-2012 Texas drought Climatology and historical perspective The 2011 drought Onset Feedback
A GCM Reconstruction of the Last Glacial Inception
 A GCM Reconstruction of the Last Glacial Inception Megan Essig 1, Francis Otieno 2, Robert Oglesby 1, David Bromwich 2 1 Department of Geosciences, University of Nebraska, Lincoln 2 Polar Meteorology Group,
Projected Impacts of Climate Change in Southern California and the Western U.S.
 Projected Impacts of Climate Change in Southern California and the Western U.S. Sam Iacobellis and Dan Cayan Scripps Institution of Oceanography University of California, San Diego Sponsors: NOAA RISA
What is Climate? Understanding and predicting climatic changes are the basic goals of climatology.
 What is Climate? Understanding and predicting climatic changes are the basic goals of climatology. Climatology is the study of Earth s climate and the factors that affect past, present, and future climatic
ENSO Cycle: Recent Evolution, Current Status and Predictions. Update prepared by Climate Prediction Center / NCEP 23 April 2012
 ENSO Cycle: Recent Evolution, Current Status and Predictions Update prepared by Climate Prediction Center / NCEP 23 April 2012 Outline Overview Recent Evolution and Current Conditions Oceanic Niño Index
Second-Order Draft Chapter 10 IPCC WG1 Fourth Assessment Report
 Second-Order Draft Chapter IPCC WG Fourth Assessment Report Figure... Multi model mean changes in a) zonal mean cloud fraction (in %), shown as a cross section though the atmosphere, and b) total cloud
Chapter 15 Millennial Oscillations in Climate
 Chapter 15 Millennial Oscillations in Climate This chapter includes millennial oscillations during glaciations, millennial oscillations during the last 8000 years, causes of millennial-scale oscillations,
The Netherlands approach for generating climate change. scenarios. Bart van den Hurk, KNMI and many others
 The Netherlands approach for generating climate change scenarios Bart van den Hurk, KNMI and many others What is the global climate problem? Climate change is normal Natural influences: Internal variability
AMOC Impacts on Climate
 AMOC Impacts on Climate Rong Zhang GFDL/NOAA, Princeton, NJ, USA Paleo-AMOC Workshop, Boulder, CO, USA May 24, 2016 Atlantic Meridional Overturning Circulation (AMOC) Kuklbrodt et al. 2007 McManus et al.,
Weather and Climate Change
 Weather and Climate Change What if the environmental lapse rate falls between the moist and dry adiabatic lapse rates? The atmosphere is unstable for saturated air parcels but stable for unsaturated air
Name Date Class. growth rings of trees, fossilized pollen, and ocean. in the northern hemisphere.
 Lesson Outline LESSON 2 A. Long-Term Cycles 1. A(n) climate cycle takes much longer than a lifetime to complete. a. To learn about long-term climate cycles, scientists study natural records, such as growth
Orbital-Scale Interactions in the Climate System. Speaker:
 Orbital-Scale Interactions in the Climate System Speaker: Introduction First, many orbital-scale response are examined.then return to the problem of interactions between atmospheric CO 2 and the ice sheets
Regional Climate Change Modeling: An Application Over The Caspian Sea Basin. N. Elguindi and F. Giorgi The Abdus Salam ICTP, Trieste Italy
 Regional Climate Change Modeling: An Application Over The Caspian Sea Basin N. Elguindi and F. Giorgi The Abdus Salam ICTP, Trieste Italy Outline I. Background and historical information on the Caspian
2. Can you describe how temperature and dissolved solids changes the density of water?
 Unit 4: Oceanography LT 4.1 Density: I can explain the role density plays to help form some currents. #1 Yes I can: 1. Can you explain what density is and how you calculate it? 2. Can you describe how
Recent Climate History - The Instrumental Era.
 2002 Recent Climate History - The Instrumental Era. Figure 1. Reconstructed surface temperature record. Strong warming in the first and late part of the century. El Ninos and major volcanic eruptions are
CLIMATE. SECTION 14.1 Defining Climate
 Date Period Name CLIMATE SECTION.1 Defining Climate In your textbook, read about climate and different types of climate data. Put a check ( ) next to the types of data that describe climate. 1. annual
Ice on Earth: An overview and examples on physical properties
 Ice on Earth: An overview and examples on physical properties - Ice on Earth during the Pleistocene - Present-day polar and temperate ice masses - Transformation of snow to ice - Mass balance, ice deformation,
Northern New England Climate: Past, Present, and Future. Basic Concepts
 Northern New England Climate: Past, Present, and Future Basic Concepts Weather instantaneous or synoptic measurements Climate time / space average Weather - the state of the air and atmosphere at a particular
A) usually less B) dark colored and rough D) light colored with a smooth surface A) transparency of the atmosphere D) rough, black surface
 usually less B) dark colored and rough D) light colored with a smooth surface A) transparency of the atmosphere D) rough, black surface") 1. Base your answer to the following question on the diagram below which shows two identical houses, A and B, in a city in North Carolina. One house was built on the east side of a factory, and the other
1. Base your answer to the following question on the diagram below which shows two identical houses, A and B, in a city in North Carolina. One house was built on the east side of a factory, and the other
Bell Work. REVIEW: Our Planet Earth Page 29 Document A & B Questions
 9.12.16 Bell Work REVIEW: Our Planet Earth Page 29 Document A & B Questions Intro to Climate & Weather https://www.youtube.com/watch?v=vhgyoa70q7y Weather vs. Climate Video Climate & Weather 3.1 Weather
Development of the Global Environment
 Development of the Global Environment G302: Spring 2004 A course focused on exploration of changes in the Earth system through geological history Simon C. Brassell Geological Sciences simon@indiana.edu
Climate change: How do we know?
 Climate change: How do we know? This graph, based on the comparison of atmospheric samples contained in ice cores and more recent direct measurements, provides evidence that atmospheric CO2 has increased