QuikSCAT Analysis of Hurricane Force Extratropical Cyclones in the Pacific Ocean
|
|
|
- Valentine Jennings
- 5 years ago
- Views:
Transcription

1 University of Rhode Island Senior Honors Projects Honors Program at the University of Rhode Island 2010 QuikSCAT Analysis of Hurricane Force Extratropical Cyclones in the Pacific Ocean Peter Jzyk University of Rhode Island, Follow this and additional works at: Part of the Environmental Sciences Commons, and the Oceanography and Atmospheric Sciences and Meteorology Commons Recommended Citation Jzyk, Peter, "QuikSCAT Analysis of Hurricane Force Extratropical Cyclones in the Pacific Ocean" (2010). Senior Honors Projects. Paper This Article is brought to you for free and open access by the Honors Program at the University of Rhode Island at It has been accepted for inclusion in Senior Honors Projects by an authorized administrator of For more information, please contact
2 1. Introduction Since June 1999, the National Aeronautics and Space Administration (NASA) Quick Scatterometer Spacecraft (QuikSCAT) has been providing forecasters at the Ocean Prediction Center (OPC) with near-real-time surface wind speed and direction data over the world's oceans. It replaced NSCAT which was lost in 1997 and currently carries the SeaWinds scatterometer instrument. QuikSCAT is a near-polar orbiting satellite with an 1800-kilometer wide measurement swath on the earth's surface. Its angle of inclination is about 98 degrees, which means that according to a compass it is flying north by north-west at a directional angle of 352 degrees when it is ascending (i.e. south to north). It flies in a circular orbit at an altitude of approximately 800 km above sea level. QuikSCAT provides coverage of about 90% of the world's oceans each day and twice per day coverage over a given geographic region, completing a full orbit of the Earth in approximately 101 minutes (just over 14 orbits per day). (Callahan, 2006) The SeaWinds scatterometer transmits high-frequency microwave pulses of 13.4 GHz at a rate of one pulse every 5.4 milliseconds. It is able to estimate wind speed and direction over the Earth's oceans at ten meters above the surface of the water by analyzing the backscatter from the small wind-caused ripples, called cat's paws, on the water surface. When the microwave pulses strike the ocean surface, backscatter occurs. A rough ocean surface returns a stronger signal because the waves reflect more of the radar energy back toward the scatterometer antenna. A smooth ocean surface returns a weaker signal because less of the energy is reflected (JPL at Nasa, 2003). QuikSCAT is much more effective than ship and buoy observations, as it is able to provide hundreds of times more observations each day, as well as continuous, high-resolution measurements regardless of weather conditions. SeaWinds uses a rotating dish antenna with two pencil beams that sweep in a circular pattern. The pulses are alternately polarized, vertical and horizontal. It uses the same parabolic antenna for both pulses, with different feeds. The antenna rotates at a rate of 18 rotations per minute. The feeds on the antenna are set up so that the vertical polarized beam has an elevation angle of 45 degrees and the horizontal polarized beam an elevation of 39 degrees (JPL at Nasa, 2003). This creates an outer and an inner beam shown in the figure below.
3 Figure 1: The QuikSCAT scatterometer design As the antenna rotates, the instrument pulses form a circular footprint on the ground. The outer beam covers a circle on the surface of 1800 km diameter while the inner beam covers about 1400 km. When the circular rotation of the antenna is combined with satellite movement of approximately 25 km per rotation, a helical shape is traced out on the ground. (JPL at Nasa, 2003) QuikSCAT and the SeaWinds scatterometer have allowed forecasters to better predict potential hazards such as storm surges and issue warnings when necessary. The implementation of QuikSCAT into the OPC's daily analysis led to the initiation of Hurricane Force Wind Warnings in December Currently, the Beaufort wind speed scale defines the categories for wind warnings: gale warning, knots; storm warning, knots; and hurricane force warning, 64 knots or greater (Bowditch, 2005). Over the past ten years, QuikSCAT has received a number of upgrades which improved the forecasters' abilities to predict the weather more accurately and issue warnings, accordingly. These improvements include the availability of the QuikSCAT data right within the forecasters' workstations starting in October 2001 (rather than an online database), the introduction of higher resolution satellite data (12.5 kilometer rather than 25 km) in May 2004, and an improved wind algorithm and rain flag in October 2006 (Sienkiewicz et al., 2008).
, the OPC must determine which data set, or combination of data sets, best accurately represents current wind conditions.")
4 Now with four accessible sets of QuikSCAT data (Near-real-time 12.5 km and 25 km and Science-level 12.5 km and 25 km), the OPC must determine which data set, or combination of data sets, best accurately represents current wind conditions. This information will be useful for the launch of the next satellite after QuikSCAT, which will continue to improve on the recent wind algorithm and rain flag put into place. In this paper, I will provide both a quantitative and qualitative analysis of hurricane force extratropical cyclones in the Pacific Ocean. Using the 12.5 km Science-level data, I will determine the number of hurricane force extratropical cyclone events for given storm seasons. In addition, I will compare the four QuikSCAT data sets by providing a case-by-case analysis of hurricane force extratropical cyclones during January From these two objectives, I will look to normalize the data of hurricane force extratropical cyclone events for years prior to the implementation of the higher resolution QuikSCAT data and the improved wind algorithm and rain flag, as well as provide a detailed comparison of QuikSCAT data levels. As of right now the data shows an increasing trend in the number of cyclone events per cyclone season. Part of this increasing trend is due to the aforementioned implementations in addition to forecaster familiarity and data availability. Figure 2: Intense, non-tropical cyclone with hurricane force winds Feb 23, 2008, North Pacific (Sienkiewicz et al., 2008)

5 2. Methodology 2.1 Area of Study/Definition of Terms The active storm season for the North Pacific Ocean occurs from September to May each year. Consequently, this was the period of study chosen for determining the number of hurricane force extratropical cyclone events in the North Pacific. Extratropical refers to a cyclone that has lost its tropical characteristics. The term implies a poleward displacement of the cyclone and a transition of the cyclone's primary energy source. The cyclone's original primary energy source, the release of latent heat of condensation, is instead converted into baroclinic (the temperature contrast between warm and cold air masses) processes (National Hurricane Center, 2009). Extratropical cyclones are also referred to as mid-latitude or baroclinic cyclones and for the Northern Hemisphere, are defined by the Ocean Prediction Center to be north of 30ºN latitude. It is important to note that extratropical cyclones can remain at hurricane force or tropical storm force wind levels and are just as dangerous as tropical cyclones. 2.2 Procedure In order to begin the research, a Virtual Private Network (VPN) was established with the Ocean Prediction Center at the National Centers for Environmental Prediction. VPN Client by Cisco Systems was used to establish a connection to a workstation. From here, the QuikSCAT satellite data and Vector Graphics Files (VGFs) were uploaded to my workstation. These files were then accessed through NMAP, the operational product

6 generation software package at NCEP. NMAP has both display and product generation capabilities. The display capabilities include the ability to display observational and prognostic data as well as those graphical products generated using NMAP's product generation capability. In this instance, the QuikSCAT data would be observational data whereas the VGFs, which are the forecasters' surface analyses, would correspond to a generated product. My primary objective was to count the number of hurricane force extratropical cyclone events observed for the given years. Hurricane force winds are noted on QuikSCAT as having red wind barbs. Not all red wind barbs corresponded to a hurricane force extratropical cyclone, however. Backscatter from ocean ice, rain contamination, ambiguity removal errors and the swath edge all could result in showing hurricane force wind strength. Figure 3: Hurricane force extratropical cyclone on : Ice and swath edge, ambiguity removal errors, and rain contamination are noted. Legitimate hurricane force winds observed to the right and below the center of circulation.
 intensity,")
7 Figure 4: Forecaster's corresponding surface analysis to previous hurricane force extratropical cyclone on My goal was to account for only legitimate hurricane force winds. When a hurricane force extratropical cyclone was observed, I recorded the date and time when reaching hurricane force intensity, the starting latitude and longitude of hurricane force (HF) intensity, the maximum wind speed during the cyclone's life at HF intensity and the ending date, time, latitude and longitude when the cyclone dissipated below HF intensity. In addition, I recorded notes on particular or peculiar storms, such as if a storm started as a typhoon or tropical cyclone and transitioned into an extratropical cyclone or if a cyclone fell below HF intensity and then restrengthened. From this, I generated monthly cyclone distributions as well as distributions of the maximum winds for all of the cyclones. Another task was to compare the four levels of QuikSCAT data on a case-by-case basis. I chose four hurricane force extratropical cyclones from the January 2007 time period. This particular time period was chosen due to the availability of all four levels of data. I recorded the number of HF events in the month for each level, as well as the maximum wind speed and number of HF wind barbs. 3. Findings Lists of cyclone events for the and seasons are included in Appendix A.
8
9
 QuikSCAT data observed six hurricane force extratropical cyclones while the high-resolution (12.5 km) observed twelve.")
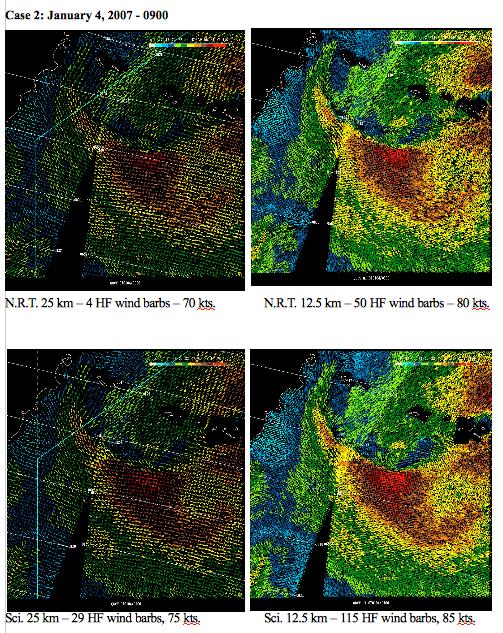
10 January 2007 Case-by-Case Analysis The following graph shows the results of the January 2007 case-by-case analysis. The near-realtime low-resolution (25 km) QuikSCAT data observed six hurricane force extratropical cyclones while the high-resolution (12.5 km) observed twelve. For the science-level data, the lowresolution QuikSCAT data observed ten hurricane force extratropical cyclones while the highresolution observed fifteen. The QuikSCAT imagery of the four cases can be found on the following pages.

11
12

13

14

15

16 4. Conclusions Overall, a number of conclusions can be drawn from the results of the QuikSCAT research. It is evident that the Science-level data is composed of a stronger algorithm than the near-realtime data. When comparing the number of hurricane force extratropical cyclones per cyclone season, the Science-level data detected many more cyclones than the Near-real-time data. In the season, the Science-level data found 77 cyclone events compared to the 14 found by the Near-real-time data. In the season, the numbers were 96 and 22, respectively. In addition, the Science-level detected more hurricane force extratropical cyclones than the N.R.T. data in the month of January 2007 for both the 12.5 and 25 km resolutions (15 to 12 and 10 to 6, respectively). Maximum wind speeds were also greater for the Science-level data when compared to the N.R.T data. Furthermore, for hurricane force extratropical cyclone events detected by both Science-level and N.R.T. data, hurricane force winds remained on the sciencelevel satellite imagery for longer periods of time. Figures 5 and 7 support the 7-year average monthly distribution of hurricane force extratropical cyclones, as the majority of cyclone events occur between the months of November and February. Figure 12: The 7-year average monthly distribution of hurricane force extratropical cyclones as detected by N.R.T. QuikSCAT. At this stage in the research, the data for the 7 years looks to be normalized. Analysis from two seasons were given (the other seasons had similar results). The number of cyclones per storm season did not vary much season to season and there did not seem to be an increasing trend. The research will continue for normalization in the Atlantic. Time did not permit the Atlantic seasons to be covered. Nonetheless, it is clear that the use of high resolution data after May 2004 led to more detected cyclones as shown by my comparison of low-resolution to high-resolution QuikSCAT data 5. References
17 Bowditch, N., cited 2005: The American practical navigator. National Imagery and Mapping Agency Publ. 9, 879 pp. [Available at Brennan, Michael J., Christopher C. Hennon, and Richard D. Knabb. "The Operational Use of QuikSCAT Ocean Surface Vector Winds at the National Hurricane Center." Weather and Forecasting 24.3 (2009): AMS Online Journals. American Meteorological Society. Web. < Callahan, P.S., 2006: QuikSCAT Science Data Product User s Manual, Overview and Geophysical Data Products. V3.0, D RevA, JPL ftp://podaac.jpl.nasa.gov/pub/ocean_wind/quikscat/doc/qsug_v3.pdf "Glossary of NHC Terms." National Hurricane Center. NOAA National Weather Service. 19 Sept Web. 5 Dec Hoffman, Ross N., and Mark Leidner. An introduction to the near real-time QuikSCAT data. Tech. NOAA/ National Weather Service, 24 Sept Web. 15 July < "Overview." Ocean Prediction Center. Ed. David Feit. NOAA/ National Weather Service, 12 May Web. 16 July < OPC_Overview_ESM.shtml>. "QuikSCAT." Jet Propulsion Laboratory at NASA. Web. 1 Dec < SCAT/QuikSCAT.html>. Sienkiewicz, Joseph M., et al. A look at extratropical cyclones of hurricane force intensity. University of Washington, Atmospheric Sciences. Nov 18, Von Ahn, Joan M., Joseph M. Sienkiewicz, and Paul S. Chang. "Operational Impact of QuikSCAT Winds at the NOAA Ocean Prediction Center." Weather and Forecasting 21.4 (2006): AMS Online Journals. American Meteorological Society. Web. < ams.allenpress.com/perlserv/?request=get-abstract&doi= %2fwaf934.1>. Keywords Extratropical Cyclones QuikSCAT Hurricane Force
J16.1 PRELIMINARY ASSESSMENT OF ASCAT OCEAN SURFACE VECTOR WIND (OSVW) RETRIEVALS AT NOAA OCEAN PREDICTION CENTER
 RETRIEVALS AT NOAA OCEAN PREDICTION CENTER") J16.1 PRELIMINARY ASSESSMENT OF ASCAT OCEAN SURFACE VECTOR WIND (OSVW) RETRIEVALS AT NOAA OCEAN PREDICTION CENTER Khalil. A. Ahmad* PSGS/NOAA/NESDIS/StAR, Camp Springs, MD Joseph Sienkiewicz NOAA/NWS/NCEP/OPC,
J16.1 PRELIMINARY ASSESSMENT OF ASCAT OCEAN SURFACE VECTOR WIND (OSVW) RETRIEVALS AT NOAA OCEAN PREDICTION CENTER Khalil. A. Ahmad* PSGS/NOAA/NESDIS/StAR, Camp Springs, MD Joseph Sienkiewicz NOAA/NWS/NCEP/OPC,
ASCAT NRT Data Processing and Distribution at NOAA/NESDIS
 ASCAT NRT Data Processing and Distribution at NOAA/NESDIS Paul S. Chang, Zorana Jelenak, Seubson Soisuvarn, Qi Zhu Gene Legg and Jeff Augenbaum National Oceanic and Atmospheric Administration (NOAA) National
Impact of the Loss of QuikSCAT on NOAA NWS Marine Warning and
 Impact of the Loss of QuikSCAT on NOAA NWS Marine Warning and Forecast Operations Joseph Sienkiewicz 1 Michael J. Brennan 2, Richard Knabb 3, Paul S. Chang 4, Hugh Cobb 2, Zorana J. Jelenak 5, Khalil A.
Joan M. Von Ahn, Joseph M. Sienkiewicz and Gregory M. McFadden NOAA Ocean Prediction Center 5200 Auth Road Camp Springs, MD USA
 The Application of Sea Level Pressure and Vorticity Fields derived from the University of Washington Planetary Boundary Layer Model in the NOAA Ocean Prediction Center Joan M. Von Ahn, Joseph M. Sienkiewicz
An Update Usage of ASCAT and OSCAT Winds at the NOAA Ocean Prediction Center (OPC), National Hurricane Center (NHC)
, National Hurricane Center (NHC)") An Update Usage of ASCAT and OSCAT Winds at the NOAA Ocean Prediction Center (OPC), National Hurricane Center (NHC) Joseph Sienkiewicz (OPC), Michael Brennan (NHC), Gregory McFadden (IMSG), Hugh D. Cobb
An Update Usage of ASCAT and OSCAT Winds at the NOAA Ocean Prediction Center (OPC), National Hurricane Center (NHC) Joseph Sienkiewicz (OPC), Michael Brennan (NHC), Gregory McFadden (IMSG), Hugh D. Cobb
A two-season impact study of the Navy s WindSat surface wind retrievals in the NCEP global data assimilation system
 A two-season impact study of the Navy s WindSat surface wind retrievals in the NCEP global data assimilation system Li Bi James Jung John Le Marshall 16 April 2008 Outline WindSat overview and working
EVALUATION OF WINDSAT SURFACE WIND DATA AND ITS IMPACT ON OCEAN SURFACE WIND ANALYSES AND NUMERICAL WEATHER PREDICTION
 5.8 EVALUATION OF WINDSAT SURFACE WIND DATA AND ITS IMPACT ON OCEAN SURFACE WIND ANALYSES AND NUMERICAL WEATHER PREDICTION Robert Atlas* NOAA/Atlantic Oceanographic and Meteorological Laboratory, Miami,
Indian Journal of Engineering
 Indian Journal of Engineering, Vol. 13, No. 31, January 1, 2016 ISSN 2319 7757 EISSN 2319 7765 Indian Journal of Engineering An International Journal Forecasting Intensity and Direction of Tropical Cyclones
Analysis of Fall Transition Season (Sept-Early Dec) Why has the weather been so violent?
 Why has the weather been so violent?") WEATHER TOPICS Analysis of Fall Transition Season (Sept-Early Dec) 2009 Why has the weather been so violent? As can be seen by the following forecast map, the Fall Transition and early Winter Season of
WEATHER TOPICS Analysis of Fall Transition Season (Sept-Early Dec) 2009 Why has the weather been so violent? As can be seen by the following forecast map, the Fall Transition and early Winter Season of
NWS Operational Marine and Ocean Forecasting. Overview. Ming Ji. Ocean Prediction Center National Weather Service/NCEP. CIOSS/CoRP
 NWS Operational Marine and Ocean Forecasting Overview Ming Ji Ocean Prediction Center National Weather Service/NCEP CIOSS/CoRP CoRP Symposium Corvallis, OR Aug. 12-13, 13, 2008 Titanic Telegram Marine
Zorana Jelenak Paul S. Chang Khalil Ahmed (OPC) Seubson Soisuvarn Qi Zhu NOAA/NESDIS/STAR-UCAR
 Seubson Soisuvarn Qi Zhu NOAA/NESDIS/STAR-UCAR") Near Real Time ASCAT Wind Vectors at NOAA and High Wind Issue Zorana Jelenak Paul S. Chang Khalil Ahmed (OPC) Seubson Soisuvarn Qi Zhu NOAA/NESDIS/STAR-UCAR ASCAT Wind Processing Implemented at NOAA Feb
Near Real Time ASCAT Wind Vectors at NOAA and High Wind Issue Zorana Jelenak Paul S. Chang Khalil Ahmed (OPC) Seubson Soisuvarn Qi Zhu NOAA/NESDIS/STAR-UCAR ASCAT Wind Processing Implemented at NOAA Feb
APPENDIX 2 OVERVIEW OF THE GLOBAL PRECIPITATION MEASUREMENT (GPM) AND THE TROPICAL RAINFALL MEASURING MISSION (TRMM) 2-1
 AND THE TROPICAL RAINFALL MEASURING MISSION (TRMM) 2-1") APPENDIX 2 OVERVIEW OF THE GLOBAL PRECIPITATION MEASUREMENT (GPM) AND THE TROPICAL RAINFALL MEASURING MISSION (TRMM) 2-1 1. Introduction Precipitation is one of most important environmental parameters.
APPENDIX 2 OVERVIEW OF THE GLOBAL PRECIPITATION MEASUREMENT (GPM) AND THE TROPICAL RAINFALL MEASURING MISSION (TRMM) 2-1 1. Introduction Precipitation is one of most important environmental parameters.
Impact of METOP ASCAT Ocean Surface Winds in the NCEP GDAS/GFS and NRL NAVDAS
 Impact of METOP ASCAT Ocean Surface Winds in the NCEP GDAS/GFS and NRL NAVDAS COAMPS @ Li Bi 1,2 James Jung 3,4 Michael Morgan 5 John F. Le Marshall 6 Nancy Baker 2 Dave Santek 3 1 University Corporation
Ch. 11: Hurricanes. Be able to. Define what hurricane is. Identify the life and death of a hurricane. Identify the ways we track hurricanes.
 Ch. 11: Hurricanes Be able to Define what hurricane is. Identify the life and death of a hurricane. Identify the ways we track hurricanes. What are Hurricanes? Smaller than mid-latitude cyclones. Don t
Indian Journal of Engineering
 Indian Journal of Engineering, Vol. 13, No. 31, January 1, 2016 ISSN 2319 7757 EISSN 2319 7765 Indian Journal of Engineering An International Journal Simulation of Tropical Cyclones and Their Impact on
The Impact of air-sea interaction on the extratropical transition of tropical cyclones
 The Impact of air-sea interaction on the extratropical transition of tropical cyclones Sarah Jones Institut für Meteorologie und Klimaforschung Universität Karlsruhe / Forschungszentrum Karlsruhe 1. Introduction
AnuMS 2018 Atlantic Hurricane Season Forecast
 AnuMS 2018 Atlantic Hurricane Season Forecast Issued: May 10, 2018 by Dale C. S. Destin (follow @anumetservice) Director (Ag), Antigua and Barbuda Meteorological Service (ABMS) The *AnuMS (Antigua Met
STATUS ON THE USE OF SCATTEROMETER DATA AT METEO FRANCE
 STATUS ON THE USE OF SCATTEROMETER DATA AT METEO FRANCE Christophe Payan Centre National de Recherches Météorologiques, M CNRS-GAME CNRS and Météo-France Toulouse, France 9th International Winds Workshop,
Operational Impact of QuikSCAT Winds at the NOAA Ocean Prediction Center
 AUGUST 2006 V O N A H N E T A L. 523 Operational Impact of QuikSCAT Winds at the NOAA Ocean Prediction Center JOAN M. VON AHN STG, Inc., and NOAA/NESDIS/ORA, Camp Springs, Maryland JOSEPH M. SIENKIEWICZ
The Mid Latitude Low trends Check the clouds: Check the barometer: Check the wind: Check the temperature:
 The Mid Latitude Low Mid Latitude lows tend to develop along stationary fronts. In particular, they tend to develop along a boundary between a cold, polar air mass and a warm, tropical air mass. As they
EVALUATING THE QUIKSCAT/SEAWINDS RADAR FOR MEASURING RAINRATE OVER THE OCEANS USING COLLOCATIONS WITH NEXRAD AND TRMM
 JP2.9 EVALUATING THE QUIKSCAT/SEAWINDS RADAR FOR MEASURING RAINRATE OVER THE OCEANS USING COLLOCATIONS WITH NEXRAD AND TRMM David E. Weissman* Hofstra University, Hempstead, New York 11549 Mark A. Bourassa
PRMS WHITE PAPER 2014 NORTH ATLANTIC HURRICANE SEASON OUTLOOK. June RMS Event Response
 PRMS WHITE PAPER 2014 NORTH ATLANTIC HURRICANE SEASON OUTLOOK June 2014 - RMS Event Response 2014 SEASON OUTLOOK The 2013 North Atlantic hurricane season saw the fewest hurricanes in the Atlantic Basin
SMAP Winds. Hurricane Irma Sep 5, AMS 33rd Conference on Hurricanes and Tropical Meteorology Ponte Vedra, Florida, 4/16 4/20, 2018
 Intensity and Size of Strong Tropical Cyclones in 2017 from NASA's SMAP L-Band Radiometer Thomas Meissner, Lucrezia Ricciardulli, Frank Wentz, Remote Sensing Systems, Santa Rosa, USA Charles Sampson, Naval
AnuMS 2018 Atlantic Hurricane Season Forecast
 AnuMS 2018 Atlantic Hurricane Season Forecast Issued: April 10, 2018 by Dale C. S. Destin (follow @anumetservice) Director (Ag), Antigua and Barbuda Meteorological Service (ABMS) The *AnuMS (Antigua Met
Calibrating SeaWinds and QuikSCAT scatterometers using natural land targets
 Brigham Young University BYU ScholarsArchive All Faculty Publications 2005-04-01 Calibrating SeaWinds and QuikSCAT scatterometers using natural land targets David G. Long david_long@byu.edu Lucas B. Kunz
INCREASED UTILITY OF SEA WINDS THROUGH ENHANCED CALIBRATION
 INCREASED UTILITY OF SEA WINDS THROUGH ENHANCED CALIBRATION Peter Yoho Brigham Young University Microwave Earth Remote Sensing Laboratory 459 Clyde Building, Provo, UT 84602 801-422-4884, FAX: 801-422-0201,
Why There Is Weather?
 Lecture 6: Weather, Music Of Our Sphere Weather and Climate WEATHER The daily fluctuations in atmospheric conditions. The atmosphere on its own can produce weather. (From Understanding Weather & Climate)
The Operational Use of QuikSCAT Ocean Surface Vector Winds at the National Hurricane Center
 VOLUME 24 W E A T H E R A N D F O R E C A S T I N G JUNE 2009 The Operational Use of QuikSCAT Ocean Surface Vector Winds at the National Hurricane Center MICHAEL J. BRENNAN NOAA/NWS/NCEP/National Hurricane
Chapter 24 Tropical Cyclones
 Chapter 24 Tropical Cyclones Tropical Weather Systems Tropical disturbance a cluster of thunderstorms about 250 to 600 km in diameter, originating in the tropics or sub-tropics Tropical depression a cluster
Operational Utilization of High Resolution Ocean Surface Wind Vectors (25km or better) in the Marine Forecasting Environment
 in the Marine Forecasting Environment") Operational Utilization of High Resolution Ocean Surface Wind Vectors (25km or better) in the Marine Forecasting Environment Paul S. Chang, PI NOAA/NESDIS/Office of Research and Applications NOAA Science
Operational Utilization of High Resolution Ocean Surface Wind Vectors (25km or better) in the Marine Forecasting Environment Paul S. Chang, PI NOAA/NESDIS/Office of Research and Applications NOAA Science
How does NASA study hurricanes? 17 August 2015, by Max Gleber
 How does NASA study hurricanes? 17 August 2015, by Max Gleber Hurricanes are the most powerful weather event on Earth. NASA's expertise in space and scientific exploration contributes to essential services
Satellite Oceanography and Applications 2: Altimetry, scatterometry, SAR, GRACE. RMU Summer Program (AUGUST 24-28, 2015)
") Satellite Oceanography and Applications 2: Altimetry, scatterometry, SAR, GRACE RMU Summer Program (AUGUST 24-28, 2015) Altimetry 2 Basic principles of satellite altimetry Altimetry: the measurements of
Satellite Oceanography and Applications 2: Altimetry, scatterometry, SAR, GRACE RMU Summer Program (AUGUST 24-28, 2015) Altimetry 2 Basic principles of satellite altimetry Altimetry: the measurements of
Orbit and Transmit Characteristics of the CloudSat Cloud Profiling Radar (CPR) JPL Document No. D-29695
 JPL Document No. D-29695") Orbit and Transmit Characteristics of the CloudSat Cloud Profiling Radar (CPR) JPL Document No. D-29695 Jet Propulsion Laboratory California Institute of Technology Pasadena, CA 91109 26 July 2004 Revised
Orbit and Transmit Characteristics of the CloudSat Cloud Profiling Radar (CPR) JPL Document No. D-29695 Jet Propulsion Laboratory California Institute of Technology Pasadena, CA 91109 26 July 2004 Revised
Outline of 4 Lectures
 Outline of 4 Lectures 1. Sept. 17, 2008: TC best track definition and datasets, global distribution of TCs; Review of history of meteorological satellites, introducing different orbits, scanning patterns,
Satellites, Weather and Climate Module??: Polar Vortex
 Satellites, Weather and Climate Module??: Polar Vortex SWAC Jan 2014 AKA Circumpolar Vortex Science or Hype? Will there be one this year? Today s objectives Pre and Post exams What is the Polar Vortex
ESCI 241 Meteorology Lesson 19 Tropical Cyclones Dr. DeCaria
 ESCI 241 Meteorology Lesson 19 Tropical Cyclones Dr. DeCaria READING: Chapter 16 GENERAL A tropical cyclone is a large, low-pressure system that forms over the tropical oceans. Tropical cyclones are classified
Blended Sea Surface Winds Product
 1. Intent of this Document and POC Blended Sea Surface Winds Product 1a. Intent This document is intended for users who wish to compare satellite derived observations with climate model output in the context
Q-Winds satellite hurricane wind retrievals and H*Wind comparisons
 Q-Winds satellite hurricane wind retrievals and H*Wind comparisons Pet Laupattarakasem and W. Linwood Jones Central Florida Remote Sensing Laboratory University of Central Florida Orlando, Florida 3816-
11/19/14. Chapter 11: Hurricanes. The Atmosphere: An Introduction to Meteorology, 12 th. Lutgens Tarbuck
 Chapter 11: Hurricanes The Atmosphere: An Introduction to Meteorology, 12 th Lutgens Tarbuck Lectures by: Heather Gallacher, Cleveland State University! Hurricanes: " Hurricanes are intense centers of
2013 ATLANTIC HURRICANE SEASON OUTLOOK. June RMS Cat Response
 2013 ATLANTIC HURRICANE SEASON OUTLOOK June 2013 - RMS Cat Response Season Outlook At the start of the 2013 Atlantic hurricane season, which officially runs from June 1 to November 30, seasonal forecasts
High Resolution Vector Wind Retrieval from SeaWinds Scatterometer Data
 High Resolution Vector Wind Retrieval from SeaWinds Scatterometer Data David G. Long Brigham Young University, 459 Clyde Building, Provo, UT 84602 long@ee.byu.edu http://www.scp.byu.edu Abstract The SeaWinds
Ocean in Motion 7: El Nino and Hurricanes!
 Ocean in Motion 7: El Nino and Hurricanes! A. Overview 1. Ocean in Motion -- El Nino and hurricanes We will look at the ocean-atmosphere interactions that cause El Nino and hurricanes. Using vocabulary
A Preliminary Severe Winter Storms Climatology for Missouri from
 A Preliminary Severe Winter Storms Climatology for Missouri from 1960-2010 K.L. Crandall and P.S Market University of Missouri Department of Soil, Environmental and Atmospheric Sciences Introduction The
Introduction forecast Procedure of National Typhoon Center / KMA
 The 6 th China-Korea Joint Workshop on Tropical Cyclones (26 May-1 June, 2013) Introduction forecast Procedure of National Typhoon Center / KMA Lee, Jae-shin(jaeshin_l@yahoo.com) National Typhoon Center(NTC)
16D.3 EYEWALL LIGHTNING OUTBREAKS AND TROPICAL CYCLONE INTENSITY CHANGE
 16D.3 EYEWALL LIGHTNING OUTBREAKS AND TROPICAL CYCLONE INTENSITY CHANGE Nicholas W. S. Demetriades and Ronald L. Holle Vaisala Inc., Tucson, Arizona, USA Steven Businger University of Hawaii Richard D.
AnuMS 2018 Atlantic Hurricane Season Forecast
 AnuMS 2018 Atlantic Hurricane Season Forecast : June 11, 2018 by Dale C. S. Destin (follow @anumetservice) Director (Ag), Antigua and Barbuda Meteorological Service (ABMS) The *AnuMS (Antigua Met Service)
A Preliminary Climatology of Extratropical Transitions in the Southwest Indian Ocean
 A Preliminary Climatology of Extratropical Transitions in the Southwest Indian Ocean Kyle S. Griffin Department of Atmospheric and Environmental Sciences, University at Albany, State University of New
Meeting the Needs for Satellite OVW
 Meeting the Needs for Satellite OVW NEED Multiple scatterometers to extend the coverage of QuikSCAT and provide continuity UNDERWAY EUMETSAT ASCAT on METOP series 1 st is in orbit ISRO Oceansat-2 Timely
Corrections to Scatterometer Wind Vectors For Precipitation Effects: Using High Resolution NEXRAD and AMSR With Intercomparisons
 Corrections to Scatterometer Wind Vectors For Precipitation Effects: Using High Resolution NEXRAD and AMSR With Intercomparisons David E. Weissman Hofstra University Hempstead, New York 11549 Svetla Hristova-Veleva
HY-2A Satellite User s Guide
 National Satellite Ocean Application Service 2013-5-16 Document Change Record Revision Date Changed Pages/Paragraphs Edit Description i Contents 1 Introduction to HY-2 Satellite... 1 2 HY-2 satellite data
COMPARISON OF SATELLITE DERIVED OCEAN SURFACE WIND SPEEDS AND THEIR ERROR DUE TO PRECIPITATION
 COMPARISON OF SATELLITE DERIVED OCEAN SURFACE WIND SPEEDS AND THEIR ERROR DUE TO PRECIPITATION A.-M. Blechschmidt and H. Graßl Meteorological Institute, University of Hamburg, Hamburg, Germany ABSTRACT
AnuMS 2018 Atlantic Hurricane Season Forecast
 AnuMS 2018 Atlantic Hurricane Season : August 12, 2018 by Dale C. S. Destin (follow @anumetservice) Director (Ag), Antigua and Barbuda Meteorological Service (ABMS) The *AnuMS (Antigua Met Service) is
Current and Upcoming NASA Hurricane Measurement Missions National Hurricane Conference
 NASA Science Mission Directorate Earth Science Division Applied Sciences Program Current and Upcoming NASA Hurricane Measurement Missions National Hurricane Conference April 18, 2017 Formulation Implementation
Careful, Cyclones Can Blow You Away!
 Title: Careful, Cyclones Can Blow You Away! (Meteorology) Grade(s): 6-8 Introduction: Most people associate twisters with tornadoes, but in fact tropical twisters come from hurricanes. Hurricanes are what
Predicting Tropical Cyclone Formation and Structure Change
 Predicting Tropical Cyclone Formation and Structure Change Patrick A. Harr Department of Meteorology Naval Postgraduate School Monterey, CA 93943-5114 phone: (831)656-3787 fax: (831)656-3061 email: paharr@nps.navy.mil
THE IMPACT OF SATELLITE-DERIVED WINDS ON GFDL HURRICANE MODEL FORECASTS
 THE IMPACT OF SATELLITE-DERIVED WINDS ON GFDL HURRICANE MODEL FORECASTS Brian J. Soden 1 and Christopher S. Velden 2 1) Geophysical Fluid Dynamics Laboratory National Oceanic and Atmospheric Administration
Comparison of Remotely Sensed Wind Data over Sulawesi and Maluku Islands Sea Areas
 ICoSE Conference on Instrumentation, Environment and Renewable Energy (2015), Volume 2016 Conference Paper Comparison of Remotely Sensed Wind Data over Sulawesi and Maluku Islands Sea Areas Faisal Mahmuddin,
Stability in SeaWinds Quality Control
 Ocean and Sea Ice SAF Technical Note Stability in SeaWinds Quality Control Anton Verhoef, Marcos Portabella and Ad Stoffelen Version 1.0 April 2008 DOCUMENTATION CHANGE RECORD Reference: Issue / Revision:
NHC Ocean Vector Winds Update
 NHC Ocean Vector Winds Update Michael J. Brennan NOAA/NWS/NCEP National Hurricane Center International Ocean Vector Winds Science Team Meeting Portland, Oregon, 20 May 2015 Current Status NHC is currently
P2.57 PRECIPITATION STRUCTURE IN MIDLATITUDE CYCLONES
 P2.57 PRECIPITATION STRUCTURE IN MIDLATITUDE CYCLONES Paul R. Field 1, Robert Wood 2 1. National Center for Atmospheric Research, Boulder, Colorado. 2. University of Washington, Seattle, Washington. 1.
Variations of total heat flux during typhoons in the South China Sea
 78 Variations of total heat flux during typhoons in the South China Sea Wan Ruslan Ismail 1, and Tahereh Haghroosta 2,* 1 Section of Geography, School of Humanities, Universiti Sains Malaysia, 11800 Minden,
Homework 8: Hurricane Damage (adapted from Pipkin et al.)
") 1 Homework 8: Hurricane Damage (adapted from Pipkin et al.) Tropical cyclones have a significant impact on coastal areas of the world. In the Atlantic and Eastern Pacific Oceans they are called hurricanes
1 Homework 8: Hurricane Damage (adapted from Pipkin et al.) Tropical cyclones have a significant impact on coastal areas of the world. In the Atlantic and Eastern Pacific Oceans they are called hurricanes
New NASA Ocean Observations and Coastal Applications
 New NASA Ocean Observations and Coastal Applications Duane Armstrong Chief, Applied Science & Technology Project Office August 20, 2014 1 Outline NASA s new Earth Science Ocean Science Missions for 2014
P1.6 Simulation of the impact of new aircraft and satellite-based ocean surface wind measurements on H*Wind analyses
 P1.6 Simulation of the impact of new aircraft and satellite-based ocean surface wind measurements on H*Wind analyses Timothy L. Miller 1, R. Atlas 2, P. G. Black 3, J. L. Case 4, S. S. Chen 5, R. E. Hood
Mid-season Storm Surge Update: December, 2013
 December 17, 2012 Ambleside Beach (Photograph by: Mark van Manen, PNG) Mid-season Storm Surge Update: December, 2013 Mid-season discussion of tidal and climate conditions affecting extreme water levels
Global Temperature Report: December 2018
 Jan 2, 2019 Vol. 28, No. 9 For Additional Information: Dr. John Christy, (256) 961-7763 christy@nsstc.uah.edu Dr. Roy Spencer, (256) 961-7960 spencer@nsstc.uah.edu Global Temperature Report: December 2018
Validation of QuikSCAT wind vectors by dropwindsonde data from Dropwindsonde Observations for Typhoon Surveillance Near the Taiwan Region (DOTSTAR)
") Click Here for Full Article JOURNAL OF GEOPHYSICAL RESEARCH, VOL. 115,, doi:10.1029/2009jd012131, 2010 Validation of QuikSCAT wind vectors by dropwindsonde data from Dropwindsonde Observations for Typhoon
Click Here for Full Article JOURNAL OF GEOPHYSICAL RESEARCH, VOL. 115,, doi:10.1029/2009jd012131, 2010 Validation of QuikSCAT wind vectors by dropwindsonde data from Dropwindsonde Observations for Typhoon
LECTURE #17: Severe Weather: Introduction to Hurricanes
 GEOL 0820 Ramsey Natural Disasters Spring, 2018 LECTURE #17: Severe Weather: Introduction to Hurricanes Date: 15 March 2018 I. Hurricane Overview hurricanes o what they are? o how they form? storm stages:
PICTURE OF THE MONTH. Satellite Imagery of Sea Surface Temperature Cooling in the Wake of Hurricane Edouard (1996)
") 2716 MONTHLY WEATHER REVIEW VOLUME 125 PICTURE OF THE MONTH Satellite Imagery of Sea Surface Temperature Cooling in the Wake of Hurricane Edouard (1996) FRANK M. MONALDO Applied Physics Laboratory, The
2716 MONTHLY WEATHER REVIEW VOLUME 125 PICTURE OF THE MONTH Satellite Imagery of Sea Surface Temperature Cooling in the Wake of Hurricane Edouard (1996) FRANK M. MONALDO Applied Physics Laboratory, The
2) What general circulation wind belt is the place of origin for hurricanes? A) westerlies B) trade winds C) doldrums D) horse latitudes
 What general circulation wind belt is the place of origin for hurricanes? A) westerlies B) trade winds C) doldrums D) horse latitudes") Meteo 1010 Homework 6 1) What is the difference between a typhoon and a hurricane? A) A hurricane is a true tropical cyclone, but a typhoon is not. B) A hurricane is stronger than a typhoon. C) They represent
Meteo 1010 Homework 6 1) What is the difference between a typhoon and a hurricane? A) A hurricane is a true tropical cyclone, but a typhoon is not. B) A hurricane is stronger than a typhoon. C) They represent
A NEW SAR RETRIEVAL METHOD FOR HURRICANE WIND PARAMETERS
 A NEW SAR RETRIEVAL METHOD FOR HURRICANE WIND PARAMETERS Antonio Reppucci, Susanne lehner, Johannes Schulz-Stellenfleth German Aerospace Center (DLR) Oberpfaffenhofen 82234 Wessling, Germany. Hurricane
Climate Forecast Applications Network (CFAN)
") Forecast of 2018 Atlantic Hurricane Activity April 5, 2018 Summary CFAN s inaugural April seasonal forecast for Atlantic tropical cyclone activity is based on systematic interactions among ENSO, stratospheric
Forecast of 2018 Atlantic Hurricane Activity April 5, 2018 Summary CFAN s inaugural April seasonal forecast for Atlantic tropical cyclone activity is based on systematic interactions among ENSO, stratospheric
Comments by William M. Gray (Colorado State University) on the recently published paper in Science by Webster, et al
 on the recently published paper in Science by Webster, et al") Comments by William M. Gray (Colorado State University) on the recently published paper in Science by Webster, et al., titled Changes in tropical cyclone number, duration, and intensity in a warming environment
Comments by William M. Gray (Colorado State University) on the recently published paper in Science by Webster, et al., titled Changes in tropical cyclone number, duration, and intensity in a warming environment
At the Midpoint of the 2008
 At the Midpoint of the 2008 Atlantic Hurricane Season Editor s note: It has been an anxious couple of weeks for those with financial interests in either on- or offshore assets in the Gulf of Mexico and
Climate Outlook through 2100 South Florida Ecological Services Office Vero Beach, FL September 9, 2014
 Climate Outlook through 2100 South Florida Ecological Services Office Vero Beach, FL September 9, 2014 Short Term Drought Map: Short-term (
Add NOAA nowcoast Layers to Maps
 WebEOC Maps Add-on Quick Reference Guide Add NOAA nowcoast Layers to Maps Overview With Maps Add-on, you can configure an unlimited number of map layers. These layers allow you to control the data you
Forecasting Polar Lows. Gunnar Noer The Norwegian Meteorological Institute in Tromsø
 Forecasting Polar Lows Gunnar Noer The Norwegian Meteorological Institute in Tromsø Longyearbyen Hopen Bear Island Jan Mayen Tromsø Gunnar Noer Senior forecaster / developer for polar meteorology The Norwegian
Chapter 1 Anatomy of a Cyclone
 Chapter 1 Anatomy of a Cyclone The Beast in the East 15-17 February 2003 Extra-tropical cyclone an area of low pressure outside of the tropics Other names for extra-tropical cyclones: Cyclone Mid-latitude
Use the terms from the following list to complete the sentences below. Each term may be used only once.
 Skills Worksheet Directed Reading Section: Air Masses Use the terms from the following list to complete the sentences below. Each term may be used only once. high pressure poles low pressure equator wind
Status and Plans of using the scatterometer winds in JMA's Data Assimilation and Forecast System
 Status and Plans of using the scatterometer winds in 's Data Assimilation and Forecast System Masaya Takahashi¹ and Yoshihiko Tahara² 1- Numerical Prediction Division, Japan Meteorological Agency () 2-
Japanese Programs on Space and Water Applications
 Japanese Programs on Space and Water Applications Tamotsu IGARASHI Remote Sensing Technology Center of Japan June 2006 COPUOS 2006 Vienna International Centre Water-related hazards/disasters may occur
An overview of Wet Season Forecasting in the Northern Territory
 TWP-ICE Meeting November 2004 An overview of Wet Season Forecasting in the Northern Territory Lori Chappel Northern Territory Regional Forecasting Centre Australian Government Bureau of Meteorology Day
Earth Exploration-Satellite Service (EESS)- Active Spaceborne Remote Sensing and Operations
- Active Spaceborne Remote Sensing and Operations") Earth Exploration-Satellite Service (EESS)- Active Spaceborne Remote Sensing and Operations SRTM Radarsat JASON Seawinds TRMM Cloudsat Bryan Huneycutt (USA) Charles Wende (USA) WMO, Geneva, Switzerland
Earth Exploration-Satellite Service (EESS)- Active Spaceborne Remote Sensing and Operations SRTM Radarsat JASON Seawinds TRMM Cloudsat Bryan Huneycutt (USA) Charles Wende (USA) WMO, Geneva, Switzerland
August Forecast Update for Atlantic Hurricane Activity in 2016
 August Forecast Update for Atlantic Hurricane Activity in 2016 Issued: 5 th August 2016 by Professor Mark Saunders and Dr Adam Lea Dept. of Space and Climate Physics, UCL (University College London), UK
Tropical Cyclone Ensemble Data Assimilation
 DISTRIBUTION STATEMENT A. Approved for public release; distribution is unlimited. Tropical Cyclone Ensemble Data Assimilation Istvan Szunyogh Texas A&M University, Department of Atmospheric Sciences, 3150
CALIBRATING THE QUIKSCAT/SEAWINDS RADAR FOR MEASURING RAINRATE OVER THE OCEANS
 CALIBRATING THE QUIKSCAT/SEAWINDS RADAR FOR MEASURING RAINRATE OVER THE OCEANS David E. Weissman Hofstra University, Hempstead, New York 11549 Mark A. Bourassa COAPS/The Florida State University, Tallahassee,
Image 1: Earth from space
 Image 1: Earth from space Credit: NASA Spacecraft: Apollo 17 Sensor: camera using visible light Image date: December 7, 1972 This image is a photograph of Earth taken by Harrison "Jack" Schmitt, an astronaut
IMPACT OF GROUND-BASED GPS PRECIPITABLE WATER VAPOR AND COSMIC GPS REFRACTIVITY PROFILE ON HURRICANE DEAN FORECAST. (a) (b) (c)
 (b) (c)") 9B.3 IMPACT OF GROUND-BASED GPS PRECIPITABLE WATER VAPOR AND COSMIC GPS REFRACTIVITY PROFILE ON HURRICANE DEAN FORECAST Tetsuya Iwabuchi *, J. J. Braun, and T. Van Hove UCAR, Boulder, Colorado 1. INTRODUCTION
9B.3 IMPACT OF GROUND-BASED GPS PRECIPITABLE WATER VAPOR AND COSMIC GPS REFRACTIVITY PROFILE ON HURRICANE DEAN FORECAST Tetsuya Iwabuchi *, J. J. Braun, and T. Van Hove UCAR, Boulder, Colorado 1. INTRODUCTION
Weather Studies Introduction to Atmospheric Science
 Weather Studies Introduction to Atmospheric Science American Meteorological Society Chapter 1 Monitoring The Weather Credit: This presentation was prepared for AMS by Michael Leach, Professor of Geography
Weathernews Looks Back at 2015: A Year of Storms. Powerful Typhoons Occurred with Changing Patterns in El Niño Years
 NEWS RELEASE January 27th, 2016 Weathernews Looks Back at 2015: A Year of Storms Powerful Typhoons Occurred with Changing Patterns in El Niño Years Weathernews Inc. (Chiba, Japan; Chihito Kusabiraki/CEO)
Extratropical transition of North Atlantic tropical cyclones in variable-resolution CAM5
 Extratropical transition of North Atlantic tropical cyclones in variable-resolution CAM5 Diana Thatcher, Christiane Jablonowski University of Michigan Colin Zarzycki National Center for Atmospheric Research
Outline of 4 Lectures
 Outline of 4 Lectures 1. Sept. 17, 2008: TC best track definition and datasets, global distribution of TCs; Review of history of meteorological satellites, introducing different orbits, scanning patterns,
Remote Sensing of Ocean Winds
 Remote Sensing of Ocean Winds Stephen Frasier Dept. of Electrical and Computer Engineering Offshore Wind Energy IGERT Seminar 3/5/2015 Remote Sensing of Wind For wind energy applications: Wind Profilers
Tropical Storms & Hurricanes Part 1. August 1992
 Lecture #16 (April 5, 2010, Monday) Tropical Storms & Hurricanes Part 1 August 1992 Tracks of rain accumulation & clouds from Hurricane Rita September 2005 Tropical Cyclones Around the Globe Why none here?
The benefits and developments in ensemble wind forecasting
 The benefits and developments in ensemble wind forecasting Erik Andersson Slide 1 ECMWF European Centre for Medium-Range Weather Forecasts Slide 1 ECMWF s global forecasting system High resolution forecast
(April 7, 2010, Wednesday) Tropical Storms & Hurricanes Part 2
 Tropical Storms & Hurricanes Part 2") Lecture #17 (April 7, 2010, Wednesday) Tropical Storms & Hurricanes Part 2 Hurricane Katrina August 2005 All tropical cyclone tracks (1945-2006). Hurricane Formation While moving westward, tropical disturbances
Lecture #17 (April 7, 2010, Wednesday) Tropical Storms & Hurricanes Part 2 Hurricane Katrina August 2005 All tropical cyclone tracks (1945-2006). Hurricane Formation While moving westward, tropical disturbances
Quality Control and Wind Retrieval for SeaWinds
 Quality Control and Wind Retrieval for SeaWinds by M. Portabella and A. Stoffelen Final report of the EUMETSAT QuikSCAT fellowship February 2002 Contents PREFACE... 3 1 INTRODUCTION... 5 2 PRODUCT VALIDATION...
Calibration and Validation of the RapidScat Scatterometer. Using Natural Land Targets. Nathan M. Madsen
 Calibration and Validation of the RapidScat Scatterometer Using Natural Land Targets Nathan M. Madsen A thesis submitted to the faculty of Brigham Young University in partial fulfillment of the requirements
Transient/Eddy Flux. Transient and Eddy. Flux Components. Lecture 7: Disturbance (Outline) Why transients/eddies matter to zonal and time means?
 Why transients/eddies matter to zonal and time means?") Lecture 7: Disturbance (Outline) Transients and Eddies Climate Roles Mid-Latitude Cyclones Tropical Hurricanes Mid-Ocean Eddies (From Weather & Climate) Flux Components (1) (2) (3) Three components contribute
Lecture 7: Disturbance (Outline) Transients and Eddies Climate Roles Mid-Latitude Cyclones Tropical Hurricanes Mid-Ocean Eddies (From Weather & Climate) Flux Components (1) (2) (3) Three components contribute
April Forecast Update for Atlantic Hurricane Activity in 2018
 April Forecast Update for Atlantic Hurricane Activity in 2018 Issued: 5 th April 2018 by Professor Mark Saunders and Dr Adam Lea Dept. of Space and Climate Physics, UCL (University College London), UK