Analyses of Start stop Waves in Congested Freeway Traffic. Michael Mauch. A dissertation submitted in partial satisfaction of the
|
|
|
- Elizabeth Bates
- 5 years ago
- Views:
Transcription
1 Analyses of Start stop Waves in Congested Freeway Traffic by Michael Mauch B.S. (Marquette University) 1982 B.S. (Chapman University) 1988 M.A. (University of California at Los Angeles) 1996 M.S. (University of California at Berkeley) 1999 A dissertation submitted in partial satisfaction of the requirements for the degree of Doctor of Philosophy in Engineering Civil and Environmental Engineering in the GRADUATE DIVISION of the UNIVERSITY OF CALIFORNIA AT BERKELEY Committee in charge: Professor Michael J. Cassidy, Chair Professor Carlos F. Daganzo Professor Elizabeth A. Deakin Professor Deborah Nolan Spring 2002
2 The dissertation of Michael Mauch is approved: Chair Date Date Date Date University of California at Berkeley Spring 2002
3 Analyses of Start stop Waves in Congested Freeway Traffic Copyright 2002 by Michael Mauch
4 Abstract Analyses of Start stop Waves in Congested Freeway Traffic by Michael Mauch Doctor of Philosophy in Engineering Civil and Environmental Engineering University of California at Berkeley Professor Michael J. Cassidy, Chair Freeway traffic was observed over multiple days and was found to display certain regular features. Oscillations arose only in queues; they had periods of several minutes; and their amplitudes stabilized as they propagated upstream. They propagated at a nearly constant speed of about 20 to 24 kilometers per hour, independent of the location within the queues and the flow measured there; this was observed for a number of locations and for queued flows ranging from about 850 to 2,000 vehicles per hour per lane. The effects of the oscillations were not felt downstream of the bottleneck. Thus, the only effect on upstream traffic was that a queue s tail meandered over time by small amounts. (For the long queues studied here, the tails deviated by no more than about 16 vehicle spacings, as compared with predictions that ignored the oscillations). Notably, the character of queued traffic at fixed locations did not change with time, despite the oscillations; i.e., traffic did not decay. There were changes over space, however. New oscillations formed in moderately dense queues near ramp interchanges and then grew to their full amplitudes while propagating 1
5 upstream, even though the range of wave speeds was narrow. The formations of these new oscillations were strongly correlated with vehicle lane changing. It thus appears that the oscillations were triggered by random vehicle lane changing in moderately dense queues more than by car following effects. But this pattern of formation and growth was less evident in a very dense queue (caused by an incident), although frequent lane changing occurred near the interchanges. Finally, kinematic wave theory was found to describe the propagation of the oscillatory (i.e., start stop waves) to within small errors. For distances approaching one kilometer, and for two hour periods, the theory predicted the locations of vehicles to within about 5 vehicle spacings. Further analysis showed that some of these small discrepancies are explained by differences in car following behavior across drivers. Professor Michael J. Cassidy, Committee Chair 2
6 DEDICATION This work is dedicated to my father and mother, who supported my efforts throughout the years, and who have always been there for me. I also dedicate this work to Professor Gordon F. Newell. Gordon was one of my advisors and a mentor to me. I admired him greatly. A fatal car accident took him from us on February He will never be replaced. Without his insights, this research never would have happened. ACKNOWLEDGEMENTS I am grateful and indebted to my advisor, Professor Michael Cassidy. Conducting this research and writing this dissertation would not have been possible without his patience, guidance, and tireless devotion to this work. I also thank David Tsui and Mark Fox of the Ontario Ministry of Transportation for providing the data. Funding for this research was provided by the University of California Transportation Center. i
7 TABLE OF CONTENTS 1 Introduction 1 2 Related Research 3 3 Study Site and Data Description Bottleneck Activation and Queue Formation 10 4 Research Findings Oscillations in Queued Traffic Freeway Geometry and Vehicle Lane changing The Oscillations in Individual Travel Lanes Disturbance Propagation Speeds Modeling Disturbance Propagation as Brownian Motion Predicting Vehicle Motions in Freeway Traffic Queues 62 5 Testing Simple Traffic Flow Theories Simplified Kinematic Wave Theory Simplified Car following Theory 69 6 Concluding Remarks 77 REFERENCES 79 ii
8 LIST OF TABLES 4.1 Traffic Conditions in a Long Freeway Queue Across Lane Differences in Wave Arrival times by Study Day Across Lane Differences in Wave Arrival times by Location Wave Travel times by Date Wave Travel times by Bottleneck cause Wave Travel Times 61 (a) Recurrent Bottleneck s Queue (b) Dense Incident induced Queue 5.1 Test of Kinematic Wave Theory Difference between [N*, T*] by Location and Bottleneck cause Summary of Key Findings 77 iii
9 LIST OF FIGURES 3.1 Freeway Geometry of Study Site Oblique N curves at the Active Bottleneck: Dec. 15 th Recurrent Bottleneck Oblique N curves at the Active Bottleneck: Sept. 21 st Incident Bottleneck Oblique N curves at the Active Bottleneck: April 06 th Incident Bottleneck Oblique N curves at the Active Bottleneck: April 06 th Recurrent Bottleneck Flow Deviation Curves (a) April 06 th, Recurrent Bottleneck s Queue 22 (b) December 15 th, Recurrent Bottleneck s Queue Twenty Minute RMSE s of Deviation Curves (a) RMSE s of Flow Deviation Curves by Location, Recurrent Queue (b) Long run Flows by Location, Recurrent Queue Flow Deviation Curves, Incident induced Queue (a) RMSE s of Flow Deviation Curves, Incident induced Queue (b) Long run Flows Vs. Location, Incident induced Queue Oblique N curves, Recurrent Queue Lane changing Rates Vs Time, Recurrent Queue Cross Correlation Term Vs Time, Recurrent Queue 36 iv
10 4.9 Conditions in a Dense Incident induced Queue 37 (a) RMSE s of Flow Deviation Curves by Location (b) Long run Flows by Location (c) Cross Correlation Term Vs Time, Downstream Freeway Segments 4.10 Individual lane Flow Deviation Curves, Recurrent Queue Differences in Wave Arrival times by Travel Lanes Box Plot of Differences in Wave Arrival times by Travel Lanes Methodology to Determine Wave Travel times Mean Wave Propagation Speeds by Location Four day Average, Recurrent Queue Mean Wave Propagation Speeds by Location Incident induced Vs Recurrent Queue Distribution of Wave Travel times, Recurrent Queue Distribution of Wave Travel times, Incident induced Queue Wave Propagation Speeds Scatterplot, Recurrent & Incident induced Queues Empirical Flow Density Relation Vehicle Trajectories in the Time Space Plane Oblique Time shifted N curves, Simplified Kinematic Wave Theory Vehicle Trajectory Plot Illustrating Car following Model Parameters Normalized Wave Travel time Vs. Number of Vehicles Traversed 75 v
11 1 INTRODUCTION This dissertation documents an empirical study of the observable features of oscillations or slow and go disturbances in queued freeway traffic. Although the driver interactions that initiated these disturbances were not completely identified, the visual inspection of cumulative vehicle count curves, measured from loop detectors and transformed in special ways, revealed a number of previously undetected and significant attributes of these disturbances. Traffic oscillations are shown to originate within the traffic queue upstream of a bottleneck and propagate upstream, as waves, with predictable properties. These observations have several important implications. First, since these oscillations were always found to originate in the queue, they were a consequence of queuing and not the cause. Next, since the oscillations propagated in the upstream direction only, they did not affect bottleneck capacity and congestion related delays. Finally, since they propagated in a predictable manner, their effects on fuel consumption, engine emissions, driver comfort, and traffic safety can be modeled. Towards developing such a model, several of the observable features of these oscillatory disturbances were quantified, including the mean traffic flows carried by these oscillations, and their travel times between detector stations. Finally, kinematic wave theory was found to describe the propagation of the oscillations to within small errors. For distances approaching one kilometer, and for two hour periods, the theory predicted the locations of vehicles to within about 5 vehicle spacings. Further analysis 1
12 showed that some of these small discrepancies are explained by differences in car following behavior across drivers. In all, the findings indicate that the observed disturbances propagated in ways consistent with the simplest theories of traffic flow. Related research is summarized in the following section (Section 2). The freeway site used for this study, and the many hours of traffic data collected there, are described in section 3. In section 4, some of the notable features observed in the oscillations are presented, along with some evidence that the oscillations were triggered by vehicle lane changing. Section 5 shows that the oscillations propagated through queued traffic in ways that closely matched the descriptions of simple theories. Some of the implications of these findings are briefly discussed in the dissertation s sixth and final section. 2
13 2 RELATED RESEARCH Some of the earliest studies on disturbances propagating through traffic streams were conducted by L.C. Edie and R.S. Foote as part of an ongoing effort to increase the capacity of New York s Holland and Lincoln tunnels. 1 Curves of cumulative vehicle counts verses time were created using data collected within the tunnels. Using this graphical tool, the researchers were able to trace the paths of six backward moving disturbances that were observed in one traffic lane under congested conditions. In addition, they estimated the average backward moving wave speed (10.2 mph) and these propagated as per kinematic wave theory. 2 In a later article that used the same Lincoln and Holland Tunnel data, Edie and Bavarez (1967) studied the motion of 12 stoppage waves and found that these waves were all generated upstream of the bottleneck area, and that the average stoppage wave speed was comparable to earlier findings (10.86 mph). In 1968, T.W. Forbes and M.E. Simpson showed several examples of waves (i.e., disturbances in the flow of traffic) in a single freeway lane, by graphing vehicle trajectories in the time space plane. They observed that some of the waves changed speed as they propagated upstream through the traffic queue, but most propagated at a stable speed. Some of the deceleration and acceleration waves fanned out as they propagated, some converged, and some remained at parallel over time and space. The researchers also measured wave travel time between vehicles (i.e., driver response times) and found that these were in the range of 1.06 to 1 Edie, L.C. and Foote, R.S. (1961). 2 Edie, L.C. and Foote, R.S. (1961), pp
14 2.4 seconds for a moderately dense queue, and from 0.9 to 2.0 seconds for a more congested segment. 3 The researchers concluded that Deceleration wave propagation response time will approach true driver sensitivity (minimum perception judgment response time) when headways are very short, with longer headways the driver and vehicle response to deceleration ahead may include an additional lag. 4 More recently, B.S. Kerner and H. Rehborn (1996, 1999) studied start stop waves on a three lane Autobahn between Frankfurt a. Main and Bad Homburg, Germany. They examined the motion of waves as they traveled upstream through congested traffic for over 13 kilometers. 5 The researchers reported that these waves propagated with a stable velocity and that they traveled through multiple junctions without significant changes in their structure. 6 In 1998, J.D. Windover conducted an empirical study concentrating on wave speed and some associated properties (i.e., variance in wave speed). He showed that wave speed was nearly constant over the 2 kilometer homogeneous freeway section studied. Additionally, he observed that acceleration and deceleration disturbances had statistically similar travel times between fixed observation points. He also verified that the wave speed was independent of the traffic conditions (e.g., traffic flow and density), which implies that the flow density relation is linear over the observed range of traffic conditions and that this held true for both acceleration and deceleration waves. These findings were consistent with Newell s simplified kinematic 3 Forbes, T.W. and Simpson, M.E. (1968), p Forbes, T.W. and Simpson, M.E. (1968), p Kerner, B.S., and Rehborn, H. (1996). 4
15 wave theory, which stated that the fundamental relationship between flow and density could be estimated by a triangular shaped curve. Another significant contribution was that Windover showed that wave propagation could be modeled as Brownian motion. Most recently, J.M. Del Castillo (2001) postulated that vehicle speed perturbations might be ultimately caused by vehicle maneuvers such as a lane change or merging. He also stated that geometrical and environmental changes of the road might disturb the speed of the traffic stream. 7 He also showed an instance of the fanning of a speed perturbation in a single travel lane as it propagated upstream over about a 5 kilometer stretch of freeway. 8 He also showed vehicle trajectory plots, i.e., time space diagrams from Forbes (1968); among the sample of waves shown, some waves remained at constant spacing, while others fanned out, and still other waves were converging. This showed that the observed wave speeds (over relatively short time periods) may vary even though the expected (e.g., long term) wave speed might be constant as found by Windover. Next, the freeway site and the data collected there are described. Then, in Section 4, findings from the study of these data are presented. 6 Kerner, B.S., and Rehborn, H. (1996), pp. R Del Castillo, J.M. (2001), p Del Castillo, J.M. (2001), p
16 3 STUDY SITE AND DATA DESCRIPTION The data used in this study were collected during six weekday mornings from freeway loop detectors along a ten kilometer eastbound section of the Queen Elizabeth Way (QEW) in Ontario, Canada (see Figure 3.1). The six mornings analyzed were April , December , September , September , September , and September In Figure 3.1, the loop detectors are shown as small circles. However, in reality, each detector consists of two closely spaced loops in each travel lane. Each detector station records vehicle counts, detector occupancies, and time mean vehicle speeds over 20 second intervals for each travel lane. The detector station numbering scheme used by the Ontario Ministry of Transportation (MTO) is also shown in Figure 3.1 and this scheme was used to identify the detector stations for this research. Throughout the study area, traffic responsive metering restricts the on ramp flows (with the exception of the on ramp just downstream of station 53 which has no meter). The freeway geometry and traffic conditions along this particular stretch of the QEW were well suited for studying start stop waves. During the typical morning commute period, a bottleneck formed somewhere between detector stations 51 and 52, creating a long queue of congested traffic upstream. Plots of oblique N curves (i.e., queueing diagrams revealing the accumulation of vehicles due to congestion) constructed for longer periods confirmed that this bottleneck remained active for more than two hours on each of the study days. There are three detector stations downstream of the bottleneck (stations 52, 53 and 54) and twelve stations upstream 6
17 (stations 40 51). Numerous start stop waves are initiated within, and propagate upstream through this queue. Moreover, the freeway contains no obvious inhomogeneities other than the ramp junctions and an occasional auxiliary lane. These limited and identifiable inhomogeneities proved quite helpful in determining that wave propagation speeds were independent of the observed traffic flow (or vehicular density), and in studying the effects of the ramp flows on the oscillations. Also as a result of the ramp flows, the observed flows within the queue varied between ramp junctions providing a wider range of flows and vehicular density than would have otherwise been available. The latter phenomena occurred because the inflows from each of the site s on ramps exceeded the exit flows to each off ramp. The net inflows restricted freeway traffic arriving at the interchanges such that each became a bottleneck, although not an active one. 9 The range of observed traffic conditions was further extended, thanks to freeway incidents that occurred on two of the study days. The first such incident, a freeway accident, occurred on the morning of April 6 th between stations 46 and 47. This accident caused lane closures, resulting in a slow moving queue of dense traffic upstream of the incident. On September 21 st, a second incident occurred a short distance downstream of detector 50 and persisted for about 40 minutes. Like the April 6 th incident, it created a long queue that was denser than those typical of rush hour traffic. 9 For more details, see Cassidy and Mauch,
18 8
19 The average discharge flow from the bottleneck caused by the April 6 th incident was about 2,190 vehicles per hour (vph). The average discharge flow from the September 21 st incident induced bottleneck was less than 4,600 vph. Normally, the recurrent bottleneck s discharge rate was in the range of 6,200 vph. Both incidents were confirmed from detailed incident records maintained by MTO, the regional transport authority. As was stated earlier, a bottleneck activated somewhere between detectors 51 and 52 on each of the six mornings studied. On December 15 th, the queue extended upstream to somewhere between stations 40 and 41. On the other 5 mornings, the queues extended backward over this entire stretch of freeway (i.e., upstream of detectors 40). Additionally, observations described in Cassidy and Bertini (1999) show that a bottleneck consistently formed at this location on each of several other mornings studied. Next (in Section 3.1), oblique N curves constructed from the loop data are used to confirm bottleneck activation and that queue formation does indeed occur as previously described. The findings are discussed in Section 4, which follows. 9
20 3.1 BOTTLENECK ACTIVATION AND QUEUE FORMATION On each of the six observation days, the freeway segment between stations 51 and 52 contained an active bottleneck; i.e., a bottleneck characterized by queues upstream and freely flowing traffic downstream. 10 Figure 3.2 verifies this using the December 15 th data and it serves to illustrate the method used for making this determination. Shown in this figure are specially transformed curves of cumulative vehicle count, N, versus time, t, measured across all travel lanes at detectors 50 through 53. The curves were constructed such that the vertical separations between any two of them are the excess vehicle accumulations between their respective detectors due to vehicular delays. An oblique coordinate system was used in the figure to plot N q t ) versus t for each 0 ( t 0 curve s starting time, t 0, and some choice of a background flow, q 0 ; the latter was selected so that the range of N q t ) was small when compared to the N, itself. This coordinate 0 ( t 0 system magnified the figure s vertical axis which, in turn, amplified not only the curves vertical separations but also the changing slopes of the curves themselves. Since each curve was drawn using piece wise linear interpolations through the detectors 20 second vehicle counts, flow changes were made more visible by these amplifications in the slopes. The oblique N curves in Figure 3.2 reveal the bottleneck s location. They show that traffic on, and downstream of, station 52 was initially freely flowing and that conditions remained in free flow between detector stations 52 and 53. Curves 51 and 50, however, eventually diverge 10
21 from their two downstream counterparts. Increased vehicle accumulations appearing upstream of detector 52 while free flow conditions prevailed immediately downstream indicates that a bottleneck activated between detectors 51 and 52 (at approximately 6:44 am). It is suspected that this activation was due to merging; apparently some vehicles from the Cawthra Road on ramp merged after traveling a good distance on the freeway's shoulder. 11 The increased separations between curves 51 and 50 (beginning at about 6:47:20) reveal when the backward moving queue arrived at detector 51. It is also clear that the tail of this queue arrived at detector 50 at approximately 6:54; that curves 50 and 51 become roughly parallel at this time indicates that the flow over the entire intervening segment had become constrained by the queue. 12 By inspecting curves at upstream detectors in the manner just described, it was observed that the tail of the queue propagated upstream and eventually passed detector 41. While the bottleneck was active, the flows within the upstream queue were constrained by the bottleneck. These flows can be estimated in a simple way by adopting a suggestion made by Newell (1993): the interchanges are modeled as single points along the freeway, with any ramp entries and exits occurring at these points. Vehicles that enter the queued portion of the freeway from an interchange restrict the flow of vehicles arriving at this same interchange from upstream; i.e., the on ramp vehicles take available road space from the upstream freeway arrivals. Since 10 Daganzo, C.F. (1997). 11 It is known that the activation occurred each day at approximately the same time and location. Following this, the bottleneck exhibited a reproducible average vehicle discharge rate (see Cassidy and Bertini, 1999a). These point to exogenous cause(s) for the bottleneck's activation. 12 Newell, G.F. (1993). 11
22 at each interchange, the rate that vehicles entered the freeway via its on ramp(s) exceeded the rate exiting from its off ramp(s), the flows on each successive upstream segment steadily diminished; i.e., the queued flow just upstream of the bottleneck equaled the bottleneck s capacity, while the flow upstream of the first ramp junction was this bottleneck capacity minus the net inflow from that interchange, etc. This is important because it provided a range of flows within the queue, with the highest of these occurring at the bottleneck and the lowest flows occurring at the upstream end of the queue. On September 21 st, the recurrent bottleneck (between stations 51 and 52) activated sometime between 6:15 and 6:20 am. Then at about 7:57 am, an incident occurred that restricted vehicular flows causing an incident induced bottleneck to activate somewhere between detectors 50 and 51 (see Figure 3.3). According to the MTO s incident records: Debris was hanging down over lane 2 from a pedestrian overpass east of Cawthra Road from 8:10 am to 8:40 am. It is presumed that this debris caused a bottleneck to activate between detectors 50 and 51, which deactivated the downstream (recurrent) bottleneck between detectors 51 and 52. Although, the debris was first reported at 8:10 am, it is clear from Figure 3.3 that a bottleneck formed at this location prior to 8:00 am. The bottleneck deactivated at about 8:40 am, after which time, the recurrent bottleneck downstream (between stations 51 and 52) reactivated. 12
23 13
24 14
25 During the time of the incident, the flows were much lower than those observed while the recurrent bottleneck was active, as the former was more restrictive than the latter. This provided an opportunity to observe start stop waves under different conditions (i.e., with lower prevailing flows, and with the active bottleneck at a different location). In Figure 3.3, oscillations in the flows (i.e., start stop waves) can be seen forming near station 49, which is upstream of the incident induced bottleneck. These oscillations are even more prominent upstream at station 48. In contrast, the flows through the incident induced bottleneck (at station 50) are smooth, as they are at downstream stations 51 and 52. This shows that these start stop waves were initiated within the queue, upstream of the bottleneck, and that these disturbances did not propagate downstream to affect the flows through the bottleneck. The oblique N curves constructed from the April 6 th data, in Figure 3.4, reveal that a bottleneck activated somewhere between detectors 46 and 47 at about 6:15:40 am. This bottleneck caused a queue to form that extended upstream of detector 40. Interestingly, no start stop waves were observed in the queue upstream of this incident. The incident (near station 46) was confirmed by MTO s incident records, which stated: The incident started out as a left lane blockage at 6:16:33. At 6:19:47, it was upgraded to 2 left lanes blocked. At 6:30:24, it went back to single left lane blockage, and then cleared at 6:43:41. The whole incident lasted for 27 minutes 8 seconds. 15
26 Also from the re scaled N curves in Figure 3.4, it can be seen that the incident cleared around 6:43:40 am, releasing the previously constrained queue of vehicles downstream. Minutes later, at approximately 6:52:40 am, the recurrent bottleneck (between detectors 51 and 52) activated (see Figure 3.5). Again, the queue grew and eventually extended upstream beyond detector 40. Once the bottlenecks locations, durations, and associated queues were identified, the congested regime was known. This is important for studying start stop waves, as start stop waves proved to be a property of congested traffic and cannot exist in freely flowing conditions. More is said about this in the following section. 16
27 17
28 18
29 4 RESEARCH FINDINGS Section 4 presents some of the observations made in this study. In section 4.1, the oscillations are displayed by constructing specially transformed cumulative vehicle count curves from the measured data. Section 4.2 explores plausible causation between the formation and growth of these oscillations and vehicle lane changing (i.e., the merging and diverging that arises at the freeway s interchanges). Section 4.3 shows these oscillations in the individual travel lanes. Section 4.4 examines the propagation speeds of these oscillations. Section 4.5 shows that the propagation of the individual disturbances that comprise these oscillations can be modeled as Brownian motion. Section 4.6 combines the results presented in Sections 4.1 through 4.5 to construct some vehicle trajectories, illustrating the effects that these oscillations have on the vehicles traversing the queues. 4.1 OSCILLATIONS IN QUEUED TRAFFIC Curves like those in Figure 4.1(a) reveal a number of details about oscillations. Each curve shown here is the difference between the observed cumulative vehicle counts to time t, N (t) 13, and a 15 minute moving average of the N (t) centered on time t, N ( ) 15 t 14,15. As such, the slope of each curve is the deviation (in flow) from the 15 minute average flow at that time. The vertical displacements between one of these N curves and its horizontal trend line are denoted t n 13 N ( t) = i = 0 i, where n i is the number of vehicles (measured across all travel lanes) that passed over the detector during the 20 second count period i. 14 ( t) = [ N ( t + 7.5min) + N( t 7.5 min) ]/ 2 N
30 N N 15. Analogously, these N15 N curves can be thought of as residual plots, e.g., from a regression analysis, where the residuals are simply the difference between an observed variable and some model predicting this variable. (Here, the variable of interest is N, and the predicting model is the 15 minute moving average of N.) Each deviation curve in Figure 4.1(a) is vertically displaced from its neighbor in proportion to the distance actually separating their detectors. (And most of the freeway stretch is reproduced along the left edge of the figure as a convenience to the reader). The April 6 th data were used to create Figure 4.1(a). The counts for these curves were measured across all lanes. These were taken when the queue from the active bottleneck had filled the entire upstream portion of the freeway stretch. Some of the average flows measured during the one hour period shown in the figure are annotated to illustrate that flows diminished upstream of the junctions. The wiggles made prominent on some of the deviation curves are the start stop waves themselves. They are characterized by sequences of high and low flows with periods of several minutes each. The amplitude of each oscillation eventually stabilized; the N N15 are not more than 50 vehicles (or about 16 vehicles per lane) and a scale is provided in Figure 4.1(a) to verify this. 15 A 15 minute time window was used for the moving average as 15 minutes is at least 2 times the duration of the oscillations, in accordance with the Nyquist sampling criterion. The duration of the oscillations are in the range of 4 to 7 minutes. 20
31 Also included in this figure are dashed lines tracing the motion of some of these oscillations. (These lines are shown connecting the peaks of wiggles, as this made for an uncluttered presentation). These dashed lines show that the oscillations propagated upstream, against the flow of traffic. That the lines are parallel indicates that the wave speeds were nearly constant, despite the presence of ramp interchanges and the reduced flows that prevailed upstream of each ramp junction. 16 The oscillations did not affect freely flowing traffic upstream of a queue s tail. As evidence of this, Figure 4.1(b) presents the N N15 curves constructed using the December 15 th count data. The features of these curves are much the same as the April 6 th curves shown in the previous figure. But on this day, the bottleneck s queue did not quite fill the entire upstream freeway stretch; i.e., the tail of the queue propagated beyond detector 41 (as before), but it did not reach detector 40 further upstream. Figure 4.1(b) shows that the oscillations, in turn, moved through the queue, but they did not continue beyond its tail; i.e., the wiggles displayed on curve 41 and most of its downstream counterparts are not evident on curve 40. Moreover, the oscillations originated within the queue and their effects did not propagate downstream beyond the head of the queue. That these oscillations are initiated upstream of the active bottleneck is consistent with the findings of Edie and Foote (1961), Edie and Bavarez 16 Further analyses showed that average wave speeds on each segment ranged from about 20 to 24 kilometers per hour and that flow had no systematic effects on these (See Section 4.4 of this thesis). Small reductions in average wave speeds did occur near interchanges, but we suspect this was linked to vehicle lane changing. More is said about lane changing effects in Section 4.2 of this thesis. 21
32 22
33 23
34 (1967) and Del Castillo (2001). In both Figures 4.1(a) and (b), the deviation curves at detector 52 describe the bottleneck s discharge and these remained relatively smooth, despite the oscillations upstream. It follows that the oscillations had relatively little effect on the growth of queues; i.e., they caused a queue s tail to meander over time by small amounts. The extent of this meandering did not exceed about 16 vehicle spacings. Of further note, the effects of these oscillations (i.e., the flow variations they caused) did not change systematically over time. Figure 4.2 presents evidence of this for several queued locations. These plotted lines display root mean squared errors (RMSE) taken over 20 minute periods; i.e., shown for each detector interval ending at time t are the t+ 10min k = t 10min ( N k) N ( k) ) 2 15 /(20 minutes ) ( 1 2. The values in Figure 4.2 are actually averages taken over four days (April 6 th, September 15 th, September 22 nd, and September 23 rd ). 17 These show no systematic trends over time, revealing that the oscillations did not steadily grow in amplitude and cause traffic to decay. Also, visual inspection of the curves shown in Figures 4.1(a) and (b) at any location reaffirms that the start stop waves did not grow systematically over time. But the oscillations and their effects did change with location. For example, traffic did not oscillate between the same two flows at all points within the queue. Rather, both the high and low flows diminished with distance from the active bottleneck in much the same fashion as did 17 On December 15 th, station 43 was malfunctioning. On September 21 st, station 42 was malfunctioning. 24
35 the longer run average flows. Evidence of this is provided in Table 4.1, which lists some of the average flows (and vehicle speeds) measured during the queued portion of the April 6 th rush. Deviations From the Average Detector Average Flows Long Run Mean Flow Vehicle Speeds Station Long run High Low High Low High Low Number (vph) 18 (vph) (vph) (vph) (vph) (kph) 19 (kph) 40 3,900 4,640 2, , ,900 4,670 2, , ,380 5,250 3, , ,910 5,550 3, , ,270 5,800 3, , ,030 5,460 4, ,060 N/A N/A 86 Table 4.1 Traffic Conditions in a Long Freeway Queue (April , Recurrent Bottleneck s Queue) Figure 4.2 also shows the oscillations effects increased in the upstream direction. This occurred because new oscillations arose at different locations in the queue and grew to their full amplitudes while propagating upstream. Numerous examples of this are apparent in Figures 4.1(a) and (b). 18 Vehicles per hour. 19 Kilometers per hour. 25
36 Still more evidence of this is shown in Figure 4.3(a). For each detector, it displays the root mean squared errors of the N N15 curves; these are the averages measured for 2 hours on each of the four days. The figure reveals certain telling trends. Namely, the oscillations effects grew as they propagated over freeway segments near interchanges. However, this growth did not continue on segments located further upstream where no interchanges were present, i.e., segments and
37 Figure 4.3(b) shows long run average flows measured by the detectors in individual lanes; i.e., these flows were measured over two hour periods for each day (from 7 9 am, while the recurrent bottleneck was active and the tail of the queue was upstream of station 40). The 27
38 curves displayed are averages over the four days. 20 This figure clearly shows decreases in shoulder lane flows downstream of the off ramps and increases in shoulder lane flows downstream of the on ramps. This figure also illustrates that the observed freeway flows increase as one passes the ramp junctions (in the downstream direction) as was described in Section 3. This growth might seem puzzling in light of the very regular ways the oscillations propagated through queued traffic. Since each traveled at a nearly constant speed, the occurrence of new oscillations cannot be caused by diverging waves; i.e., these new formations cannot be explained by theories of traffic instability (e.g., Newell, 1962). The answer instead appears to lie with the freeway s geometric features (i.e., ramps) and the lane changing these induced. Further evidence of this is provided in Section 4.2, which follows this section. Interestingly, the oscillations observed in the queue during the September 21 st incident were visibly different than those upstream of the recurrent bottleneck on that same day. Figure 4.4 shows the N N15 curves constructed from the data on this day. From this figure, it is clear that the oscillations that occurred during the incident were smaller in amplitude and period than those found prior to, and following, the time of the incident. Figure 4.5 further illustrates this by displaying the RMSE s of the N N15. These were calculated for each detector station over 20 The four days used were April , September , September , and September The December data were not used as station 43 was malfunctioning and the tail of the queue did not reach detector 40. The September data were not used because of the previously described incident and because station 42 was malfunctioning. 28
39 29
40 the duration of the incident. For comparative purposes, this graph also shows the RMSE s of the N N15 calculated for the same day while the recurrent bottleneck was active (i.e., prior to the incident and after the incident cleared). The latter oscillations and their associated RMSE s are comparable to those found upstream of the recurrent bottleneck on the other study days. 30
41 4.2 FREEWAY GEOMETRY AND VEHICLE LANE CHANGING Strong correlation between vehicle lane changing and the formation and growth of new oscillations is evident in Figures 4.3(a) and (b), previously shown in Section 4.1. The latter of these figures shows long run average flows measured by the detectors in individual lanes; i.e., these flows were measured over two hour periods and averaged over 4 days. Each lane's flow remained nearly fixed across detectors 40 42, indicating an absence of systematic lane changing on the two upstream most freeway segments. The flows tell a different story for the downstream segments, however. There they changed over space in ways that reveal lane changing. As an example, vehicles entered the shoulder lane while traveling between detectors 45 and 46; the latter measured higher flow in the shoulder lane and corresponding flow reductions in the center and median lanes. But lane changing is described in Figure 4.3(b) with very coarse time scales and certain patterns of interest might not be revealed at this scale. Figures 4.6(a) and (b) verify that higher systematic lane changing persisted near interchanges. Shown here are oblique N curves measured while an oscillation propagated past detectors 46 and 45. The curves from downstream detector 46 were shifted horizontally (by the oscillation s trip time on the segment) and vertically to superimpose the initial portion of each pair of curves. Figure 4.6(a) displays N curves measured in the shoulder lane. The detector 46 N curve rises above the one for detector 45; i.e., higher flows were measured by the downstream detector. As in the long run observations in Figure 4.3(b), lane changers entered the shoulder lane. 31
42 32
43 Figure 4.6(a) shows this occurrence was also observed during shorter time periods, e.g., time periods comparable to this oscillation s period. The curves in Figure 4.6(b) describe the oscillation as measured in the center and median lanes together. By grouping these lanes, their oblique N curves exhibit effects opposite to those in the shoulder lane; i.e., the curves in Figure 4.6(b) reveal the net defection of vehicles. Since there are no ramps between stations 45 and 46, this difference in flows between upstream and downstream detectors for a given lane group must be from vehicles that are lane changing. The curves in Figure 4.6(c) were constructed for a longer time period so that short run lane changing could be studied over more of the rush. These curve pairs were translated much like before; the downstream curves at 46 were shifted horizontally by the average trip time for oscillations traversing this segment, T (measured here in minutes). The rate of change in the vertical separation between each pair of curves was computed for every 20 second time interval using N curves like those in Figure 4.6(c), i.e. r l [ N( t + T) N( t 20sec+ T) ] [ ] l u N( t) N( t 20sec) d l ( t) =, where: r(t) l = the rate of change for the 20 second interval ending at t for lane group l, l = (sh) for the shoulder lane or l = (cm) for the center and median lanes, and u and d denote counts from the upstream and downstream detectors, respectively. 33
44 34
45 Systematic vehicle lane changing rates, r(t) sh and r(t) cm, are shown in Figures 4.7(a) 4.7(b) for segments and 45 46, respectively. Like Figure 4.3, Figure 4.7 shows consistently higher systematic lane changing rates on the segment (near the freeway interchanges) than on segment (upstream of the interchanges). The cross correlation term is the product of r(t) sh and r(t) cm. Finally, a 10 minute moving average was used to smooth fluctuations in these cross correlation terms. Values were less than zero when lane changing occurred (and small positive values greater than zero were interpreted as noise). Figures 4.8(a) and (b) provide typical examples of these cross correlation terms, measured in queued traffic. They indicate not only that lane changing rates fluctuated sharply, but also that these rates were consistently higher on segments near interchanges. Not so on segments further upstream (i.e., segments and 41 42), away from interchanges. 21 Having shown the correlation between the oscillations spatial growth and short run lane changing, this section concludes with a puzzling observation. Namely, the correlation was less evident in the very dense queue caused by the September 21 st incident (just downstream of detector 50), as is evident in Figures 4.9(a) and (b). These figures were constructed in the identical manner as Figures 4.7(a) and (b), but with data from the incident induced queue. Detector 42 was not functioning during this time. Yet Figures 4.5(a) and (b) still show that the spatial growth in the oscillations effects was small. This trend held despite frequent lane 21 Figures 4.6, 4.7, and 4.8 were created using the April 6 th data. Similar patterns were observed in the flow deviation curves, vehicle lane-changing rates, and the cross correlation terms on other study days while the recurrent bottleneck was active. 35
46 changing on some segments, as evident in Figure 4.9. Apparently, lane changing had less of an effect in queues of very slow moving vehicles. 36
47 37
48 4.3 THE OSCILATIONS IN INDIVIDUAL TRAVEL LANES The N N15curves shown in the previous section were constructed by summing the vehicle counts from all three individual three travel lanes. Figure 4.10 presents deviation curves for the individual travel lanes. It is clear that the oscillations in a travel lane bear remarkable resemblance to those in the adjacent travel lanes (at the same location). And, these notable similarities exist at each of the detector stations where oscillations arose. Furthermore, once an oscillation formed and started propagating upstream in any of the three travel lanes, it appeared in the other two lanes within about a kilometer or so. And once this happened, these disturbances propagated like single waves that spanned all three travel lanes (with some relatively minor stochastic fluctuations). Close inspection of Figure 4.10, reveals instances of waves that fan (at least over short distances, e.g., between two adjacent detectors) as well as instances of waves that diverge. These observations are consistent with those of Forbes and Simpson (1968) and those of Del Castillo (2001). Yet, if viewed over longer distances, they remain roughly parallel, a finding consistent with the Kerner and Rehborn (1996), the Forbes and Simpson (1968), and Windover (1998). 38
49 39
50 Using curves like those in Figure 4.10, the times that the individual disturbances arrived at each detector were recorded for each travel lane using the April 6 th and December 15 th data (while the recurrent bottleneck was active) and the September 21 st data (while the incident bottleneckwas active). To test for systematic variations in wave arrival times across travel lanes, the difference between the lane 2 22 wave arrival time and the lane 1 wave arrival time was measured as:, T 2 1, i = T2, i T1, i where: T 2, i is the time that the wave arrived to detector station i in lane 2, and T 1, i is the time that the wave arrived to detector station i in lane 1. Likewise, the lane 2 and lane 3 differences in wave arrival times were measured and denoted. T 2 3, i = T2, i T3, i The lane 2 wave arrival times were compared to the lane 1 and lane 3 arrival times because lane 2 is adjacent to both lane 1 and lane 3. It was presumed that lane changing or some other type of driver interaction (between adjacent lanes) was responsible for the observed wave alignment. There were no statistically significant differences, at the 0.05 level, in the T 2 1 and T 2 3 across study days. Therefore, the three days of data were pooled and treated as a single 22 Lane 1 is the median lane. Lane 2 is the center lane, and lane 3 is the shoulder lane. 40
51 sample drawn from a common population. Figure 4.11 shows the T 2 1 and T 2 3 by time and location (i.e., detector station). As can be seen by Figure 4.11(a) the T 2 1 and T 2 3 are not time dependent, while 4.11(b) shows that T 2 1 and T 2 3 do not change over space; they do not increase (or decrease) as the waves propagate upstream. Table 4.2(a) and 4.2(b) display the mean T 2 1 and T 2 3 for each day, respectively. They also list the standard deviations and the 95% confidence intervals from their means. Table 4.2(b) shows that the start stop waves, on average, arrived about 6 seconds later in the shoulder lane than the median and center lanes. This difference was statistically significant at the 0.05 level. Figure 4.12 shows the box plots for T 2 1 and T 2 3. Additionally, F tests conducted on the T 2 1 and T 2 3 revealed that the differences in the T and T 2 3 measured at different detector stations were less than random noise; see 2 1 Tables 4.3(a) and (b) for summary statistics and F test results for T 2 1 and T 2 3, respectively. Thus, we can conclude that either location has no real effect on T 2 1 and T 2 3 or that the samples were too small to detect the differences. There might thus be some aligning mechanism (e.g., vehicle interaction such as vehicle lane changing) that keeps the start stop waves in the individual travel lanes aligned, causing them to propagate like single waves that span all travel lanes. Moreover, any given single lane wave tends to look much like its counter parts in the other two travel lanes. That is, at any given 41
52 detector station, the N N15 curves for the median lane tended to look much like the N N15 curves for the center lane and the shoulder lane and vice versa. Number of Standard 95% Confidence Observations Mean T 2 1 Deviation Limits for Mean Study Day (N) (sec.) (sec.) (sec.) April December September Three day Average Comparisons significant at the 0.05 level are indicated by ***. Table 4.2(a) Summary Statistics for Differences in Wave Arrival times ( T 2 1 ) by Study Day Number of Standard 95% Confidence Observations Mean T 2 3 Deviation Limits for Mean Study Day (N) (sec.) (sec.) (sec.) April *** December September *** Three day Average *** Comparisons significant at the 0.05 level are indicated by ***. Table 4.2(b) Summary Statistics for Differences in Wave Arrival times ( T 2 3) by Study Day 42
53 43
54 Detector Station Number of Observations (N) Mean T 2 1 (sec.) Standard Deviation (sec.) Sum of Mean Source DF Squares Square F Value Pr > F Model Error Corrected Total Type III 23 Mean Source DF SS Square F Value Pr > F Date Station Date*Station Tests significant at the 0.05 level are indicated by ***. Table 4.3(a) Summary Statistics for Differences in Wave Arrival times ( T 2 1 ) by Location, and Analysis of Variance for T 2 1 by Date, Location, and Date*Location 23 The Type III SS is the sum of squares that results when that variable is added last to the model (where each effect is adjusted for every other effect). 44
55 Detector Station Number of Observations (N) Mean T 2 3 (sec.) Standard Deviaiton (sec.) Sum of Mean Source DF Squares Square F Value Pr > F Model Error Corrected Total Type III 24 Mean Source DF SS Square F Value Pr > F Date Station Date*Station Tests significant at the 0.05 level are indicated by ***. Table 4.3(b) Summary Statistics for Differences in Wave Arrival times ( T 2 3) by Location, and Analysis of Variance for T 2 3 by Date, Location, and Date*Location 24 The Type III SS is the sum of squares that results when that variable is added last to the model (where each effect is adjusted for every other effect). 45
56 46
57 4.4 DISTURBANCE PROPAGATION SPEEDS The wave propagation speeds were determined using measured wave travel times between adjacent detectors and the corresponding distances between the respective detectors. The mean wave travel time for all oscillations propagating over a particular freeway section was approximated by the time shift, t, that minimized the sum of squared errors, SSE(t ), between the upstream and downstream N N15 curves bounding the freeway section. That is, the mean wave travel time was defined to be the time, t, that minimized e [ Du ( t) Dd ( t + t )] 2 SSE( t ) =, Eq. 4.1 t= b where: D u (t) and D d (t) denote the N N15at the upstream and downstream detectors, respectively, and b and e are a beginning and ending time that bound the oscillations. Normally, the recurrent bottleneck activated and a queue formed prior to 7 am and the queue did not dissipate until well after 9 am. So the two hour period, from 7 to 9 am, was used to measure wave travel times upstream of the recurrent bottleneck. For determining wave speeds during the September 21 st incident, the squared errors in Eq. 4.1 were summed over the duration of the incident. Figure 4.13 illustrates this technique by showing deviation curves constructed from April 6 th count data for stations 41 and 42 from 7 to 9 am. The time axis for the station 42 curve was 47
58 shifted by time, t = 129 seconds. This corresponds to a mean wave speed of about 20.9 kilometers per hour (kph) between the two detectors. The mean wave speeds are in Figure 4.14 for the four days when all detectors functioned. 25 The oscillations tended to travel slower over segments containing ramp junctions and the wave propagation speeds tended to decrease near the tails of the queues (at station 40). 25 These four days were April 6 th, September 15 th, September 22 nd, and September 23 rd. The December 15 th data were not used as station 43 was malfunctioning. The September 21 st data were analyzed separately to study differences between the incident-induced queues and those caused by the recurrent bottleneck. 48
59 While the recurrent bottleneck was active, the mean wave velocities were 22.3 kph for freeway segments containing ramp junctions and 23.5 kph otherwise. The mean wave propagation speed over all freeway segments for these four days was 22.7 kph. 49
60 It was observed that the wave s amplitude and period were smaller during the September 21 st incident than those upstream of the recurrent bottleneck. To study the incident s effects on wave speeds, mean wave propagation speeds were measured while the recurrent bottleneck was active (prior to and after the incident); separate measurements of wave propagation speeds were taken from the incident induced queue. On this day, the mean measured wave speeds prior to and after the incident (22.5 kph) were comparable to those on other study days while the recurrent bottleneck was active (22.7 kph). In contrast, the oscillations found in the denser queue caused by the incident propagated at a slower speed (averaging 19.8 kph). Figure shows the mean wave velocities observed during the incident and while the recurrent bottleneck was active; the April 6th mean wave propagation speeds are also shown for comparative purposes. In the next section, wave propagation speeds are used to show that the propagation of these start stop waves may be modeled as Brownian motion. Section 4 closes by illustrating the effects that these waves have on the individual vehicles traversing through the traffic queues upstream of the bottlenecks. 26 Detector 42 was malfunctioning on September As such, mean wave propagation speeds for segments and were not measurable. 50
61 51
62 4.5 MODELING WAVE PROPAGATION AS BROWNIAN MOTION Windover (1998) showed that the propagation of disturbances in congested freeway traffic can be modeled as a random walk. By measuring disturbance travel times between adjacent detectors, he found that the mean disturbance speed was relatively constant (19.5 kph). In addition, he showed that the deviations in these observed travel times were normally distributed, and that these deviations were independent over time and distance. To do this, Windover measured the travel times of several disturbances observed propagating over four adjacent freeway segments in one lane of a five lane freeway near Hayward, California. Three of the four segments were 1,700 feet in length, and the fourth was a 1,450 foot segment. The QEW data in the present work were used to confirm and extend Windover s findings by showing that wave propagation could be modeled as a random walk across all travel lanes, and not just in a single travel lane. These findings even held over relatively long distances that spanned ramp junctions. For this part of the research, individual wave travel times were measured over two adjacent and relatively long segments of the QEW. The first segment, starting at station 41 and extending to station 45, is denoted segment This segment spans the Mississauga Road ramp junction. The second segment was bounded by stations 45 and 48; it spans the Highway 10 ramp junction. For wave propagation to be modeled as Brownian motion (i.e., a random walk), three assumptions must hold. First, the expected wave travel time for a segment must be constant. 52
63 Second, wave travel times must have stationary and independent increments. 27 Lastly, deviations in wave travel times must be normally distributed with mean = 0 and variance = 2 σ t ; the variance in wave travel times must be proportional to the wave travel times. To test how well the data supported the Brownian motion prerequisites, individual wave travel times were measured in each of the three travel lanes for several disturbances propagating from station 48 to station 41 on three of the study days (April 6 th and December 15 th while the recurrent bottleneck was active, and September 21 st during the time of the incident). Statistical testing revealed that the differences in the mean wave travel times were not statistically significant, at the 0.05 level, between the April 6 th and the December 15 th samples for segments, 41 45, 45 48, nor for the combined segment This finding is consistent with the Brownian motion prerequisite that the expected wave travel time for a given segment length must be constant. Furthermore, analysis of variance (ANOVA) tests showed that there were no statistically significant differences, at the 0.05 level, in the variances in wave travel times for each of these study segments. Therefore, the two days of data (when the recurrent bottleneck was active) were pooled and treated as a single sample for each of the study segments. Table 4.4 shows the summary statistics and results of the ANOVA tests for the April 6 th and December 15 th data. 27 Stationary (time) increments mean that the expected wave speed does not change over time. Independent (time) increments mean that the wave propagation speed for any given time period does not affect the wave propagation speed for any other non overlapping time period. 53
64 The September 21 st incident wave travel times were analyzed as a separate sample because testing revealed statistically significant differences, at the 0.05 level, between the mean wave travel times for these waves and those upstream of the recurrent bottleneck. Further testing revealed statistically significant differences, at the 0.05 level, between the variances in wave travel times for waves upstream of the incident and the waves upstream of the recurrent bottleneck for each of the three study segments. Table 4.5 shows the summary statistics and the results of the ANOVA tests for the September 21 st wave travel times (denoted Bottleneck cause = Incident) when compared to the combined April 6 th & December 15 th waves (denoted Bottleneck cause = Recurrent). Next, the deviations in wave travel times were plotted and found to be normally distributed. 28 Figures 4.16(a), (b) and (c) display the distributions for the observed wave travel times for segments 41 45, 45 48, and 41 48, respectively, for waves upstream of the recurrent bottleneck. Likewise, Figure 4.17 shows the deviations in travel times for the waves upstream of the September 21 st incident. 28 Chi-square Goodness-of-Fit test failed to reject the null hypothesis, at the 0.05 level, that there were statistically significant differences between the empirically obtained deviations in travel-times and a (discrete) normal distribution. 54
65 Number of Observations (N) Mean Wave Travel time (sec.) Travel time Std. Deviation (sec.) 95% Confidence Limits for Mean (sec.) Segment; Date 41 45; 04/06/ ; 12/15/ ; Both Days ; 04/06/ ; 12/15/ ; Both Days ; 04/06/ ; 12/15/ ; Both Days Segment:41 45 Type III Mean Source DF SS Square F Value Pr > F Date Error Segment:45 48 Type III Mean Source DF SS Square F Value Pr > F Date Error Segment:41 48 Type III Mean Source DF SS Square F Value Pr > F Date Error Tests significant at the 0.05 level are indicated by ***. Table 4.4 Summary Statistics for Wave Travel times by Date, and Analysis of Variance by Date 55
66 Segment; Bottleneck cause Number of Observations (N) Mean Wave Travel time (sec.) Travel time Std. Deviation (sec.) 95% Confidence Limits for Mean (sec.) 41 45; Incident ; Recurrent ; Incident ; Recurrent ; Incident ; Recurrent Segment:41 45 Type III Mean Source DF SS Square F Value Pr > F BNCause <.0001 *** Error Segment:45 48 Type III Mean Source DF SS Square F Value Pr > F BNCause *** Error Segment:41 48 Type III Mean Source DF SS Square F Value Pr > F BNCause <.0001 *** Error Tests significant at the 0.05 level are indicated by ***. Table 4.5 Summary Statistics for Wave Travel times by Bottleneck cause, and Analysis of Variance by Bottleneck cause 56
67 57
68 58
69 If the Brownian motion prerequisite of independent increments holds, then the propagation speed of a wave in segment should be uncorrelated with the propagation speed of the same wave in segment To test this, the observed wave speeds over segment were compared to those over segment for each of the individual oscillations. 29 Figure 4.18 shows the results of this comparison for the recurrent bottleneck and the incident bottleneck. Faster than average waves over are not necessarily faster than average over 45 48, illustrating that the prerequisite of independent increments holds. 29 The correlation coefficient was when comparing wave speeds for segments and while the incident bottleneck was active; and for waves upstream of the recurrent bottleneck. 59
70 Finally, if deviations in wave travel times are independent between segment and 45 48, then variances in these travel times should be additive, i.e., the variance in wave travel times for segment plus this variance for segment should equal the observed variance in wave travel times for the combined segment This was tested using the combined April 6 th and December 15 th wave travel time data, and the September 21 st wave travel time data. For those waves measured while the recurrent bottleneck was active, listed in Table 4.6(a), the variance in wave travel times for segment was 950 seconds 2 and 1,170 seconds 2 for segment 45 48; the sum of which is 2,120 seconds 2. The measured variance for segment was 1,807 seconds 2, a 17% difference. For the waves upstream of the September 21 st incident, shown in Table 4.6(b), the variance in wave travel times for segment was 1,264 seconds 2 and 651 seconds 2 for segment 45 48, summing to 1,915 seconds 2. The measured variance for segment was 1,872 seconds 2, which is only about a 2% difference. Tables 4.6(a) and (b) list summary statistics for the wave travel times, for the recurrent queue, and the incident induced queue. Statistical testing (i.e., F tests for difference in sample variances) failed to reject the null hypothesis that these differences in variance were statistically significant. 30 This shows that the assumption of additive variances held. Consequently, the 30 For the values shown in Table 4.6(a), the p value from the F tests was For the values shown in Table 4.6(b), the p value from the F tests was Both p values are larger than 0.05, the value required to reject the null hypothesis at the 0.05 level. 60
71 assumption of independence holds reasonably well, which is the third prerequisite for Brownian motion. Freeway Segment Number of Waves (N) Segment Length (km) Mean Wave Travel times (sec.) Variance In Wave Travel times (sec. 2 ) Mean Wave Speed (kph) , Combined , , Table 4.6(a) Summary of Wave Travel times (Recurrent Bottleneck, April 6 th & December 15 th ) Freeway Segment Number of Waves (N) Segment Length (km) Mean Wave Travel times (sec.) Variance In Wave Travel times (sec. 2 ) Mean Wave Speed (kph) , Combined , , Table 4.6(b) Summary of Wave Travel times (September 21 st Incident induced Bottleneck) 61
72 4.6 PREDICTING VEHICLE MOTIONS IN FREEWAY TRAFFIC QUEUES A simple model was developed using the previously discussed results to gain some insights into the effects that these disturbances have on queued vehicles. To accomplish this, a few simplifying assumptions were made. First, it was assumed that a single (piece wise linear) flow density curve adequately described the fundamental relationship at all points along the freeway, an assumption consistent with previous observations. 31 Figure 4.19 shows the empirically obtained flow density curve (for congested traffic) for the homogeneous sections of the study site. A mean vehicle speed of 100 kph was used for the freely flowing portions of the freeway, consistent with the observed free flow vehicle speeds provided by the detectors. The oscillations were modeled with a six minute periodicity, which is comparable to the average observed wave frequency. From the mean observed flows carried by the waves at each detector station (shown in Table 4.1 of this thesis) and the empirically obtained flow density curve (shown in Figure 4.19), average vehicle speeds and mean vehicle spacings were determined for each freeway segment. The resulting hypothetical vehicle trajectories are shown in Figure In this illustration, vehicle trajectories were not constructed through the merge areas near on ramps, nor through the diverge areas near the off ramps; driver interactions and the associated vehicular movements are not well understood in these areas. An occasional through moving vehicle trajectory has been included to provide continuity for the reader. 62
73 From this, it can be seen that vehicles traveling the entire freeway stretch are expected to travel through about six slow and go oscillations. Figure 4.20 illustrates that mean vehicular speeds are lowest near the tail of the queue (where vehicular densities are highest). Additionally, it shows that the deviations in vehicular speeds brought about by these waves are the greatest in the denser portions of the queue, near the tail of queue. These observations are all consistent with previous observations. 31 See Cassidy and Mauch (2001). 63
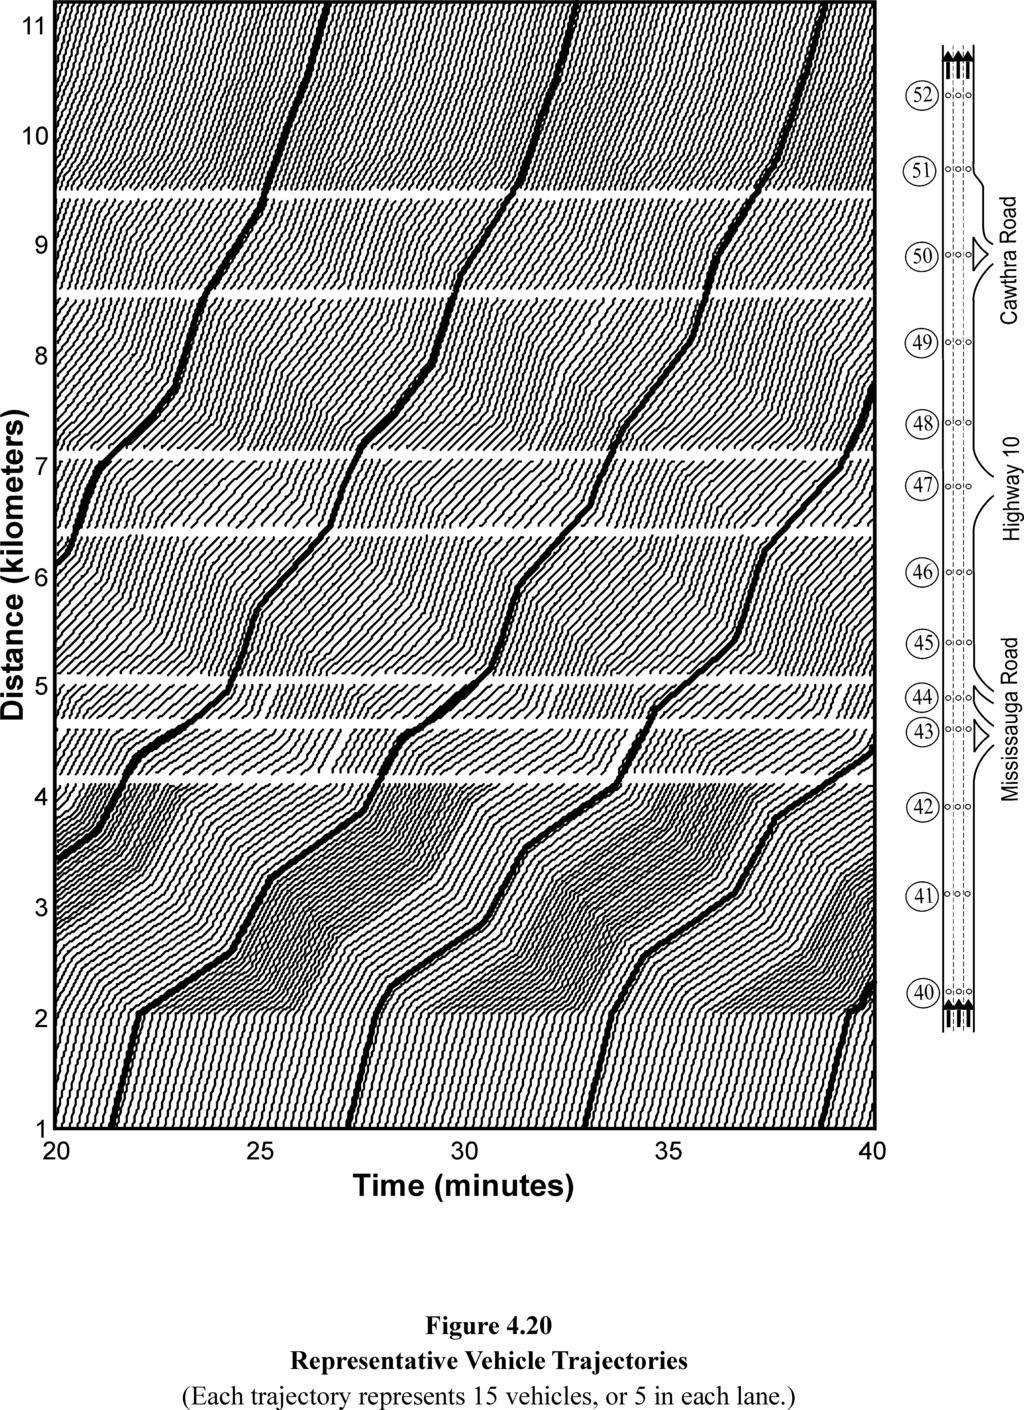
74 64
EMPIRICAL STUDY OF TRAFFIC FEATURES AT A FREEWAY LANE DROP
 EMPIRICAL STUDY OF TRAFFIC FEATURES AT A FREEWAY LANE DROP Robert L. Bertini, Assistant Professor Member, American Society of Civil Engineers Department of Civil & Environmental Engineering Portland State
The German Autobahn: An ITS Test Bed for Examining Dynamic Traffic Flow Phenomena
 The German Autobahn: An ITS Test Bed for Examining Dynamic Traffic Flow Phenomena Robert L. Bertini, Roger V. Lindgren, Dirk Helbing and, Martin Schönhof Abstract Traffic conditions were examined along
EMPIRICAL OBSERVATIONS OF DYNAMIC TRAFFIC FLOW PHENOMENA ON A GERMAN AUTOBAHN
 Empirical Observations of Dynamic Traffic Flow Phenomena on a German Autobahn 1 INSERT CHAPTER NUMBER EMPIRICAL OBSERVATIONS OF DYNAMIC TRAFFIC FLOW PHENOMENA ON A GERMAN AUTOBAHN Robert L. Bertini, Department
Empirical Analysis of Traffic Sensor Data Surrounding a Bottleneck on a German Autobahn
 Empirical Analysis of Traffic Sensor Data Surrounding a Bottleneck on a German Autobahn Robert L. Bertini, Steven Hansen, and Klaus Bogenberger The evolution of traffic from freely flowing to queued conditions
Some traffic features at freeway bottlenecks
 Some traffic features at freeway bottlenecks Michael J. Cassidy*, Robert L. Bertini Department of Civil and Environmental Engineering, Institute of Transportation Studies, University of California, 19
Possible explanations of phase transitions in highway traffic
 Possible explanations of phase transitions in highway traffic C.F. Daganzo * *, M.J. Cassidy, R.L. Bertini Department of Civil and Environmental Engineering, and Institute of Transportation Studies, University
Using PeMS Data to Empirically Diagnose Freeway Bottleneck Locations in Orange
 Using PeMS Data to Empirically Diagnose Freeway Bottleneck Locations in Orange County, California Robert L. Bertini Department of Civil and Environmental Engineering Portland State University P.O. Box
Use of Performance Measurement System Data to Diagnose Freeway Bottleneck Locations Empirically in Orange County, California
 Use of Performance Measurement System Data to Diagnose Freeway Bottleneck Locations Empirically in Orange County, California Robert L. Bertini and Aaron M. Myton To improve freeway modeling and operations,
ANALYSIS OF FLOW FEATURES IN QUEUED TRAFFIC ON A GERMAN FREEWAY ROGER VICTOR FREDRICK LINDGREN
 ANALYSIS OF FLOW FEATURES IN QUEUED TRAFFIC ON A GERMAN FREEWAY by ROGER VICTOR FREDRICK LINDGREN A dissertation submitted in partial fulfillment of the requirements for the degree of DOCTOR OF PHILOSOPHY
Cumulative Count Curve and Queueing Analysis
 Introduction Traffic flow theory (TFT) Zhengbing He, Ph.D., http://zhengbing.weebly.com School of traffic and transportation, Beijing Jiaotong University September 27, 2015 Introduction Outline 1 Introduction
Measuring Wave Velocities on Highways during Congestion using Cross Spectral Analysis
 Measuring Wave Velocities on Highways during Congestion using Cross Spectral Analysis Yun Wang, Member, IEEE, Diane Foster, and Benjamin Coifman, Member, IEEE Abstract Previous research has shown that
STANDING WAVES AND THE INFLUENCE OF SPEED LIMITS
 STANDING WAVES AND THE INFLUENCE OF SPEED LIMITS H. Lenz, R. Sollacher *, M. Lang + Siemens AG, Corporate Technology, Information and Communications, Otto-Hahn-Ring 6, 8173 Munich, Germany fax: ++49/89/636-49767
Traffic flow theory involves the development of mathematical relationships among
 CHAPTER 6 Fundamental Principles of Traffic Flow Traffic flow theory involves the development of mathematical relationships among the primary elements of a traffic stream: flow, density, and speed. These
Capacity Drop. Relationship Between Speed in Congestion and the Queue Discharge Rate. Kai Yuan, Victor L. Knoop, and Serge P.
 Capacity Drop Relationship Between in Congestion and the Queue Discharge Rate Kai Yuan, Victor L. Knoop, and Serge P. Hoogendoorn It has been empirically observed for years that the queue discharge rate
CHAPTER 5 DELAY ESTIMATION FOR OVERSATURATED SIGNALIZED APPROACHES
 CHAPTER 5 DELAY ESTIMATION FOR OVERSATURATED SIGNALIZED APPROACHES Delay is an important measure of effectiveness in traffic studies, as it presents the direct cost of fuel consumption and indirect cost
c) What are cumulative curves, and how are they constructed? (1 pt) A count of the number of vehicles over time at one location (1).
 What are cumulative curves, and how are they constructed? (1 pt) A count of the number of vehicles over time at one location (1).") Exam 4821 Duration 3 hours. Points are indicated for each question. The exam has 5 questions 54 can be obtained. Note that half of the points is not always suffcient for a 6. Use your time wisely! Remarks:
Exam 4821 Duration 3 hours. Points are indicated for each question. The exam has 5 questions 54 can be obtained. Note that half of the points is not always suffcient for a 6. Use your time wisely! Remarks:
Traffic Flow Theory & Simulation
 Traffic Flow Theory & Simulation S.P. Hoogendoorn Lecture 7 Introduction to Phenomena Introduction to phenomena And some possible explanations... 2/5/2011, Prof. Dr. Serge Hoogendoorn, Delft University
CAPACITY DROP: A RELATION BETWEEN THE SPEED IN CONGESTION AND THE QUEUE DISCHARGE RATE
 CAPACITY DROP: A RELATION BETWEEN THE SPEED IN CONGESTION AND THE QUEUE DISCHARGE RATE Kai Yuan, PhD candidate TRAIL research school Department of Transport and Planning Faculty of Civil Engineering and
Traffic signal design-ii
 CHAPTER 4. TRAFFIC SIGNAL DESIGN-II NPTEL May 3, 007 Chapter 4 Traffic signal design-ii 4.1 Overview In the previous chapter, a simple design of cycle time was discussed. Here we will discuss how the cycle
Karen R. Smilowitz, Carlos F. Daganzo, Michael J. Cassidy and Robert L. Bertini
 1 Some Observations Of Highway Traffic In Long Queues Karen R. Smilowitz, Carlos F. Daganzo, Michael J. Cassidy and Robert L. Bertini 416 McLaughlin Hall Department of Civil and Environmental Engineering,
Traffic Flow Theory & Simulation
 Traffic Flow Theory & Simulation S.P. Hoogendoorn Lecture 4 Shockwave theory Shockwave theory I: Introduction Applications of the Fundamental Diagram February 14, 2010 1 Vermelding onderdeel organisatie
Shock wave analysis. Chapter 8. List of symbols. 8.1 Kinematic waves
 Chapter 8 Shock wave analysis Summary of the chapter. Flow-speed-density states change over time and space. When these changes of state occur, a boundary is established that demarks the time-space domain
CHAPTER 3. CAPACITY OF SIGNALIZED INTERSECTIONS
 CHAPTER 3. CAPACITY OF SIGNALIZED INTERSECTIONS 1. Overview In this chapter we explore the models on which the HCM capacity analysis method for signalized intersections are based. While the method has
Chapter 5 Traffic Flow Characteristics
 Chapter 5 Traffic Flow Characteristics 1 Contents 2 Introduction The Nature of Traffic Flow Approaches to Understanding Traffic Flow Parameters Connected with Traffic Flow Categories of Traffic Flow The
TREBALL FINAL DE GRAU
 TREBALL FINAL DE GRAU VALIDATION OF THE CL-CTM FREEWAY MERGE MODEL Treball realitzat per: Carles Cañero Martínez Dirigit per: Francesc Soriguera Martí Grau en: Enginyeria Civil Barcelona, 18 juny 213 Departament
OVERVIEW OF A SIMULATION STUDY OF THE HIGHWAY 401 FTMS
 OVERVIEW OF A SIMULATION STUDY OF THE HIGHWAY 401 FTMS HELLINGA, Bruce 1, BAKER, Mark 1, VAN AERDE, Michel 1, AULTMAN-HALL, Lisa 1, and MASTERS, Philip 2 1 Transportation Systems Research Group Queen's
EVALUATION OF SAFETY PERFORMANCES ON FREEWAY DIVERGE AREA AND FREEWAY EXIT RAMPS. Transportation Seminar February 16 th, 2009
 EVALUATION OF SAFETY PERFORMANCES ON FREEWAY DIVERGE AREA AND FREEWAY EXIT RAMPS Transportation Seminar February 16 th, 2009 By: Hongyun Chen Graduate Research Assistant 1 Outline Introduction Problem
Some Observations of Highway Traffic in Long Queues
 TRANSPORTATION RESEARCH RECORD 1678 Paper No. 99-0094 225 Some Observations of Highway Traffic in Long Queues KAREN R. SMILOWITZ, CARLOS F. DAGANZO, MICHAEL J. CASSIDY, AND ROBERT L. BERTINI The arrival
Traffic Flow Theory and Simulation
 Traffic Flow Theory and Simulation V.L. Knoop Lecture 2 Arrival patterns and cumulative curves Arrival patterns From microscopic to macroscopic 24-3-2014 Delft University of Technology Challenge the future
Cell Transmission Models
 Cell Transmission Models Lecture Notes in Transportation Systems Engineering Prof. Tom V. Mathew Contents 1 Introduction 1 2 Single source and sink CTM model 2 2.1 Basic Premise...................................
Signalized Intersection Delay Models
 Chapter 35 Signalized Intersection Delay Models 35.1 Introduction Signalized intersections are the important points or nodes within a system of highways and streets. To describe some measure of effectiveness
U.S. - Canadian Border Traffic Prediction
 Western Washington University Western CEDAR WWU Honors Program Senior Projects WWU Graduate and Undergraduate Scholarship 12-14-2017 U.S. - Canadian Border Traffic Prediction Colin Middleton Western Washington
MnDOT Method for Calculating Measures of Effectiveness (MOE) From CORSIM Model Output
 From CORSIM Model Output") MnDOT Method for Calculating Measures of Effectiveness (MOE) From CORSIM Model Output Rev. April 29, 2005 MnDOT Method for Calculating Measures of Effectiveness (MOE) From CORSIM Model Output Table of
MnDOT Method for Calculating Measures of Effectiveness (MOE) From CORSIM Model Output Rev. April 29, 2005 MnDOT Method for Calculating Measures of Effectiveness (MOE) From CORSIM Model Output Table of
A SIMPLIFIED MODEL OF URBAN RAILWAY SYSTEM FOR DYNAMIC TRAFFIC ASSIGNMENT
 1 A SIMPLIFIED MODEL OF URBAN RAILWAY SYSTEM FOR DYNAMIC TRAFFIC ASSIGNMENT T. SEO a, K. WADA b and D. FUKUDA c a Department of Civil and Environmental Engineering, School of Environment and Society, Tokyo
Delay of Incidents Consequences of Stochastic Incident Duration
 Delay of Incidents Consequences of Stochastic Incident Duration Victor L. Knoop 1, Serge P. Hoogendoorn 1, and Henk J. van Zuylen 1 Delft University of Technology & TRIL research School, Stevinweg 1, 68
An Improved Car-Following Model for Multiphase Vehicular Traffic Flow and Numerical Tests
 Commun. Theor. Phys. (Beijing, China) 46 (2006) pp. 367 373 c International Academic Publishers Vol. 46, No. 2, August 15, 2006 An Improved Car-Following Model for Multiphase Vehicular Traffic Flow and
Signalized Intersection Delay Models
 Signalized Intersection Delay Models Lecture Notes in Transportation Systems Engineering Prof. Tom V. Mathew Contents 1 Introduction 1 2 Types of delay 2 2.1 Stopped Time Delay................................
Extended Bottlenecks, the Fundamental Relationship, and Capacity Drop on Freeways
 Procedia - Social and Behavioral Sciences 00 (2010) 000 000 Procedia Social and Behavioral Sciences www.elsevier.com/locate/procedia 19th International Symposium of Transportation and Traffic Theory Extended
An Analytical Model for Traffic Delays and the Dynamic User Equilibrium Problem
 OPERATIONS RESEARCH Vol. 54, No. 6, November December 26, pp. 1151 1171 issn 3-364X eissn 1526-5463 6 546 1151 informs doi 1.1287/opre.16.37 26 INFORMS An Analytical Model for Traffic Delays and the Dynamic
Stability of Feedback Control Systems: Absolute and Relative
 Stability of Feedback Control Systems: Absolute and Relative Dr. Kevin Craig Greenheck Chair in Engineering Design & Professor of Mechanical Engineering Marquette University Stability: Absolute and Relative
A Speed-Delay Study of Highway 401 in Toronto, Ontario
 A Speed-Delay Study of Highway 41 in Toronto, Ontario Bruce Hellinga and Michel Van Aerde Department of Civil Engineering Queen's University, Kingston, Ontario, Canada K7L 3N6 ABSTRACT Travel time is an
SOME FACTORS INFLUENCING THE REGULARITY OF SHORT HEADWAY URBAN BUS OPERATION*
 NZOR volume 4 number 2 July 1976 SOME FACTORS INFLUENCING THE REGULARITY OF SHORT HEADWAY URBAN BUS OPERATION* W.J, Frith M inistry of Transport W ellington S u m m a r y T h e i m p o r t a n c e o f
Modeling Traffic Flow on Multi-Lane Road: Effects of Lane-Change Manoeuvres Due to an On-ramp
 Global Journal of Pure and Applied Mathematics. ISSN 973-768 Volume 4, Number 28, pp. 389 46 Research India Publications http://www.ripublication.com/gjpam.htm Modeling Traffic Flow on Multi-Lane Road:
Freeway Work Zone Lane Capacity
 Report Title Report Date: 2009 Freeway Work Zone Lane Capacity Principle Investigator Vendor Name and Address Name Drakopoulos, Alex «Vendor» Affiliation Marquette University Address 263 Haggerty Hall
Asymptotic traffic dynamics arising in diverge-merge networks with two intermediate links
 Asymptotic traffic dynamics arising in diverge-merge networks with two intermediate links Wen-Long Jin March 25, 2008 Abstract Basic road network components, such as merging and diverging junctions, contribute
Probe Vehicle Runs or Loop Detectors?
 Probe Vehicle Runs or Loop etectors? Effect of etector Spacing and Sample Size on Accuracy of Freeway Congestion Monitoring Jaimyoung Kwon, Karl Petty, and Pravin Varaiya Freeway congestion monitoring
Spontaneous Jam Formation
 Highway Traffic Introduction Traffic = macroscopic system of interacting particles (driven or self-driven) Nonequilibrium physics: Driven systems far from equilibrium Collective phenomena physics! Empirical
Performance Analysis of Delay Estimation Models for Signalized Intersection Networks
 Performance Analysis of Delay Estimation Models for Signalized Intersection Networks Hyung Jin Kim 1, Bongsoo Son 2, Soobeom Lee 3 1 Dept. of Urban Planning and Eng. Yonsei Univ,, Seoul, Korea {hyungkim,
Freeway Work Zone Lane Capacity
 Freeway Work Zone Lane Capacity Thomas Notbohm, P.E. Wisconsin Department of Transportation Thomas.Notbohm@dot.state.wi.us Alex Drakopoulos Department of Civil & Environmental Engineering Marquette University,
Queuing and Statistical Analysis of Freeway Bottleneck Formation
 Queuing and Statistical Analysis of Freeway Bottleneck Formation Shantanu Das 1 and David Levinson 2 Abstract: A modified approach to treat traffic flow parameters (flow, density, and speed) has been introduced
Hysteresis in traffic flow revisited: an improved measurement method
 Hysteresis in traffic flow revisited: an improved measurement method Jorge A. Laval a, a School of Civil and Environmental Engineering, Georgia Institute of Technology Abstract This paper presents a method
Assessing the uncertainty in micro-simulation model outputs
 Assessing the uncertainty in micro-simulation model outputs S. Zhu 1 and L. Ferreira 2 1 School of Civil Engineering, Faculty of Engineering, Architecture and Information Technology, The University of
Recent Researches in Engineering and Automatic Control
 Traffic Flow Problem Simulation in Jordan Abdul Hai Alami Mechanical Engineering Higher Colleges of Technology 17155 Al Ain United Arab Emirates abdul.alami@hct.ac.ae http://sites.google.com/site/alamihu
The Physics of Traffic Jams: Emergent Properties of Vehicular Congestion
 December 10 2008 David Zeb Rocklin The Physics of Traffic Jams: Emergent Properties of Vehicular Congestion The application of methodology from statistical physics to the flow of vehicles on public roadways
(b) A particle with v > 0 and a < 0 is moving forward with decreasing speed. Example: a car slowing down before exiting an Eastbound freeway.
 A particle with v > 0 and a < 0 is moving forward with decreasing speed. Example: a car slowing down before exiting an Eastbound freeway.") PHY 302 K. Solutions for Problem set # 2. Non-textbook problem #1: (a) A particle with v > 0 and a > 0 is moving forward (i.e., in the positive direction) with increasing speed. Example: a car entering
PHY 302 K. Solutions for Problem set # 2. Non-textbook problem #1: (a) A particle with v > 0 and a > 0 is moving forward (i.e., in the positive direction) with increasing speed. Example: a car entering
Traffic Behavior at Freeway Bottlenecks
 MN WI MI IL IN OH USDOT Region V Regional University Transportation Center Final Report NEXTRANS Project No. 088OY04 Traffic Behavior at Freeway Bottlenecks By Benjamin Coifman, PhD Associate Professor
Anticipatory Pricing to Manage Flow Breakdown. Jonathan D. Hall University of Toronto and Ian Savage Northwestern University
 Anticipatory Pricing to Manage Flow Breakdown Jonathan D. Hall University of Toronto and Ian Savage Northwestern University Flow = density x speed Fundamental diagram of traffic Flow (veh/hour) 2,500 2,000
CEE 320 Midterm Examination (50 minutes)
") CEE 320 Midterm Examination (50 minutes) Fall 2009 Please write your name on this cover. Please write your last name on all other exam pages This exam is NOT open book, but you are allowed to use one 8.5x11
CEE 320 Midterm Examination (50 minutes) Fall 2009 Please write your name on this cover. Please write your last name on all other exam pages This exam is NOT open book, but you are allowed to use one 8.5x11
Course Outline Introduction to Transportation Highway Users and their Performance Geometric Design Pavement Design
 Course Outline Introduction to Transportation Highway Users and their Performance Geometric Design Pavement Design Speed Studies - Project Traffic Queuing Intersections Level of Service in Highways and
Freeway Merge Junctions
 8 TRANSPORTATION RESEARCH RECORD 1484 Probabilistic Nature of Breakdown at Freeway Merge Junctions LILY ELEFTERIADOU, ROGER P. ROESS, AND WILLIAM R. MCSHANE Observation of field data collected as part
Signalized Intersection Delay Models
 Transportation System Engineering 56. Signalized Intersection Delay Models Chapter 56 Signalized Intersection Delay Models 56.1 Introduction Signalized intersections are the important points or nodes within
Estimating Density and Lane Inflow on a Freeway Segment
 Estimating Density and Lane Inflow on a Freeway Segment Benjamin Coifman, PhD Assistant Professor, Department of Civil and Environmental Engineering and Geodetic Science Assistant Professor, Department
Impact of Day-to-Day Variability of Peak Hour Volumes on Signalized Intersection Performance
 Impact of Day-to-Day Variability of Peak Hour Volumes on Signalized Intersection Performance Bruce Hellinga, PhD, PEng Associate Professor (Corresponding Author) Department of Civil and Environmental Engineering,
arxiv:cond-mat/ v3 [cond-mat.stat-mech] 18 Aug 2003
![arxiv:cond-mat/ v3 [cond-mat.stat-mech] 18 Aug 2003](/thumbs/80/81188192.jpg "arxiv:cond-mat/ v3 [cond-mat.stat-mech] 18 Aug 2003") arxiv:cond-mat/0211684v3 [cond-mat.stat-mech] 18 Aug 2003 Three-Phase Traffic Theory and Highway Capacity Abstract Boris S. Kerner Daimler Chrysler AG, RIC/TS, T729, 70546 Stuttgart, Germany Hypotheses
arxiv:cond-mat/0211684v3 [cond-mat.stat-mech] 18 Aug 2003 Three-Phase Traffic Theory and Highway Capacity Abstract Boris S. Kerner Daimler Chrysler AG, RIC/TS, T729, 70546 Stuttgart, Germany Hypotheses
DETECTING SECONDARY ACCIDENTS IN FREEWAYS
 DETECTING SECONDARY ACCIDENTS IN FREEWAYS Foteini P. Orfanou, Eleni I.Vlahogianni, Ph.D. and Matthew G. Karlaftis, Ph.D. Department of Transportation Planning & Engineering School of Civil Engineering
From experimemts to Modeling
 Traffic Flow: From experimemts to Modeling TU Dresden 1 1 Overview Empirics: Stylized facts Microscopic and macroscopic models: typical examples: Linear stability: Which concepts are relevant for describing
Empirical Study of Traffic Velocity Distribution and its Effect on VANETs Connectivity
 Empirical Study of Traffic Velocity Distribution and its Effect on VANETs Connectivity Sherif M. Abuelenin Department of Electrical Engineering Faculty of Engineering, Port-Said University Port-Fouad,
Roundabout Level of Service
 Roundabout Level of Service Rahmi Akçelik Director Akcelik & Associates Pty Ltd email: rahmi.akcelik@sidrasolutions.com web: www.sidrasolutions.com 8 January 2009 Contents 1. Introduction... 1 2. Fundamental
2.1 Traffic Stream Characteristics. Time Space Diagram and Measurement Procedures Variables of Interest
 2.1 Traffic Stream Characteristics Time Space Diagram and Measurement Procedures Variables of Interest Traffic Stream Models 2.1 Traffic Stream Characteristics Time Space Diagram Speed =100km/h = 27.78
On the distribution schemes for determining flows through a merge
 On the distribution schemes for determining flows through a merge W. L. Jin and H. M. Zhang April 11, 2002 Abstract: In this paper, we study various distribution schemes for determining flows through a
The distortion observed in the bottom channel of Figure 1 can be predicted from the full transport equation, C t + u C. y D C. z, (1) x D C.
 x D C.") 1 8. Shear Dispersion. The transport models and concentration field solutions developed in previous sections assume that currents are spatially uniform, i.e. u f(,y,). However, spatial gradients of velocity,
1 8. Shear Dispersion. The transport models and concentration field solutions developed in previous sections assume that currents are spatially uniform, i.e. u f(,y,). However, spatial gradients of velocity,
Long-Term Evaluation of the Operational Performance of Fixed Time Ramp Metering Control Strategy: A Freeway Corridor Study
 Canadian Journal of Civil Engineering Long-Term Evaluation of the Operational Performance of Fixed Time Ramp Metering Control Strategy: A Freeway Corridor Study Journal: Canadian Journal of Civil Engineering
Time Space Diagrams for Thirteen Shock Waves
 Time Space Diagrams for Thirteen Shock Waves Benjamin Coifman Institute of Transportation Studies 19 McLaughlin Hall University of California Berkeley, CA 9472 zephyr@eecs.berkeley.edu http://www.cs.berkeley.edu/~zephyr
nario is a hypothetical driving process aiming at testing these models under various driving regimes (such as free flow and car following); the
; the") 1 Preface For years, I have been thinking about writing an introductory book on traffic flow theory. The main purpose is to help readers like me who are new to this subject and do not have much preparation
1 Preface For years, I have been thinking about writing an introductory book on traffic flow theory. The main purpose is to help readers like me who are new to this subject and do not have much preparation
Lecture Notes Kinematics Recap 2.4 Acceleration
 Lecture Notes 2.5-2.9 Kinematics Recap 2.4 Acceleration Acceleration is the rate at which velocity changes. The SI unit for acceleration is m/s 2 Acceleration is a vector, and thus has both a magnitude
Traffic Progression Models
 Traffic Progression Models Lecture Notes in Transportation Systems Engineering Prof. Tom V. Mathew Contents 1 Introduction 1 2 Characterizing Platoon 2 2.1 Variables describing platoon............................
TRAFFIC IMPACT STUDY. Platte Canyon Villas Arapahoe County, Colorado (Arapahoe County Case Number: Z16-001) For
 For") TRAFFIC IMPACT STUDY For Platte Canyon Villas Arapahoe County, Colorado (Arapahoe County Case Number: Z16-001) February 2015 Revised: August 2015 April 2016 July 2016 September 2016 Prepared for: KB Home
TRAFFIC IMPACT STUDY For Platte Canyon Villas Arapahoe County, Colorado (Arapahoe County Case Number: Z16-001) February 2015 Revised: August 2015 April 2016 July 2016 September 2016 Prepared for: KB Home
CE351 Transportation Systems: Planning and Design
 CE351 Transportation Systems: Planning and Design TOPIC: Level of Service (LOS) at Traffic Signals 1 Course Outline Introduction to Transportation Highway Users and their Performance Geometric Design Pavement
$QDO\]LQJ$UWHULDO6WUHHWVLQ1HDU&DSDFLW\ RU2YHUIORZ&RQGLWLRQV
![$QDO\]LQJ$UWHULDO6WUHHWVLQ1HDU&DSDFLW\ RU2YHUIORZ&RQGLWLRQV](/thumbs/76/73951207.jpg "$QDO\]LQJ$UWHULDO6WUHHWVLQ1HDU&DSDFLW\ RU2YHUIORZ&RQGLWLRQV") Paper No. 001636 $QDO\]LQJ$UWHULDO6WUHHWVLQ1HDU&DSDFLW\ RU2YHUIORZ&RQGLWLRQV Duplication for publication or sale is strictly prohibited without prior written permission of the Transportation Research Board
Paper No. 001636 $QDO\]LQJ$UWHULDO6WUHHWVLQ1HDU&DSDFLW\ RU2YHUIORZ&RQGLWLRQV Duplication for publication or sale is strictly prohibited without prior written permission of the Transportation Research Board
Partial elliptical two regime speed flow traffic model based on the highway capacity manual
 Partial elliptical two regime speed flow traffic model based on the highway capacity manual Yousif, S Title Authors Type URL Partial elliptical two regime speed flow traffic model based on the highway
Unit 1 Parent Guide: Kinematics
 Unit 1 Parent Guide: Kinematics Kinematics is the study of the motion of objects. Scientists can represent this information in the following ways: written and verbal descriptions, mathematically (with
Modelling, Simulation & Computing Laboratory (msclab) Faculty of Engineering, Universiti Malaysia Sabah, Malaysia
 Faculty of Engineering, Universiti Malaysia Sabah, Malaysia") 1.0 Introduction Intelligent Transportation Systems (ITS) Long term congestion solutions Advanced technologies Facilitate complex transportation systems Dynamic Modelling of transportation (on-road traffic):
1.0 Introduction Intelligent Transportation Systems (ITS) Long term congestion solutions Advanced technologies Facilitate complex transportation systems Dynamic Modelling of transportation (on-road traffic):
Yu (Marco) Nie. Appointment Northwestern University Assistant Professor, Department of Civil and Environmental Engineering, Fall present.
 Nie. Appointment Northwestern University Assistant Professor, Department of Civil and Environmental Engineering, Fall present.") Yu (Marco) Nie A328 Technological Institute Civil and Environmental Engineering 2145 Sheridan Road, Evanston, IL 60202-3129 Phone: (847) 467-0502 Fax: (847) 491-4011 Email: y-nie@northwestern.edu Appointment
Yu (Marco) Nie A328 Technological Institute Civil and Environmental Engineering 2145 Sheridan Road, Evanston, IL 60202-3129 Phone: (847) 467-0502 Fax: (847) 491-4011 Email: y-nie@northwestern.edu Appointment
Research Article Headway Distributions Based on Empirical Erlang and Pearson Type III Time Methods Compared
 Research Journal of Applied Sciences, Engineering and Technology 7(21): 4410-4414, 2014 DOI:10.19026/rjaset.7.817 ISSN: 2040-7459; e-issn: 2040-7467 2014 Maxwell Scientific Publication Corp. Submitted:
Traffic Modelling for Moving-Block Train Control System
 Commun. Theor. Phys. (Beijing, China) 47 (2007) pp. 601 606 c International Academic Publishers Vol. 47, No. 4, April 15, 2007 Traffic Modelling for Moving-Block Train Control System TANG Tao and LI Ke-Ping
Estimation of Measures of Effectiveness Based on Connected Vehicle Data
 Estimation of Measures of Effectiveness Based on Connected Vehicle Data Juan Argote, Eleni Christofa, Yiguang Xuan, and Alexander Skabardonis Abstract Vehicle-infrastructure cooperation via the Connected
Perth County Road Fatal Head-on Collision - A Common and Dangerous Issue
 Perth County Road Fatal Head-on Collision - A Common and Dangerous Issue Posting Date: 25-Aug-2016 Figure 1: View looking east long "Speeders Alley" - a more appropriate name for the long, straight and
A B C D. Unit 6 (1-Dimensional Motion) Practice Assessment
 Practice Assessment") Unit 6 (1-Dimensional Motion) Practice Assessment Choose the best answer to the following questions. Indicate the confidence in your answer by writing C (Confident), S (So-so), or G (Guessed) next to the
Unit 6 (1-Dimensional Motion) Practice Assessment Choose the best answer to the following questions. Indicate the confidence in your answer by writing C (Confident), S (So-so), or G (Guessed) next to the
State the condition under which the distance covered and displacement of moving object will have the same magnitude.
 Exercise CBSE-Class IX Science Motion General Instructions: (i) (ii) (iii) (iv) Question no. 1-15 are very short answer questions. These are required to be answered in one sentence each. Questions no.
Parking Regulations Dundas Street West, from Bathurst Street to Dovercourt Road
 STAFF REPORT ACTION REQUIRED Parking Regulations Dundas Street West, from Bathurst Street to Dovercourt Road Date: October 28, 2008 To: From: Toronto and East York Community Council Director, Transportation
Fundamental Diagram Calibration: A Stochastic Approach to Linear Fitting
 Fundamental Diagram Calibration: A Stochastic Approach to Linear Fitting Brian Phegley Department of Mechanical Engineering University of California, Berkeley Berkeley, CA 947 phone: () 72-11 brianph@berkeley.edu
Analytical Delay Models for Signalized Intersections
 Analytical Delay Models for Signalized Intersections Ali Payidar Akgungor and A. Graham R. Bullen INTRODUCTION Delay is the most important measure of effectiveness (MOE) at a signalized intersection because
MODELLING TRAFFIC FLOW ON MOTORWAYS: A HYBRID MACROSCOPIC APPROACH
 Proceedings ITRN2013 5-6th September, FITZGERALD, MOUTARI, MARSHALL: Hybrid Aidan Fitzgerald MODELLING TRAFFIC FLOW ON MOTORWAYS: A HYBRID MACROSCOPIC APPROACH Centre for Statistical Science and Operational
Laboratory 2: Motion in One Dimension: Velocity
 Phys 131L Fall 010 Laboratory : Motion in One Dimension: One of the goals of classical mechanics is to determine the position of an object as time passes. A useful quantity in this context is the object
CHAPTER 2. CAPACITY OF TWO-WAY STOP-CONTROLLED INTERSECTIONS
 CHAPTER 2. CAPACITY OF TWO-WAY STOP-CONTROLLED INTERSECTIONS 1. Overview In this chapter we will explore the models on which the HCM capacity analysis method for two-way stop-controlled (TWSC) intersections
UC Irvine UC Irvine Previously Published Works
 UC Irvine UC Irvine Previously Published Works Title A kinematic wave theory of capacity drop Permalink https://escholarship.org/uc/item/9hh6x9q9 Authors Jin, WL Gan, QJ Lebacque, JP Publication Date 2013-10-11
Control experiments for a network of signalized intersections using the.q simulator
 Control experiments for a network of signalized intersections using the.q simulator Jennie Lioris Alexander A. Kurzhanskiy Pravin Varaiya California PATH, University of California, Berkeley Abstract: The
Estimation of Speeds from Single-Loop Freeway Flow and Occupancy Data Using Cusp Catastrophe Theory Model
 TRANSPORTATION RESEARCH RECORD 1457 149 Estimation of Speeds from Single-Loop Freeway Flow and Occupancy Data Using Cusp Catastrophe Theory Model ANNA PUSHKAR, FRED L. HALL, AND JORGE A. ACHA-DAZA Many
Using High-Resolution Detector and Signal Data to Support Crash Identification and Reconstruction. Indrajit Chatterjee Gary Davis May, 2011
 Using High-Resolution Detector and Signal Data to Support Crash Identification and Reconstruction Indrajit Chatterjee Gary Davis May, 2011 Introduction Road accidents are complex phenomenon. Causal factors
Individual speed variance in traffic flow: analysis of Bay Area radar measurements
 Individual speed variance in traffic flow: analysis of Bay Area radar measurements Sebastien Blandin 1, Amir Salam, Alex Bayen Submitted For Publication 1 th Annual Meeting of the Transportation Research