Last updated: Oct 18, 2012 LINEAR REGRESSION PSYC 3031 INTERMEDIATE STATISTICS LABORATORY. J. Elder
|
|
|
- Simon Sparks
- 5 years ago
- Views:
Transcription
1 Last updated: Oct 18, 2012 LINEAR REGRESSION
2 Acknowledgements 2 Some of these slides have been sourced or modified from slides created by A. Field for Discovering Statistics using R.
3 Simple Linear
4 Objectives 4 Understand linear regression with one predictor Understand how we assess the fit of a regression model Total sum of squares Model sum of squares Residual sum of squares F R 2 Know how to do regression using R Interpret a regression model
5 What is? 5 A way of predicting the value of one variable from another. It is a hypothetical model of the relationship between two variables. We will focus on a linear relationship, in which the outcome variable is predicted by a straight line.
6 Describing a Straight Line 6 Y = b + bx + ε i 0 i i i b i b 0 coefficient for the predictor Gradient (slope) of the regression line Direction/strength of relationship Intercept (value of Y when X = 0) Point at which the regression line crosses the Y-axis (ordinate)
7 Intercepts and Gradients 7 Same intercept, different slopes Same slope, different intercepts

8 8 The Method of Least Squares This graph shows a scatterplot of some data with a line representing the general trend. The vertical lines (dotted) represent the differences (or residuals) between the line and the actual data
9 Why Least Squares? 9 It can be shown that if the noise is 0-mean and independent and identically-distributed (IID), then the maximum probability linear model is that which minimizes the sum of squared residuals.

10 How Good Is the Model? 10 The regression line is only a model based on the data. This model might not reflect reality. We need some way of testing how well the model fits the observed data. How? Slide 10
.")
.")
11 Sources of Variability 11 SS T Total variability (variability between scores and the mean). SS R Residual/error variability (variability between the regression model and the actual data). SS M Model variability (difference in variability between the model and the mean). SS T SS T = SS M + SS R SS M SS R
12 Sources of Variability: Sums of Squares 12 Let t i = observed values of outcome variable. y i = model predictions for outcome variable. Then The total variation is SS T = ( t i t ) 2 The residual (error) variation is SS R = n i=1 ( t i y i ) 2 The variation explained by the model is SS M = n i=1 n i=1 ( y i t ) 2

13 Testing the Model: ANOVA 13 If the model results in better prediction than using the mean, then we expect SS M to be much greater than SS R
14 Coefficient of Determination: R 2 14 R 2 The proportion of variance accounted for by the regression model. The Pearson Correlation Coefficient Squared 2 R = SS SS M T
15 Mean Squares: Testing Significance 15 Let t i = observed values of outcome variable. y i = model predictions for outcome variable. Then The unexplained (residual) mean squares is MS R = 1 df R SS R = 1 n 2 SS = 1 R n 2 The model mean squares is n i=1 ( t i y i ) 2 ( ) 2 MS M = 1 SS df M = 1 n M 2 1 SS = SS = y y M M i i=1 F = MS MS M R
16 More on the F-Statistic 16 The F-statistic can be used to compare any two nested models. Let s label the models 1 and 2, where model 2 is an elaboration of model 1. Then we can test whether model 2 significantly increases the explained variance using the statistic F = SS 1 SS 2 df 2 df 1 SS 2 n df 2 where the SS refer to the sum of squared residuals from the respective models and n is the total number of data points.
17 More on the F-Statistic 17 In the case of simple linear regression: Model 1 is the mean (horizontal line) with one degree of freedom. Model 2 is the sloped line with two degrees of freedom. Thus F = SS 1 SS 2 df 2 df 1 SS 2 n df 2 = SS T SS R 2 1 SS R n 2 = SS T SS R SS R n 2 = SS M SS R n 2 = MS M MS R.
18 : An Example 18 A record company boss was interested in predicting record sales from advertising. Data 200 different album releases Outcome variable: Sales (CDs and downloads) in the week after release Predictor variable: The amount (in units of 1000) spent promoting the record before release.


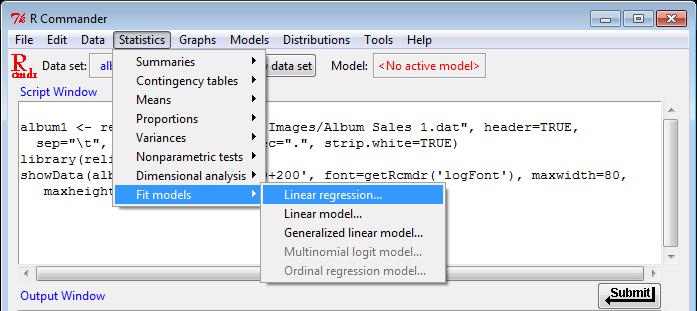
19 19 Doing Simple Using R Commander
20 in R 20 We run a regression analysis using the lm() function lm stands for linear model. This function takes the general form: newmodel<-lm(outcome ~ predictor(s), data = dataframe, na.action = an action))
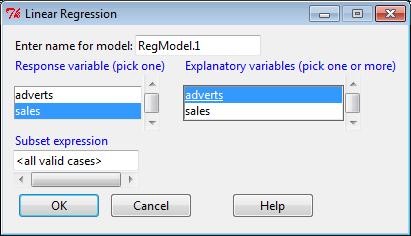
21 in R 21 albumsales.1 <- lm(album1$sales ~ album1$adverts) Or we can tell R what dataframe to use (using data = nameofdataframe), and then specify the variables without the dataframename$ before them: albumsales.1 <- lm(sales ~ adverts, data = album1)
22 Output of a Simple 22 We have created an object called albumsales.1 that contains the results of our analysis. We can show the object by executing: summary(albumsales.1) >Coefficients: Estimate Std. Error t value Pr(> t ) (Intercept) 1.341e e <2e-16 *** adverts 9.612e e <2e-16 *** Signif. codes: 0 *** ** 0.01 * Residual standard error: on 198 degrees of freedom Multiple R-squared: , Adjusted R-squared: F-statistic: on 1 and 198 DF, p-value: < 2.2e-16
23 Adjusted R-Squared 23 Note that if n = 2, R 2 = 1. In general, when two variables in fact have 0 correlation in the population, the expected R 2 for a sample of size n is 1/(n-1). In other words, the standard sample R 2 is a biased estimator of the population R 2. The adjusted R 2 provides an alternative, approximately unbiased estimator of the population R 2.
 i i Record Sales i ( 0.09612 Advertising Budget ) = 134.14 + i = 134.")
24 Using the Model 24 Record Salesi = b0 + b1 = Advertising Budget ( Advertising Budget ) i i Record Sales i ( Advertising Budget ) = i = = ( )
25 Objectives 25 Understand linear regression with one predictor Understand how we assess the fit of a regression model Total sum of squares Model sum of squares Residual sum of squares F R 2 Know how to do regression using R Interpret a regression model
26 Multiple
27 Objec-ves 27 Understand when to use mul-ple regression. Understand the mul-ple regression equa-on and what the betas represent. Understand different methods of regression Hierarchical Stepwise Forced Entry Understand how to do a mul-ple regression using R Understand how to interpret mul-ple regression. Understand the assump-ons of mul-ple regression and how to test them Slide 27
28 Multiple 28 Multiple regression extends linear regression to allow for 2 or more independent variables. There is still only one dependent (criterion) variable. We can think of the independent variables as predictors of the dependent variable. The main complication in multiple regression arises when the predictors are not statistically independent. 28 PSYC 6130, PROF. J. ELDER
29 : An Example 29 A record company boss was interested in predic-ng record sales from adver-sing. Data 200 different album releases Outcome variable: Sales (CDs and Downloads) in the week aner release Predictor variables The amount (in s) spent promo-ng the record before release (see last lecture) Number of plays on the radio (new variable)
30 The Model with One Predictor 30 Slide 30
31 Multiple as an Equation 31 With mul-ple regression the rela-onship is described using a straighworward generaliza-on of the equa-on for a straight line. y + = b0 b1 X1 + b2 X2 + + b n X n + εi Slide 31
32 Degrees of freedom 32 df = n k 1 where n = sample size k = number of predictors PSYC 6130, PROF. J. ELDER 32
33 33 b 0 b 0 is the intercept. The intercept is the value of the Y variable when all Xs = 0. This is the point at which the regression plane crosses the Y-axis. Slide 33
34 Coefficients 34 b 1 is the regression coefficient for variable 1. b 2 is the regression coefficient for variable 2. b n is the regression coefficient for n th variable. Slide 34

35 The Model with Two Predictors 35 b Adverts b 0 b airplay Slide 35
36 Coefficient of Multiple Determination 36 The proportion of variance explained by all of the independent variables together is called the coefficient of multiple determination (R 2 ). R is called the multiple correlation coefficient. R measures the correlation between the predictions and the actual values of the dependent variable. The correlation r iy of predictor i with the criterion (dependent variable) Y is called the validity of predictor i. 36 PSYC 6130, PROF. J. ELDER
37 Methods of Mul-ple 37 Hierarchical: Experimenter decides the order in which variables are entered into the model. Forced Entry: All predictors are entered simultaneously. Stepwise: Predictors are selected using their semi- par-al correla-on with the outcome. Slide 37
38
39 Hierarchical 39 Known predictors (based on past research) are entered into the regression model first. New predictors are then entered in a separate step/block. Experimenter makes the decisions. Slide 39
40 Hierarchical 40 It is the best method: Based on theory tes-ng. You can see the unique predic-ve influence of a new variable on the outcome because known predictors are held constant in the model. Bad Point: Relies on the experimenter knowing what they re doing! Slide 40
41 Forced Entry 41 All variables are entered into the model simultaneously. The results obtained depend on the variables entered into the model. It is important, therefore, to have good theore-cal reasons for including a par-cular variable. Slide 41
42 Stepwise 42 Select as the first predictor the variable that yields the largest R 2. Having selected the 1st predictor, a second is chosen from the remaining predictors. The semi- par-al correla-on is used as a criterion for selec-on. Slide 42
43 Stepwise 43 Step 2: Having selected the 1 st predictor, a second one is chosen from the remaining predictors. The semi- par.al correla.on is used as a criterion for selec-on. Slide 43
44 Semi- Par-al Correla-on 44 Par-al correla-on: measures the rela-onship between two variables, controlling for the effect that a third variable has on them both. A semi- par-al correla-on: Measures the rela-onship between two variables controlling for the effect that a third variable has on only one of the others. Slide 44
45 Semipartial Correlations 45 The semipartial correlations measure the correlation between each predictor and the criterion when all other predictors are held fixed. In this way, the effects of correlations between predictors are eliminated. In general, the semipartial correlations are smaller than the pairwise correlations. 45 PSYC 6130, PROF. J. ELDER
46 46 Problems with Stepwise Methods Rely on a mathema-cal criterion. Variable selec-on may depend upon only slight differences in the Semi- par-al correla-on. These slight numerical differences can lead to major theore-cal differences. Should be used only for explora-on Slide 46
47 Multicollinearity 47 Multicollinearity occurs when two predictors are strongly correlated. The result is that a family of solutions exist that trade off the regression weights between correlated predictors. This makes estimation of the regression coefficents b i unreliable. Also note that in this case, the coefficient of determination R 2 for the model will be much less than the sum of the R 2 values for each predictor alone.
48 48 Uncorrelated Predictors Variance explained by assignments Variance explained by midterm Total variance 2 r 1Y 2 r 2Y R =Total proportion of variance explained = r Y σ Y + r Y σ Y
49 49 Correlated Predictors Variance explained by assignments Variance explained by midterm Total variance 2 r 1Y 2 r 2Y R =Total proportion of variance explained < r Y + r Y
50 Example 50 Predicting records sales (Y) from advertising (X 1 ) and airplay (X 2 ). Y = b 0 + b 1 X 1 + b 2 X 2 + ε albumsales.2 <- lm(sales ~ adverts + airplay, data = album2)
51 Coefficients 51 b 1 = So, as adver-sing increases by 1, record sales increase by units. b 2 = So, each -me (per week) a song is played on radio 1 its sales increase by 3589 units. Slide 51
52 Constructing a Model 52 y Sales = b + b X + b X = Adverts plays Sales 1 Million Advertising,15 plays = ( ,000,000) + ( ) = = Slide 52
53 Standardized Coefficients 53 The coefficients b do not directly inform us of the importance of each predictor, since that also depends upon the dispersion of the predictors. To better assess importance, it is useful to transform the regression equation to standardized form: z y = β 0 + β 1 z 1 + β 2 z β n z n + ε i where z y is the z-score for the outcome variable z i is the z-score for the i th predictor X i.
54 Standardised Coefficients 54 lm.beta(albumsales.2) β 1 = As adver-sing increases by 1 standard devia-on, record sales increase by of a standard devia-on. β 2 = When the number of plays on radio increases by 1 s.d. its sales increase by standard devia-ons. Slide 54
55 Comparing Models 55 In standard linear regression we use an F-statistic to determine whether the linear model is significantly better than the mean in predicting the outcome variable. In hierarchical regression, we can use the same method to determine whether the addition of a new predictor leads to a significant improvement in predicting the outcome variable. In R, this can be achieved using the anova() function.
56 Comparing Models 56 anova(model.1, model.2,, model.n) Note that models must be hierarchical (nested): model.(i+1) includes all predictors of model.i, plus 1 or more additional predictors. Example: anova(albumsales.1, albumsales.2) Model 1: sales ~ adverts Model 2: sales ~ adverts + airplay Res.Df RSS Df Sum of Sq F Pr(>F) < 2.2e-16 *** --- Signif. codes: 0 *** ** 0.01 *
57 Generaliza-on 57 When we run regression, we hope to be able to generalize the sample model to the en-re popula-on. To do this, several assump-ons must be met. Viola-ng these assump-ons stops us generalizing conclusions to our target popula-on. Slide 57
58 Assumptions 58 Quantitative variables Linear dependence of outcome variable on predictors Homoscedasticity Independent, normally distributed errors Limited multicollinearity
59 Standardized Residuals 59 If the errors are normally distributed: ~95% of standardized residuals should lie between ±2. ~99% of standardized residuals should lie between ± 2.5. Slide 59


60 Normality of Errors: Histograms 60 Good Bad
61 Testing Independence 61 The Durbin-Watson Test Looks for statistical correlations between residuals of neighbouring cases. Statistic should be close to 2 if cases are independent. Example: > dwt(model3) lag Autocorrelation D-W Statistic p-value Alternative hypothesis: rho!= 0
62 Testing for Multicollinearity 62 Can use the VIF function. Values less than 10 are ok. Example > vif(model3) adverts airplay attract
63 Objec-ves 63 Understand when to use mul-ple regression. Understand the mul-ple regression equa-on and what the betas represent. Understand different methods of regression Hierarchical Stepwise Forced Entry Understand how to do a mul-ple regression using R Understand how to interpret mul-ple regression. Understand the assump-ons of mul-ple regression and how to test them Slide 63
Introduction to Regression
 Regression Introduction to Regression If two variables covary, we should be able to predict the value of one variable from another. Correlation only tells us how much two variables covary. In regression,
Linear Regression Measurement & Evaluation of HCC Systems
 Linear Regression Measurement & Evaluation of HCC Systems Linear Regression Today s goal: Evaluate the effect of multiple variables on an outcome variable (regression) Outline: - Basic theory - Simple
Regression. Marc H. Mehlman University of New Haven
 Regression Marc H. Mehlman marcmehlman@yahoo.com University of New Haven the statistician knows that in nature there never was a normal distribution, there never was a straight line, yet with normal and
Simple Linear Regression
 Simple Linear Regression 1 Correlation indicates the magnitude and direction of the linear relationship between two variables. Linear Regression: variable Y (criterion) is predicted by variable X (predictor)
Inferences for Regression
 Inferences for Regression An Example: Body Fat and Waist Size Looking at the relationship between % body fat and waist size (in inches). Here is a scatterplot of our data set: Remembering Regression In
Extensions of One-Way ANOVA.
 Extensions of One-Way ANOVA http://www.pelagicos.net/classes_biometry_fa18.htm What do I want You to Know What are two main limitations of ANOVA? What two approaches can follow a significant ANOVA? How
Multiple Regression. More Hypothesis Testing. More Hypothesis Testing The big question: What we really want to know: What we actually know: We know:
 Multiple Regression Ψ320 Ainsworth More Hypothesis Testing What we really want to know: Is the relationship in the population we have selected between X & Y strong enough that we can use the relationship
Multiple linear regression S6
 Basic medical statistics for clinical and experimental research Multiple linear regression S6 Katarzyna Jóźwiak k.jozwiak@nki.nl November 15, 2017 1/42 Introduction Two main motivations for doing multiple
Regression and the 2-Sample t
 Regression and the 2-Sample t James H. Steiger Department of Psychology and Human Development Vanderbilt University James H. Steiger (Vanderbilt University) Regression and the 2-Sample t 1 / 44 Regression
Regression: Main Ideas Setting: Quantitative outcome with a quantitative explanatory variable. Example, cont.
 TCELL 9/4/205 36-309/749 Experimental Design for Behavioral and Social Sciences Simple Regression Example Male black wheatear birds carry stones to the nest as a form of sexual display. Soler et al. wanted
Psychology Seminar Psych 406 Dr. Jeffrey Leitzel
 Psychology Seminar Psych 406 Dr. Jeffrey Leitzel Structural Equation Modeling Topic 1: Correlation / Linear Regression Outline/Overview Correlations (r, pr, sr) Linear regression Multiple regression interpreting
36-309/749 Experimental Design for Behavioral and Social Sciences. Sep. 22, 2015 Lecture 4: Linear Regression
 36-309/749 Experimental Design for Behavioral and Social Sciences Sep. 22, 2015 Lecture 4: Linear Regression TCELL Simple Regression Example Male black wheatear birds carry stones to the nest as a form
Extensions of One-Way ANOVA.
 Extensions of One-Way ANOVA http://www.pelagicos.net/classes_biometry_fa17.htm What do I want You to Know What are two main limitations of ANOVA? What two approaches can follow a significant ANOVA? How
Multiple Regression Part I STAT315, 19-20/3/2014
 Multiple Regression Part I STAT315, 19-20/3/2014 Regression problem Predictors/independent variables/features Or: Error which can never be eliminated. Our task is to estimate the regression function f.
Applied Regression Analysis
 Applied Regression Analysis Lecture 2 January 27, 2005 Lecture #2-1/27/2005 Slide 1 of 46 Today s Lecture Simple linear regression. Partitioning the sum of squares. Tests of significance.. Regression diagnostics
Variance. Standard deviation VAR = = value. Unbiased SD = SD = 10/23/2011. Functional Connectivity Correlation and Regression.
 10/3/011 Functional Connectivity Correlation and Regression Variance VAR = Standard deviation Standard deviation SD = Unbiased SD = 1 10/3/011 Standard error Confidence interval SE = CI = = t value for
LINEAR REGRESSION ANALYSIS. MODULE XVI Lecture Exercises
 LINEAR REGRESSION ANALYSIS MODULE XVI Lecture - 44 Exercises Dr. Shalabh Department of Mathematics and Statistics Indian Institute of Technology Kanpur Exercise 1 The following data has been obtained on
A discussion on multiple regression models
 A discussion on multiple regression models In our previous discussion of simple linear regression, we focused on a model in which one independent or explanatory variable X was used to predict the value
Prepared by: Prof. Dr Bahaman Abu Samah Department of Professional Development and Continuing Education Faculty of Educational Studies Universiti
 Prepared by: Prof Dr Bahaman Abu Samah Department of Professional Development and Continuing Education Faculty of Educational Studies Universiti Putra Malaysia Serdang M L Regression is an extension to
Six Sigma Black Belt Study Guides
 Six Sigma Black Belt Study Guides 1 www.pmtutor.org Powered by POeT Solvers Limited. Analyze Correlation and Regression Analysis 2 www.pmtutor.org Powered by POeT Solvers Limited. Variables and relationships
The simple linear regression model discussed in Chapter 13 was written as
 1519T_c14 03/27/2006 07:28 AM Page 614 Chapter Jose Luis Pelaez Inc/Blend Images/Getty Images, Inc./Getty Images, Inc. 14 Multiple Regression 14.1 Multiple Regression Analysis 14.2 Assumptions of the Multiple
Nature vs. nurture? Lecture 18 - Regression: Inference, Outliers, and Intervals. Regression Output. Conditions for inference.
 Understanding regression output from software Nature vs. nurture? Lecture 18 - Regression: Inference, Outliers, and Intervals In 1966 Cyril Burt published a paper called The genetic determination of differences
Analysis of Covariance. The following example illustrates a case where the covariate is affected by the treatments.
 Analysis of Covariance In some experiments, the experimental units (subjects) are nonhomogeneous or there is variation in the experimental conditions that are not due to the treatments. For example, a
1 Correlation and Inference from Regression
 1 Correlation and Inference from Regression Reading: Kennedy (1998) A Guide to Econometrics, Chapters 4 and 6 Maddala, G.S. (1992) Introduction to Econometrics p. 170-177 Moore and McCabe, chapter 12 is
22s:152 Applied Linear Regression. Take random samples from each of m populations.
 22s:152 Applied Linear Regression Chapter 8: ANOVA NOTE: We will meet in the lab on Monday October 10. One-way ANOVA Focuses on testing for differences among group means. Take random samples from each
Stat 500 Midterm 2 12 November 2009 page 0 of 11
 Stat 500 Midterm 2 12 November 2009 page 0 of 11 Please put your name on the back of your answer book. Do NOT put it on the front. Thanks. Do not start until I tell you to. The exam is closed book, closed
ST430 Exam 2 Solutions
 ST430 Exam 2 Solutions Date: November 9, 2015 Name: Guideline: You may use one-page (front and back of a standard A4 paper) of notes. No laptop or textbook are permitted but you may use a calculator. Giving
1 Multiple Regression
 1 Multiple Regression In this section, we extend the linear model to the case of several quantitative explanatory variables. There are many issues involved in this problem and this section serves only
Multiple Linear Regression. Chapter 12
 13 Multiple Linear Regression Chapter 12 Multiple Regression Analysis Definition The multiple regression model equation is Y = b 0 + b 1 x 1 + b 2 x 2 +... + b p x p + ε where E(ε) = 0 and Var(ε) = s 2.
22s:152 Applied Linear Regression. There are a couple commonly used models for a one-way ANOVA with m groups. Chapter 8: ANOVA
 22s:152 Applied Linear Regression Chapter 8: ANOVA NOTE: We will meet in the lab on Monday October 10. One-way ANOVA Focuses on testing for differences among group means. Take random samples from each
Inference for Regression
 Inference for Regression Section 9.4 Cathy Poliak, Ph.D. cathy@math.uh.edu Office in Fleming 11c Department of Mathematics University of Houston Lecture 13b - 3339 Cathy Poliak, Ph.D. cathy@math.uh.edu
1 The Classic Bivariate Least Squares Model
 Review of Bivariate Linear Regression Contents 1 The Classic Bivariate Least Squares Model 1 1.1 The Setup............................... 1 1.2 An Example Predicting Kids IQ................. 1 2 Evaluating
1 Introduction 1. 2 The Multiple Regression Model 1
 Multiple Linear Regression Contents 1 Introduction 1 2 The Multiple Regression Model 1 3 Setting Up a Multiple Regression Model 2 3.1 Introduction.............................. 2 3.2 Significance Tests
Chapter 12 - Part I: Correlation Analysis
 ST coursework due Friday, April - Chapter - Part I: Correlation Analysis Textbook Assignment Page - # Page - #, Page - # Lab Assignment # (available on ST webpage) GOALS When you have completed this lecture,
1 Use of indicator random variables. (Chapter 8)
") 1 Use of indicator random variables. (Chapter 8) let I(A) = 1 if the event A occurs, and I(A) = 0 otherwise. I(A) is referred to as the indicator of the event A. The notation I A is often used. 1 2 Fitting
1 Use of indicator random variables. (Chapter 8) let I(A) = 1 if the event A occurs, and I(A) = 0 otherwise. I(A) is referred to as the indicator of the event A. The notation I A is often used. 1 2 Fitting
Chapter 14 Student Lecture Notes Department of Quantitative Methods & Information Systems. Business Statistics. Chapter 14 Multiple Regression
 Chapter 14 Student Lecture Notes 14-1 Department of Quantitative Methods & Information Systems Business Statistics Chapter 14 Multiple Regression QMIS 0 Dr. Mohammad Zainal Chapter Goals After completing
MORE ON SIMPLE REGRESSION: OVERVIEW
 FI=NOT0106 NOTICE. Unless otherwise indicated, all materials on this page and linked pages at the blue.temple.edu address and at the astro.temple.edu address are the sole property of Ralph B. Taylor and
The Multiple Regression Model
 Multiple Regression The Multiple Regression Model Idea: Examine the linear relationship between 1 dependent (Y) & or more independent variables (X i ) Multiple Regression Model with k Independent Variables:
Section 3: Simple Linear Regression
 Section 3: Simple Linear Regression Carlos M. Carvalho The University of Texas at Austin McCombs School of Business http://faculty.mccombs.utexas.edu/carlos.carvalho/teaching/ 1 Regression: General Introduction
Applied Regression Modeling: A Business Approach Chapter 3: Multiple Linear Regression Sections
 Applied Regression Modeling: A Business Approach Chapter 3: Multiple Linear Regression Sections 3.1 3.3.2 by Iain Pardoe 3.1 Probability model for (X 1, X 2,...) and Y 2 Multiple linear regression................................................
Chapter 1: Linear Regression with One Predictor Variable also known as: Simple Linear Regression Bivariate Linear Regression
 BSTT523: Kutner et al., Chapter 1 1 Chapter 1: Linear Regression with One Predictor Variable also known as: Simple Linear Regression Bivariate Linear Regression Introduction: Functional relation between
Lecture 19 Multiple (Linear) Regression
 Regression") Lecture 19 Multiple (Linear) Regression Thais Paiva STA 111 - Summer 2013 Term II August 1, 2013 1 / 30 Thais Paiva STA 111 - Summer 2013 Term II Lecture 19, 08/01/2013 Lecture Plan 1 Multiple regression
Lecture 19 Multiple (Linear) Regression Thais Paiva STA 111 - Summer 2013 Term II August 1, 2013 1 / 30 Thais Paiva STA 111 - Summer 2013 Term II Lecture 19, 08/01/2013 Lecture Plan 1 Multiple regression
Lab 3 A Quick Introduction to Multiple Linear Regression Psychology The Multiple Linear Regression Model
 Lab 3 A Quick Introduction to Multiple Linear Regression Psychology 310 Instructions.Work through the lab, saving the output as you go. You will be submitting your assignment as an R Markdown document.
B. Weaver (24-Mar-2005) Multiple Regression Chapter 5: Multiple Regression Y ) (5.1) Deviation score = (Y i
 Multiple Regression Chapter 5: Multiple Regression Y ) (5.1) Deviation score = (Y i") B. Weaver (24-Mar-2005) Multiple Regression... 1 Chapter 5: Multiple Regression 5.1 Partial and semi-partial correlation Before starting on multiple regression per se, we need to consider the concepts
B. Weaver (24-Mar-2005) Multiple Regression... 1 Chapter 5: Multiple Regression 5.1 Partial and semi-partial correlation Before starting on multiple regression per se, we need to consider the concepts
Simple Linear Regression
 Simple Linear Regression ST 430/514 Recall: A regression model describes how a dependent variable (or response) Y is affected, on average, by one or more independent variables (or factors, or covariates)
MODELS WITHOUT AN INTERCEPT
 Consider the balanced two factor design MODELS WITHOUT AN INTERCEPT Factor A 3 levels, indexed j 0, 1, 2; Factor B 5 levels, indexed l 0, 1, 2, 3, 4; n jl 4 replicate observations for each factor level
28. SIMPLE LINEAR REGRESSION III
 28. SIMPLE LINEAR REGRESSION III Fitted Values and Residuals To each observed x i, there corresponds a y-value on the fitted line, y = βˆ + βˆ x. The are called fitted values. ŷ i They are the values of
22s:152 Applied Linear Regression. Chapter 5: Ordinary Least Squares Regression. Part 1: Simple Linear Regression Introduction and Estimation
 22s:152 Applied Linear Regression Chapter 5: Ordinary Least Squares Regression Part 1: Simple Linear Regression Introduction and Estimation Methods for studying the relationship of two or more quantitative
Inference with Simple Regression
 1 Introduction Inference with Simple Regression Alan B. Gelder 06E:071, The University of Iowa 1 Moving to infinite means: In this course we have seen one-mean problems, twomean problems, and problems
Ch 2: Simple Linear Regression
 Ch 2: Simple Linear Regression 1. Simple Linear Regression Model A simple regression model with a single regressor x is y = β 0 + β 1 x + ɛ, where we assume that the error ɛ is independent random component
Lecture 11: Simple Linear Regression
 Lecture 11: Simple Linear Regression Readings: Sections 3.1-3.3, 11.1-11.3 Apr 17, 2009 In linear regression, we examine the association between two quantitative variables. Number of beers that you drink
Statistiek II. John Nerbonne. March 17, Dept of Information Science incl. important reworkings by Harmut Fitz
 Dept of Information Science j.nerbonne@rug.nl incl. important reworkings by Harmut Fitz March 17, 2015 Review: regression compares result on two distinct tests, e.g., geographic and phonetic distance of
STK4900/ Lecture 3. Program
 STK4900/9900 - Lecture 3 Program 1. Multiple regression: Data structure and basic questions 2. The multiple linear regression model 3. Categorical predictors 4. Planned experiments and observational studies
Data Analysis 1 LINEAR REGRESSION. Chapter 03
 Data Analysis 1 LINEAR REGRESSION Chapter 03 Data Analysis 2 Outline The Linear Regression Model Least Squares Fit Measures of Fit Inference in Regression Other Considerations in Regression Model Qualitative
(ii) Scan your answer sheets INTO ONE FILE only, and submit it in the drop-box.
 Scan your answer sheets INTO ONE FILE only, and submit it in the drop-box.") FINAL EXAM ** Two different ways to submit your answer sheet (i) Use MS-Word and place it in a drop-box. (ii) Scan your answer sheets INTO ONE FILE only, and submit it in the drop-box. Deadline: December
FINAL EXAM ** Two different ways to submit your answer sheet (i) Use MS-Word and place it in a drop-box. (ii) Scan your answer sheets INTO ONE FILE only, and submit it in the drop-box. Deadline: December
Chapter 4: Regression Models
 Sales volume of company 1 Textbook: pp. 129-164 Chapter 4: Regression Models Money spent on advertising 2 Learning Objectives After completing this chapter, students will be able to: Identify variables,
Diagnostics and Transformations Part 2
 Diagnostics and Transformations Part 2 Bivariate Linear Regression James H. Steiger Department of Psychology and Human Development Vanderbilt University Multilevel Regression Modeling, 2009 Diagnostics
Review of Multiple Regression
 Ronald H. Heck 1 Let s begin with a little review of multiple regression this week. Linear models [e.g., correlation, t-tests, analysis of variance (ANOVA), multiple regression, path analysis, multivariate
1.) Fit the full model, i.e., allow for separate regression lines (different slopes and intercepts) for each species
 Fit the full model, i.e., allow for separate regression lines (different slopes and intercepts) for each species") Lecture notes 2/22/2000 Dummy variables and extra SS F-test Page 1 Crab claw size and closing force. Problem 7.25, 10.9, and 10.10 Regression for all species at once, i.e., include dummy variables for
Lecture notes 2/22/2000 Dummy variables and extra SS F-test Page 1 Crab claw size and closing force. Problem 7.25, 10.9, and 10.10 Regression for all species at once, i.e., include dummy variables for
Chapter 14 Simple Linear Regression (A)
") Chapter 14 Simple Linear Regression (A) 1. Characteristics Managerial decisions often are based on the relationship between two or more variables. can be used to develop an equation showing how the variables
Chapter 14 Simple Linear Regression (A) 1. Characteristics Managerial decisions often are based on the relationship between two or more variables. can be used to develop an equation showing how the variables
MULTICOLLINEARITY AND VARIANCE INFLATION FACTORS. F. Chiaromonte 1
 MULTICOLLINEARITY AND VARIANCE INFLATION FACTORS F. Chiaromonte 1 Pool of available predictors/terms from them in the data set. Related to model selection, are the questions: What is the relative importance
COMPARING SEVERAL MEANS: ANOVA
 LAST UPDATED: November 15, 2012 COMPARING SEVERAL MEANS: ANOVA Objectives 2 Basic principles of ANOVA Equations underlying one-way ANOVA Doing a one-way ANOVA in R Following up an ANOVA: Planned contrasts/comparisons
Ref.: Spring SOS3003 Applied data analysis for social science Lecture note
 SOS3003 Applied data analysis for social science Lecture note 05-2010 Erling Berge Department of sociology and political science NTNU Spring 2010 Erling Berge 2010 1 Literature Regression criticism I Hamilton
Business Statistics. Lecture 9: Simple Regression
 Business Statistics Lecture 9: Simple Regression 1 On to Model Building! Up to now, class was about descriptive and inferential statistics Numerical and graphical summaries of data Confidence intervals
BIOL 458 BIOMETRY Lab 9 - Correlation and Bivariate Regression
 BIOL 458 BIOMETRY Lab 9 - Correlation and Bivariate Regression Introduction to Correlation and Regression The procedures discussed in the previous ANOVA labs are most useful in cases where we are interested
Correlation and Simple Linear Regression
 Correlation and Simple Linear Regression Sasivimol Rattanasiri, Ph.D Section for Clinical Epidemiology and Biostatistics Ramathibodi Hospital, Mahidol University E-mail: sasivimol.rat@mahidol.ac.th 1 Outline
Multiple Regression. Peerapat Wongchaiwat, Ph.D.
 Peerapat Wongchaiwat, Ph.D. wongchaiwat@hotmail.com The Multiple Regression Model Examine the linear relationship between 1 dependent (Y) & 2 or more independent variables (X i ) Multiple Regression Model
Introduction to Regression
 Introduction to Regression ιατµηµατικό Πρόγραµµα Μεταπτυχιακών Σπουδών Τεχνο-Οικονοµικά Συστήµατα ηµήτρης Φουσκάκης Introduction Basic idea: Use data to identify relationships among variables and use these
Intro to Linear Regression
 Intro to Linear Regression Introduction to Regression Regression is a statistical procedure for modeling the relationship among variables to predict the value of a dependent variable from one or more predictor
Heteroscedasticity 1
 Heteroscedasticity 1 Pierre Nguimkeu BUEC 333 Summer 2011 1 Based on P. Lavergne, Lectures notes Outline Pure Versus Impure Heteroscedasticity Consequences and Detection Remedies Pure Heteroscedasticity
Correlation and Regression
 Correlation and Regression Dr. Bob Gee Dean Scott Bonney Professor William G. Journigan American Meridian University 1 Learning Objectives Upon successful completion of this module, the student should
LAB 5 INSTRUCTIONS LINEAR REGRESSION AND CORRELATION
 LAB 5 INSTRUCTIONS LINEAR REGRESSION AND CORRELATION In this lab you will learn how to use Excel to display the relationship between two quantitative variables, measure the strength and direction of the
Stat 412/512 TWO WAY ANOVA. Charlotte Wickham. stat512.cwick.co.nz. Feb
 Stat 42/52 TWO WAY ANOVA Feb 6 25 Charlotte Wickham stat52.cwick.co.nz Roadmap DONE: Understand what a multiple regression model is. Know how to do inference on single and multiple parameters. Some extra
INFERENCE FOR REGRESSION
 CHAPTER 3 INFERENCE FOR REGRESSION OVERVIEW In Chapter 5 of the textbook, we first encountered regression. The assumptions that describe the regression model we use in this chapter are the following. We
Simple Linear Regression
 9-1 l Chapter 9 l Simple Linear Regression 9.1 Simple Linear Regression 9.2 Scatter Diagram 9.3 Graphical Method for Determining Regression 9.4 Least Square Method 9.5 Correlation Coefficient and Coefficient
General Linear Statistical Models - Part III
 General Linear Statistical Models - Part III Statistics 135 Autumn 2005 Copyright c 2005 by Mark E. Irwin Interaction Models Lets examine two models involving Weight and Domestic in the cars93 dataset.
Correlation and the Analysis of Variance Approach to Simple Linear Regression
 Correlation and the Analysis of Variance Approach to Simple Linear Regression Biometry 755 Spring 2009 Correlation and the Analysis of Variance Approach to Simple Linear Regression p. 1/35 Correlation
Mathematics for Economics MA course
 Mathematics for Economics MA course Simple Linear Regression Dr. Seetha Bandara Simple Regression Simple linear regression is a statistical method that allows us to summarize and study relationships between
Single and multiple linear regression analysis
 Single and multiple linear regression analysis Marike Cockeran 2017 Introduction Outline of the session Simple linear regression analysis SPSS example of simple linear regression analysis Additional topics
15.063: Communicating with Data
 15.063: Communicating with Data Summer 2003 Recitation 6 Linear Regression Today s Content Linear Regression Multiple Regression Some Problems 15.063 - Summer '03 2 Linear Regression Why? What is it? Pros?
Intro to Linear Regression
 Intro to Linear Regression Introduction to Regression Regression is a statistical procedure for modeling the relationship among variables to predict the value of a dependent variable from one or more predictor
Statistical Modelling in Stata 5: Linear Models
 Statistical Modelling in Stata 5: Linear Models Mark Lunt Arthritis Research UK Epidemiology Unit University of Manchester 07/11/2017 Structure This Week What is a linear model? How good is my model? Does
Tests of Linear Restrictions
 Tests of Linear Restrictions 1. Linear Restricted in Regression Models In this tutorial, we consider tests on general linear restrictions on regression coefficients. In other tutorials, we examine some
36-707: Regression Analysis Homework Solutions. Homework 3
 36-707: Regression Analysis Homework Solutions Homework 3 Fall 2012 Problem 1 Y i = βx i + ɛ i, i {1, 2,..., n}. (a) Find the LS estimator of β: RSS = Σ n i=1(y i βx i ) 2 RSS β = Σ n i=1( 2X i )(Y i βx
Multiple Regression: Example
 Multiple Regression: Example Cobb-Douglas Production Function The Cobb-Douglas production function for observed economic data i = 1,..., n may be expressed as where O i is output l i is labour input c
REVIEW 8/2/2017 陈芳华东师大英语系
 REVIEW Hypothesis testing starts with a null hypothesis and a null distribution. We compare what we have to the null distribution, if the result is too extreme to belong to the null distribution (p
Simple linear regression
 Simple linear regression Business Statistics 41000 Fall 2015 1 Topics 1. conditional distributions, squared error, means and variances 2. linear prediction 3. signal + noise and R 2 goodness of fit 4.
Can you tell the relationship between students SAT scores and their college grades?
 Correlation One Challenge Can you tell the relationship between students SAT scores and their college grades? A: The higher SAT scores are, the better GPA may be. B: The higher SAT scores are, the lower
BNAD 276 Lecture 10 Simple Linear Regression Model
 1 / 27 BNAD 276 Lecture 10 Simple Linear Regression Model Phuong Ho May 30, 2017 2 / 27 Outline 1 Introduction 2 3 / 27 Outline 1 Introduction 2 4 / 27 Simple Linear Regression Model Managerial decisions
Business Statistics. Lecture 10: Correlation and Linear Regression
 Business Statistics Lecture 10: Correlation and Linear Regression Scatterplot A scatterplot shows the relationship between two quantitative variables measured on the same individuals. It displays the Form
Chapter 14 Student Lecture Notes 14-1
 Chapter 14 Student Lecture Notes 14-1 Business Statistics: A Decision-Making Approach 6 th Edition Chapter 14 Multiple Regression Analysis and Model Building Chap 14-1 Chapter Goals After completing this
Linear Regression and Correlation
 Linear Regression and Correlation Chapter 13 McGraw-Hill/Irwin Copyright 2010 by The McGraw-Hill Companies, Inc. All rights reserved. GOALS 1. Understand and interpret the terms dependent and independent
22s:152 Applied Linear Regression. Chapter 8: 1-Way Analysis of Variance (ANOVA) 2-Way Analysis of Variance (ANOVA)
 2-Way Analysis of Variance (ANOVA)") 22s:152 Applied Linear Regression Chapter 8: 1-Way Analysis of Variance (ANOVA) 2-Way Analysis of Variance (ANOVA) We now consider an analysis with only categorical predictors (i.e. all predictors are
22s:152 Applied Linear Regression Chapter 8: 1-Way Analysis of Variance (ANOVA) 2-Way Analysis of Variance (ANOVA) We now consider an analysis with only categorical predictors (i.e. all predictors are
SCHOOL OF MATHEMATICS AND STATISTICS
 RESTRICTED OPEN BOOK EXAMINATION (Not to be removed from the examination hall) Data provided: Statistics Tables by H.R. Neave MAS5052 SCHOOL OF MATHEMATICS AND STATISTICS Basic Statistics Spring Semester
Biostatistics and Design of Experiments Prof. Mukesh Doble Department of Biotechnology Indian Institute of Technology, Madras
 Biostatistics and Design of Experiments Prof. Mukesh Doble Department of Biotechnology Indian Institute of Technology, Madras Lecture - 39 Regression Analysis Hello and welcome to the course on Biostatistics
appstats27.notebook April 06, 2017
 Chapter 27 Objective Students will conduct inference on regression and analyze data to write a conclusion. Inferences for Regression An Example: Body Fat and Waist Size pg 634 Our chapter example revolves
Chapter 10. Regression. Understandable Statistics Ninth Edition By Brase and Brase Prepared by Yixun Shi Bloomsburg University of Pennsylvania
 Chapter 10 Regression Understandable Statistics Ninth Edition By Brase and Brase Prepared by Yixun Shi Bloomsburg University of Pennsylvania Scatter Diagrams A graph in which pairs of points, (x, y), are
Multiple Linear Regression II. Lecture 8. Overview. Readings
 Multiple Linear Regression II Lecture 8 Image source:http://commons.wikimedia.org/wiki/file:vidrarias_de_laboratorio.jpg Survey Research & Design in Psychology James Neill, 2015 Creative Commons Attribution
Multiple Linear Regression II. Lecture 8. Overview. Readings. Summary of MLR I. Summary of MLR I. Summary of MLR I
 Multiple Linear Regression II Lecture 8 Image source:http://commons.wikimedia.org/wiki/file:vidrarias_de_laboratorio.jpg Survey Research & Design in Psychology James Neill, 2015 Creative Commons Attribution
Econometrics Part Three
 !1 I. Heteroskedasticity A. Definition 1. The variance of the error term is correlated with one of the explanatory variables 2. Example -- the variance of actual spending around the consumption line increases