vulcanhammer.net Visit our companion site
|
|
|
- Bathsheba Ball
- 5 years ago
- Views:
Transcription

 presented on this web site is for general information only.")
1 this document downloaded from vulcanhammer.net Since 1997, your complete online resource for information geotecnical engineering and deep foundations: The Wave Equation Page for Piling Online books on all aspects of soil mechanics, foundations and marine construction Free general engineering and geotechnical software And much more... Terms and Conditions of Use: All of the information, data and computer software ( information ) presented on this web site is for general information only. While every effort will be made to insure its accuracy, this information should not be used or relied on for any specific application without independent, competent professional examination and verification of its accuracy, suitability and applicability by a licensed professional. Anyone making use of this information does so at his or her own risk and assumes any and all liability resulting from such use. The entire risk as to quality or usability of the information contained within is with the reader. In no event will this web page or webmaster be held liable, nor does this web page or its webmaster provide insurance against liability, for any damages including lost profits, lost savings or any other incidental or consequential damages arising from the use or inability to use the information contained within. This site is not an official site of Prentice-Hall, Pile Buck, the University of Tennessee at Chattanooga, or Vulcan Foundation Equipment. All references to sources of software, equipment, parts, service or repairs do not constitute an endorsement. Visit our companion site
2 DEVELOPMENT OF AN EARTH PRESSURE MODEL FOR DESIGN OF RETAINING STRUCTURES IN PIEDMONT SOILS FINAL REPORT University of North Carolina at Charlotte Department of Civil and Environmental Engineering October, 08 J. Brian Anderson, Ph.D. P.E., Principal Investigator Vincent Ogunro, Ph.D., Co-Principal Investigator Jonathan M. Detwiler, Graduate Student James R. Starnes Jr., Graduate Student Richard E. Burrage Jr., Graduate Student
3 TECHNICAL REPORT DOCUMENTATION PAGE 1. Report No. FHWA/NC/ Title and Subtitle Development of an Earth Pressure Model for Design of Earth Retaining Structures in Piedmont Soil 2. Government Accession No. 3. Recipient s Catalog No. 5. Report Date October Performing Organization Code 7. Author(s) J. B. Anderson and V. O. Ogunro 9. Performing Organization Name and Address University of North Carolina at Charlotte College of Engineering 91 University City Boulevard Charlotte, NC Sponsoring Agency Name and Address North Carolina Department of Transportation Research and Development Unit 1549 Mail Service Center Raleigh, Supplementary Notes: 8. Performing Organization Report No. 10. Work Unit No. (TRAIS) 11. Contract or Grant No. 13. Type of Report and Period Covered Final Report July 04 June Sponsoring Agency Code Abstract Anecdotal evidence suggests that earth pressure in Piedmont residual soils is typically over estimated. Such estimates of earth pressure impact the design of earth retaining structures used on highway projects. Thus, the development of an appropriate model for estimating earth pressure would result in more rational design of retaining structures in Piedmont residual soils. Accordingly, the objective of this research was to develop an earth pressure model for Piedmont residual soil. An experimental program to estimate, model, and measure earth pressure in Piedmont residual soils was carried out by the University of North Carolina at Charlotte. This study centered around the instrumentation, construction, and load testing of four sheet pile retaining walls at two sites in the Charlotte Belt and Carolina Slate belt regions of the Piedmont. The scope of work included extensive insitu and laboratory soil testing to estimate soil strength parameters for the residual soils; and numerical models to plan the load testing program and evaluate the results. Results of the load tests showed little or no earth pressure due to Piedmont residual soil. Interpretation of data from the sites using theoretical and numerical methods supports this findings. Conclusions from this study include: 1) The earth pressure currently used in design of retaining structures in Piedmont soils is greater than earth pressure measured during load tests. Field measurements from the instrumented wall load tests demonstrated that the retained soils exerted little or no pressure on the structure. 2) The Piedmont soils that were tested in this research had significant strength. The average drained friction angle was 28 o and the average drained cohesion intercept was above 300 psf. These values were consistent with those found in the literature for similar soils. 3) Based on the soil test results as well as the minimal earth pressure detected during the load tests, the soil strength parameters, φ and c should be used together in Rankine s earth pressure equation to predict the earth pressure in Piedmont soils. And 4) Triaxial tests provided the most consistent measurement of φ and c. The borehole shear tests also measure φ and c but should only be used when triaxial testing is unavailable. 17. Key Words Retaining structure, residual soil, sheet pile, insitu test, load test, instrumentation, dilatometer, borehole shear, triaxial 18. Distribution Statement 19. Security Classif. (of this report) Unclassified. Security Classif. (of this page) Unclassified 21. No. of Pages Price Form DOT F (8-72) Reproduction of completed page authorized ii
4 DISCLAIMER The contents of this report reflect the views of the Authors and not necessarily the views of the University. The Authors are responsible for the facts and the accuracy of the data presented herein. The contents do not necessarily reflect the official views or policies of the North Carolina Department of Transportation or the Federal Highway Administration. This report does not constitute a standard, specification, or regulation. iii
5 ACKNOWLEDGMENTS This project would not have been possible without major contributions from several individuals and groups. The researchers would like to express their sincerest gratitude to following individuals and organizations: The North Carolina Department of Transportation Geotechnical Engineering Unit Njoroge Wainaina, Mohammed Mulla, Chris Kreider, Scott Hidden, Chris Chen, Scott Webb, Clint Little, Jay Stickney, Chad Smith, and Mike Smith. Materials and Tests Unit C.K. Su and Randy Privette Division 12 Construction and Operations Max Buchanan, Dan Grissom, and Marty Plyler. Division 10 Construction and Operations Barry Moose, Garland Haywood, Gary Huneycutt, and Mark Smith. S&ME, Inc. Billy Camp and Tim Cleary Insitu Soil LLC. Roger Failmezger iv
6 SUMMARY Anecdotal evidence suggests that earth pressure in piedmont residual soils is typically over estimated. Increased or overly conservative estimates of earth pressure impact the design of earth retaining structures used on highway projects. Thus, the development of an appropriate model for estimating earth pressure would result in more rational design of retaining structures in Piedmont residual soils. Accordingly, the objective of this research was to develop an earth pressure model for Piedmont residual soil. The University of North Carolina at Charlotte carried out an experimental program to estimate, model, and measure earth pressure in Piedmont residual soils. This study centered around the instrumentation, construction, and load testing of four sheet pile retaining walls at two sites in the Charlotte Belt and Carolina Slate belt regions of the Piedmont geologic province. The scope of work included extensive insitu and laboratory soil testing to determine soil strength parameters for the residual soils. Numerical models were used to both plan the load testing program and evaluate the results. Results of the load tests showed little or no earth pressure due to Piedmont residual soil. Data interpretation through theoretical and numerical methods supports this findings. Conclusions from this study include: 1) The earth pressure currently used in design of retaining structures in Piedmont soils is significantly greater than earth pressure measured during load tests. Field measurements from the instrumented wall load tests demonstrated that the retained soils exerted little or no pressure on the structure. 2) The Piedmont soils that were tested in this research had significant strength. The average effective friction angle was 28 o and the average drained cohesion v
7 intercept was above 300 psf. These values were consistent with those found in the literature for similar soils. 3) Based on the soil test results as well as the minimal earth pressure detected during the load tests, the soil strength parameters φ and c should be used together in Rankine s earth pressure equation to predict the earth pressure in Piedmont soils. 4) Triaxial tests provided the most consistent measurement of φ and c. The borehole shear tests also measure φ and c but should only be used when triaxial testing is unavailable. vi
8 TABLE OF CONTENTS page TECHNICAL REPORT DOCUMENTATION PAGE... ii DISCLAIMER... iii ACKNOWLEDGMENTS... iv SUMMARY...v 1 INTRODUCTION Introduction Background Retaining Structures Methods for Estimating Lateral Earth Pressure Theoretical Approaches Soil Structure Interaction Approach Finite Element Method Retaining Structure Design NCDOT Retaining Structures PROJECT OVERVIEW Objectives Research Methodology and Tasks Significance of Work Limitations of Research REVIEW OF RELEVANT LITERATURE Residual Soil Comprehensive test site studies Other works involving insitu and laboratory testing Specific Literature on Triaxial Testing in Residual Soils Load Testing of Retaining Structures SITE LOCATION AND CHARACTERIZATION Site Selection and Investigation Plan Statesville Insitu Tests Laboratory Soil Tests Monroe Insitu Tests Laboratory Soil Tests Summary of Soil Testing...40 vii
9 5 INSTRUMENTED WALL LOAD TESTS Preliminary Modeling FEM Initial Conditions FEM Modeling Selected Wall Section Instrumentation Plan Overview Strain Gages and Data Acquisition System Inclinometer Statesville Load Test Instrumentation System Pile Installation Excavation Challenges and Lessons Learned During the Statesville Test Monroe Load Test Instrumentation System Pile Installation Construction Stop and Re-evaluation Excavation RESULTS OF FIELD LOAD TESTING PROGRAM Statesville Test Site Quantitative Results Field Observations Monroe Test Site Quantitative Results Field Observations MODEL DEVELOPMENT Soil Strength Parameters Numerical Earth Pressure Models Earth Pressure Model Development Impact on Numerical Models Impact on Retaining Structure Design Parameter Selection CONCLUSION Research Summary Conclusions Recommendations LIST OF REFERENCES...95 viii
10 APPENDICES A STATESVILLE SOIL TEST DATA B MONROE SOIL TEST DATA C STRAIN GAGE DATA D INCLINOMETER DATA E RECOMMENDATIONS FOR TRIAXIAL TESTS IN PIEDMONT RESIDUAL SOILS ix
11 CHAPTER 1 INTRODUCTION 1.1 Introduction Earth retention is an integral part of transportation infrastructure. Mechanically stabilized earth, sheet pile, soldier pile, pile panel, soil nail, gravity and cantilevered are different types of retaining structures utilized by the North Carolina Department of Transportation. Regardless of the earth retaining method, the design of a retaining structure is driven by the earth pressure exerted by the soil that must be retained. Normal and shearing stresses exist within soil masses as well as at the interface between soil and structure. The magnitude and orientation of the resultant forces depend upon the strength and compressibility properties of the soil mass. In the case of a retaining wall, the amount of soil stress that is transmitted to the structure is the net amount that is not carried by the shearing strength within the soil mass. In the worst case, the entire stress due to the soil overburden is imposed on the wall, this would be the hydrostatic stress. However, most soils have internal shearing strength that will carry the stress and reduce the amount of lateral earth pressure. Therefore, knowing the strength and compressibility properties of the soil, the earth pressure on a retaining structure can be determined theoretically or analytically. Of course, the magnitude of earth pressure is affected by the type and nature of soil. North Carolina has a diverse geologic footprint. Subsurface materials in the state range from rock found in the mountains to sands of the coastal plain. However, several zones of residual soils, known collectively as the Piedmont Physiographic Province, underlay a large portion of the state. Figure 1.1 shows the location of the Piedmont and that a 1
 Within North Carolina, the Piedmont soils can be divided into three major zones: the Inner Piedmont (Alexander, Buncombe, Burke, Caldwell,")
12 number of major U.S. cities, from Trenton, New Jersey to Atlanta, Georgia, are all located in the zone. Figure Map of the Piedmont physiographic province (USGS 01) Within North Carolina, the Piedmont soils can be divided into three major zones: the Inner Piedmont (Alexander, Buncombe, Burke, Caldwell, Catawba, Cleveland, Henderson, Iredell, Lincoln, McDowell, Polk, Rockingham, Rutherford, Stokes, Surry, Transylvania, Yadkin, and Wilkes counties), the Charlotte Belt (Cabarrus, Davidson, Davie, Gaston, Guilford, Forsyth, Iredell, Lincoln, Mecklenburg, and Rowan counties) and the Carolina Slate Belt (Alamance, Anson, Cabarrus, Caswell, Chatham, Davidson, Durham, Granville, Guilford, Montgomery, Moore, Orange, Person, Randolph, Rowan, 2
13 Stanley, Union, and Vance counties). Figure 1.2 is a rough geologic map of North Carolina showing the Piedmont zones with county and NCDOT division boundaries Figure County and NCDOT Division maps over North Carolina geology. As a consequence of the formation process, residual soil often exhibits an increased strength over comparable transported materials. However, this strength often goes undetected by traditional sampling and insitu testing methods. Thus, the strength of residual soil is often poorly characterized and underestimated. This is particularly apparent when performing the standard penetration test, where many strength correlations were developed for transported soils that were assumed to either be cohesive or cohesionless, but not both. This assumption could mean that though a residual soil may be classified as a cohesionless material, the additional strength available due to the fabric structure and particle to particle bonding is ignored. In terms of an engineering equation, the shearing strength of soil is represented by the Mohr-Coulomb criteria τ = c + σ' tanφ, where the shear strength τ is the sum of a 3
14 cohesive component c and geostatic stress σ multiplied by the tangent of the drained friction angle φ. Within this context, most soils are typically assumed to have c = 0. However, residual soils tend to possess an appreciable amount of drained cohesion that can have a substantial impact on the design of retaining structures. 1.2 Background Retaining Structures Retaining structures are used when a difference in elevation is required and a constraint such as right of way, limited horizontal distance, or excessive elevation change, prevents utilizing a slope. In terms of typical highway applications, retaining structures are often used in bridge abutments, culverts and pipe wing walls, and roadway cuts and fills. Retaining structures can be categorized by construction method as either bottom up or top down type. Bottom up would commonly be used for retaining walls required for fills, but can be used in cut applications with temporary shoring. Such walls include gravity, cantilevered concrete, mechanically stabilized or reinforced earth. Top down walls are used for cut applications where the wall is installed during the cut process without the need for shoring. Common examples include soldier pile/pile panel (cantilevered or tied back), soil nails, and sheet piling Methods for Estimating Lateral Earth Pressure Common to methods for retaining structure design is the determination of lateral earth pressure. In the majority of cases, this is provided through the use of limiting equilibrium earth pressure coefficients. When the displacement of the structure is critical, the use of numerical techniques may be required. 4
15 Theoretical Approaches There are three categories of lateral earth pressure - earth pressure at-rest, active earth pressure, and passive earth pressure. Earth pressure at rest, σ 0, refers to lateral earth pressure caused by an unyielding wall preventing earth from any lateral movement. If a wall is permitted to move away from the retained soil mass a slight distance, the soil will expand laterally following the wall. Shearing resistance developed within the soil mass acts opposite to the direction of the expansion, resulting in a decrease in lateral earth pressure. The minimum lateral earth pressure is the active pressure, σ' a. Conversely, if a wall moves into the retained soil mass, the soil will be compressed laterally with the soil shearing resistance acting to oppose the lateral compression. The maximum lateral earth pressure condition is the passive pressure, σ' p. The relationship between vertical stress and the active and passive lateral stress for a soil with cohesion and internal friction is shown on the Mohr s circle presented in figure 1.3. φ Shear Stress c σ' a σ 0 σ v Normal Stress σ' p Figure Mohr s circle relationship for soil with cohesion and internal friction 5
16 The ratio of horizontal effective stress to vertical effective stress in a soil mass is referred to as the coefficient of lateral earth pressure, K. For the at-rest condition the earth pressure coefficient is designated K 0. For the active and passive pressure conditions the earth pressure coefficient is designated K a and K p, respectively. Therefore, σ ' = σ ' ± 2c' K (1.1) h K v where K is the appropriate earth pressure coefficient, depending on stress conditions. The at-rest stresses for cohesionless soils are often determined using the modified Jaky (1948) equation: ' = σ v' ( 1 sinφ ) 0 (1.2) σ Traditionally, two general methods are used to estimate lateral earth pressure the Rankine (stress) and Coulomb (force). Use of these theories has resulted in successful retaining wall design, but measured lateral earth pressure often differs largely from the expected values calculated from these models. These methods and many others are presented in a comprehensive text by Hansen (1961). The Rankine theory for determining lateral earth pressure is based on several assumptions, but the most important is that there is no adhesion or friction between wall and soil. Pressures computed from Rankine theory are limited to vertical walls (with vertical blackface), and failure is said to occur in the form of a sliding wedge along an assumed failure plane that is a function of the friction angle of the soil. The equations derived from these assumptions are widely used and, propitiously, the results may not differ appreciably from those from other more fundamentally accurate analyses. Results obtained from the Rankine method generally are slightly more conservative, resulting in a small additional safety factor (Liu and Evett 01). 6
17 The Rankine earth pressure model is illustrated in figure 1.4. The general equation for the magnitude of the resultant lateral force, P a, in the active pressure case is given as: where: 1 Pa = ( H zc )( γ H K a 2c K a ) (1.3) 2 K a 2 φ = tan 45 2 (1.4) 2 c zc = (1.5) γ K a The resultant force acts at (H-z c )/3 from the base of the wall. -2c Ka zc H H-zc (H-zc)/3 Pa HKa - 2c Ka Figure 1.4 Rankine earth pressure theory 7
18 Coulomb s theory for lateral earth pressure resulting from a retained mass of cohesionless soil considers that a failure wedge forms behind the wall by sliding along a plane. As the retaining structure moves away from the soil mass, lateral expansion is permitted and results in a relative movement between the wall and soil causing friction to develop on the back face of the wall (McCarthy, 02). And so Coulomb, like Rankine, assumed that the failure surface due to lateral earth pressure would be planar. The key difference in these two methods, however, is that Coulomb took into account friction between the back face of the wall and retained soil. For Coulomb s method, the resultant of this friction and lateral pressure, P A, acts at an angle, δ, measured normal to the back face of the wall. When the failure wedge is satisfactorily retained by the wall, the forces acting on the wedge are in equilibrium. Therefore, when the unit weight, γ t, and friction angle, φ, for a retained soil are known, the force imposed on the wall as a result of the active pressure wedge, P A, can be determined by vector addition, shown in figure 1.5. This force is calculated using the following equation: P ( ) cos φ θ γ H K = γ H (1.6) t A t 2 ( ) ( + ) ( ) 2 sin δ φ sin φ α cos θ cos δ + θ 1 + cos( δ + θ ) cos( θ α ) A = 2 Similarly, the force imposed by the passive earth pressure wedge, P p, can be calculated for the Coulomb case using the following equation: 1 1 P = γ H K = γ H p t p t cos θ ( θ δ) 2 cos cos 1 2 ( φ + θ) ( δ + φ ) ( φ + α) ( θ δ) cos( θ α) sin ' sin ' cos 2 (1.7) 8
19 C θ A Pa θ θ φ` θ D H Pa W φ` F F φ` W θ B Figure 1.5 Coulomb s active pressure trial failure wedge and force polygon The actual active pressure condition for a given wall results from a unique failure wedge that provides the largest numerical value for the force P A. But the above equation is only true for a uniform backfill slope and where the retaining wall is a plane surface. If this is not the case, P A can be determined by trial-and-error analyzing a series of different sized failure wedges (McCarthy 02). When the retained soil mass has both cohesion and friction, the vector addition representing equilibrium forces acting on the failure wedge must include the additional vector of cohesive resistance, cl, acting on the failure plane. Because the Coulomb theory assumes a planar failure, whereas the actual failure surface is typically curved, the lateral force calculated is slightly low. This discrepancy is typically minor, and so the Coulomb procedure for active pressure determination 9
20 provides a practical accuracy. The value of P A computed from the Coulomb method will be slightly larger than that of the Rankine method, but due to the difference in direction that these forces act, the Rankine method typically creates the more severe condition and results in a slightly more conservative value (McCarthy 02) Soil Structure Interaction Approach Given that Rankine and others have provided a convenient method for determining the lateral earth pressure, in any case, the soil mass must translate to achieve the minimum active pressure. If the soil mass does not translate one of two cases develop: either the at-rest pressure dominates or there is no lateral earth pressure on the structure. The soil structure interaction approach (SSI) can take this effect into account. Furthermore, this method allows for the beam behavior of a flexible wall to be included, which is essential to this study. The most common application of the SSI method is for laterally loaded piles. Wang and Reese (1993) popularized the solution of the differential equation governing the response of a pile under lateral load in COM624. The soil in that case was reduced into a set of nonlinear slip springs connected to nodes on the pile, like those shown in figure 1.7. The pile was treated as a bending element. The response curves (p-y curves) represent a combination of active, passive, and shearing stresses on a single pile Finite Element Method The finite element method (FEM) is often used in the analysis of complicated geotechnical problems based on the stress-deformation concept. In addition, it provides a rational method of attacking problems that are not readily solved using classic limiting equilibrium analysis under elastic conditions in infinite half spaces. 10
21 P P u k y Figure Simple p-y relationship Simply stated, the FEM is a way to solve partial differential equations (PDEs) numerically. Extended to civil-structural-geotechnical problems, the PDEs arise from complex elemental shape functions, the determination of strain from stress, and constitutive models that incorporate viscosity, plasticity, and pore fluid dynamics. Taking a step back, a simpler perspective is that the finite element method is nothing more than a complex way of expressing Hooke s Law E σ = ε. A model is developed where either forces or displacements are imposed on boundaries. The resulting displacements and stresses are determined based on the shape functions and constitutive models selected. In the context of the determination of earth pressure on a retaining structure, the stresses are then determined based upon the propagation of stresses within continuum, rotation of planes of primary stress, and deformation/translation of the soil mass. This method allows for the behavior of discrete soil layers to be included while at the same time considering the stress and deformation and their impact on one another. 11
22 1.3 Retaining Structure Design Given the methods for determination of lateral earth pressure, the design of a retaining structure is typically completed using limiting equilibrium concepts. Take for example a gravity retaining wall. The wall is sized to resist overturning and sliding, while the base is safe for bearing and settlement. MSE structures use similar concepts. Sheet pile and solider pile walls are designed using a mixture of limiting equilibrium and soil-structure-interaction. In any case, the driving horizontal earth pressure is typically determined using Rankine s active earth pressure coefficient. 1.4 North Carolina Department of Transportation Retaining Structures According to the 02 NCDOT Roadway Design Manual, the NCDOT allows the use of gravity/semi-gravity, cantilever concrete, mechanically stabilized earth (MSE), prefabricated modular, and pile/panel (can be cantilevered or tieback) wall systems. A sampling of recent wall design projects within the Piedmont are shown in table 1.1. The majority of these are soldier pile or gravity structures. The standard parameters used in the design are also reported. It is worth noting that for the projects, the walls were designed to retain cohesionless soils with the drained friction angles between 30 and 35 degrees. 12
23 Table 1.1 Recent retaining wall projects in the Piedmont Project # County Type γ (pcf) φ' c (psf) B 3119 Buncombe Soldier B 1019 Anson Soldier B 3157 Davidson Soldier B 3406 Durham Fabric B 3446 Davidson Gravity B 3601 Alamance Soldier B 3667 Davie Gravity B 3872 McDowell MSE B 4011 Ashe Soldier B 4043 Burke Gravity B 4095 Davidson Gravity B 4258 Rutherford Soil Nail B 4317 Watauga Gravity B 3340 Haywood Soldier I4025A Yad/Sur Soldier NC112 Buncombe Soil Nail 1 30 R 2107B Montgomery Gravity R 2233AA Rutherford MSE R 2248D Mecklenburg Soldier R 2518A Yancey Soldier R 2710 Watauga Fabric R 3415 Yadkin Soldier R 4758 Jackson Soldier R 3101 Alleghany Soil Nail U 2510A Mecklenburg Gravity U 3401 Randolph MSE/Gravity U 3456 Richmond Soldier U 3601 Buncombe Gravity
24 CHAPTER 2 PROJECT OVERVIEW 2.1 Objectives The main objective of this research program was to develop a model for lateral earth pressure in Piedmont residual soil. In order to develop the model, this program examined both the properties of Piedmont residual soils and the field performance of retaining structures at two research sites. 2.2 Research Methodology & Tasks Since direct measurement of lateral earth pressures by earth pressure cells was ruled out due to construction complications and survivability concerns, instrumented sheet piles were used as moment-cells adapted from the analysis of deep foundations under lateral loading. Measured earth pressure was correlated back to insitu and laboratory determined soil parameters. Figure 2.1 shows a schematic diagram of the walls and the excavation. Excavation Variable Soil profile Figure Conceptualization of the field test walls 14
25 The following outlines the different tasks of the project, and explains the variations between the proposed and actual scope of work where applicable 1. Overview Retaining Structures: A detailed and extensive review of widely accepted works and literature associated with retaining structures will be completed. Commentary: This task was completed unchanged. 2. Collection of Existing Data: The historic records of earth retaining structures implemented in Piedmont residual soils and their performance will be collected and analyzed. The performance of these structures will be examined and correlated with the corresponding soil parameters Commentary: This task was completed unchanged. 3. Site Selection: Working in close partnership with engineers and personnel of the NCDOT Geotechnical Engineering Unit, three suitable test sites located in the Carolina Slate Belt, the Charlotte Belt and the Inner Piedmont will be selected. The selection of these sites will be based on the thickness of residual soils, bedding and joint structure. Commentary: Two sites, one in Statesville in the Carolina Slate Belt and the other in Monroe in the Charlotte Belt were chosen by the NCDOT Geotechnical Engineering Unit in cooperation with UNCC based on availability of funds. 4. Insitu and Laboratory Soil Testing: After the wall sites are selected, a rigorous site investigation program will be completed. NCDOT and UNCC personnel will work to perform standard penetration tests, Iowa Borehole Shear Tests, additional specialized insitu soil tests to determine the engineering properties and geologic 15
26 fabric of the residuum. In addition, the probable penetration depth of the sheet piles will be evaluated. Where possible, undisturbed samples of residual materials will be collected for determination of engineering properties. Commentary: Additional specialized insitu soil tests successfully carried out included Dilatometer (Statesville and Monroe), Cone Penetration Test (Statesville). Specialized tests to determine soil fabric were not available. 5. Preliminary Numerical Simulations: Finite element method models will be developed to predict the earth pressure behind and deflection of the sheet pile walls based on insitu test parameters and geologic information at each site. These models will help fine tune the instrumentation and measurements for each test wall to best match the field conditions. Commentary: Finite element analyses were used to simulate the behavior and response of walls for different excavation depths. The simulations were used to select the sheet pile wall sizes, and assess wall deformation prior to field instrumentation. 6. Prototype Wall Testing: In order to verify the function of field instrumentation, two prototype sheet piles, one strain instrumented and one with the slope inclinometer casing, will be tested in the laboratory. The sheets will be installed with a fixed base and a point load will be applied at the opposite end to induce a moment. The strain gages will be checked and monitored during the loading process. The function of the slope inclinometer will also be verified. A third uninstrumented sheet will be tested in series with the prototype sheets to compare 16
27 the bending stiffness of the instrumented and non instrumented sheet pile sections and the effects of other environmental factors on the measurement system. Commentary: This task was not performed because of delays in project implementation. 7. Full-Scale Instrumented Field Test Walls: The primary task of the research project will be the construction and excavation of the test retaining walls. At each of the selected sites from task 3, a pair of parallel instrumented retaining walls will be constructed, approximately feet apart. Each wall will be to 30 feet in length and will be constructed of sheets driven feet into the ground or refusal. The soil between the two walls will be excavated 10 feet from the original ground surface. Each wall will contain three strain instrumented sheets and two slope instrumented sheets. Prior to and after excavation, slope inclinometer readings will be taken. The strain gages continually will be monitored over the duration of the excavation. After completing the excavation, the sheets will be removed and transported to the next site. Commentary: Apart from installation of the walls and constraints due to subsurface soil conditions, this task was carried out as planned with some changes to ensure for practical constructability of walls and safety. 8. Analysis of Results: Based on the results from task 6 and the research strategy discussed above, lateral earth pressure distribution for each field sheet pile test will be determined. The results obtained for each test site will be compared and correlated to characteristics of the residual soil (thickness, bedding and joint 17
28 structure). A simple displacement and earth pressure relationship based on the joint structure orientation will be proposed. Commentary: This task was completed unchanged. It should be noted that characteristics of the residual soil such as joint structure orientation could not be determined. 9. Model Validation: The models developed in task 7 above will be correlated to the engineering properties of the residuum obtained from both laboratory and insitu tests. A relationship among earth pressure and measurable insitu soil properties will be developed and recommended. Results of the models will also be compared with classical earth pressure theory. Commentary: This task was completed in accordance with the plan. 10. Reporting and Publication: The data from each phase of the study, the results of analysis, and the project findings will be documented in a comprehensive report to the NCDOT. In addition, findings will be presented as publications and presentation to the TRB, STGEC, and Geo 3 T Commentary: This task was completed in accordance with the plan. 2.3 Significance of Work Anecdotally speaking, this project was suggested based on the observation that Piedmont residual soils produce little or no lateral earth pressure. This can be seen in steep natural slopes or temporary cuts in these soils that appear to be stable over long periods of time. Most engineers recognize this and account for some reduction in earth pressure in their designs, however, this effect is almost purely by judgment. 18
29 The objective of this project was to develop a model that predicts earth pressure in Piedmont residual soils for use in the design of typical retaining structures. Classical earth pressure theory as well as numerical modeling using parameters derived from soil tests at both research sites were used to predict earth pressure at these sites. The results of the full scale load tests were used to validated the findings. Based on these findings, the use of a reduced amount of earth pressure for retaining structures in Piedmont soils appears justified. This will impact the type and size of earth retaining structures that are available on a given project. 2.4 Limitations of Research The limitations of this program bear mention. The original two-year duration of the overall project, as well as the finite schedule of the sheet pile wall construction projects, did not allow time to assess the long term changes in lateral earth pressure. Unaccounted aspects of unsaturated soil behavior may have contributed to the behavior observed. The second significant limitation was the number of research sites tested. The proposed research program involved installation of sheet pile walls at three or more sites. However, due to multiple factors, only two research sites were tested. Findings and conclusions herein are limited by these factors. 19
30 CHAPTER 3 REVIEW OF RELEVANT LITERATURE 3.1 Residual Soil Previous studies of residual soils have been performed by researchers in the mid- Atlantic and southeastern United States, as well as the tropics, Europe, and China. The bulk of the published research, in the United States and Europe, falls into one of three groups: investigation at a research farm location by North Carolina State University (1980s), field and laboratory testing at a National Geotechnical Research Site in Alabama by Auburn University and Georgia Institute of Technology (1990s), and recent activity on Portuguese soils attributed to Viana de Fonseca and Cruz (00s) Comprehensive test site studies An extensive investigation of a single Piedmont residual soil test site was documented in a doctoral dissertation by Heartz (1986) and a technical publication by Lambe and Heartz (1988). The work was performed at a research farm near the North Carolina State University campus, in Raleigh, NC. The goal was to characterize the site by measuring compressibility, shear strength, and permeability, with special emphasis on the effects of anisotropy, mica content, stress history, suction, and sample disturbance. The soil at the site was found to be composed primarily of flat kaolinized biotite particles oriented parallel to each other in fairly distinct tilted bands. One-dimensional consolidation tests, drained triaxial tests, and unconfined compression tests along with classification and index testing were performed on Shelby tube and hand trimmed block specimens. The drained triaxial tests were isotropically consolidated, and falling head permeability tests were performed before and after consolidation. Suction was measured
31 on unconfined compression test specimens before loading using a fine porous stone mounted in a triaxial cell. Results revealed suction was well below one atmosphere. Exploration efforts by Wilson (1988) and Harshman (1989) expanded on work by Heartz at the test site. Wang (1995) and Wang and Borden (1996) describe the weathering profile and deformation characteristics of the soils and attempted to evaluate pressuremeter, dilatometer, standard penetration tests, and oedometer tests to predict foundation settlements. The laboratory testing program included oedometer, triaxial stress path and multistage compression, resonant column, and torsional shear tests. From the same site, Gupta (1995) and Borden et al. (1996) developed relationships for residual soil shear modulus, damping ratio, and volume change/densification characteristics based on the influencing parameters of confining pressure, shear strain amplitude, and number of loading cycles. Similar effort was conducted by Vinson and Brown (1997) at a level III National Geotechnical Experimentation Site near Opelika, Alabama at the southern extent of the Piedmont province (Mayne et al. 00). The original work was intended to serve as a reference for soil characteristics for other research at the site and to compare different types of insitu and laboratory measurements of physical properties of the soils at the site. The insitu testing program included standard penetration, piezocone penetration, pressuremeter, cone pressuremeter, dilatometer, borehole shear, cross- hole seismic, seismic cone penetration, and seismic dilatometer tests. The laboratory testing program included undrained triaxial tests, unconsolidated undrained triaxial tests, routine water content, unit weight, grain size analysis, Atterberg limits, and other classification tests. The results provide a basis for comparison of strength and stiffness measurements. 21
32 Analyses of the results of insitu and dynamic laboratory tests on soils from the site are included in Martin and Mayne (1998), Hoyos and Macari (1999), Finke et al. (1999), Finke et al. (01), and Schneider et al. (1999) Other works involving insitu and laboratory testing of residual soils Some of the earliest published work on engineering aspects of residual soils was by Sowers (1954 and 1963). Masters theses at the Georgia Institute of Technology during the same period were published by Miller (1957) who investigated the behavior of a shear vane in Piedmont residual soil and Crowther (1963) who correlated data from cone and standard penetration testing in Piedmont residual soil to the bearing capacity of shallow foundations. In 1982, a conference was held on Engineering and Construction in Tropical and Residual Soils that generated 37 papers (ASCE, 1982). The goal of the conference was to discuss the unique properties of tropical residual soils by emphasizing aspects such as composition and structure. The conference focused on the geotechnical properties, soil investigation and field testing, slope stability, excavation and dewatering, along with construction case histories. In 1985, Brand and Phillipson (1985) published Sampling and Testing of Residual Soils which included current practices from 19 countries around the world. The goal of the book was to detail localized residual soil classifications, insitu and laboratory testing, geotechnical issues, and specialized residual soil problems. One of the main conclusions was that several authors place a larger reliance on insitu tests for residual soils than other soil types, because of sampling and testing problems. The difficulty of sampling reduces the reliability of lab testing and creates a discontinuity in results. 22
33 During the 1990s there was an increase in the use of insitu tests to characterize residual soils. Frank (1990) at the Georgia Institute of Technology revisited the relationship between SPT N and CPT q c values. A conference track at the ASCE annual meeting in Charlotte, North Carolina in October of 1999 resulted in published GSP with 14 papers on residual soils. Of those, Failmezger et al. (1999) took a critical look at the misuse of the standard penetration test for residual soil characterization and the use of alternative insitu tests to characterize residuum. Kelley and Lutenegger (1999) used the standard penetration test with torque and dynamic cone penetrometer to develop relationships for engineering properties. In the current decade, a great deal of literature has been generated concerning insitu testing of Portuguese residual soils. These soils are derived from some of the same ancient rocks as the Piedmont. Viana da Fonseca (01) details a load testing of a shallow foundation in residual soil. Cruz et al. (04a) used dilatometer and cone penetration tests to estimate the effective cohesive intercept, c, in Portuguese residual soils. Cruz et al. (04b) took the same approach and developed it a step further to conclude that residual soils are characterized by a true drained cohesion as well as a multi-level yielding behavior that reflects the breaking down of residual structure under stress. Gomes Correia et al. (04) used insitu tests to obtain geotechnical parameters. They reported that the bonded structure and fabric of residual saprolitic soils from granite have a significant influence on geomechanical behavior. Rodrigues and Lemos (04) performed standard penetration, cone penetration, and cross-hole seismic tests and discovered significant differences between those correlations and the ones established for transported soils with identical grading curves. Viana da Fonseca et al. (04) details the 23
34 investigation of a research site by extensive insitu and laboratory tests and presents correlative results of q c /N and shear modulus (G 0 ). Cruz and Viana da Fonseca (06) used the dilatometer to estimate the at rest earth pressure coefficient (K 0 ), shear strength parameters (c and φ'), and stiffness parameters (G 0, E, and M) Specific Literature on Triaxial Testing in Residual Soils Between 1988 and 06, 13 triaxial shear test studies have been published specifically in residual soils. A summary of these authors, date, location, soil type, and triaxial shear type are presented in Table Load Testing of Retaining Structures Researchers such as Peck (1969) and Clough and O Rourke (1990) have investigated retaining wall pressure and earth movements due to excavations. Other case studies of worldwide experience are also presented by Long (01). In addition, studies seeking to determine lateral earth pressures have been presented by researchers like Fang et al. (1994) who utilized a movable model retaining wall to study passive pressures. The same moveable retaining wall was presented by Fang et al. (1997) to study the effect of sloping backfill on earth pressures. Similarly, Georgiadis and Anagnostopoulos (1998) used a model cantilever sheet pile wall in a tank to study surcharge effects. Both studies dealt with carefully placed sand in a controlled environment. Full scale tests have been rare. A case was discovered where a full scale sheet pile supported excavation was instrumented. Kort (02) presents a study carried out on an anchored sheet pile wall in Rotterdam, Holland. The soils were predominantly weak clay and peat, and the study was concerned with oblique bending and plastic hinging of sheet piles. However, there is extensive documentation of the field instrumentation plan. 24
35 Table Comprehensive summary of published residual soils triaxial testing Author Date Location Soil Type Test Type Numerical Results Gan 1996 Hong Kong Undisturbed completely decomposed granite and fine ash tuff (saprolite) CD Saturated and Unsaturated Remolded: c = 1.45 psi and φ = 35.5 o CDG: c =3.05 psi and φ = 31 o Garga 1988 Brazil Dense Basaltic soil and vesicular basalt CU Peak CU Dense: c = 8.53 psi and φ = 32 o Vesicular: c = 5.26 psi and φ = 23 o Heartz 1986 North Piedmont (Gneiss and CD Carolina Schist bedrock) Lambe and 1988 North Piedmont CD Heartz Carolina Lee and Coop 1995 Korea Decomposed granite (Compacted samples, highly organized) CD Mayne et al. 00 Alabama Piedmont CD; CU Disturbed and Undisturbed Mohamedzein and Mohammed Rahardjo et al. Rahardjo et al. 06 Sudan sandstone and mudstone c = 2.47 psi and φ = 31 o if c =0 psi then φ = 35.3 degrees UU, CIU (Depth < 4m) c = 0 psi and φ = o (Depth > 4m) c = 0 psi and average φ = 42 o 04a Singapore Reconstituted CD φ = 31.5 o 04b Singapore Residual CD Saturated and Unsaturated 06 Portugal Granite (saprolite with CD weak relict structure) 1997 Alabama Piedmont (micaceous CD, CU, UU sandy silt) Igneous and CD Viana da Fonseca et al. Vinson and Brown Wang 1996 North Carolina Wang and Yan Metamorphic rocks 06 Hong Kong 2 Saprolites Weathered volcanic tuff an Weathered Granite Unsaturated CD CU φ = 41.3 o or φ = 36 o c = 0.65 psi and φ = 45.8 o WT: φ = 36.6 o WG: φ = 34.1 o 25

36 CHAPTER 4 SITE LOCATION AND CHARACTERIZATION 4.1 Site Selection and Investigation Plan Selection of the research sites was based on multiple criteria that were not necessarily evident at the outset of the project. Foremost, the sites were to be located in the Piedmont physiographic province. Based on the geology and funding opportunities, research sites were suggested by the NCDOT Geotechnical Unit in the Charlotte Belt/Inner Piedmont near Statesville and the Carolina Slate Belt, outside of Monroe. Figure 4.1 shows the same map from figure 1.2 with the locations of the selected sites. The Statesville site was located in a borrow pit being excavated for the adjacent (project R-2911) US 70 bypass project. The Monroe site was part of the right of way being purchased for the US 601 widening, (project R-2616). Other sites that had been initially considered but were ruled out for various reasons included the Shelby Bypass, Monroe Bypass, and another near Winston-Salem Figure North Carolina Geologic Map with counties, DOT divisions, and test site locations superimposed 26
37 To verify the existence of residual soils with sufficient thickness for wall testing, several Standard Penetration Test (SPT) borings were conducted at targeted locations within the test sites. Using the information from these borings, the sites were chosen and the location for each wall construction was established. In order to pinpoint the stratigraphy, a second round of SPT was completed at the approximate location of measuring elements of the test walls. These borings were extended forty feet below the ground surface. Further insitu tests included Marchetti Dilatometer (DMT) to determine soil properties including lateral stiffness and earth pressure coefficients as well as Iowa Borehole Shear Tests (BST) to determine insitu strength. Cone Penetration Tests (CPT) and K 0 Stepped Blade (K 0 SBT) were conducted only at the Statesville Site with the latter being ineffective. Shelby tube specimens that were collected in the preparation of boreholes for the BST were sent to the Materials and Tests Unit for consolidated undrained triaxial and consolidation testing. The same soils were classified and their specific gravities were determined. The full complement of data is included in Appendices A and B for Statesville and Monroe, respectively. 4.2 Statesville Insitu Tests The first test site was near Statesville inside a contractor controlled borrow pit being excavated for use as fill for the US 70 Bypass. Three initial boring locations indicated thick horizons of Piedmont Residual soil ideal for installation of sheet piles for the project. Any of the tested locations would have been suitable for wall installation. Targeted site exploration began just after the contractor began site clearing operations. Due to the anticipated use of the site, the contractor dictated that only a small 27
38 portion of the borrow pit was available for the research project, and thus the location was constrained near the northwest corner of the property. The approximate location for the test walls was laid out and the second phase SPT was conducted. The boring locations overlain on the walls that were eventually constructed are shown in Figure 4.2. DMT-2 DMT-5 DMT-4 SPT-3 CPT-4 SPT-1 KoSBT-1 CPT-1 BST-2 NW-I NW-S SW-I SW-S CPT-3 SPT-2 DMT-1 NORTH BST-1 NE-I CPT-2 NE-S SPT-4 BST-3 SE-I DMT-3 SE-S Figure Location of in-situ soil tests with respect to wall placement Four SPT showed a profile consisting of tan and red clayey silt. Uncorrected blowcounts ranged from 5 to 15 with an average around 8. The raw and corrected numerical results of the SPT are show in Table 4.1. Two Marchetti Dilatometer (DMT) soundings were completed to determine strength and compressibility parameters. Three additional DMT soundings, including thrust measurements that were not available during 28
39 the initial tests, were conducted after the wall load tests. All of the soundings were consistent as seen in Figure 4.3. Borehole shear tests (BST) were performed at several depths in three boreholes. Key to the performance of the BST was the creation of a test pocket using a Shelby tube. Of the twelve potential BST locations, eight were successful. Results of these tests show generally friction angle of o and cohesion intercept averaging 250 psf. The results are shown graphically and numerically in figure 4.4 and table 4.2, respectively. Additional tests, only conducted at the Statesville site were the Cone Penetration Test (CPT) and the K 0 Stepped Blade Test (K 0 SBT). S&ME Inc. performed four CPT soundings with their truck mounted ton rig, the results of which are shown in figure 4.5. The CPT showed a consistent tip resistance value of tsf and sleeve friction between 2 and 5 tsf. Only one K 0 SBT test was attempted. Multiple pressure cells were damaged during penetration, therefore test was abandoned and not considered further. Depth (ft) Table SPT results (Statesville) SPT-1 SPT-2 SPT-3 SPT-4 N N 60 Depth (ft) N N 60 Depth (ft) N N 60 Depth (ft) N N
40 0 Thrust q D (lb) P 0 (psi) P 1 (psi) KD (psi) ID (psi) ED (psi) Depth (ft) DMT DMT-2 DMT-3 DMT-4 DMT Figure Summary of DMT results (Statesville)
41 Shear Strength Envelope.00 5ft Depth Shear Stress at Failure (psi) ft Depth 15ft Depth Normal Stress (psi).00 Shear Strength Envelope 5ft Depth Shear Stress at Failure (psi) ft Depth 14.5ft Depth Normal Stress (psi).00 Shear Strength Envelope 14.5ft Depth Shear Stress at Failure (psi) ft Depth Normal Stress (psi) Figure 4.4 Summary of Statesville BST results 31
42 Table BST Measured φ and c (Statesville) Depth φ c Test (ft) (deg) (psf) BST # BST # BST # BST # BST # BST # BST # BST # Laboratory Tests The specimens tested were from depths between 5 and 21 feet below ground level, and all were collected in preparation of pockets for the BST. Classification tests were performed on nineteen samples using Atterberg limits, sieve, and hydrometer analysis. The specific gravity was determined as well. Six one dimensional consolidation tests were conducted to determine compressibility parameters. Nineteen triaxial tests, representing seven test locations, were completed for the Statesville Site. All but three of these specimens were saturated and tested in the consolidated-undrained (CU) condition. The others, from a shallow depth, above the water table, were not saturated and tested consolidated drained (CD) condition to ascertain the impact of unsaturated behavior. The index tests, summarized in table 4.3, showed that the vast majority of the soils were A-7. Consolidation tests suggest that the soils were all highly overconsolidated, especially at shallow depths. Triaxial tests reported effective friction angles between 25 o and 35 o with cohesion ranging between 0 and 400 psf. Modulus, E 50, values ranged from 0 to 3000 psi, for the confining pressures between 5 and 35 psi. Tables 4.4 and 4.5 show the consolidation and triaxial test results, respectively. 32
43 0 Sleeve Stress f s (tsf) Tip Stress Friction Ratio q c (tsf) (%) u (tsf) Depth (ft) 25 CPT-1 CPT-2 CPT-3 CPT
44 Figure 4.5 Summary of CPT results (Statesville) Table Summary of index properties and classification testing (Statesville) Borehole No. Sample No. Sample Depth Specimen No. Grain-Size Analysis Minus #10 Fraction #4 #10 #40 #0 #60 #270 Silt Clay Liquid Limit, LL Atterberg Limits Plastic Limit, PL Plasticity Index, PI AASHTO Specific Gravity, G s [ - ] [ - ] [ft] [ - ] [% passing] [%] [%] [%] [ - ] [ - ] NP NP A-2-5(0) ST A-7-5(5) BST-1 ST A-7-5(11) ST A-7-5(9) ST A-7-5(31) BST-2 ST A-7-5(30) A-7-5(12) A-5(6) BST-3 ST-3 ST A-7-5(7) A-5(2) A-5(4) A-7-5(6) A-7-5(5) 3
45 Table Summary of consolidation testing (Statesville) Borehole No. Sample No. Depth AASHTO Compression Index, c c Recompression Index, c r Preconsolidation Pressure, P c Overconsolidation Ratio, OCR [ - ] [ - ] [ft.] [ - ] [ - ] [ - ] [psf] [ - ] BST-1 BST-2 BST-3 ST-1 ST-3 ST-2 ST-3 ST-3 ST A-2-5(0) , A-7-5(9) , A-7-5(31) A-7-5(30) , , A-7-5(7) , A-7-5(6) , Table Summary of triaxial shear testing (Statesville) Location Depth c φ' E 50 Type Saturated (ft) (psf) (deg) (psi) BST-1 6 CD No , 1791, 926 BST CU Yes , 2256, 2596 BST-1.3 CU Yes , 3346 BST-2 10 CU Yes , 673 BST-2 15 CU Yes , 1477, 2459 BST-3 15 CU Yes , 1765, 2361 BST-3 CU Yes , 1861,
46 4.3 Monroe Insitu Tests The second research site was chosen using a different set of criteria from Statesville. The selection of the Monroe site was done primarily to be in line with the future US601 widening project. Within that project, two locations of highest elevation along the alignment were identified as potential test sites. One was a small field and the other was a residence, both of which would be part of the right-of-way to be acquired in the widening project. Based upon the initial SPT borings, both sites were potential test locations. However, due to delays in the US601 project, right-of-way would not be purchased in time, therefore, the southerly of the two potential sites was chosen and the small amount of right-of-way was pre-purchased for use on the project. Beginning in June of 06, in depth insitu testing and soil sampling program was carried out at the Monroe site. As before, the location of the test walls was established before testing. Figure 4.6 shows the locations of the insitu tests with respect to the final walls installed. Four SPT, depicted in table 4.6, were conducted down to 40 feet with SPT1 refusing at around 28.5 feet. The soil type at the Monroe site appeared to be a mixture of red clayey silt with uncorrected blowcounts that ranged between 9 and 19 blows per foot. The soils were markedly stiffer than those found in Statesville and more pockets of quartz were found than previously. Four DMT were performed in proximity to the test walls. In several cases, the DMT pushing was refused, however, the obstruction was easily augered through and the test resumed. The results of the DMT are shown in figure 4.7. Finally, BST at four depths were conducted in two locations. The data in table 4.7 and figure 4.8 includes friction angles near 40 o and cohesion as high 0 psf for the Slate Belt soil. 36
47 Figure 4.6 Monroe soil test locations Table SPT results (Monroe) SPT-1 SPT-2 SPT-3 SPT-4 Depth Depth Depth Depth N N (ft) 60 N N (ft) 60 N N (ft) 60 (ft) N N * *Refusal
48 Thrust q D (lb) P 0 (psi) P 1 (psi) KD (psi) ID (psi) ED (psi) Depth (ft) DMT-1 25 DMT-2 DMT-3 30 DMT Figure Summary of DMT results (Monroe)
49 .00 Shear Strength Envelope Shear Stress at Failure (psi) ft Depth 15ft Depth ft Depth Normal Stress (psi) Shear Strength Envelope Shear Stress at Failure (psi) ft Depth 10ft Depth 15ft Depth ft Depth Normal Stress (psi) Figure Summary of Monroe BST results Table BST calculated φ and c (Monroe) Test Depth φ c (ft) (deg) (psf) BST # BST # BST # BST # BST # BST # BST #
50 4.3.2 Laboratory Tests The specimens tested were from depths between 5 and 21 feet below ground level, and were all collected in preparation of pockets for the BST. Classification tests were performed on nine samples using Atterberg limits, sieve, and hydrometer analysis. The specific gravities were determined as well. Three one dimensional consolidation tests were conducted to determine compressibility parameters. Nineteen triaxial tests, representing seven test locations, were completed for the Monroe Site. All specimens were saturated and tested in the consolidated-undrained (CU) condition. The index tests, summarized in table 4.8, showed that the soils were predominantly A-7. Consolidation tests suggest that the soils were all apparently highly overconsolidated. Triaxial tests reported drained friction angle between 30 and 40 o with cohesion intercepts ranging between 100 and 500 psf. Modulus, E 50, values ranged from 700 to 4000 psi, for confining pressures between 5 and 15 psi. Tables 4.9 and 4.10 show the consolidation and triaxial test results, respectively. 4.4 Summary of Soil Testing It is worth noting that even though both sites were in different sections of the Piedmont, soil parameters determined from both were remarkably similar. The insitu and laboratory tests both showed friction angles and a cohesive component to the strength. Soils at both sites were AASHTO A-7 and appeared highly over consolidated. 40
51 Table Summary of index properties and classification testing (Monroe) Borehole No. Sample No. Sample Depth Specimen No. Grain-Size Analysis Minus #10 Fraction #4 #10 #40 #0 #60 #270 Silt Clay Liquid Limit, LL Atterberg Limits Plastic Limit, PL Plasticity Index, PI AASHTO Specific Gravity, G s [ - ] [ - ] [ft] [ - ] [% passing] [%] [%] [%] [ - ] [ - ] ST A-7-5(16) 2.8 BST-1 ST A-7-6(10) A-7-5(21) 2.77 ST A-5-(10) ST A-7-5(22) 2.83 ST A-7-5(24) 2.84 BST-2 ST A-7-5(19) A-7-5(34) 2.82 ST A-7-5(21) 2.82
52 Table Summary of consolidation testing (Monroe) Borehole No. Sample No. Depth AASHTO Compression Index, c c Recompression Index, c r Preconsolidation Pressure, P c Overconsolidation Ratio, OCR [ - ] [ - ] [ft.] [ - ] [ - ] [ - ] [psf] [ - ] BST-2 ST-1 ST-2 ST-3 A-7-5(16) A-7-5(24) A-7-5(19) Table Triaxial results (Monroe) Location Depth c φ' E 50 Type Saturated (ft) (psf) (deg) (psi) BST CU Yes , 1518, 1945 BST CU Yes , 1683, 1301 BST-1.2 CU Yes , 1559 BST-2 5 CU Yes , 1071, 2604 BST-2 10 CU Yes , 1051, 1505 BST-2 15 CU Yes , 984, 1351 BST-2 CU Yes ,
53 5.1 Preliminary Modeling CHAPTER 5 INSTRUMENTED WALL LOAD TESTS The selection of the wall section and geometry was based upon a preliminary numerical modeling program. Considered were length of wall, spacing between walls, depth of walls, depth of excavation, type of pile, and instrumentation. In order to simulate the plane strain condition, the walls ideally would have been several hundred feet in length, driven to a depth of one hundred feet and excavated at least sixty feet deep. This scenario, of course, was impractical from a financial standpoint, therefore the configuration was optimized by modeling the potential configurations using the finite element program PLAXIS (1998) FEM Initial Conditions Since the optimization was done before the test sites were chosen, average values for soil properties such as cohesion, friction angle, modulus, and unit weight were based on previous work in residual soils in North Carolina by Heartz (1986). Table 5.1 provides a summary of these values. Since there is some question concerning the use of cohesion in the analysis, alternative values of 270 and 0 psf were also considered in these preliminary models. Table Summary of soil properties for modeling Unit Weight 100 pcf φ 24.9 deg c 540 psf Permeability 0.85 ft/day E 1.440E+05 psf ν 0.15 Three sheet piles, PZ27, PZ22, and a lightweight 5-5 arch pile were considered. The PZ27 was the sheet pile most commonly used by NCDOT. The PZ22 sheet pile had 43
54 the same cross sectional area as the PZ27, but wider section resulting in a lower moment of inertia. The lightweight 5-5 arch pile, a flat sheet, was considered as a low cost and high deflection option. Table 5.2 summarizes the structural properties of the sheet piles FEM Modeling Table 5.2 Summary of key pile properties used for modeling PZ27 Moment of Inertia (I) in 4 Cross Sectional Area (A) 7.94 in²/ft Young s Modulus (E) psi Weight per foot of wall (w) 27 lb/ft PZ22 I 84.7 in 4 A 6.46 in²/ft E psi W 22 lb/ft 5-5 I 5.7 in 4 A 3.35 in²/ft E psi W 11.3 lb/ft FEM models were created for pile lengths of ft., 25 ft., 30 ft. 35 ft. and 40 ft. Excavation of the soil behind the sheet piles was simulated by removing 2.5 ft. increments of soil to within 5 ft. of the tip of the pile. Each model was analyzed using the full c = 540 psf, a half c = 270 psf, and a worst case scenario of c = 0. The maximum deflection was compiled for each scenario, The results are shown in Table 5.3. The models showed the PZ22 and PZ27 were similar in behavior, though as expected the PZ22 exhibited greater deflection at the same length and excavation depth. The 5-5 arch sheet pile, a much more flexible pile than the PZ22 and PZ27, was modeled at ft only. The 5-5 pile deflects much more than the PZ22 and PZ27. 44


55 45 Table 5.3- Summary of deflection versus depth
56 5.2 Selected Wall Section The PZ22 appeared to be the best pile to use because it was similar to the PZ27 typically used by DOT and still provided ample measurable deflection. Though an extreme amount of deflection was not desirable, for safety reasons, the larger the safe deflection that could be obtained the better because the measurements are more distinct and easier to interpret. The Arch 5-5 was ruled out because of the large deflections at short pile lengths. Through additional models, the minimum separation between the parallel walls was found to be 30 ft. for PZ22 sheet piles to prevent the overlap of the passive soil wedges inside the excavation. The appropriate length for the walls was determined by engineering judgment and economic considerations. The wall length needed to be sufficient to ensure that the instrumented piles in the center would exhibit plane strain behavior. If the walls were not long enough, the piles at the end of the excavation, that were embedded in the access slopes, would influence the wall sections. Thus, through discussion it was decided that the test sections would be 40 feet. Based on the results of the finite element simulations, 35ft. PZ 22 sheet piles were selected. The minimum separation between the parallel walls was 30 feet. The test walls would be 40 feet long and the soil between the walls would be excavated to ft. When working with the Geotechnical Engineering Unit to develop a plan for the excavation, the issues of safety and access were raised. Therefore, in order to provide a 40 foot test section, the walls would need to be extended further to make provision for safe access for equipment and personnel to perform the excavation. The final plan included the addition of foot wing walls on each end of the test walls to protect slopes angled at 2:1 into the excavation. There would be a total of 132 PZ 22 sheet piles (66 each side). Of the total, 46
57 80 were the full 35 feet long to be used for the test sections and partially for the access ramps. The remaining 52 piles were feet long reflecting the decreasing depth of the access ramps. 5.3 Instrumentation Plan Overview The data acquisition program was comprised of three components, each designed to provide redundant measurements that would allow for earth pressure calculations or estimation. The most involved component was a network of strain gages on four piles intended to give a representation of the strain along the length of the piles. The second component was an inclinometer to determine the deflection and slope of four additional piles. For redundancy, and a general check, points on the wall and within the excavation were surveyed using conventional equipment. The strain monitoring system and inclinometer are described in the following sections Strain Gages and Data Acquisition System Measurement of bending moment was done indirectly through the measurement of strain. Since the piles were steel and likely to remain in the elastic range throughout the test, the bending moment was determined through conversion of strain to curvature (Equation 5.1) then multiplying the curvature by the EI (Equation 5.2). εc εt κ= y where κ is the curvature of the beam/pile, ε C and ε T are compression and tension strains, y is the distance between the gages ( in) (5.1) M=κEI where M is the bending moment (5.2) E is Young s modulus I is the moment of inertia 47

58 Strain was measured using arc weldable vibrating wire (VW) strain gages manufactured by Geokon Inc. like the one shown in figure 5.1. The gages were installed in tension-compression pairs on the flanges of the sheet piles, as shown in figure 5.2, at regular intervals of length. The mounts were welded using a gauging block and blank. After the mounts cooled, the gage was inserted into the mounts and set at the appropriate amount of pre-strain by stretching or compression before locking with set screws. The plucker which causes the wire to vibrate, and measures the frequency, was slipped over the gage and secured with a hose clamp. When all of the gages and pluckers were attached to the pile, the gages were covered with steel angle to protect them from damage during pile driving. The strain was recorded using a pair of Campbell Scientific CR1000 dataloggers. Mount Plucker Gauge Rod Figure Geokon model 4000 strain gage 48
59 T direction of bending Retained soil Excavation C Figure 5.2 Diagram of strain gage attachment Inclinometer In addition to the strain gages, the pile displacements were measured with an inclinometer. Typically, an inclinometer operates by lowering the instrument into a grooved PVC pipe set into soil. In the case of a sheet pile, a square steel tube section was welded directly to the piles to substitute for the inclinometer casing, like the one shown in figure 5.3. The measurement of deflection is made along the diagonal of the tube instead of the oriented casing grooves. This skew was accounted for in the inclinometer reduction software by mathematically rotating the readings such that the output was the deflection along the bending axis of the wall. The primary measurement is along the A axis and the rotated measurement is the X axis. In the field, the A direction was always toward the northwest corner of the steel tube. Therefore to rotate west side measurements to the wall bending axis, the skew angle is 135 o. Similarly east side measurements are rotated -45 o. Figures 5.4 and 5.5 demonstrate this. 49

60 Figure Steel tube welded to a sheet pile as an inclinometer casing A Retained soil 135 o Skew Excavation X Figure Rotation of west side measurements to the axis of wall bending 50
61 A Retained soil Excavation -45 o Skew X Figure Rotation of east side measurements to the axis of wall bending 5.4 Statesville Load Test The test site at Statesville was the first opportunity to put the concept into action. Installation of the sheet piles was done through a purchase order contract between Division 12 Construction/Bridge Maintenance and Burns and Sons Construction Instrumentation System The initial instrumentation plan at the Statesville site included strain gages on four piles and inclinometer tubes on four additional piles. Each side of the excavation had four instrumented piles, 2 for strain and 2 for displacement, near the center of the wall (within the 40 foot test section). Eight strain gages were attached to the non-excavation side of both flanges of the strain instrumented piles at four foot spacing. A total of 64 gages was used 16 per pile. Inclinometer tubes were attached to non excavation side of the outermost flange of the displacement-measurement piles. The wall layout is shown in figure
62 Strain Gage Inclinometer Tube 4 52 Figure 5.6 Instrumentation system for wall
63 5.4.2 Pile Installation Work at the Statesville site started on Monday September 12, 05. While UNCC personnel were installing strain gages, the contractor began work on driving the sheet piles. Initially, the contractor leveled the site to provide a good working platform. Next, string lines were pulled to locate the walls and a jig was set up to get the first panel of piles in position and plumb prior to driving. Initial driving was done using a relatively small vibratory hammer. The panel method of driving three piles as a set was used to help with pile alignment, decrease the chance of pile wander, and insure proper set. However, many piles refused under vibratory driving. An attempt was made to drive many of these piles further with a diesel hammer. The diesel hammer was able to drive some of the piles deeper, however due to the makeshift nature of the pile helmet, and lack of any driving criteria, several pile tops were overstressed and yielded. Near the end of driving, a proper sheet-pile driving helmet was implemented. The new helmet and maintaining a driving criteria of 10 blows per inch, made a significant difference in not over stressing the piles though several of the piles were still not able to be driven completely without damage. Thus, several of the piles were partially driven. However, all of the sheet piles on the original plan were eventually installed. Burns and Sons wrapped pile driving on September 30, 05. Several photos from the construction phase in Statesville are shown in figure 5.7. The heights of the piles above the ground surface is shown in figure 5.8. This is also reflected in the position of the strain gages. The relative positions of the strain gages with respect to the ground surface are shown in figure


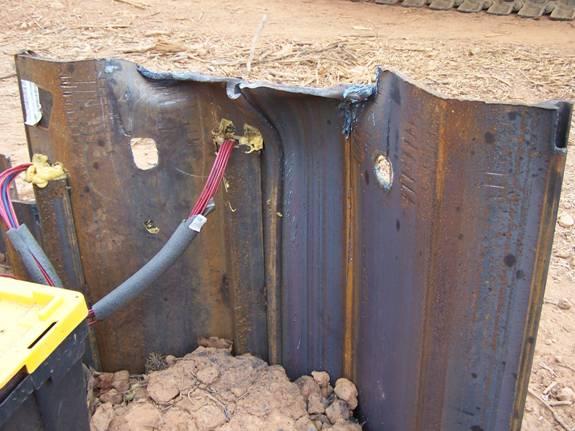

64 54 Figure 5.7 Photographs from wall installa tion in Statesville
65 N end x x x x x x x x x x x 7' 7' 6' 14' 14' 4' 4' 3' 4' 3' 3' 3' 2' 2' 7' 7' 3' x x x x x 3' 3' x x 3' 3' x x x 2' x x x x x wall continues but mostly driven PIT Entrance ---> end x x x x x x x x x x x 9' 8' 7' 7' 6.5' 6.5' 11' 11' 11' 11' x 6.5' 7' 7' 7' 7' 9' 9' x x 6' 6' 6' x 4' 4' 2' 9' 9' 3' 3' 3' 3' x x x x x wall continues but mostly driven 55 = Inclinometer = Vibrating Wire Figure Height of piles above ground (x = fully driven)
66 Pile 1 (NW) ft ft ft ft ft ft Pile 2 (SW) Pile 3 (SE) Pile 4 (NE) Figure Gage diagram of pile elevations and excavation depths 56
67 5.4.3 Excavation After the completion of pile driving, the strain gages were connected to the dataloggers. The dataloggers and excess cabling were secured in weather resistant (traffic signal) boxes. The dataloggers were set to take readings continuously every one minute until the load test was complete. Two sets of baseline inclinometer readings were taken. Notably, heavy rains due to the remnants of Tropical Storm Ophelia delayed the start of excavation by nearly two weeks. The excavation process proceeded as follows: - Monday October 17, 05 ~ Excavation began early morning but stopped at 11:00am after excavating one quarter of the first 4 ft. lift, due to a hydraulic failure. Excavation resumed in the afternoon to bring the total progress on the lift to about 1/3. - Tuesday October 18, 05 ~ First lift (4 ft.) was completed by 11:00am. The second lift started around 2:00pm. - Wednesday October 19, 05 ~ Excavation for the second lift was resumed in the morning and was complete by noon. The third excavation lift was started around 3:00pm. - Thursday October, 05 ~ Third layer (12 ft.) was completed by 3:00pm.. - Friday October 21, 05 ~ Fourth excavation step (16 ft.) began at 7:30am and was completed at 3:00pm. - Wednesday October 26, 05 ~ Excavation of final 4 ft. lift (ft) was started and finished at 2:00pm. - Thursday October 27, 05 ~ ft. lift readings were taken in the morning. 57
68 After the final reading has been taken, an opportunity arose to explore the unsaturated effect in qualitative terms. The contractor working on the site agreed to flood the soil behind the east wall with several thousand gallons of water.. - November 1, 05 ~ All instrumentation removed and walls decommissioned - November 5, 05 ~ Burns and Sons remove sheet piles and transports them to Statesville Maintenance Facility. Figure 5.10 shows highlights of the excavation Challenges and Lessons Learned During the Statesville Test Being this was the first wall installation of a proposed three to four walls, there were several observations made that would be carried forward to future load tests. First, a better effort could be made to ensure the sheet piles are driven to proper depth, especially the instrumented sheets. Only one strain gage and one inclinometer sheet were driven to full depth. One inclinometer sheet pile was driven nine feet short of the required depth. Second, the test wall sheets should be disconnected from those protecting the access ramp. Next, the research team and NCDOT should have better control of the location of the test walls on the site. It was unfortunate that even though it was confirmed with the grading contractor that the area between the west wall and the property line would not be used for hauling, and any existing haul road would be abandoned when testing started, the haul road continued to be used throughout the test. It is difficult to say if the haul road had any impact on the tests. However, data collection and site access were far more challenging. In terms of instrumentation, there should be more strain gages on the measuring piles. Near the depth where soil makes contact with the wall, there should be sufficient 58


69 59 Figure 5.10 Photographs of excavation in Statesville
70 gages to capture the function that defines bending moment with depth. In Statesville, there were strain gages at 8 depths spaced 4 feet apart. This was done, primarily, to provide full depth gages as well as work within the project budget. The gages should have been clustered around the potential depth of soil contact on the wall or used in a tighter configuration. In general, the inclinometer was under-used on the project. There could have been many more inclinometer instrumented piles with little additional cost to the project. Overall, there should have been sufficient provision to try to get the most bang for the buck on the test walls. Since deflections, stresses, and moments were less than expected, addition of a surcharge load behind one or both walls would have given an additional learning opportunity for the test. In addition, truly saturating the backfill to relieve any negative pore pressure would help rule out soil suction as a source of the increased soil strength/decreased earth pressure. 5.5 Monroe Load Test Building on the experience in Statesville, the instrumentation plan was modified for the Monroe test site. In addition, it was proposed to provide a surcharge on one side of the excavation to force an active earth pressure wedge to develop and drill wells through which the retained soil on the other side could be saturated. Unfortunately, insufficient right of way, unavoidable overhead utilities, the location of a drinking water well, and proximity to residences prevented these additional measures. Sheet pile installation was conducted by NCDOT Division 10 Bridge Maintenance personnel Instrumentation System Based upon lessons learned from the Statesville test, the instrumentation plan was amended to maximize the ability to measure earth pressure at the second site. From the
71 previous test four of the sheet piles were already instrumented with strain gages every four feet. To increase the resolution of the data for subsequent tests, additional strain gages were installed between the original gages, such that there would be a strain gage every 2 feet along the pile (Figure 5.11). In order to install the new gages, the protective covers were removed. The new gages were welded on the sheet pile in line with the previous gages at a spacing of two feet on center. Before reinstalling the protective cover, the at-rest strain gage plan, inclinometer tubes were attached to four additional piles to microstrain was set for every gage (new and existing). In addition to the amended bring the total inclinometer piles to eight Pile Installation After the piles were instrumented, NCDOT Division 10 bridge maintenance began driving the sheet piles on Monday October 2, 06. A string line was set to help keep the wall aligned during the driving process. Per recommendation based on experience in Statesville, a larger vibratory hammer, ICE model 22 hydraulic, was utilized to drive the sheet piles. Unlike the previous work in Statesville, pile driving in Monroe proved to be rather difficult due to many factors. The short piles used to protect the access ramps were installed quickly. Starting with the first long piles, driving difficulties began to surface. The most obvious factor is the piles were not new this time. Thus any damage from the work in Statesville, due to driving and extraction, would contribute to difficult driving. Thus, some piles were slightly bent, and had rust and other imperfections in the sockets. The balls and sockets of the sheet piles were lubricated to minimize friction in the joints, and help the piles drive easier. Geologically, thin layers of quartz that were found during the borings may have hindered driving in some locations.
72 S train Gage Inclinom eter Tube 2 62 Figure 5.11 Amended strain gage plan for Monroe test site
73 Thus, the ends of many piles were cut on an angle to resemble a pile point. Likely the biggest factors proved to be the lack of the panel method of driving and inexperience of the crew with sheet piling. The Division 10 t eam preferred using the set and drive method whereby each sheet is continuously driven to its full length without stopping. This does not provide the confinement necessary to keep the piles in line during driving. Although the remedial measures improved the pile driving, the process was still very slow, and it became very difficult to keep the piles plumb. In several instances, the top of the pile would break off in the jaws of the hammer while driving, and the pile would have to be cut off in order to continue driving Construction Stop and Re-evaluation After several working days attempting to drive sheet piles, the effort was stopped on October 18, 06 in order to regroup and determine if continuation work in Monroe was feasible. During a meeting with the Division Engineer on October 19, 06, the consensus was to make every attempt to drive the piles at the research site. To that end, additional auger borings were completed on October 26 and 27, 06 within the wall alignment to determine the location of rock that might hinder driving. In addition, a diesel hammer was borrowed from Division 9 bridge maintenance. Rock was found in the south western portion of the wall footprint, however the alignment of test sheets could be amended such that its impact could be minimized. Knowing that rock was not the limiting factor, pile installation was restarted on Monday October 30, 06. Still, the driving difficulties persisted. Driving operations were suspended on Wednesday November 29, 06 for budgetary reasons and complaints from 63
74 residents living near the site. Figure 5.13 shows photographs of the wall construction in Monroe. The resulting test walls were far shorter that those in Statesville. Figure 5.14 shows the 26 short piles and 36 long piles that were eventually driven. Most of the long piles were damaged during installation. The NW inclinometer casing broke loose from the sheet pile and twisted rendering the data unusable. During installation of the NW strain gage pile, the protective cover vibrated loose damaging many wires in the process. The final piles were driven without supervision by UNCC and without any attempt to plumb them with a template resulting in several measuring piles being out of plumb and alignment. The stickup heights of the sheet piles installed is shown in figure 5.15, and the relative locations of the strain gages are shown in Excavation Once the piles were driven, the strain gages were connected to the datalogger, and baseline readings were taken. Also, the baseline readings were taken with the inclinometer, and the location of each instrumented pile was surveyed using a total station. All three of these methods were used throughout the excavation sequence to determine the deflection of the wall. With all of the baseline readings taken, the excavation process was started and preceded as follows: - Monday December 11, 06 ~ The excavation began in the early morning, and continued until about noon. There was a slight delay while the operator waited for a truck to haul the material on site. The first lift (4ft) was completed by 4:00pm - Tuesday December 12, 06 ~ The second lift (8ft) was started in the early morning and was completed by 11:00am. The third lift (12ft) was started after lunch, and was completed by 3:30pm. 64


75 65 Figure 5.13 Photographs from wall installation in Monr oe
76 NORTH 13 Short Piles 13 Short Piles unlock NW-I NW-S NE-I NE-S US601 SW-I SW-S SE-S SE-I Figure 5.14 Sheet piles as installed in Monroe N Figure Height of sheet piles above ground level 66
77 Figure Gage diagram of pile elevations and excavation depths 67
78 - Wednesday December 13, 06 ~ Excavation for the fourth lift (16ft) was started in the early morning, and was completed by 1:30pm. The fifth and final lift (ft) was started, but the excavation was halted because one of the dump trucks was damaged in the stockpile area and required towing. - Thursday December 14, 06 ~ The final lift (ft) was continued in the early morning and completed by 12:00pm. Readings were taken after the final lift was completed. After the final readings were taken, an 8ft triangular surcharge was built behind the west wall. Readings were also taken after the surcharge was completed at 3:30pm. - Sunday December 17, 06 ~ The final readings were taken in the afternoon, and the dataloggers were disconnected and walls decommissioned. The excavation process is shown in figure


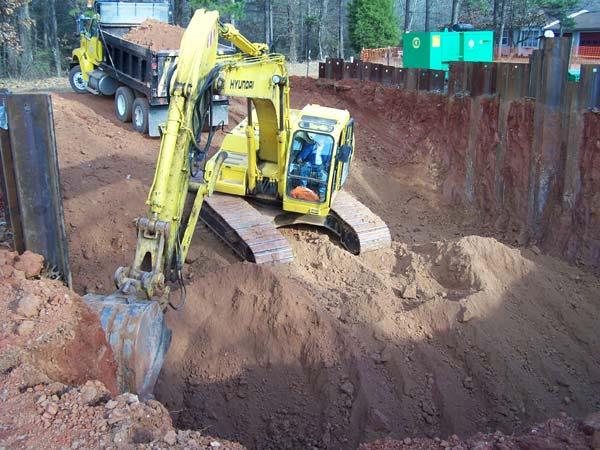


79 Figure 5.17 Photographs of excavation in Monroe 69
80 6.1 Statesville Test Site CHAPTER 6 RESULTS OF FIELD LOAD TEST PROGRAM As detailed in Chapter 5, the sheet piles were instrumented with strain gages and inclinometer tubes. In addition to the numerical data, there were qualitative observations that provided important information about the behavior of the soil Quantitative Results The quantitative results are presented as plots of bending moment and lateral deflection with depth. Figure 6.1 shows the bending moments induced as the excavation was completed. Based on the sign convention shown in figure 5.2, bending into the excavation should be a positive moment. Negative moments would then mean that the wall bent backward into the wall of the excavation. In several cases, the bending moment appeared to be negative. This is likely due to the fact that the residual stresses locked in during driving were released when the soil was excavated, and there was not sufficient earth pressure on the wall to reverse this effect. Deflections shown in figure 6.2 are affected by the pile stick-up height. The SE inclinometer pile was grossly underdriven and the deflections were magnified. The fully driven piles on the west side of the excavation showed displacements that were less than one inch Field Observations Two important observations were made during the course of the load test. First, the sheet piles, were disconnecting from the soil mass. This was visible and could also be deduced in the strain gage data. Figure 6.3 is a magnified view of the disconnection. 70
81 Moment (lb*ft) Moment (lb*ft) NW - S NE -S Depth (ft) Depth (ft) Moment (lb*ft) SW - S Moment (lb*ft) SE - S Depth (ft) Depth (ft) Post Driving 4ft Excavation 18-Oct 8ft Excavation 19-Oct 12ft Excavation -Oct 16ft Excavation 21-Oct ft Excavation 27-Oct Figure Measured bending moments per pile and excavation step without residual stresses 71
82 Displacement (in) Displacement (in) NW - I -10 NE - I Depth (ft) Depth (ft) Displacement (in) Displacement (in) SW - I -10 SE - I Depth (ft) Depth (ft) ft Excavation 18-Oct 8 ft Excavation 19-Oct 12 ft Excavation -Oct 16 ft Excavation 21-Oct ft Excavation 27-Oct Figure Measured lateral displacements per pile and excavation step. 72


83 As previously mentioned, the Statesville site was inside an active borrow pit for the US 70 bypass project. The contractor planned to excavate 40 feet of material from the site through the course of the construction project. The contractor s excavator can be seen loading a truck in figure 6.4. Note the scale of the truck versus the excavated depth of the haul road. Figure Disconnection of sheet piles from soil mass Figure Vertical excavation of soil onsite 73
84 6.2 Monroe Test Site As before, bending moment and lateral displacement were measured at the Monroe test site. The number of strain gages was roughly doubled in an attempt to increase the resolution of the bending moment distributions. However, the construction challenges experienced in Monroe impacted the results Quantitative Results The quantitative results are presented as plots of bending moment and lateral deflection with depth. The first two plots show the measured bending moment versus depth for two cases. Figure 6.5 shows the bending moments induced as the excavation was completed. The detected bending moments were nearly zero. The negative bending moments again were likely due to the fact that the residual stresses locked in during driving were released as happened in Statesville. Lateral deflections from the slope inclinometer are shown in figure 6.6. Construction difficulties resulted in damage to the sheet piles that more than likely forced them out of horizontal and vertical alignment. As mentioned previously, one of the inclinometer casings was twisted loose from the pile when installed. The most properly driven inclinometer pile was in the north east location. Measured deflections are still likely due only to release from the wall and tilting rather than earth pressure Field Observations During the excavation, the piles were separated from the soil mass, leaving the retained soil standing without support. In order to estimate the depth of separation, the end was removed from a tape measure, and the tape was inserted behind the sheet pile wall in several locations. In every case, the tape measure extended the full excavation depth 74
85 Moment (lb*ft) Moment (lb*ft) NW - S NE -S h (ft) Dept h (ft) Dept Moment (lb*ft) Moment (lb*ft) SW - S SE - S pth (ft) De pth (ft) De Post Driving 4ft Excavation 18-Oct 8ft Excavation 19-Oct 12ft Excavation -Oct 16ft Excavation 21-Oct ft Excavation 27-Oct 8ft Surcharge West Figure Measured bending moments per pile and excavation step without residual stresses 75
86 Displacement (in) Displacement (in) NW - I -10 NE - I Depth (ft) Depth (ft) Displacement (in) Displacement (in) SW - I -10 SE - I Depth (ft) Depth (ft) ft Excavation 11-Dec 8 ft Excavation 12-Dec 12 ft Excavation 12-Dec 16 ft Excavation 12-Dec ft Excavation 14-Dec ft Excavation + Surcharge 14-Dec Figure Measured lateral displacements per pile and excavation step. 76

87 before the soil came in contact with the sheet pile wall. Figure 6.7 shows the separation of the sheet pile wall from the retained soil. The reduced wall configuration resulted in the elimination of one of the access ramps, thus there was a section of the excavation with a near vertical slope. Figure 6.8 shows this steepened slope that illustrates the strength of the soil mass in the field. From the field observations, it was determined that there was no lateral earth pressure acting on the retaining walls. Therefore, the soil mass would have stood by itself unrestrained. Figure Wall separation 77

88 Figure Unsupported soil mass (ft excavation) 78
89 CHAPTER 7 MODEL DEVELOPMENT The strength and compressibility parameters obtained from the in-situ soil tests and lab tests were used to estimate the amount of lateral earth pressure that would occur in the field. Several methods were used to quantify the lateral earth pressure and estimate the deflection of the test wall, including Rankine s earth pressure theory, soil structure interaction, and the finite element method. 7.1 Soil Strength Parameters Since the model would be based upon soil parameters measured in the lab or insitu, a first step was to develop composite profiles for both sites. The borehole shear or triaxial tests produced direct measurements of soil parameters c and φ or c and φ. However, the other insitu tests report intermediate or index parameters that must be correlated to engineering properties. There are a multitude of correlations to the SPT test. For the sake of simplicity, the equation published by Peck et al. (1974) was used to determine the friction angle from the N 60 value. A correlation published by Sowers (1979) was used to calculate s u from N 60 as an indicator of c. Young s modulus was determined from an equation in the Soil Properties Manual by Kulhawy and Mayne (1990). Similarly, constrained modulus, friction angle, undrained shear strength were correlated from the dilatometer soundings based upon work by Marchetti (1980, 1997). And finally, for the CPT tests in Statesville, Robertson and Campanella (1983) was employed to determine friction angle from q c, and Baladi et al. (1981) was used to find Young s Modulus. In order to develop composite useful profiles, the soil parameters, measured and correlated, were averaged at 5 feet depth intervals. Tables 7.1 and 7.2 summarize the soil properties for Statesville and Monroe, respectively. 79
90 Table Summary of average soil properties for the States ville research site SPT CPT DMT BST TX L Dept h N N 60 φ s u E q c φ s u E q D M φ s u E φ c φ' c E Depth o (ft) ( bl./ft) (bl./ft) ( o ) (ps f) (psi) (tsf) ( o ) (ps f) (p si) ( ts f) (p si) ( o ) (psf) (psi) ( o ) (ps f) ( ) (psf) (p si) (ft) GS=0 GS= G WT = 18 (ft.) below the G S (G round Surface)
91 Table Summary of average soil properties for the Monroe research site SPT DM T BST TXL Depth N N 60 φ su E qd M φ s u E φ c φ' c E Depth (ft) ( bl./ft) ( bl./ ft) ( o ) (psf) (psi) (tsf) ( ps i ) ( o ) (psf) (psi) ( o ) ( p sf) ( o ) ( ps f) (psi) (ft) GS=0 GS= GWT not present
92 7.2 Numerical Earth Pressure Models The starting point for the development of an earth pressure model was numerical simulation. Two cases were considered: 1) a typical assumption of φ' = 30 and c = 0 psf that is often used in geotechnical design in North Carolina, and 2) φ' = 28 and c = 250 psf representing lower bound values from triaxial te sts at the research sites. Numerical predictions were made using both SSI and FEM to show the bending moment and deflection of a 34 feet embedded PZ22 sheet pile wall with 4, 8, 12, and 16 feet excavation stages (the feet excavation m odel as unstable whe n φ ' = 30 and c = 0, and therefore was not used subsequently). Figures 7.1 and 7.2 present the results of the simulations. From figure 7.1, the maximum bending moment on the sheet piles when φ' = 30 and c = 0 psf ranges between 40,000 and 50,000 lb*ft with a maximum deflection on the order of 10 inches. In contrast, the maximum bending moment show n in figure 7.2 fo r φ ' = 28 and c = 250 psf is lb*ft with pile top deflecti on rang ing between 0. 5 and 1.5 inches. The measured bending moments and lateral displacements at an excavation depth of 16 feet for both Statesville and Monroe superimposed over the expected results from the two scenarios are shown in figure 7.3. Coupled with th e qualitati ve obse rvations from the load tests presented in Chapter 6, the measured response supports the behavior similar to that of soil with φ' = 28 and c = 250 psf, or be tter. T his follows logically from the soil test results summarized in Tables 7.1 and 7.2. The residual soils at the research sites have fiction angle that, on average, is greater than 30 o and cohesion intercept of at least 250 psf. 7.3 Earth Pressure Model Development Rather than set out to develop a new earth pressure model using the results generated from the load tests, a more effective approach w as to consider classical models using 82
93 Moment (lb*ft) SSI -5 Moment (lb*ft) FEM Depth (ft) h (ft) Dept Lateral Deflection (in) Lateral Deflection (in) SSI FEM Dep th (ft)10 15 (ft) Depth ft 8f 12ft 16ft 35 Figure Numerical prediction of bending moment and deflection for φ = 30 and c = 0 83
94 Moment (lb*ft) SSI -5 Moment (lb*ft) FEM Depth (ft) Depth (ft) Lateral Deflection (in) SSI -5 Lateral Deflection (in) FEM Depth (ft) Depth (ft) ft 8f 12ft 16ft 35 Figure Numerical prediction of bending moment and deflection for φ = 28 and c = 250 psf 84
95 Moment (lb*ft) Lateral Deflection (in) Depth (ft) Depth (ft) Statesville Field Monroe Field FEM f φ= 30 c' = 0 FEM f φ= 28 c' = 250 Figure Numerical prediction of bending moment and deflection at 16 foot excavation with field data superimposed. parameters appropriate for the soils encountered at the sites. Rankine coefficients are often used in the determination of active earth pressure for many types of retaining structures. Furthermore, in the simplest cases, Coulomb s theory reduces to the same equations as Rankine. Therefore, Rankine s equation became the basis for the model. First, using the φ and c profiles from the triaxial and BST, the Rankine earth pressure distribution is determined for a cut feet deep at both Statesville and Monroe and is plotted in figure 7.4. These earth pressure distributions clearly show the impact of including c in the analysis. The Rankine earth pressure distributions where φ = 30 and c = 0; and φ = 28 and c = 250 were then superimposed on top of those in figure 7.4 to obtain figure 7.5. Table 7.3 shows the same results in terms of the ne t earth pressure force. The resulting earth 85
96 Earth Pressu re (psf) Earth Pr essure (psf) Earth Pressure (psf) Earth Pressure (psf) Depth (ft) 10 Depth (ft) 10 Depth (ft) 10 Depth (ft) (a) ( b) (c) (d) Figur e 7.4 Rankine earth pressure distributions based on triaxial and BST parameters for Statesville (a and b) and Monroe (c and d)
97 Earth Pressure (psf) Earth Pressure (psf) Earth Pressure (psf) Earth Pressure (psf) Triaxial Based phi = 28 c' = 250 phi = 30 c' = BST Based phi = 28 c' = 250 phi = 30 c' = Triaxial Based phi = 28 c' = 250 phi = 30 c' = BST Based phi = 28 c' = 250 phi = 30 c' = Depth (ft) 10 Depth (ft) 10 Depth (ft) 10 Depth (ft) (a) (b) (c) (d) Figure 7.5 Rankine earth pressure distributions based on triaxial and BST parameters for Statesville (a and b) and Monroe (c and d) o o with superimposed predictions of distributions for cases of φ = 30, c = 0 and φ = 28, c = 250 psf distributions overlain
98 Table 7.3 Net earth pressure forces for cases shown in figures 7.4 and 7.5. Description Force (lbs/ft) Statesville Triaxial 2459 BST 3380 Monroe Triaxial 93 BST 2904 Typical φ = 30, c = 0 psf 7333 φ = 28, c = 250 psf 3075 pressure forces for the 2-parameter Triaxial and BST based distributions fall within the range of 2100 to 3400 lbs/ft with an average of 2800 lbs/ft. In contrast, th e φ = 30, c = 0 psf resultant is nearly twice that value. Based on this comparison, it is proposed that the parameters from the triaxial and/or BST be used in the Rankine earth pressure equations for computing earth pressure in residual soils. In the context of the load test results where little or no true earth pressure was mobilized, these distributions would still represent a level of conservatism while at the same time provide substantial savings to NCDOT. 7.4 Impact on Numerical Models Using the proposed simple model, the bending moments and maximum deflections are recomputed at an excavation depth of 16 feet for the State sville and Monroe sites. Figures 7.7 and 7.8 show the resulting distributions of ben ding m oment and deflection from both the SSI and FEM models using triaxial and borehole shear test parameters, respectively. The bending moments and deflections are far b elow those obtained in figure Impact on Retaining Structure Design NCDOT routinely constructs gravity, pile panel, and mechanically stabi lized 88
99 Moment (lb*ft) SSI -5 Moment (lb*ft) FEM Depth (ft) ft) Depth ( Lateral Deflection (in) SSI -5 Lateral Deflection (in) FEM ft) Depth ( h (ft) Dept Statesville Monroe phi =30 c' = 0 Figure 7.7 Numerical prediction of bending moment and deflection using triaxial parameters. 89
100 Moment (lb*ft) SSI -5 Moment (lb*ft) FEM Depth (ft) Depth (ft) Lateral Deflection (in) SSI -5 Lateral Deflection (in) FEM Depth (ft) Depth (ft) Statesville Monroe phi =30 c' = 0 Figure 7.8 Numerical prediction of bending moment and deflection using BST parameters 90
101 walls in Piedmont residual soils. To demonstrate the impacts of the proposed models on wall design, it is convenient and simpler to focus on gravity walls. As simple case study of a gravity wall designed and built in the Piedmont to resist sliding and overturning can best illustrate the significant change in factors of safety for the parameters used in wall design. Consistent with the modeled cut, a wall of 16 feet designed for cases of c = 0 and φ = 30 ; c = 250 psf and φ = 28 ; c = 0. Starting with a factor of safety (FS) of 1.5 for overturning and sliding for the case in which the soil parameters are c = 0 and φ = 30, the corresponding FS for overturning and sliding are approximately 7.8 and 4.5 respectively for the case of soil parameters of c = 250 psf and φ = 28. Designing to the code prescribed FS will reduce the level of conservatism of the wall and result in substantial cost savings to NCDOT. 7.6 Parameter Selection Key to this method is the selection of soil parameters. As previously stated the triaxial and borehole shear tests provide two parameter measurements of shear strength and therefore would be suitable for use with the two parameter model. Two issues then become important: 1) the number of tests needed to determine the design value for a structure and 2) the development of parameters from the test data. The number of triaxial tests required to determine the representative c and φ values should be based upon the length and height of structure as well as the judgment of the geologist. It is typical practice for NCDOT to perform borings at 50 to 100 foot intervals for the design of retaining structures. These borings extend the depth of the retaining structure including the potential foundation. After the initial borings are comp lete, the geologist/engineer should examine the spoon samples make note of any 91
102 particular changes in the character of the residual soil i.e. significant parent material changes, marked differences in particle distribution, or other geological anomalies. It would make the most sense then to prescribe the number of tests based upon a criteria that includes the height and length of the wall and also reflects the judgment of the geologist/engineer. It is therefore recommended that a three point triaxial test should be performed for every 1000 square feet of wall face, with minimum of two tests for any structure. Additional tests may be recommended by the geologist/engineer based upon significant changes in stratigraphy. Additional specifications on performing triaxial tests on residual specimens are included as Appendix E. The BST provides an insitu measure of φ and c as well. However, questions regarding drainage and whether there are unsaturated effects are difficult to answer, thus the parameters may or may not represent effective conditions. The parameters, on average compare well with the triaxial tests having slightly higher friction angles and lower c. While the triaxial test appears to be the standard, the BST may be recommended to complement the triaxial tests, or in exceptional cases, substitute for it. Being that the tests represent discrete points within the soil mass, the SPT blowcounts, along with the descriptive information included in the boring logs, should be used to verify that the individual tests are representative. When interpreting the results of the tests, the strength should be determined based upon application of the Mohr Coulomb failure criteria. Historically, the c component has been neglected by arbitrarily drawing the failure envelope through the origin. Use of a tool such as a spreadsheet that automatically determines the angle and intercept of the Mohr-coulomb envelope is suggested. 92
103 CHAPTER 8 CONCLUSION 8.1 Research Summary The objective of this research project was to develop an earth pressure model for retaining structures in Piedmont residual soils. The scope of work included literature review, numerical models, insitu and laboratory soil testing, and full scale load testing of cantilever sheet pile retaining structures. 8.2 Conclusions The following statements are made based upon the results of the research program: 1) The earth pressure currently used in design of retaining structures in Piedmont soils is greater than earth pressure measured during load tests. Field measurements from the instrumented wall load tests demonstrated that the retained soils exerted little or no pressure on the structure. 2) The Piedmont soils that were tested in this research had significant strength. The average friction angle was 28 o and the average drained cohesion intercept was above 300 psf. These values were consistent with those found in the literature for similar soils. 3) Based on the soil test results as well as the minimal earth pressure detected during the load tests, the soil strength parameters, φ and c should be used together in Rankine s earth pressure equation to predict the earth pressure in Piedmont soils. 4) Triaxial tests provided the most consistent measurement of φ and c. The borehole shear tests also measure φ and c but should only be used when triaxial testing is unavailable. 93
104 8.3 Recommendations Section 2.3 listed the limitations of this study. In order to address these, two primary recommendations for future work are put forward. First, it is suggested that a broader database of triaxial tests in Piedmont soils be developed. This data can be generated from historic test records as well as tests performed based on the recommendations of this study. This database will give NCDOT engineers confidence in the parameters, especially c, while at the same time provide a statistical context for the parameters for the development of a standard. Second, the long term behavior of these soils must be examined. The constraints of this study were such that the retaining structures could not remain for a long enough p eriod to evaluate the time-dependency of the φ and c components of the soil. A follow up study using an instrumented retaining structure or cut, that can stand for several years would, at the minimum, help develop trends in the behavior of the materials. Within the study, soils would be tested at the outset of the project, and yearly to determine the changes in parameters, while the wall or cut is continuously monitored for changes in pore air and water pressures, movements or failures. 94
105 9 LIST OF REFERENCES ASCE, (1982). Engineering and construction in tropical and residual soils. Proceedings of the ASCE Geotechnical Engineering Division Specialty Conference, New York, ASCE, 735 pp. ASTM Standard D4767, (04), Standard Test Method for Consolidated Undrained Triaxial Compression Test for Cohesive Soils, ASTM International, West Conshohocken, PA. Baldi, G., Bellotti, R., Ghionna, V., Jamiolkowski, M. and Pasqualini, E., (1981). Cone Resistance of a Dry Medium Sand, Proc.10th International Conference on Soil Mechanics and Foundation Engineering, Stockholm, Vol. 2, pp Bishop, A.W. and Henkel, D.J., (1957). The triaxial test. William Clowes 7 Sons, London. Borden, R. H., Shao, L., and Gupta, A., (1996). Dynamic properties of piedmont residual soils. Journal of Geotechnical Engineering, ASCE, Vol. 122(10), pp Brand, E. W. and Phillipson, H. B., (1985). Sampling and testing of residual soils: a review of international practice. Southeast Asian Geotechnical Society, Scorpion Press, Hong Kong. Clough, G.W., and O Rourke, T.D. (1990). Construction induced movements of insitu walls. Design and Performance of Earth Retaining Structures, GSP No. 25, ASCE, New York, NY, pp Crowther, C. L., (1963). The design, construction, and use of a static penetrometer in micaceous silts of the southern Piedmont region. MS Thesis, Georgia Institute of Technology, Atlanta. Cruz, N., Figueiredo, S. and Viana da Fonseca, A., (04a). Deriving geotechnical parameters of residual soils from granite by interpreting DMT+CPTU tests. Proc., ISC-2 on Geotechnical and Geophysical Site Characterization, Porto Portugal, September 19-22, pp Cruz, N., Viana da Fonseca, A., and Neves, E., (04b). Evaluation of effective cohesive intercept on residual soils by DMT and CPT. Proc., ISC-2 on Geotechnical and Geophysical Site Characterization, Porto Portugal, September 19-22, pp Cruz, N., and Viana da Fonseca, A., (06). Portuguese experience in residual soil characterization by DMT tests, DMT06 The Second International Conference on the Flat Dilatometer, Washington, D.C., 2-5 April,
106 Failmezger, R. A., Rom, D., and Ziegler, S. B., (1999). SPT? - A better approach to site characterization of residual soils using other insitu tests. Behavioral Characteristics of Residual Soils, Geotechnical Special Publication No. 92, ASCE, pp Fang, Y., Chen, T., and Wu, B., (1994). Passive earth pressures with various wall movements. Journal of Geotechnical Engineering, Vol. 1(8), p Fang, Y., Chen, J., and Chen, C., (1997). Earth pressures with sloping backfill. Journal of Geotechnical Engineering, Vol. 123(3), p Finke, K. A., Mayne, P.W., and Klopp, R. A., (1999). Characteristic piezocone response in Piedmont residual soils. Behavioral Characteristics of Residual Soils, Geotechnical Special Publication No. 92, ASCE, pp Finke, K. A., Mayne, P.W., and Klopp, R. A., (01). Piezocone penetration testing in Atlantic Piedmont residuum. Journal of Geotechnical & Geoenvironmental Engineering, Vol. 127(1), pp Frank, A.R. (1990). Development of an automated data acquisition system for an electric cone used for the correlation of the SPT, DMT, and CPT in Piedmont residual soils. MS Thesis, Georgia Institute of Technology, Atlanta. Gan, J. K. M., and Fredlund, D.G. (1996). Shear strength characteristics of two saprolitic soils. Canadian Geotechnical Journal, 33(4), Garga, V. K. (1988). Effect of Sample Size on Shear Strength of Basaltic Residual Soils. Canadian Geotechnical Journal, 25(3), August, Georgiadis, M. and Anagnostopoulos, C., (1998). Lateral pressure on sheet pile walls due to strip load. Journal of Geotechnical & Geoenvironmental Engineering, Vol. 124(1), pp Gomes Correia, A., Viana da Fonseca, A., and Gambin, M., (04). Routine and advanced analysis of mechanical in situ tests. Results on saprolitic soils from granites more or less mixed in Portugal. Proceedings ISC-2 on Geotechnical and Geophysical Site Characterization, Porto Portugal, September 19-22, pp Gupta, A., (1995). Radial strain measurement and its significance in the study of dynamic behavior of Piedmont residual soils. MS Thesis, North Carolina State University, Raleigh. Hansen, J.B. (1961). Earth pressure calculation 2 ed., The Danish Technical Press, Copenhagen, Denmark. nd 96
107 Harshman, D.S., (1989). Settlement predictions in residual soils : an evaluation of deformation modulus and stress distribution from the analysis of two case studies. MS Thesis, North Carolina State University, Raleigh. Heartz, W. T. (1986), Properties of a Piedmont residual soil. PhD Dissertation, North Carolina State University, Raleigh. Hoyos Jr., L. and Macari, E. J., (1999). Influence of insitu factors on dynamic response of Piedmont residual soils. Journal of Geotechnical & Geoenvironmental Engineering, ASCE Vol. 125(4), pp Jaky, J., (1948). Pressure in silos. Proc. 2 nd ICSMFE, Vol. 1 pp Kelly, S. P. and Lutenegger, A.J., (1999). Enhanced site characterization in residual soils using the SPT-T and drive cone tests. Behavioral Characteristics of Residual Soils, Geotechnical Special Publication No. 92, ASCE, pp Kort, D. A. (02). Steel sheet pile walls in soft soil. Delft University Press, Delft, The Netherlands. Lambe, P. C. and Heartz, W. T., (1988). Consolidated drained triaxial testing of Piedmont residual soil. Advanced Triaxial Testing of Soil and Rock, ASTM STP 977: Lee, I. K., and Coop, M. R. (1995). Intrinsic behaviour of a decomposed granite soil. Geotechnique, 45(1), Liu C. and Evett, J. B, (01). Soils and Foundations, Prentice Hall, Upper Saddle River. Long, M. (01). Database for retaining wall and ground movements due to deep excavations. Journal of Geotechnical and Geoenvironmental Engineering, Vol. 127, No. 3, ASCE, March, pp Marchetti, S., (1980). "Insitu tests by flat dilatometer." Journal of the Geotechnical Engineering Division, ASCE, Vol. 106(3), pp Marchetti, S. (1997). "The Flat Dilatometer: Design Applications", Proc. Third International Geotechnical Engineering Conference, Cairo University, Jan., Martin, G.K., and Mayne, P.W. (1998). Seismic flat dilatometer tests in Piedmont residual soils. Geotechnical Site Characterization, Vol. 2, Balkema Rotterdam, Mayne, P.W., Brown, D., Vinson, J., Schneider, J.A., and Finke, K.A. (00). "Site characterization of Piedmont residual soils at the NGES, Opelika, Alabama." National Geotechnical Experimentation Sites, GSP 93, ASCE, Reston,VA,
108 Kulhawy, F. H. and Mayne, P.W., (1990). Manual on Estimating Soil Properties for Foundation Design, EPRI-EL-6800, Electric Power Research Institute, Palo Alto. McCarthy, D. F., (02). Essentials of Soil Mechanics and Foundations: basic geotechnics 6 th ed., Prentice Hall, Upper Saddle River, NJ Miller, E. T., (1957). A study of shear characteristics of the soils of the Piedmont region determined by rotating vanes. MS Thesis, Georgia Institute of Technology, Atlanta. Mohamedzein, Y., and Mohammed H. A. (06). Compressibility and shear strength of a residual soil. Geotechnical and Geological Engineering, 24, Peck, R.B. (1969). Deep excavations and tunneling in soft ground. Proceedings of the 7 th International Conference of Soil Mechanics and Foundation Engineering. Mexico City, pp Peck, R. B., Hanson, W. E., and Thornburn, T. H., (1974). Foundation Engineering, John Wiley and Sons, New York. PLAXIS, (1998). PLAXIS Version 7 Users Guide. Eds. Brinkgreve, R. B. J., and Vermeer, P. A., A.A., Balkema, Rotterdam. Rahardjo, H., Aung, K. K., Leong, E. C., and Rezaur, R. B. (04a). Characteristics of Residual Soils in Singapore as formed by weathering. Engineering Geology, 73, Rahardjo, H., Ong, B. H., and Leong E. C. (04b). Shear strength of a compacted residual soil from consolidated drained and constant water content triaxial tests. Canadian Geotechnical Journal, 41(3), Robertson, P. K. and Campanella, R. G., (1983). Interpretation of Cone Penetration Tests: Parts 1 and 2, Canadian Geotechnical Journal, Vol., pp Rodrigues, C.M.G. and Lemos, L.J.L., (04). SPT, CPT and CH tests results on saprolitic granite soils from Guarda, Portugal. Proceedings ISC-2 on Geotechnical and Geophysical Site Characterization, Porto Portugal, September 19-22, pp Schneider, J. A., Hoyos Jr., L., Mayne, P.W., Macari, E.J. and Rix, G.J., (1999). Field and laboratory measurements of dynamic shear modulus of piedmont residual soils. Behavioral Characteristics of Residual Soils, Geotechnical Special Publication No. 92, ASCE, pp Sowers, G.F., (1954). Soil problems in the southern Piedmont region. Proc., Soil Mech. and Found Div., ASCE, Vol, 80, Separate No. 416, New York. 98
109 Sowers, G.F., (1963). Engineering properties of residual soils derived from igneous and metamorphic rocks. Proc., 2 nd Panamerican Conf. on Soil Mech. and Found. Engrg., Sao Paulo, Brazil. Sowers, G.F., (1979). Introductory Soil Mechanics and Foundations: Geotechnical Engineering, MacMillan, New York. Viana da Fonseca, A., (01). Load tests on residual soil and settlement prediction on shallow foundation. ASCE Journal of Geotechnical and Geoenvironmental Engineering, Vol. 127(10), pp Viana da Fonseca, A., Carvalho, J., Ferreira, C., Costa, E., Tuna, C., and J.A. Santos, (04). Geotechnical characterization of a residual soil profile: the ISC 2 experimental site, FEUP. Proceedings ISC-2 on Geotechnical and Geophysical Site Characterization, Porto Portugal, September 19-22, pp Vinson, J.L and Brown, D.A., (1997). Site characterization of the Spring Villa geotechnical test site and a comparison of strength and stiffness parameters for a Piedmont residual soil. Report No. IR-97-04, Highway Research Center, Harbert Engineering Center, Auburn University, AL, 385 p. Wang, C. E., (1995). Deformation characteristics and elastic settlement of piedmont residual soils. MS Thesis, North Carolina State University, Raleigh. Wang, C. E. and Borden, R.H., (1996). Deformation characteristics of Piedmont residual soils. ASCE Journal of Geotechnical Engineering, Vol. 122(10), pp Wang, S., and Reese, L. C., (1993). Com624P- laterally loaded pile analysis program for the microcomputer version 2.0. USDOT Publication No. FHWA-SA Wang, Y. H., and Yan, W. M. (06). Laboratory studies of two common saprolitic soils in Hong Kong. Journal of Geotechnical and Geoenvironmental Engineering, 132(7), Wilson, B.V., (1988) Evaluation of in-situ testing of residual soils and prediction of settlement. MS Thesis, North Carolina State University, Raleigh. 99
110 APPENDIX A STATESVILLE SOIL TEST DATA (included as separate attachment) 100
111 APPENDIX B MONROE SOIL TEST DATA (included as separate attachment) 101
112 APPENDIX C STRAIN GAGE DATA 102
113 Table C.1 - Strain gage set data - Statesville Pile #1 Tension Compression Gage Frequency (Hz) Microstrain (με) Δ με (set) Gage Frequency (Hz) Microstrain (με) Δ με (set) Pile #2 Tension Compression Gage Frequency (Hz) Microstrain (με) Δ με (set) Gage Frequency (Hz) Microstrain (με) Δ με (set) Pile #3 Compression Tension Gage Frequency (Hz) Microstrain (με) Δ με (set) Gage Frequency (Hz) Microstrain (με) Δ με (set) Pile #4 Compression Tension Gage Frequency (Hz) Microstrain (με) Δ με (set) Gage Frequency (Hz) Microstrain (με) Δ με (set)
114 Table C.2 - Post driving strain readings - Statesville Pile #1 Tension SW Compression Gage Frequency (Hz) Microstrain (με) Δ με Gage Frequency (Hz) Microstrain (με) Δ με Pile #2 Tension SW Compression Gage Frequency (Hz) Microstrain (με) Δ με Gage Frequency (Hz) Microstrain (με) Δ με Pile #3 CompressiSE Tension Gage Frequency (Hz) Microstrain (με) Δ με Gage Frequency (Hz) Microstrain (με) Δ με Pile #4 CompressiNE Tension Gage Frequency (Hz) Microstrain (με) Δ με Gage Frequency (Hz) Microstrain (με) Δ με
115 Table C.3 - Strain after 4 foot excavation - Statesville Pile #1 Tension Compression Gage Frequency (Hz) Microstrain (με) Δ με Gage Frequency (Hz) Microstrain (με) Δ με Pile #2 Tension Compression Gage Frequency (Hz) Microstrain (με) Δ με Gage Frequency (Hz) Microstrain (με) Δ με Pile #3 Compression Tension Gage Frequency (Hz) Microstrain (με) Δ με Gage Frequency (Hz) Microstrain (με) Δ με Pile #4 Compression Tension Gage Frequency (Hz) Microstrain (με) Δ με Gage Frequency (Hz) Microstrain (με) Δ με
116 Table C.4 - Strain after 8 foot excavation - Statesville Pile #1 Tension Compression Gage Frequency (Hz) Microstrain (με) Δ με Gage Frequency (Hz) Microstrain (με) Δ με Pile #2 Tension Compression Gage Frequency (Hz) Microstrain (με) Δ με Gage Frequency (Hz) Microstrain (με) Δ με Pile #3 Compression Tension Gage Frequency (Hz) Microstrain (με) Δ με Gage Frequency (Hz) Microstrain (με) Δ με Pile #4 Compression Tension Gage Frequency (Hz) Microstrain (με) Δ με Gage Frequency (Hz) Microstrain (με) Δ με
117 Table C.5 - Strain after 12 foot excavation - Statesville Pile #1 Tension Compression Gage Frequency (Hz) Microstrain (με) Δ με Gage Frequency (Hz) Microstrain (με) Δ με Pile #2 Tension Compression Gage Frequency (Hz) Microstrain (με) Δ με Gage Frequency (Hz) Microstrain (με) Δ με Pile #3 Compression Tension Gage Frequency (Hz) Microstrain (με) Δ με Gage Frequency (Hz) Microstrain (με) Δ με Pile #4 Compression Tension Gage Frequency (Hz) Microstrain (με) Δ με Gage Frequency (Hz) Microstrain (με) Δ με
118 Table C.6 - Strain after 16 foot excavation - Statesville Pile #1 Tension Compression Gage Frequency (Hz) Microstrain (με) Δ με Gage Frequency (Hz) Microstrain (με) Δ με Pile #2 Tension Compression Gage Frequency (Hz) Microstrain (με) Δ με Gage Frequency (Hz) Microstrain (με) Δ με Pile #3 Compression Tension Gage Frequency (Hz) Microstrain (με) Δ με Gage Frequency (Hz) Microstrain (με) Δ με Pile #4 Compression Tension Gage Frequency (Hz) Microstrain (με) Δ με Gage Frequency (Hz) Microstrain (με) Δ με
119 Table C.7 - Strain after foot excavation - Statesville Pile #1 Tension Compression Gage Frequency (Hz) Microstrain (με) Δ με Gage Frequency (Hz) Microstrain (με) Δ με Pile #2 Tension Compression Gage Frequency (Hz) Microstrain (με) Δ με Gage Frequency (Hz) Microstrain (με) Δ με Pile #3 Compression Tension Gage Frequency (Hz) Microstrain (με) Δ με Gage Frequency (Hz) Microstrain (με) Δ με Pile #4 Compression Tension Gage Frequency (Hz) Microstrain (με) Δ με Gage Frequency (Hz) Microstrain (με) Δ με
120 Table C.8 - Strain gage set data - Monroe Pile #1 (SE) Tension Compression Gage Frequency (Hz) Microstrain (με) Δ με (set) Gage Frequency (Hz) Microstrain (με) Δ με (set) Pile #2 (NE) Tension Compression Gage Frequency (Hz) Microstrain (με) Δ με (set) Gage Frequency (Hz) Microstrain (με) Δ με (set) Pile #3 (SW) Compression Tension Gage Frequency (Hz) Microstrain (με) Δ με (set) Gage Frequency (Hz) Microstrain (με) Δ με (set) Pile #4 (NW) Compression Tension Gage Frequency (Hz) Microstrain (με) Δ με (set) Gage Frequency (Hz) Microstrain (με) Δ με (set)
121 Table C.9 - Post driving strain readings - Monroe Pile #1 (SE) Tension Compression Gage Frequency (Hz) Microstrain (με) Δ με (set) Gage Frequency (Hz) Microstrain (με) Δ με (set) Pile #2 (NE) Tension Compression Gage Frequency (Hz) Microstrain (με) Δ με (set) Gage Frequency (Hz) Microstrain (με) Δ με (set) Pile #3 (SW) Compression Tension Gage Frequency (Hz) Microstrain (με) Δ με (set) Gage Frequency (Hz) Microstrain (με) Δ με (set) Pile #4 (NW) Compression Tension Gage Frequency (Hz) Microstrain (με) Δ με (set) Gage Frequency (Hz) Microstrain (με) Δ με (set)
122 T able C.10 - Strain after 4 foot excavation - Monroe Pile #1 (SE) Tension Compression Gage Frequency (Hz) Microstrain (με) Δ με Gage Frequency (Hz) Microstrain (με) Δ με Pile #2 (NE) Tension Compression Gage Frequency (Hz) Microstrain (με) Δ με Gage Frequency (Hz) Microstrain (με) Δ με Pile #3 (SW) Compression Tension Gage Frequency (Hz) Microstrain (με) Δ με Gage Frequency (Hz) Microstrain (με) Δ με Pile #4 (NW) Compression Tension Gage Frequency (Hz) Microstrain (με) Δ με Gage Frequency (Hz) Microstrain (με) Δ με
123 Table C.11 - Strain after 8 foot excavation - Monroe Pile #1 (SE) Tension Compression Gage Frequency (Hz) Microstrain (με) Δ με Gage Frequency (Hz) Microstrain (με) Δ με Pile #2 (NE) Tension Compression Gage Frequency (Hz) Microstrain (με) Δ με Gage Frequency (Hz) Microstrain (με) Δ με Pile #3 (SW) Compression Tension Gage Frequency (Hz) Microstrain (με) Δ με Gage Frequency (Hz) Microstrain (με) Δ με Pile #4 (NW) Compression Tension Gage Frequency (Hz) Microstrain (με) Δ με Gage Frequency (Hz) Microstrain (με) Δ με
124 Table C.12 - Strain after 12 foot excavation - Monroe Pile #1 (SE) Tension Compression Gage Frequency (Hz) Microstrain (με) Δ με Gage Frequency (Hz) Microstrain (με) Δ με Pile #2 (NE) Tension Compression Gage Frequency (Hz) Microstrain (με) Δ με Gage Frequency (Hz) Microstrain (με) Δ με Pile #3 (SW) Compression Tension Gage Frequency (Hz) Microstrain (με) Δ με Gage Frequency (Hz) Microstrain (με) Δ με Pile #4 (NW) Compression Tension Gage Frequency (Hz) Microstrain (με) Δ με Gage Frequency (Hz) Microstrain (με) Δ με
125 Table C.13 - Strain after 16 foot excavation - Monroe Pile #1 (SE) Tension Compression Gage Frequency (Hz) Microstrain (με) Δ με Gage Frequency (Hz) Microstrain (με) Δ με Pile #2 (NE) Tension Compression Gage Frequency (Hz) Microstrain (με) Δ με Gage Frequency (Hz) Microstrain (με) Δ με Pile #3 (SW) Compression Tension Gage Frequency (Hz) Microstrain (με) Δ με Gage Frequency (Hz) Microstrain (με) Δ με Pile #4 (NW) Compression Tension Gage Frequency (Hz) Microstrain (με) Δ με Gage Frequency (Hz) Microstrain (με) Δ με
126 Table C.14 - Strain after foot excavation - Monroe Pile #1 (SE) Tension Compression Gage Frequency (Hz) Microstrain (με) Δ με Gage Frequency (Hz) Microstrain (με) Δ με Pile #2 (NE) Tension Compression Gage Frequency (Hz) Microstrain (με) Δ με Gage Frequency (Hz) Microstrain (με) Δ με Pile #3 (SW) Compression Tension Gage Frequency (Hz) Microstrain (με) Δ με Gage Frequency (Hz) Microstrain (με) Δ με Pile #4 (NW) Compression Tension Gage Frequency (Hz) Microstrain (με) Δ με Gage Frequency (Hz) Microstrain (με) Δ με
127 Table C Strain after foot excavation and 8 foot surcharge - Monroe Pile #1 (SE) Tension Compression Gage Frequency (Hz) Microstrain (με) Δ με Gage Frequency (Hz) Microstrain (με) Δ με Pile #2 (NE) Tension Compression Gage Frequency (Hz) Microstrain (με) Δ με Gage Frequency (Hz) Microstrain (με) Δ με Pile #3 (SW) Compression Tension Gage Frequency (Hz) Microstrain (με) Δ με Gage Frequency (Hz) Microstrain (με) Δ με Pile #4 (NW) Compression Tension Gage Frequency (Hz) Microstrain (με) Δ με Gage Frequency (Hz) Microstrain (με) Δ με
128 APPENDIX D INCLINOMETER DATA 118
129 Table D. 1 - NW inclinometer Statesville Plot Coordinates for Inclinometer NW Relative to initial reading on 6 Oct05 at 16 UNC Charlotte - J. Brian Anderson, Ph.D., P.E. Printed at 18:02:53 skew = 135deg Oct Oct-05 Oct Oct Oct Oct-05 Depth Cum X Cum Y Cum X Cum Y Cum X Cum Y Cum X Cum Y Cum X Cum Y Cum X Cum Y
130 Table D. 2 - SW inclinometer Statesville Plot Coordinates for Inclinometer SW Relative to initial reading on 4 Oct05 at 1443 UNC Charlotte - J. Brian Anderson, Ph.D., P.E. Printed at 18:19:29 skew = 135deg 1 10/18/05 10/18/05 10/19/05 10/19/05 10//05 10//05 10/21/05 10/21/05 10/21/05 10/21/05 10/25/05 10/25/05 10/27/05 10/27/05 Depth Cum X Cum Y Cum X Cum Y Cum X Cum Y Cum X Cum Y Cum X Cum Y Cum X Cum Y Cum X Cum Y ----(ft) (in) (in) (in) (in) (in) (in) (in) (in) (in) (in) (in) (in) (in) (in)
131 Table D. 3 - NE inclinometer Statesville Plot Coordinates for Inclinometer NE Relative to initial reading on 4 Oct05 at 1215 UNC Charlotte - J. Brian Anderson, Ph.D., P.E. Printed at 18:11:55 skew = -45deg /18/05 10/18/05 10/19/05 10/19/05 10//05 10//05 10/21/05 10/21/05 10/25/05 10/25/05 10/27/05 10/27/05 Depth Cum X Cum Y Cum X Cum Y Cum X Cum Y Cum X Cum Y Cum X Cum Y Cum X Cum Y ----(ft) (in) (in) (in) (in) (in) (in) (in) (in) (in) (in) (in) (in)
132 Table D. 4 - SE inclinometer Statesville Plot Coordinates for Inclinometer SE Relative to initial reading on 4 Oct05 at 1454 UNC Charlotte - J. Brian Anderson, Ph.D., P.E. Printed at 14:19:33 skew = -45deg /18/05 10/18/05 10/19/05 10/19/05 10//05 10//05 10//05 10//05 10/21/05 10/21/05 10/21/05 10/21/05 10/25/05 10/25/05 10/27/05 10/27/05 Depth Cum X Cum Y Cum X Cum Y Cum X Cum Y Cum X Cum Y Cum X Cum Y Cum X Cum Y Cum X Cum Y Cum X Cum Y ----(ft) (in) (in) (in) (in) (in) (in) (in) (in) (in) (in) (in) (in) (in) (in) (in) (in)
133 J. Brian Anderson, UNC Charlotte Deflection (in) Deflection (in) LEGEND 0 0 Initial 6 Oct Oct Oct05 Oct Oct05 25 Oct Oct Depth (ft) Depth (ft) Cumulative Deflection Direction X skew = 135deg Cumulative Deflection Direction Y Retaining Structures Research, Inclinometer NW UNCC/NCDOT Figure D.1 - NW inclinometer Statesville 123
134 J. Brian Anderson, UNC Charlotte Deflection (in) Deflection (in) LEGEND 0 0 Initial 4 Oct Oct Oct05 Oct Oct Oct05 25 Oct Oct Depth (ft) Depth (ft) Cumulative Deflection Direction X skew = 135deg Cumulative Deflection Direction Y Retinaing Structures Research, Inclinometer SW UNCC/NCDOT Figure D.2 - SW inclinometer Statesville 124
135 J. Brian Anderson, UNC Charlotte Deflection (in) Deflection (in) LEGEND 0 0 Initial 4 Oct Oct Oct05 Oct Oct Oct05 27 Oct Depth (ft) Depth (ft) Cumulative Deflection Direction X skew = -45deg Cumulative Deflection Direction Y Retaining Structures Research, Inclinometer NE UNCC/NCDOT Figure D.3 - NE inclinometer Statesville 125
136 J. Brian Anderson, UNC Charlotte Deflection (in) Deflection (in) LEGEND Initial 4 Oct Oct Oct05 Oct Oct Oct05 21 Oct Oct Oct Depth (ft) Depth (ft) Cumulative Deflection Direction X Ref. Elevation 0 ft skew = -45deg Cumulative Deflection Direction Y Retaining Structures Research, Inclinometer SE UNCC/NCDOT Figure D.4 - SE inclinometer Statesville 126
137 Table D. 5 - NW inclinometer Monroe Plot Coordinates for Inclinometer NW Relative to initial reading on 7 Dec06 at 1421 J. Brian Anderson, UNC Charlotte Printed at 17:01:18 skew = 135deg /11/06 12/11/ 06 12/12/06 12/12/06 12/12/06 12/12/06 12/13/06 12/13/06 12/14/06 12/14/06 12/14/06 12/14/06 12/17/06 12/17/06 Depth Cum X Cum Y Cum X Cum Y Cum X Cum Y Cum X Cum Y Cum X Cum Y Cum X Cum Y Cum X Cum Y ----(ft) (in) (in) (in) (in) (in) (in) (in) (in) (in) (in) (in) (in) (in) (in)
138 Table D. 6- SW inclinometer Monroe Plot Coordinates for Inclinometer SW Relative to initial reading on 7 Dec06 at 1412 J. Brian Anderson, UNC Charlotte Printed at 17:01:42 skew = 135deg /11/06 12/11/06 12/12/06 12/12/06 12/12/06 12/12/06 12/13/06 12/13/06 12/14/06 12/14/06 12/14/06 12/14/06 12/17/06 12/17/06 Depth Cum X Cum Y Cum X Cum Y Cum X Cum Y Cum X Cum Y Cum X Cum Y Cum X Cum Y Cum X Cum Y ----(ft) (in) (in) (in) (in) (in) (in) (in) (in) (in) (in) (in) (in) (in) (in)
139 Table D. 7 - NE inclinometer Monroe Plot Coordinates for Inclinometer NE Relative to initial reading on 7 Dec06 at 1439 J. Brian Anderson, UNC Charlotte Printed at 16:58:30 skew = -45deg /11/06 12/11/06 12/12/06 12/12/06 12/12/06 12/12/06 12/13/06 12/13/06 12/14/06 12/14/06 12/14/06 12/14/06 12/17/06 12/17/06 Depth Cum X Cum Y Cum X Cum Y Cum X Cum Y Cum X Cum Y Cum X Cum Y Cum X Cum Y Cum X Cum Y ----(ft) (in) (in) (in) (in) (in) (in) (in) (in) (in) (in) (in) (in) (in) (in)
140 Table D. 8 - SE inclinometer Monroe Plot Coordinates for Inclinometer SE Relative to initial reading on 7 Dec06 at 1431 J. Brian Anderson, UNC Charlotte Printed at 16:59:47 skew = -45deg /11/06 12/11/06 12/12/06 12/12/06 12/12/06 12/12/06 12/13/06 12/13/06 12/14/06 12/14/06 12/14/06 12/14/06 12/17/06 12/17/06 Depth Cum X Cum Y Cum X Cum Y Cum X Cum Y Cum X Cum Y Cum X Cum Y Cum X Cum Y Cum X Cum Y ----(ft) (in) (in) (in) (in) (in) (in) (in) (in) (in) (in) (in) (in) (in) (in)
141 UNC Charlotte - J. Brian Anderson, Ph.D., P.E. Deflection (in) Deflection (in) LEGEND 0 0 Initial 7 Dec Dec Dec06 12 Dec Dec Dec06 14 Dec Dec Depth (ft) Depth (ft) Cumulative Deflection Direction X skew = 135deg, Inclinometer NW Cumulative Deflection Direction Y Figure D.5 - NW inclinometer Monroe 131
142 UNC Charlotte - J. Brian Anderson, Ph.D., P.E. Deflection (in) Deflection (in) LEGEND 0 0 Initial 7 Dec Dec Dec06 12 Dec Dec Dec06 14 Dec Dec Depth (ft) Depth (ft) Cumulative Deflection Direction X Ref. Elevation ft skew = 135deg, Inclinometer SW Cumulative Deflection Direction Y Figure D.6 - SW inclinometer Monroe 132
143 UNC Charlotte - J. Brian Anderson, Ph.D., P.E. Deflection (in) Deflection (in) LEGEND 0 0 Initial 7 Dec Dec Dec06 12 Dec Dec06 14 Dec Dec Dec Depth (ft) Depth (ft) Cumulative Deflection Direction X Ref. Elevation ft skew = -45deg, Inclinometer NE Cumulative Deflection Direction Y Figure D.7 - NE inclinometer Monroe 133
144 UNC Charlotte - J. Brian Anderson, Ph.D., P.E. Deflection (in) Deflection (in) LEGEND 0 0 Initial 7 Dec Dec Dec Dec Dec06 14 Dec Dec06 17 Dec Depth (ft) Depth (ft) Cumulative Deflection Direction X skew = -45deg, Inclinometer SE Cumulative Deflection Direction Y Figure D.8 - SE inclinometer Monroe 134
145 APPENDIX E RECOMMENDATIONS FOR TRIAXIAL TESTS IN PIEDMONT RESIDUAL SOILS 135
146 Residual soils should be sampled in accordance with AASHTO T7 or ASTM D1587 specifications. Unlike clays that are typically sampled using Shelby tubes, residual soils require delicate and deliberate handling to insure the viability of test specimens. The procedure currently used by the Materials and Tests Unit of NCDOT to cut and extract specimens from Shelby Tubes utilizes a custom manufactured Shelby tube vise and large pipe cutter, shown in figure E.1, has proven to effective in creation of triaxial specimens. The method is as follows: 1) If this is the first specimen from the Shelby tube, cut one inch from the beveled end with a 3 inch pipe cutter to remove disturbed/contaminated soil. 2) Mark a six inch length from the cut end of the tube and note the direction the orientation of the tube. 3) Place the Shelby tube in the tube vise and use a 3 inch pipe cutter to cut the Shelby tube at the six inch mark. Tighten the clamp slowly to insure even cutting and limit deformation of the tube. It should take more than 25 turns to cut the tube. 4) When cutter penetrates the tube and the entire circumference is separated, use a wire saw or knife edge to cut the soil inside. 5) Reseal the remaining tube length with a protective cap. 6) Using a vertically oriented jack extractor with a retaining ring appropriate for Shelby tubes, extrude the soil specimen insuring the soil moves in the same direction as when it was sampled. 136
147 Each triaxial test should be conducted using AASHTO T297 or ASTM D4767. Strain rates, and time to failure, can be determined based upon those specified by ASTM D4767 (04), equation E.1, and recommendations by Bishop and Henkel (1957), equation E.2. 4% ' ε = (E.1) 10t 50 Where ε is the strain rate t 50 is the time to 50% consolidation of the triaxial specimen 2 h t f = ( Ε.2) ηc v Where t f is time to failure h is half height of the triaxial specimen η = 3 drainage at both ends or 35 for radial and drainage at both ends c v is the coefficient of consolidation Using 15% strain as the arbitrary failure point, the time to failure and strain rate for increasing values of t50 for a 3 x 6 inch specimen are shown in table E - 1. The quickest practical time to failure is 90 minutes for 15% strain. On the other hand, tests with a duration longer than 6 hours are impractical as well. Therefore if t 50 during consolidation is 10 minutes or less (1 if filter strips are used), a drained test is recommended. For specimens with longer t 50 values, undrained tests should be conducted. The strain rates and times to failure shown in table E.1 can be used as a guide. Generally, the addition of filter strips will enhance the ability to conduct drained tests on the specimens. 137
 (in 2 /min)")
148 Figure E.1 NCDOT Shelby Tube Vise and 3 inch pipe cutter Table E.1 Time to failure and strain rate recommendations for drained tests Bishop & Henkel CD Recommendation ASTM CU End Drainage End and Radial Drainage t 50 c v t f ε' t f ε' t f ε' ε' (min) (in 2 /min) (min) (in/min) (min) (in/min) (min) (in/min) (%/min)
vulcanhammer.net This document downloaded from
 This document downloaded from vulcanhammer.net since 1997, your source for engineering information for the deep foundation and marine construction industries, and the historical site for Vulcan Iron Works
Table of Contents Chapter 1 Introduction to Geotechnical Engineering 1.1 Geotechnical Engineering 1.2 The Unique Nature of Soil and Rock Materials
 Table of Contents Chapter 1 Introduction to Geotechnical Engineering 1.1 Geotechnical Engineering 1.2 The Unique Nature of Soil and Rock Materials 1.3 Scope of This Book 1.4 Historical Development of Geotechnical
SHEAR STRENGTH OF SOIL
 Soil Failure Criteria SHEAR STRENGTH OF SOIL Knowledge about the shear strength of soil important for the analysis of: Bearing capacity of foundations, Slope stability, Lateral pressure on retaining structures,
DMT Testing for the Estimation of Lateral Earth Pressure in Piedmont Residual Soils
 DMT Testing for the Estimation of Lateral Earth Pressure in Piedmont Residual Soils J. B. Anderson V.O. Ogunro J.M. Detwiler J.R. Starnes Department of Civil Engineering, University of North Carolina Charlotte,
Chapter (12) Instructor : Dr. Jehad Hamad
 Instructor : Dr. Jehad Hamad") Chapter (12) Instructor : Dr. Jehad Hamad 2017-2016 Chapter Outlines Shear strength in soils Direct shear test Unconfined Compression Test Tri-axial Test Shear Strength The strength of a material is the
Chapter (12) Instructor : Dr. Jehad Hamad 2017-2016 Chapter Outlines Shear strength in soils Direct shear test Unconfined Compression Test Tri-axial Test Shear Strength The strength of a material is the
Introduction to Soil Mechanics
 Introduction to Soil Mechanics Sela Sode and Colin Jones WILEY Blackwell Contents Preface Dedication and Acknowledgments List of Symbols Soil Structure 1.1 Volume relationships 1.1.1 Voids ratio (e) 1.1.2
Laboratory Testing Total & Effective Stress Analysis
 SKAA 1713 SOIL MECHANICS Laboratory Testing Total & Effective Stress Analysis Prepared by: Dr. Hetty Mohr Coulomb failure criterion with Mohr circle of stress 2 ' 2 ' ' ' 3 ' 1 ' 3 ' 1 Cot Sin c ' ' 2
file:///d /suhasini/suha/office/html2pdf/ _editable/slides/module%202/lecture%206/6.1/1.html[3/9/2012 4:09:25 PM]
![file:///d /suhasini/suha/office/html2pdf/ _editable/slides/module%202/lecture%206/6.1/1.html[3/9/2012 4:09:25 PM]](/thumbs/96/126781421.jpg "file:///d /suhasini/suha/office/html2pdf/ _editable/slides/module%202/lecture%206/6.1/1.html[3/9/2012 4:09:25 PM]") Objectives_template Objectives In this section you will learn the following Introduction Different Theories of Earth Pressure Lateral Earth Pressure For At Rest Condition Movement of the Wall Different
Objectives_template Objectives In this section you will learn the following Introduction Different Theories of Earth Pressure Lateral Earth Pressure For At Rest Condition Movement of the Wall Different
GEOTECHNICAL ENGINEERING ECG 503 LECTURE NOTE ANALYSIS AND DESIGN OF RETAINING STRUCTURES
 GEOTECHNICAL ENGINEERING ECG 503 LECTURE NOTE 07 3.0 ANALYSIS AND DESIGN OF RETAINING STRUCTURES LEARNING OUTCOMES Learning outcomes: At the end of this lecture/week the students would be able to: Understand
D1. A normally consolidated clay has the following void ratio e versus effective stress σ relationship obtained in an oedometer test.
 (d) COMPRESSIBILITY AND CONSOLIDATION D1. A normally consolidated clay has the following void ratio e versus effective stress σ relationship obtained in an oedometer test. (a) Plot the e - σ curve. (b)
LATERAL EARTH PRESSURE AND RETAINING STRUCTURES
 Topic Outline LATERAL EARTH PRESSURE AND RETAINING STRUCTURES Types of retaining structures Lateral earth pressure Earth pressure at rest Rankine s Theory Coulomb s Theory Cullman s graphic solution Braced
Introduction to Geotechnical Engineering. ground
 Introduction to Geotechnical Engineering ground 1 Typical Geotechnical Project Geo-Laboratory ~ for testing soil properties Design Office ~ for design & analysis construction site 2 Shallow Foundations
SHEAR STRENGTH OF SOIL
 SHEAR STRENGTH OF SOIL Necessity of studying Shear Strength of soils : Soil failure usually occurs in the form of shearing along internal surface within the soil. Shear Strength: Thus, structural strength
Chapter 5 Shear Strength of Soil
 Page 5 Chapter 5 Shear Strength of Soil. The internal resistance per unit area that the soil mass can offer to resist failure and sliding along any plane inside it is called (a) strength (b) shear strength
Landslide FE Stability Analysis
 Landslide FE Stability Analysis L. Kellezi Dept. of Geotechnical Engineering, GEO-Danish Geotechnical Institute, Denmark S. Allkja Altea & Geostudio 2000, Albania P. B. Hansen Dept. of Geotechnical Engineering,
Shear Strength of Soils
 Shear Strength of Soils STRESSES IN A SOIL ELEMENT t s v Analyze Effective Stresses (s ) Load carried by Soil t Where: s H t t s H s = t f = s v = s H = t = s v Stresses in a Soil Element after Figure
SHEET PILE WALLS. Mehdi Mokhberi Islamic Azad University
 SHEET PILE WALLS Mehdi Mokhberi Islamic Azad University Lateral Support In geotechnical engineering, it is often necessary to prevent lateral soil movements. Tie rod Anchor Sheet pile Cantilever retaining
8.1. What is meant by the shear strength of soils? Solution 8.1 Shear strength of a soil is its internal resistance to shearing stresses.
 8.1. What is meant by the shear strength of soils? Solution 8.1 Shear strength of a soil is its internal resistance to shearing stresses. 8.2. Some soils show a peak shear strength. Why and what type(s)
Report on Fleeing Felons or Probation/Parole Violators Denied and/or Terminated from Food and Nutrition Service or Work First Assistance
 Report on Fleeing Felons or Probation/Parole Violators Denied and/or Terminated from Food and Nutrition Service or Work Assistance SL 2013-417, Section 1.(h) Report to the Joint Legislative Oversight Committee
Cavity Expansion Methods in Geomechanics
 Cavity Expansion Methods in Geomechanics by Hai-Sui Yu School of Civil Engineering, University of Nottingham, U. K. KLUWER ACADEMIC PUBLISHERS DORDRECHT / BOSTON / LONDON TABLE OF CONTENTS Foreword Preface
EN Eurocode 7. Section 3 Geotechnical Data Section 6 Spread Foundations. Trevor L.L. Orr Trinity College Dublin Ireland.
 EN 1997 1: Sections 3 and 6 Your logo Brussels, 18-20 February 2008 Dissemination of information workshop 1 EN 1997-1 Eurocode 7 Section 3 Geotechnical Data Section 6 Spread Foundations Trevor L.L. Orr
SITE INVESTIGATION 1
 SITE INVESTIGATION 1 Definition The process of determining the layers of natural soil deposits that will underlie a proposed structure and their physical properties is generally referred to as site investigation.
Prof. B V S Viswanadham, Department of Civil Engineering, IIT Bombay
 56 Module 4: Lecture 7 on Stress-strain relationship and Shear strength of soils Contents Stress state, Mohr s circle analysis and Pole, Principal stressspace, Stress pathsin p-q space; Mohr-Coulomb failure
Boreholes. Implementation. Boring. Boreholes may be excavated by one of these methods: 1. Auger Boring 2. Wash Boring 3.
 Implementation Boreholes 1. Auger Boring 2. Wash Boring 3. Rotary Drilling Boring Boreholes may be excavated by one of these methods: 4. Percussion Drilling The right choice of method depends on: Ground
1.8 Unconfined Compression Test
 1-49 1.8 Unconfined Compression Test - It gives a quick and simple measurement of the undrained strength of cohesive, undisturbed soil specimens. 1) Testing method i) Trimming a sample. Length-diameter
Chapter 12 Subsurface Exploration
 Page 12 1 Chapter 12 Subsurface Exploration 1. The process of identifying the layers of deposits that underlie a proposed structure and their physical characteristics is generally referred to as (a) subsurface
Soil and Rock Strength. Chapter 8 Shear Strength. Steel Strength. Concrete Strength. Dr. Talat Bader May Steel. Concrete.
 Chapter 8 Shear Strength Dr. Talat Bader May 2006 Soil and Rock Strength Unconfined compressive strength (MPa) Steel Concrete 20 100 250 750 0.001 0.01 Soil 0.1 1.0 10 Rock 100 250 F y = 250 to 750 MPa
vulcanhammer.net Visit our companion site
 this document downloaded from vulcanhammer.net Since 1997, your complete online resource for information geotecnical engineering and deep foundations: The Wave Equation Page for Piling The historical site
Proceedings, ASCE Annual Convention, Charlotte, NC, 1999; GSP No. 92: Behavioral Characteristics of Residual Soils, pp
 Proceedings, ASCE Annual Convention, Charlotte, NC, 1999; GSP No. 92: Behavioral Characteristics of Residual Soils, pp. 101-112. FLAT DILATOMETER MODULUS APPLIED TO DRILLED SHAFT FOUNDATIONS IN PIEDMONT
Manual on Subsurface Investigations National Highway Institute Publication No. FHWA NHI Federal Highway Administration Washington, DC
 Manual on Subsurface Investigations National Highway Institute Publication No. FHWA NHI-01-031 Federal Highway Administration Washington, DC Geotechnical Site Characterization July 2001 by Paul W. Mayne,
Grade 7-13 Dropout Counts and Rates
 010 01B 01C 01D 020 030 040 050 060 06A 06B 070 080 090 09A 100 110 111 120 130 132 Alamance- Burlington Schools 362 3.43 324 3.08 268 2.56 318 2.98 233 2.18 232 2.15 River Mill Academy 0 0.00 2 0.77 0
KDOT Geotechnical Manual Edition. Table of Contents
 KDOT Geotechnical Manual 2007 Edition The KDOT Geotechnical Manual is available two volumes. Both volumes are very large electronic (pdf) files which may take several minutes to download. The table of
Influences of material dilatancy and pore water pressure on stability factor of shallow tunnels
 Influences of material dilatancy and pore water pressure on stability factor of shallow tunnels YANG Xiao-li( ), HUANG Fu( ) School of Civil and Architectural Engineering, Central South University, Changsha
H.1 SUMMARY OF SUBSURFACE STRATIGRAPHY AND MATERIAL PROPERTIES (DATA PACKAGE)
") DRAFT ONONDAGA LAKE CAPPING AND DREDGE AREA AND DEPTH INITIAL DESIGN SUBMITTAL H.1 SUMMARY OF SUBSURFACE STRATIGRAPHY AND MATERIAL PROPERTIES (DATA PACKAGE) Parsons P:\Honeywell -SYR\444576 2008 Capping\09
DRAFT ONONDAGA LAKE CAPPING AND DREDGE AREA AND DEPTH INITIAL DESIGN SUBMITTAL H.1 SUMMARY OF SUBSURFACE STRATIGRAPHY AND MATERIAL PROPERTIES (DATA PACKAGE) Parsons P:\Honeywell -SYR\444576 2008 Capping\09
Class Principles of Foundation Engineering CEE430/530
 Class Principles of Foundation Engineering CEE430/530 1-1 General Information Lecturer: Scott A. Barnhill, P.E. Lecture Time: Thursday, 7:10 pm to 9:50 pm Classroom: Kaufmann, Room 224 Office Hour: I have
Predicting Settlement and Stability of Wet Coal Ash Impoundments using Dilatometer Tests
 Predicting Settlement and Stability of Wet Coal Ash Impoundments using Dilatometer Tests Chris Hardin, P.E. CH2M Hill, Charlotte, North Carolina, E-mail: Chris.Hardin@ch2m.com Roger Failmezger, P.E., F.
Geotechnical Parameters for Retaining Wall Design
 11 th October 2012 Geotechnical Parameters for Retaining Wall Design Tanya Kouzmin 1 Most geotechnical failures are of retaining walls Are failure caused by WRONG calculations? Not usually calculation
Reinforced Soil Structures Reinforced Soil Walls. Prof K. Rajagopal Department of Civil Engineering IIT Madras, Chennai
 Geosynthetics and Reinforced Soil Structures Reinforced Soil Walls continued Prof K. Rajagopal Department of Civil Engineering IIT Madras, Chennai e-mail: gopalkr@iitm.ac.inac in Outline of the Lecture
The Ohio Department of Transportation Office of Research & Development Executive Summary Report
 The Ohio Department of Transportation Office of Research & Development Executive Summary Report Shear Strength of Clay and Silt Embankments Start Date: January 1, 2007 Duration: 2 Years- 10 Months Completion
Chapter 6 Bearing Capacity
 Chapter 6 Bearing Capacity 6-1. Scope This chapter provides guidance for the determination of the ultimate and allowable bearing stress values for foundations on rock. The chapter is subdivided into four
Soil Mechanics Prof. B.V.S. Viswanathan Department of Civil Engineering Indian Institute of Technology, Bombay Lecture 51 Earth Pressure Theories II
 Soil Mechanics Prof. B.V.S. Viswanathan Department of Civil Engineering Indian Institute of Technology, Bombay Lecture 51 Earth Pressure Theories II Welcome to lecture number two on earth pressure theories.
Enhanced In-Situ Testing for Geotechnical Site Characterization. Graduate Course CEE 6423
 Enhanced In-Situ Testing for Geotechnical Site Characterization SPT, VST, DMT, PMT, CHT, DHT, CPT Graduate Course CEE 6423 Paul W. Mayne, PhD, P.E. Professor, Geosystems Program Civil & Environmental Engineering
PRINCIPLES OF GEOTECHNICAL ENGINEERING
 PRINCIPLES OF GEOTECHNICAL ENGINEERING Fourth Edition BRAJA M. DAS California State University, Sacramento I(T)P Boston Albany Bonn Cincinnati London Madrid Melbourne Mexico City New York Paris San Francisco
TIME-DEPENDENT BEHAVIOR OF PILE UNDER LATERAL LOAD USING THE BOUNDING SURFACE MODEL
 TIME-DEPENDENT BEHAVIOR OF PILE UNDER LATERAL LOAD USING THE BOUNDING SURFACE MODEL Qassun S. Mohammed Shafiqu and Maarib M. Ahmed Al-Sammaraey Department of Civil Engineering, Nahrain University, Iraq
Earth Pressure Theory
 Lateral Earth Pressure Page 1 Earth Pressure Theory Examples of Retaining Walls Lateral Earth Pressure Page 2 At-Rest, Active and Passive Earth Pressure Wednesday, August 17, 2011 12:45 PM At-rest condition
pcf REQUIRED: Determine the shear strength parameters for use in a preliminary shallow foundation design. SOLUTION:
 14.330 SOIL MECHANICS Assignment #8: Shear Strength Solution. PROBLEM #1: GIVEN: A regional residential building contractor is planning on building a custom 4,100 ft² home on Martha s Vineyard, MA. The
Ch 4a Stress, Strain and Shearing
 Ch. 4a - Stress, Strain, Shearing Page 1 Ch 4a Stress, Strain and Shearing Reading Assignment Ch. 4a Lecture Notes Sections 4.1-4.3 (Salgado) Other Materials Handout 4 Homework Assignment 3 Problems 4-13,
CPT Data Interpretation Theory Manual
 CPT Data Interpretation Theory Manual 2016 Rocscience Inc. Table of Contents 1 Introduction... 3 2 Soil Parameter Interpretation... 5 3 Soil Profiling... 11 3.1 Non-Normalized SBT Charts... 11 3.2 Normalized
(C) Global Journal of Engineering Science and Research Management
 Global Journal of Engineering Science and Research Management") GEOTECHNCIAL ASSESSMENT OF PART OF PORT HARCOURT, NIGER DELTA FOR STRUCTURAL ANALYSIS Warmate Tamunonengiyeofori Geostrat International Services Limited, www.geostratinternational.com. *Correspondence
GEOTECHNCIAL ASSESSMENT OF PART OF PORT HARCOURT, NIGER DELTA FOR STRUCTURAL ANALYSIS Warmate Tamunonengiyeofori Geostrat International Services Limited, www.geostratinternational.com. *Correspondence
Shear Strength of Soil
 8 Shear Strength of Soil 8 1 INTRODUCTION As a structural member, a piece of steel is capable of resisting compression, tension, and shear. Soil, however, like concrete and rock, is not capable of resisting
IAEA SAFETY STANDARDS Geotechnical Aspects of Site Evaluation and Foundations in NPPs, NS-G-3.6
 IAEA SAFETY STANDARDS Geotechnical Aspects of Site Evaluation and Foundations in NPPs, NS-G-3.6 Regional Workshop on Volcanic, Seismic, and Tsunami Hazard Assessment Related to NPP Siting Activities and
APPENDIX F CORRELATION EQUATIONS. F 1 In-Situ Tests
 APPENDIX F 1 APPENDIX F CORRELATION EQUATIONS F 1 In-Situ Tests 1. SPT (1) Sand (Hatanaka and Uchida, 1996), = effective vertical stress = effective friction angle = atmosphere pressure (Shmertmann, 1975)
Chapter (11) Pile Foundations
 Pile Foundations") Chapter (11) Introduction Piles are structural members that are made of steel, concrete, or timber. They are used to build pile foundations (classified as deep foundations) which cost more than shallow
Chapter (11) Introduction Piles are structural members that are made of steel, concrete, or timber. They are used to build pile foundations (classified as deep foundations) which cost more than shallow
2017 Soil Mechanics II and Exercises Final Exam. 2017/7/26 (Wed) 10:00-12:00 Kyotsu 4 Lecture room
 10:00-12:00 Kyotsu 4 Lecture room") 2017 Soil Mechanics II and Exercises Final Exam 2017/7/26 (Wed) 10:00-12:00 Kyotsu 4 Lecture room Attention: The exam consists of five questions for which you are provided with five answer sheets. Write
2017 Soil Mechanics II and Exercises Final Exam 2017/7/26 (Wed) 10:00-12:00 Kyotsu 4 Lecture room Attention: The exam consists of five questions for which you are provided with five answer sheets. Write
(Refer Slide Time: 02:18)
") Geology and Soil Mechanics Prof. P. Ghosh Department of Civil Engineering Indian Institute of Technology Kanpur Lecture 40 Shear Strength of Soil - C Keywords: Shear strength of soil, direct shear test,
Geology and Soil Mechanics Prof. P. Ghosh Department of Civil Engineering Indian Institute of Technology Kanpur Lecture 40 Shear Strength of Soil - C Keywords: Shear strength of soil, direct shear test,
LATERAL EARTH PRESSURE
 . INTRODUCTION Retaining structures commonly used in foundation engineering, such as retaining walls, basement walls and bulkheads to support almost vertical slopes of earth masses. Proper design and construction
INTRODUCTION TO STATIC ANALYSIS PDPI 2013
 INTRODUCTION TO STATIC ANALYSIS PDPI 2013 What is Pile Capacity? When we load a pile until IT Fails what is IT Strength Considerations Two Failure Modes 1. Pile structural failure controlled by allowable
SOIL MECHANICS: palgrave. Principles and Practice. Graham Barnes. macmiiian THIRD EDITION
 SOIL MECHANICS: Principles and Practice THIRD EDITION Graham Barnes palgrave macmiiian 'running Contents Preface xii Fine soil 19 List of symbols xiv Mass structure 21 Note on units xix Degree of weathering
Soil strength. the strength depends on the applied stress. water pressures are required
 Soil Strength Soil strength u Soils are essentially frictional materials the strength depends on the applied stress u Strength is controlled by effective stresses water pressures are required u Soil strength
Slope Stability Evaluation Ground Anchor Construction Area White Point Landslide San Pedro District Los Angeles, California.
 Slope Stability Evaluation Ground Anchor Construction Area White Point Landslide San Pedro District Los Angeles, California Submitted To: Mr. Gene Edwards City of Los Angeles Department of Public Works
J. Paul Guyer, P.E., R.A.
 J. Paul Guyer, P.E., R.A. Paul Guyer is a registered mechanical engineer, civil engineer, fire protection engineer and architect with over 35 years experience in the design of buildings and related infrastructure.
Finite Element analysis of Laterally Loaded Piles on Sloping Ground
 Indian Geotechnical Journal, 41(3), 2011, 155-161 Technical Note Finite Element analysis of Laterally Loaded Piles on Sloping Ground K. Muthukkumaran 1 and N. Almas Begum 2 Key words Lateral load, finite
USING UNSATURATED SOIL SHEAR STRENGTH
 DESIGNING TEMPORARY SOIL NAIL WALLS USING UNSATURATED SOIL SHEAR STRENGTH T.J. Ju, P.E., Design Engineer, Wan Soo Kim, Ph.D., P.E., Soils Engineer, Virginia Dept. of Transportation Roy H. Borden, Ph.D.,
IN SITU TESTING TECHNOLOGY FOR FOUNDATION & EARTHQUAKE ENGINEERING. Wesley Spang, Ph.D., P.E. AGRA Earth & Environmental, Inc.
 IN SITU TESTING TECHNOLOGY FOR FOUNDATION & EARTHQUAKE ENGINEERING Wesley Spang, Ph.D., P.E. AGRA Earth & Environmental, Inc. Portland, Oregon In situ testing of soil, which essentially consists of evaluating
Foundation Analysis LATERAL EARTH PRESSURE
 Foundation Analysis LATERAL EARTH PRESSURE INTRODUCTION Vertical or near-vertical slopes of soil are supported by retaining walls, cantilever sheet-pile walls, sheet-pile bulkheads, braced cuts, and other
FINITE ELEMNT ANALYSIS FOR EVALUATION OF SLOPE STABILITY INDUCED BY CUTTING
 FINITE ELEMNT ANALYSIS FOR EVALUATION OF SLOPE STABILITY INDUCED BY CUTTING Toshinori SAKAI Department of Environmental Science and Technology, Mie University, Tsu, Japan Tadatsugu TANAKA Graduate School
Lateral Earth Pressure
 1 of 11 6/2/2012 4:28 AM Lateral Earth Pressure The magnitude of lateral earth pressure depends on: 1. Shear strength characteristics of soil 2. Lateral strain condition 3. Pore water pressure 4. State
Axially Loaded Piles
 Axially Loaded Piles 1 t- Curve Method using Finite Element Analysis The stress-strain relationship for an axially loaded pile can be described through three loading mechanisms: axial deformation in the
INTERPRETATION OF UNDRAINED SHEAR STRENGTH OF UNSATURATED SOILS IN TERMS OF STRESS STATE VARIABLES
 INTERPRETATION OF UNDRAINED SHEAR STRENGTH OF UNSATURATED SOILS IN TERMS OF STRESS STATE VARIABLES S. K. Vanapalli and D.G. Fredlund Department of Civil Engineering University of Saskatchewan, Saskatoon
Effect of embedment depth and stress anisotropy on expansion and contraction of cylindrical cavities
 Effect of embedment depth and stress anisotropy on expansion and contraction of cylindrical cavities Hany El Naggar, Ph.D., P. Eng. and M. Hesham El Naggar, Ph.D., P. Eng. Department of Civil Engineering
Liquefaction and Foundations
 Liquefaction and Foundations Amit Prashant Indian Institute of Technology Gandhinagar Short Course on Seismic Design of Reinforced Concrete Buildings 26 30 November, 2012 What is Liquefaction? Liquefaction
Triaxial Shear Test. o The most reliable method now available for determination of shear strength parameters.
 TOPICS Introduction Components of Shear Strength of Soils Normal and Shear Stresses on a Plane Mohr-Coulomb Failure Criterion Laboratory Shear Strength Testing Direct Shear Test Triaxial Compression Test
Engineeringmanuals. Part2
 Engineeringmanuals Part2 Engineering manuals for GEO5 programs Part 2 Chapter 1-12, refer to Engineering Manual Part 1 Chapter 13. Pile Foundations Introduction... 2 Chapter 14. Analysis of vertical load-bearing
IN SITU TESTING IN GEOMECHANICS. Fernando Schnaid Universidade Federal do Rio Grande do Sul
 IN SITU TESTING IN GEOMECHANICS Fernando Schnaid Universidade Federal do Rio Grande do Sul Patologia das Fundações Geotechnical investigation British Practice (Weltman & Head,1981): Sufficient finance
Stress and Strains in Soil and Rock. Hsin-yu Shan Dept. of Civil Engineering National Chiao Tung University
 Stress and Strains in Soil and Rock Hsin-yu Shan Dept. of Civil Engineering National Chiao Tung University Stress and Strain ε 1 1 2 ε 2 ε Dimension 1 2 0 ε ε ε 0 1 2 ε 1 1 2 ε 2 ε Plane Strain = 0 1 2
NEW DOWN-HOLE PENETROMETER (DHP-CIGMAT) FOR CONSTRUCTION APPLICATIONS
 FOR CONSTRUCTION APPLICATIONS") NEW DOWN-HOLE PENETROMETER (DHP-CIGMAT) FOR CONSTRUCTION APPLICATIONS 1 2 C. Vipulanandan 1, Ph.D., M. ASCE and Omer F. Usluogullari 2 Chairman, Professor, Director of Center for Innovative Grouting Materials
NEW DOWN-HOLE PENETROMETER (DHP-CIGMAT) FOR CONSTRUCTION APPLICATIONS 1 2 C. Vipulanandan 1, Ph.D., M. ASCE and Omer F. Usluogullari 2 Chairman, Professor, Director of Center for Innovative Grouting Materials
NUMERICAL ANALYSIS OF PASSIVE EARTH PRESSURES WITH INTERFACES
 III European Conference on Computational Mechanics Solids, Structures and Coupled Problems in Engineering C.A. Mota Soares et.al. (eds.) Lisbon, Portugal, 5-8 June 2006 NUMERICAL ANALYSIS OF PASSIVE EARTH
Soils. Technical English - I 10 th week
 Technical English - I 10 th week Soils Soil Mechanics is defined as the branch of engineering science which enables an engineer to know theoretically or experimentally the behavior of soil under the action
Geology and Soil Mechanics /1A ( ) Mark the best answer on the multiple choice answer sheet.
 Mark the best answer on the multiple choice answer sheet.") Geology and Soil Mechanics 55401 /1A (2003-2004) Mark the best answer on the multiple choice answer sheet. 1. Soil mechanics is the application of hydraulics, geology and mechanics to problems relating
Geology and Soil Mechanics 55401 /1A (2003-2004) Mark the best answer on the multiple choice answer sheet. 1. Soil mechanics is the application of hydraulics, geology and mechanics to problems relating
Cyclic Behavior of Sand and Cyclic Triaxial Tests. Hsin-yu Shan Dept. of Civil Engineering National Chiao Tung University
 Cyclic Behavior of Sand and Cyclic Triaxial Tests Hsin-yu Shan Dept. of Civil Engineering National Chiao Tung University Causes of Pore Pressure Buildup due to Cyclic Stress Application Stress are due
Prediction of torsion shear tests based on results from triaxial compression tests
 Prediction of torsion shear tests based on results from triaxial compression tests P.L. Smith 1 and N. Jones *2 1 Catholic University of America, Washington, USA 2 Geo, Lyngby, Denmark * Corresponding
Cone Penetration Testing in Geotechnical Practice
 Cone Penetration Testing in Geotechnical Practice Table Of Contents: LIST OF CONTENTS v (4) PREFACE ix (2) ACKNOWLEDGEMENTS xi (1) SYMBOL LIST xii (4) CONVERSION FACTORS xvi (6) GLOSSARY xxii 1. INTRODUCTION
Measurement of effective stress shear strength of rock
 Measurement of effective stress shear strength of rock R. A. Failmezger, P.E., F. ASCE In-Situ Soil Testing, L.C., Lancaster, Virginia USA D. J. White, Ph. D., P.E. Iowa State University, Ames, Iowa USA
TABLE OF CONTENTS INTRODUCTION... 1 GEOLOGY... 1 RESIDUAL SOIL FORMATION AND THE WEATHERING PROFILE.. 2 ENGINEERING CLASSIFICATION..
 TABLE OF CONTENTS INTRODUCTION... 1 GEOLOGY... 1 RESIDUAL SOIL FORMATION AND THE WEATHERING PROFILE.. 2 ENGINEERING CLASSIFICATION.. 4 ENGINEERING PROPERTIES... 5 Permeability.. 5 Compressibility.........
SOIL SHEAR STRENGTH. Prepared by: Dr. Hetty Muhammad Azril Fauziah Kassim Norafida
 SOIL SHEAR STRENGTH Prepared by: Dr. Hetty Muhammad Azril Fauziah Kassim Norafida What is shear strength Shear strength of a soil is the maximum internal resistance to applied shearing forces Why it is
NATURAL SOIL DEPOSITS
 NATURAL SOIL DEPOSITS Soils are produced by weathering of rock. Weathering is the physical or chemical breakdown of rock. Physical Processes: - Unloading - Frost Action - Organism Growth - Crystal Growth
1.5 STRESS-PATH METHOD OF SETTLEMENT CALCULATION 1.5 STRESS-PATH METHOD OF SETTLEMENT CALCULATION
 Module 6 Lecture 40 Evaluation of Soil Settlement - 6 Topics 1.5 STRESS-PATH METHOD OF SETTLEMENT CALCULATION 1.5.1 Definition of Stress Path 1.5. Stress and Strain Path for Consolidated Undrained Undrained
Theory of Shear Strength
 SKAA 1713 SOIL MECHANICS Theory of Shear Strength Prepared by, Dr. Hetty 1 SOIL STRENGTH DEFINITION Shear strength of a soil is the maximum internal resistance to applied shearing forces The maximum or
Calculation and analysis of internal force of piles excavation supporting. based on differential equation. Wei Wang
 International Conference on Energy and Environmental Protection (ICEEP 016) Calculation and analysis of internal force of piles excavation supporting based on differential equation Wei Wang School of Prospecting
June 9, R. D. Cook, P.Eng. Soils Engineer Special Services Western Region PUBLIC WORKS CANADA WESTERN REGION REPORT ON
 PUBLIC WORKS CANADA WESTERN REGION REPORT ON GEOTECHNICAL INVESTIGATION PROPOSED MARTIN RIVER BRIDGE MILE 306.7 MACKENZIE HIGHWAY Submitted by : R. D. Cook, P.Eng. Soils Engineer Special Services Western
AB Engineering Manual
 AB Engineering Manual Allan Block Retaining Walls FOREWORD This manual presents the techniques used by Allan Block in our engineering practice to design retaining walls. It is not intended as a textbook
Seismic Analysis of Retaining Structures. Nanjundaswamy P. Department of Civil Engineering S J College of Engineering, Mysore
 Seismic Analysis of Retaining Structures Nanjundaswamy P. Department of Civil Engineering S J College of Engineering, Mysore pnswamy@yahoo.com Retaining Walls Retaining Walls. Where? Retaining Walls. Road
Chapter 7 GEOMECHANICS
 Chapter 7 Final SCDOT GEOTECHNICAL DESIGN MANUAL August 2008 Table of Contents Section Page 7.1 Introduction...7-1 7.2 Geotechnical Design Approach...7-1 7.3 Geotechnical Engineering Quality Assurance...7-2
SI Planning & Laboratory Testing for Hill-Site Development
 SI Planning & Laboratory Testing for Hill-Site Development 21 April 2009 IEM Penang Ir. Tan Yean Chin G&P Geotechnics Sdn Bhd Cameron Highlands, 1961 Genting Highland Tower 1993 Bukit Antarabangsa, 1999
Deep Foundations 2. Load Capacity of a Single Pile
 Deep Foundations 2 Load Capacity of a Single Pile All calculations of pile capacity are approximate because it is almost impossible to account for the variability of soil types and the differences in the
GEOL 314 Engineering Geology
 GEOL 314 Engineering Geology Dr. Robert Mitchell ES234 Winter 2013 650-3591 robert.mitchell@wwu.edu http://kula.geol.wwu.edu/rjmitch/ Office Hours: MWF 2-3:00 pm or by arrangement Text: Geotechnical Engineering
A. V T = 1 B. Ms = 1 C. Vs = 1 D. Vv = 1
 Geology and Soil Mechanics 55401 /1A (2002-2003) Mark the best answer on the multiple choice answer sheet. 1. Soil mechanics is the application of hydraulics, geology and mechanics to problems relating
A Constitutive Framework for the Numerical Analysis of Organic Soils and Directionally Dependent Materials
 Dublin, October 2010 A Constitutive Framework for the Numerical Analysis of Organic Soils and Directionally Dependent Materials FracMan Technology Group Dr Mark Cottrell Presentation Outline Some Physical
CHAPTER 8 ANALYSES OF THE LATERAL LOAD TESTS AT THE ROUTE 351 BRIDGE
 CHAPTER ANALYSES OF THE LATERAL LOAD TESTS AT THE ROUTE 351 BRIDGE.1 INTRODUCTION An important objective of this research is to determine whether accurate analyses of the lateral load-deflection behavior
DRILLED DISPLACMENT PILE PERFORMANCE IN COASTAL PLAIN AND RESIDUAL SOILS
 DRILLED DISPLACMENT PILE PERFORMANCE IN COASTAL PLAIN AND RESIDUAL SOILS Presented by: W. Morgan NeSmith, P.E. Berkel & Company Contractors Inc. 770.941.5100 mnesmith@berkelapg.com SC Engineering Conference