Solutions - Final Exam
|
|
|
- Alban Phillips
- 5 years ago
- Views:
Transcription
1 Solutions - Final Exam Instructors: Dr. A. Grine and Dr. A. Ben Ghorbal Sections: 170, 171, 172, 173 Total Marks Exercise 1 7 Exercise 2 6 Exercise 3 6 Exercise 4 6 Exercise 5 6 Exercise 6 9 Total 40 Score
2 Exercise 1 (7 Marks) For the ABO blood typing system, each person has exactly one of 4 blood types, A, B, O or AB. Two random people attending a blood donor clinic have their blood type recorded. 1. Explain why this is an example of a random experiment and give the sample space of the experiment. Solution: [2 Marks] This is a random experiment because in any running of the experiment a different set of 2 people from the population could be selected and so the resulting blood types will be different. We do know, however, that the 2 blood types will each be one of the four possible types and so there is a well defined sample space. In defining the sample space we should assume that the two people are distinguishable so that an outcome is an ordered pair of blood types. S = {(A, A), (A, B), (A, O), (A, AB), (B, A), (B, B), (B, O), (B, AB), (O, A), (O, B), (O, O), (O, AB), (AB, A), (AB, B), (AB, O), (AB, AB)} 2. Let C be the event that the two people have the same blood type. List the outcomes in C. Solution: [1.5 Marks] We have C = {(A, A), (B, B), (O, O), (AB, AB)} 3. Let D be the event that at least one of the people has blood type AB. List the outcomes in D. Solution: [1.5 Marks] We have D = {(A, AB), (B, AB), (AB, AB), (O, AB), (AB, A), (AB, B), (AB, O)} 4. List the outcomes in C D and hence give the outcomes in the events (C D) c and C c D c. Solution: [2 Marks] Since C D = {(A, A), (A, AB), (B, B), (B, AB), (O, O), (O, AB), (AB, A), (AB, B), (AB, AB), (AB, O)} Thus, (C D) c = {(A, B), (A, O), (B, A), (B, O), (O, A), (O, B)} Now by the De Morgan s Law we obtain C c D c = (C D) c = {(A, B), (A, O), (B, A), (B, O), (O, A), (O, B)} 2
3 Exercise 2 (6 Marks) Three married couples have purchased 6 adjacent seats in a row at the theater. The seats numbers are A10, A11, A12, A13, A14 and A15. Suppose that they take their seats in a random fashion. 1. What is the probability that Faisal and his wife Nada sit next to each other in seats A10 and A11? Solution: [1.5 Marks] There are 6 people so there are a total of 6! = 720 different seating arrangements that can be made. There are 2 ways that Faisal and Nada can sit such that they are in seats A10 and A11 There are 4! = 24 ways the other four can be arranged in the remaining 4 seats. P (Faisal and Nada in A10, A11) = ! = = What is the probability that Faisal and Nada sit next to each other? Solution: [1.5 Marks] There are 5 possible pairs of seats in which Faisal and Nada can sit and be next to each other. They are (A10, A11), (A11, A12), (A12, A13), (A13, A14) and (A14, A15). For any such pair of seats, the probability that John and Paula sit there is from part (1). They are clearly mutually exclusive since Faisal and Nada can only sit in one pair of seats. Hence P (Faisal and Nada sit together) = =
4 3. What is the probability that every husband sits next to his wife? Solution: [1.5 Marks] If all three couples are sitting together then one couple must be in (A10, A11), one must be in (A12, A13) and one must be in (A14, A15). There are 3! = 6 ways we can assign the couples to their pair of seats. Once the seats have been decided there are 2 ways to arrange each couple so there are 2 3 = 8 arrangements for each assignment of seats to couples. Hence P (Every couple sits together) = 6 8 6! = = What is the probability that at least one of the wives sits next to her husband? Solution: [1.5 Marks] Let us number the couples 1, 2, 3 and define B i to be the event that couple i sits together. The event that we are interested in is the union of these three events. We can the following property of the probability P (B 1 B 2 B 3 ) = P (B 1 ) + P (B 2 ) + P (B 3 ) P (B 1 B 2 ) From part (2) we see that P (B 1 B 3 ) P (B 2 B 3 ) + P (B 1 B 2 B 3 ) P (B i ) = 1, for i = 1, 2, 3. 3 In part (3) we found Also it is clear that P (B 1 B 2 B 3 ) = 1 15 P (B 1 B 2 ) = P (B 1 B 3 ) = P (B 2 B 3 ) so all that remains for us to do is find P (B 1 B 2 ), the probability that couple 1 and couple 2 both sit together. For couple 1 and 2 to both sit together there are 6 sets of seats that they can occupy: [(A 10, A 11 ), (A 12, A 13 )], [(A 10, A 11 ), (A 13, A 14 )], [(A 10, A 11 ), (A 14, A 15 )], [(A 11, A 12 ), (A 13, A 14 )], [(A 11, A 12 ), (A 14, A 15 )] and [(A 12, A 13 ), (A 14, A 15 )]. For any such set, there are 2 ways to decide which couple goes in the pair with the lower numbers. Once that has been decided each couple can rearrange themselves in 2 ways so there are 23 = 8 ways to arrange the people when we have decided what seats are for which couple. This means there are 2 8 = 16 possible seating arrangements for each of the six sets of seats listed above and so there are 6 16 = 96 possible ways that couple 1 and couple 2 can both sit together. P (B 1 B 2 B 3 ) = 3P (B 1 ) 3P (B 1 B 2 ) + P (B 1 B 2 B 3 ) = =
5 Exercise 3 (6 Marks) A worker has asked his supervisor for a letter of recommendation for a new job. He estimates that there is an 80% = 0.80 chance that he will get the job if he receives a strong recommendation, a 40% = 0.40 chance if he receives a moderately good recommendation, and a 10% = 0.10 chance if he receives a weak recommendation. He further estimates that the probabilities that the recommendation will be strong, moderate, or weak are 0.7, 0.2 and 0.1, respectively. 1. How certain is he that he will receive the new job offer? Solution: [1.5 Marks] Define the events A that she gets the new job, B 1 that she gets a strong reference, B 2 that she gets a moderate reference and B 3 that she gets a weak reference. From the question we can write P (A B 1 ) = 0.8, P (A B 2 ) = 0.4, P (A B 3 ) = 0.1 P (B 1 ) = 0.7, P (B 2 ) = 0.2, P (B 3 ) = 0.1 From the Law of Total Probability we have P (A) = P (A B 1 ) P (B 1 ) + P (A B 2 ) P (B 2 ) + P (A B 3 ) P (B 3 ) = = = Given that he has receive the offer, how likely he feels that the recommendation he has received is Solution: [1.5 Marks] Bayes Theorem tells us that strong; P (B i A) = P (A B i) P (B i ), for i = 1, 2, 3. P (A) Solution: [1.5 Marks] Using Bayes formula we get P (B 1 A) = P (A B 1) P (B 1 ) P (A) = 0.65 =
6 moderate Solution: [1.5 Marks] Using Bayes formula we get P (B 2 A) = P (A B 2) P (B 2 ) P (A) = 0.65 = weak? Solution: [1.5 Marks] Using Bayes formula we get P (B 3 A) = P (A B 3) P (B 3 ) P (A) = 0.65 =
7 Exercise 4 (6 Marks) A discrete random variable, Y, has probability mass function 1. Find the value of the constant c. p Y (y) = c(y 3) 2, y = 2, 1, 0, 1, 2. Solution: [2 Marks] Writing the probability mass function as a table we have y p Y (y) 25c 16c 9c 4c c We need to choose c such that the sum of the probability mass function is equal to 1. The sum of the probability mass function is 2 p Y (y) = 55c y= 2 and so we have 55c = 1 = c = Give the cumulative distribution function of Y. Solution: [2 Marks] First we will write the probability mass function with the appropriate value of c. y p Y (y) Thus we get the cumulative distribution function 0 for y < 2 F Y (y) = for 2 y < for 1 y < for 0 y < for 1 y < for y
8 3. Find the mean and variance of Y. Solution: [1.5 Marks] The mean (or expected value) of Y is E[Y ] = 2 y p Y (y) y= 2 = ( 2) ( 1) = 55 = The variance is best calculated as Var[Y ] = E [Y 2 ] (E[Y ]) 2 where and so E [ Y 2] = 2 y 2 p Y (y) y= 2 = ( 2) ( 1) = = = Var[Y ] = 124 ( ) 2 55 = = =
9 Exercise 5 (6 Marks) Let X posses a density function { dx f X (x) = 2 (1 x) 0 x 1 0 elsewhere 1. Find the value of the constant d. Solution: (3 Marks) Since f X is the probability density function of a given random variable then we need to choose d such that the sum of probability distribution function is equal to 1, i.e. + f X (x)dx = 1 The integral of the probability distribution function is + f X (x)dx = 1 = d d x 2 (1 x) dx ( x 2 x 3) dx [ x 3 = d 3 x4 4 ( 1 = d 3 1 ) 4 ( ) 4 3 = d 12 ] 1 0 and so we have d 12 = d 12 = 1 = d = 12. Therefore, the continuous random variable X has the probability density function { 12x 2 (1 x) 0 x 1 f X (x) = 0 elsewhere 9
10 2. Give the cumulative distribution function of X and P ( 1 2 X 1 2). Solution: (3 Marks) By definition the cumulative distribution function is given by F X (x) = x Then we distinguish the following three situations: f X (t)dt 1 st case: x 0, so t x 0. Thus we have f X (t) = 0 and so 2 nd case: 0 < x < 1, then 3 rd case: x 1, we have F X (x) = F X (x) = x = F X (x) = 0 x 0 = 0 + x f X (t)dt f X (t)dt + 0 x 0 f X (t)dt ( 12t 2 12t 3) dt = [ 4t 3 3t 4] x 0 = 4x3 3x 4 f X (t)dt = 0 f X (t)dt + 1 f X (t)dt + x 0 1 f X (t)dt = 0 + = ( 12t 2 12t 3) dt + 0 Therefore, the continuous random variable X has the cumulative distribution function 0 for x 0 F X (x) = 4x 3 3x 4 for 0 < x < 1 1 for x 1 We have P ( 1 2 X 1 ) 2 ( = P X 1 ) ( P X 1 ) 2 2 ( ) ( 1 = F F 1 ) 2 2 ( ) 3 ( ) = = 8 1 =
11 Exercise 6 (9 Marks) Part 1 The probability that a patient recovers from a stomach disease is 0.8. Suppose 20 people are known to have contracted this disease 1. What is the probability that exactly 14 recover?. Solution: (3 Marks) Let X be the number of recovered patients from a stomach disease. Then the distribution of X is X binomial (n = 20, p = 0.80). Then the probability that exactly 14 recover is given by ( ) 20 P (X = 14) = (0.8) 14 (1 0.8) ( ) 20 20! = 14 14! 6! (0.8)14 (0.2) = (0.8) 14 (0.2) = (0.8) 14 (0.2) What is the probability that at least 10 recover? Solution: (3 Marks) We have P (X 10) = 1 P (X < 10) = 1 P (X = 0) P (X = 2) P (X = 9) 1 11
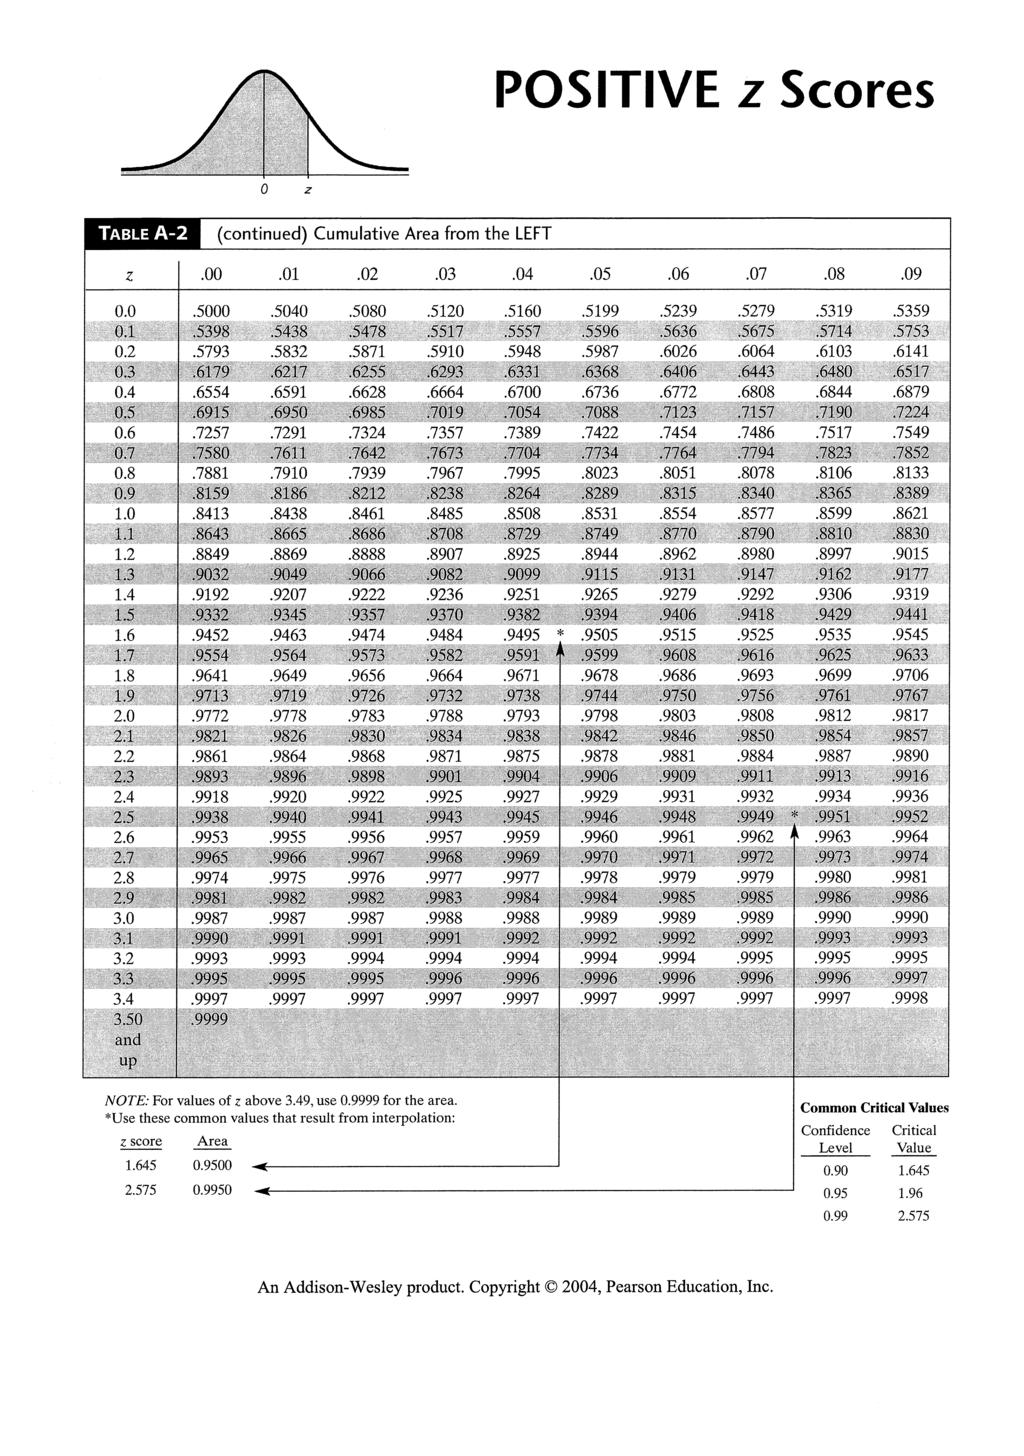
12 Part 2 A machine is used to automatically fill 355 ml milk bottles. The actual amount put into each bottle is a normal random variable with mean 360 ml and standard deviation of 4 ml. What proportion of bottles are filled with less than 355 ml of milk? Solution: (3 Marks) Let X be the amount of milk in a randomly chosen bottle. Then, the question tells us that X Normal(µ = 360, σ = 16) and ( ) X µ P (X < 355) = P < σ 4 = P (Z < 1.25) [Z Normal(0, 1)] = P (Z > 1.25) = 1 P (Z 1.25) = =

13 Solutions - Final Exam Instructors: Drs. A. Ben Ghorbal, A. Berkaoui and A. Ahmad Sections: 171, 172, 173, 174, 175, 176 Total Marks Exercise 1 9 Exercise 2 14 Exercise 3 9 Exercise 4 8 Total 40 Score
14 Exercise 1 (9 Marks) A. The following data represents the temperature high in degrees Centigrade of 10 consecutive days in April in a certain city: Find the followings: (i) the mean x 23, 27, 25, 20, 12, 8, 6, 12, 15, 17. Solution: [1.5 Marks] Using the definition of the mean we get x = 10 = = 16.5 (ii) the median x. Solution: [1.5 Marks] By reordering the data given above we get 6, 8, 12, 12, 15, 17, 20, 23, 25, 27 Then, the median is given x = = 16 (iii) the mode. Solution: [1.5 Marks] Since the number 12 is repeated two times then the mode is 12. 2
15 B. A sample of three calculators is selected from a manufacturing line, and each calculator is classified as either defective or acceptable. Let A, B, and C denote the events that the first, second, and third calculators respectively, are defective. (a) Describe the sample space for this experiment with a tree diagram. Solution: [1.5 Marks] Let D denote a defective calculator and let A denote an acceptable calculator. Since the experiment consist to select three calculator in ordered way so we have the following tree diagram Then the sample space is given by S = { DDD, DDA, DAD, DAA, ADD, ADA, AAD, AAA } Use the tree diagram to describe each of the following events: (b) A. Solution: [1 Marks] We have (c) B. Solution: [1 Marks] We have (e) A B. Solution: [1 Marks] We have A = { DDD, DDA, DAD, DAA } B = { DDD, DDA, ADD, ADA } A B = { DDD, DDA } 3
16 Exercise 2 (14 Marks) PARTS A, B AND C ARE INDEPENDENT. A. The sample space of a random experiment is {a, b, c, d, e} with probabilities 0.1, 0.1, 0.2, 0.4, and 0.2, respectively. Let A denote the event {a, b, c}, and let B denote the event {c, d, e}. Determine the following: (a) P (A) Solution: [0.75 Marks] We have P (A) = P (a) + P (b) + P (c) = = 0.4 (b) P ( A C) = P (A ) Solution: [0.75 Marks] We have P ( A C) = 1 P (A) = = 0.6 (c) P (B) Solution: [0.75 Marks] We have P (B) = P (c) + P (d) + P (e) = = 0.8 (d) P (A B) Solution: [1 Marks] Since A B = {a, b, c, d, e} which is the sample space, then P (A B) = 1 (e) P (A B) Solution: [1 Marks] Since A B = {c} thus P (A B) = P (c) = 0.2 4
17 B. If A, B and C are mutually exclusive events with P (A) = 0.2, P (B) = 0.3, and P (C) = 0.4, find the following probabilities: (a) P (A B C) Solution: [1 Marks] Since the events are mutually exclusive, therefore P (A B C) = P (A) + P (B) + P (C) = = 0.9 (b) P (A B C) Solution: [1 Marks] Since A B C =, therefore P (A B C) = 0 (c) P (A B) Solution: [0.75 Marks] Since A B =, therefore P (A B) = 0 (d) P ( (A B) C ) Solution: [0.75 Marks] We recall that (A B) C = (A C) (B C) = Thus, P ( (A B) C ) = 0 (e) P ( A C B C C C) Solution: [0.75 Marks] We have P ( A C B C C C) = P ((A B C) C) = 1 P (A B C) = 1 ( ) = 0.1 5
18 C. Samples of a cast aluminum part are classified on the basis of surface finish (in microinches) and length measurements. The results of 100 parts are summarized as follows: Let A denote the event that a sample has excellent surface finish, and let B denote the event that a sample has excellent length. Determine: (a) P (A) Solution: [0.75 Marks] A denote the event that a sample has excellent surface finish, therefore P (A) = = 0.82 (b) P (B) Solution: [0.75 Marks] B denote the event that a sample has excellent length, therefore P (B) = = 0.90 (c) P (A B) Solution: [1 Mark] Using the definition of the conditional probability we get P (A B) = P (A B) P (B) = = 8 9 =
19 (d) P (B A) Solution: [1 Mark] Using the definition of the conditional probability we get P (B A) = P (A B) P (A) = = = (e) Are the events A and B independent or not? Justify your answer Solution: [1 Mark] Since we have from the previous P (A B) = and P (B A) = Thus P (A B) P (B A) and so the events A and B are not independent. (e) If the selected part has good length, what is the probability that the surface finish is excellent? Solution: [1 Mark] Let C denote the event that the selected part has good length; D denote the event that the surface finish is excellent. Thus, P (D C) = 2 10 =
20 Exercise 3 (9 Marks) A. The following table shows the probabilities of 0 through 4 companies that will be running out of business in a given year: x f X (x) = P (X = x) Verify that this is a probability distribution. Solution: [2 Marks] Since = 1 2. Find the mean and standard deviation of the distribution. Solution: [2 Marks] We have x xf X (x) x 2 f X (x) Then by using the previous table we get µ = x xf X (x) = = 1.6 σ = Var(X) = x 2 f X (x) µ 2 x = ( ) (1.6) 2 = = 2.7 =
21 B. Let X posses a density function { kx 2 (1 x 3 ) 0 x 1 f X (x) = 0 elsewhere 1. Find the value of the constant k. Solution: (1.75 Marks) Since f X is the probability density function of a given random variable then we need to choose k such that the sum of probability distribution function is equal to 1, i.e. + f X (x)dx = 1 The integral of the probability distribution function is + f X (x)dx = 1 = k k x 2 ( 1 x 3) dx ( x 2 x 5) dx [ x 3 = k 3 x6 6 ( 1 = k 3 1 ) 6 ( ) 2 1 = k 6 ] 1 0 and so we have k 6 = k 6 = 1 = k = 6. Therefore, the continuous random variable X has the probability density function { 6x 2 (1 x 3 ) 0 x 1 f X (x) = 0 elsewhere 9
22 2. Give the cumulative distribution function of X. Solution: (1.75 Marks) given by By definition the cumulative distribution function is F X (x) = x f X (t)dt Then we distinguish the following three situations: 1 st case: x 0, so t x 0. Thus we have f X (t) = 0 and so 2 nd case: 0 < x < 1, then 3 rd case: x 1, we have F X (x) = = F X (x) = 0 x 0 = 0 + x f X (t)dt f X (t)dt + 0 x 0 ( 6t 2 6t 5) dt f X (t)dt = [ 2t 3 t 6] x 0 = 2x3 x 6 F X (x) = = x 0 f X (t)dt f X (t)dt + 1 f X (t)dt + x 0 1 f X (t)dt = 0 + = ( 6t 2 6t 5) dt + 0 Therefore, the continuous random variable X has the cumulative distribution function 0 for x 0 F X (x) = 2x 3 x 6 for 0 < x < 1 1 for x 1 10
23 3. Give the mean and the variance of the random variable X. Solution: (1.5 Marks) Since X is a continuous random variable then the mean is given by The variance is given by E[X] = Var[X] = = = = = tf X (t)dt t6t 2 ( 1 t 3) dt 6 ( t 3 t 6) dt [ t 4 = 6 4 t7 7 ( 1 = ) ] 1 0 = = 9 14 t f X (t)dt (E[X])2 t 2 6t 2 ( 1 t 3) dt (E[X]) 2 6 ( t 4 t 7) dt (E[X]) 2 [ t 5 = 6 5 t8 8 ( 1 = ) 8 ] ( ) = = = =

24 12
25 Exercise 4 (8 Marks) Imagine that, it is collected data about the weights for 500 students from Al-Imam Muhammad Bin Saud Islamic University. It is found that the mean weight for that sample data µ = 68 kilogram and standard deviation σ = 219 kilogram. After testing the data, the study shows that the weights of the students are normally distributed, find how many students weight 1. Between 54 kilogram and 70 kilogram. Solution: (3 Marks) Let X be the students weight in a randomly chosen. Then, the question tells us that X Normal(µ = 68, σ = 219) and by using the normal distribution table we obtain ( P (54 X 70) = P 219 X ) = P ( 0, 06 Z 0, 01) [Z Normal(0, 1)] = P (Z 0, 01) P ( 0, 06 Z) = P (Z 0, 01) P ( 0, 06 Z) = = More than 84 kilogram. Solution: (3 Marks) We have P (X 84) = 1 P (X 84) = ( X 68 1 P 219 ) = 1 P (Z 0, 07) [Z Normal(0, 1)] = =
26 Exercise 5 (8 Marks) A store sells clothes for men. It has 3 different kinds of jackets, 7 different kinds of shirts, and 5 different kinds of pants. Next to the store, there is a Library which sells books, it has 8 different mystery books and 4 different history books. Find the number of ways, a costumer can buy: 1. One of the items from the store. Solution: (3 Marks) The number of ways is = One of each of the items from the store. Solution: (3 Marks) The number of ways is = books from the Library. Solution: (3 Marks) The number of ways is ( ) 12 C(12, 3) = = 12! = 3 3! 9! 6 =
27 Exercise 6 (8 Marks) The probability that a lab specimen contains high levels of contamination is Five samples are checked, and the samples are independent. 1. What is the probability that none contains high levels of contamination? Solution: [4 Marks] Let H i denote he event that the ii th sample contains high levels of contamination. Thus, since the samples are independent we get P ( ) H1 C H2 C H3 C H4 C H5 C = ( ) ( ) ( ) ( ) ( ) P H C 1 P H C 2 P H C 3 P H C 4 P H C 5 = (0.90) 5 = 0.59 (ii) What is the probability that exactly one contains high levels of contamination? Solution: [4 Marks] We have five possibilities for this situation: A 1 = H 1 H C 2 H C 3 H C 4 H C 5 ; A 2 = H C 1 H 2 H C 3 H C 4 H C 5 ; A 3 = H C 1 H C 2 H 3 H C 4 H C 5 ; A 4 = H C 1 H C 2 H C 3 H 4 H C 5 ; A 5 = H C 1 H C 2 H C 3 H C 4 H 5. The requested probability is the probability of the union A 1 A 2 A 3 A 4 A 5 and these events are mutually exclusive. Also, by independence Therefore, P (A i ) = (0.90) 4 (0.10) = P (A 1 A 2 A 3 A 4 A 5 ) = 5 ( (0.90) 4 (0.10) ) = 5(0.0656) =

28 MAT 301 & MAT 141 & STA 141 FINAL EXAM FINAL EXAM SOLUTIONS SEMESTER: SECOND YEAR: 1429/1430 COURSES: MAT 301 & MAT 141 & STA 111 DATE: 27/06/1430 (20/06/2009) DURATION: 2 HOURS Instructors: Drs. A. MUSTAFA, A. BARKAOUI, B. CHOURAR & A. S. BEN GHORBAL Name Section Student ID Your Signature TOTAL MARKS SCORE EXERCISE EXERCISE EXERCISE EXERCISE EXERCISE BONUS TOTAL IMAMU Page 1 of 6
29 MAT 301 & MAT 141 & STA 141 FINAL EXAM EXERCISE 1. (7 MARKS) The following display gives the number of Friday newspapers published in each of the 11 district of Kingdom of Saudi Arabia during ) (1.75 MARKS) Find the sample mean. 2) (2.25 MARKS) Find the variance 3) (3 MARKS) Find the quartiles Q 1, Q 2. SOLUTIONS 1. MEAN = s 2 = s = Q1 = 19, Q2 = 25 2 s and standard deviation s. EXERCISE 2. (10 MARKS) PART A. Suppose that a parking contains 24 cars where only six cars are BMW and 4 cars are Mercedes. Four cars are selected at random and without replacement for daily use. 1) (2 MARKS) What is the probability that exactly one car in the sample is a BMW one? 2) (2 MARKS) What is the probability that at least one car is BMW in the sample? 3) (2 MARKS) What is the probability that exactly one car is BMW in the sample and exactly one car is a Mercedes? SOLUTIONS IMAMU Page 2 of 6
30 MAT 301 & MAT 141 & STA 141 FINAL EXAM PART B. At a certain gas station, 40% of the customers use regular gasoline 91 (event A 1 ), 35% use super gasoline 95 (event A 2 ), and 25% use diesel (event A 3 ). Of those customers using regular gasoline 91, only 30% fill their tanks (event B). Of those customers using super gasoline 95, 60% fill their tanks, whereas of those using diesel, 50% fill their tanks. a. (1.75 MARKS) What is the probability that the next customer will request super gasoline 95 and fill the tank B?. A2 b. (1.75 MARKS) What is the probability that the next customer fills the tank? c. (2.50 MARKS) If the next customer fills the tank, what is the probability that regular gasoline 91 is requested? Super gasoline 95 is requested? Diesel is requested? SOLUTIONS SOLUTION P( A1 B) P( A ) P( B A) P( A2 B) P( A3 B) a. P(A 2 B) =.21 b. P(B) = P(A 1 B) + P(A 2 B) + P(A 3 B) =.455 P( A.12 c. P(A 1 B) = 1 B). 264 P( B) P(A 2 B) =. 462, P(A 3 B) = = IMAMU Page 3 of 6
31 MAT 301 & MAT 141 & STA 141 FINAL EXAM EXERCISE 3. (8 MARKS) PART A. An oil exploration company currently has two active projects, one in KSA and the other in Kuwait. Let A be the event that the event the Saudi project is successful and B be the event that the Kuwaiti project is successful. Suppose that A and B are independent events with P(A) = 0.4 and P(B) = 0.7. a. (2 MARKS) If the Saudi project is not successful, what is the probability that the Kuwaiti project is also not successful? Explain your answer. b. (2 MARKS) What is the probability that at least one of the two projects will be successful? SOLUTION a. Since the events are independent, then A and B are independent, too. (see paragraph below equation 2.7. P(B A ) =. P(B ) = =.3 b. P(A B)=P(A) + P(B) P(A) P(B) = (.4)(.7) =.82 PART B. A total of 46% of the voters in a certain city classify themselves as Independent, whereas 30% classify themselves as Liberals and 24% as Conservatives. In a recent local election, 35% of the Independents, 62% of the Liberals, and 58% of the Conservatives voted. A voter is chosen at random. a) (2 MARKS) What fraction of voters participated in the local election? b) (2 MARKS) Given that this person voted in the local election, what is that he or she is an Independent. SOLUTIONS IMAMU Page 4 of 6
32 MAT 301 & MAT 141 & STA 141 FINAL EXAM EXERCISE 4. (15 MARKS) 1) The random variable X has a binomial distribution with n = 10 and p = Determine the following probabilities. a. (1.25 MARKS) P X 5 b. (1.25 MARKS) P X 2 c. (1.25 MARKS) P X 9 SOLUTION 2) Automobiles arrive at a vehicle equipment inspection station according to a Poisson process with rate λ = 10 per hour. Suppose that with probability 0.5 an arriving vehicle will have no equipment violations. a. (1.50 MARKS) What is the probability that exactly 10 arrive during the hour? b. (1.50 MARKS) What is the probability that exactly 10 arrive during the hour and all 10 have no violations? SOLUTION P(y arrive and exactly 10 have no violations) = P(exactly 10 have no violations / y arrive). P(y arrive) P(10 successes in y trials when p.5) e 10 (10) y! y 10 y y 10 y (10) e (5) (.5) (.5) e 10 y! 10!( y 10)! y IMAMU Page 5 of 6
33 MAT 301 & MAT 141 & STA 141 FINAL EXAM 3) Let Z be a standard normal random variable, Z 0,1. a. (1.50 MARKS) Calculate the following probabilities P(1.51 Z 2.25). b. (1.50 MARKS) Determine the value of the constant c that makes the probability statement correct: P 0 Z c ) (3.25 MARKS) Suppose only 40% of all drivers in Florida regularly wear a seatbelt. A random sample of 500 drivers is selected. What is the probability that fewer than 175 of those in the sample regularly wear a seatbelt? (HINT: consider X the normal distribution with mean np and standard deviation npq ). SOLUTIONS n 500, p.4, 200, P( X 175) P( X 174) P(normal 174.5) P( Z 2.33).0099 EXERCISE BONUS (3 MARKS) Let X = the time between two successive arrivals at the drive-up window of a local bank. If X has an exponential distribution with 1, compute the following: a. (1 MARK) The expected time between two successive arrivals. b. (1 MARK) The standard deviation of the time between two successive arrivals. c. (1 MARK) PX ( 5). SOLUTIONS a. E( X) 1/ =1 b. 1/ =1 c. P( X 5) 1 e 1 e (1)(5) 5 = IMAMU Page 6 of 6

34
35
36
37
38
39
40
41
42
43
44
45
46
47
48
49
50
51
52
53
54
55
56
57

58
59
STA 584 Supplementary Examples (not to be graded) Fall, 2003
 Fall, 2003") Page 1 of 8 Central Michigan University Department of Mathematics STA 584 Supplementary Examples (not to be graded) Fall, 003 1. (a) If A and B are independent events, P(A) =.40 and P(B) =.70, find (i)
Page 1 of 8 Central Michigan University Department of Mathematics STA 584 Supplementary Examples (not to be graded) Fall, 003 1. (a) If A and B are independent events, P(A) =.40 and P(B) =.70, find (i)
2. A music library has 200 songs. How many 5 song playlists can be constructed in which the order of the songs matters?
 Practice roblems for final exam 1. A certain vault requires that an entry code be 8 characters. If the first 4 characters must be letters (repeated letters are allowed) and the last 4 characters are numeric
Chapter 1: Revie of Calculus and Probability
 Chapter 1: Revie of Calculus and Probability Refer to Text Book: Operations Research: Applications and Algorithms By Wayne L. Winston,Ch. 12 Operations Research: An Introduction By Hamdi Taha, Ch. 12 OR441-Dr.Khalid
Probability and Probability Distributions. Dr. Mohammed Alahmed
 Probability and Probability Distributions 1 Probability and Probability Distributions Usually we want to do more with data than just describing them! We might want to test certain specific inferences about
2014 SM4 Revision Questions Distributions
 2014 SM4 Revision Questions Distributions Normal Q1. Professor Halen has 184 students in his college mathematics class. The scores on the semester exam are normally distributed with a mean of 72.3 and
Random Variable And Probability Distribution. Is defined as a real valued function defined on the sample space S. We denote it as X, Y, Z,
 Random Variable And Probability Distribution Introduction Random Variable ( r.v. ) Is defined as a real valued function defined on the sample space S. We denote it as X, Y, Z, T, and denote the assumed
Chapter 3 Probability Distribution
 Chapter 3 Probability Distribution Probability Distributions A probability function is a function which assigns probabilities to the values of a random variable. Individual probability values may be denoted
********************************************************************************************************
 QUESTION # 1 1. Let the random variable X represent the number of telephone lines in use by the technical support center of a software manufacturer at noon each day. The probability distribution of X is
Expectations. Definition Let X be a discrete rv with set of possible values D and pmf p(x). The expected value or mean value of X, denoted by E(X ) or
. The expected value or mean value of X, denoted by E(X ) or") Expectations Expectations Definition Let X be a discrete rv with set of possible values D and pmf p(x). The expected value or mean value of X, denoted by E(X ) or µ X, is E(X ) = µ X = x D x p(x) Expectations
Expectations Expectations Definition Let X be a discrete rv with set of possible values D and pmf p(x). The expected value or mean value of X, denoted by E(X ) or µ X, is E(X ) = µ X = x D x p(x) Expectations
STAT 516 Midterm Exam 2 Friday, March 7, 2008
 STAT 516 Midterm Exam 2 Friday, March 7, 2008 Name Purdue student ID (10 digits) 1. The testing booklet contains 8 questions. 2. Permitted Texas Instruments calculators: BA-35 BA II Plus BA II Plus Professional
Discrete Distributions
 Discrete Distributions Applications of the Binomial Distribution A manufacturing plant labels items as either defective or acceptable A firm bidding for contracts will either get a contract or not A marketing
Exercises in Probability Theory Paul Jung MA 485/585-1C Fall 2015 based on material of Nikolai Chernov
 Exercises in Probability Theory Paul Jung MA 485/585-1C Fall 2015 based on material of Nikolai Chernov Many of the exercises are taken from two books: R. Durrett, The Essentials of Probability, Duxbury
Discrete Probability Distributions
 Discrete Probability Distributions Chapter 06 McGraw-Hill/Irwin Copyright 2013 by The McGraw-Hill Companies, Inc. All rights reserved. LEARNING OBJECTIVES LO 6-1 Identify the characteristics of a probability
MIT Arts, Commerce and Science College, Alandi, Pune DEPARTMENT OF STATISTICS. Question Bank. Statistical Methods-I
 Q1 Q2 Q3 Q4 Q5 Q6 Q7 Q8 Q9 MIT Arts, Commerce and Science College, Alandi, Pune DEPARTMENT OF STATISTICS Question Bank Statistical Methods-I Questions for 2 marks Define the following terms: a. Class limits
Exam III Review Math-132 (Sections 7.1, 7.2, 7.3, 7.4, 7.5, 7.6, 8.1, 8.2, 8.3)
") 1 Exam III Review Math-132 (Sections 7.1, 7.2, 7.3, 7.4, 7.5, 7.6, 8.1, 8.2, 8.3) On this exam, questions may come from any of the following topic areas: - Union and intersection of sets - Complement of
1 Exam III Review Math-132 (Sections 7.1, 7.2, 7.3, 7.4, 7.5, 7.6, 8.1, 8.2, 8.3) On this exam, questions may come from any of the following topic areas: - Union and intersection of sets - Complement of
Introduction to Statistical Data Analysis Lecture 3: Probability Distributions
 Introduction to Statistical Data Analysis Lecture 3: Probability Distributions James V. Lambers Department of Mathematics The University of Southern Mississippi James V. Lambers Statistical Data Analysis
SECOND UNIVERSITY EXAMINATION
 OLLSCOIL NA héireann, GAILLIMH NATIONAL UNIVERSITY OF IRELAND, GALWAY AUTUMN EXAMINATIONS, 2000 2001 SECOND UNIVERSITY EXAMINATION STATISTICS [MA237] Dr. D. Harrington, Dr. J.N. Sheahan, Paul Wilson, M.A.,
MAE Probability and Statistical Methods for Engineers - Spring 2016 Final Exam, June 8
 MAE 18 - Probability and Statistical Methods for Engineers - Spring 16 Final Exam, June 8 Instructions (i) One (two-sided) cheat sheet, book tables, and a calculator with no communication capabilities
Practice Questions for Final
 Math 39 Practice Questions for Final June. 8th 4 Name : 8. Continuous Probability Models You should know Continuous Random Variables Discrete Probability Distributions Expected Value of Discrete Random
Applied Statistics I
 Applied Statistics I (IMT224β/AMT224β) Department of Mathematics University of Ruhuna A.W.L. Pubudu Thilan Department of Mathematics University of Ruhuna Applied Statistics I(IMT224β/AMT224β) 1/158 Chapter
An-Najah National University Faculty of Engineering Industrial Engineering Department. Course : Quantitative Methods (65211)
") An-Najah National University Faculty of Engineering Industrial Engineering Department Course : Quantitative Methods (65211) Instructor: Eng. Tamer Haddad 2 nd Semester 2009/2010 Chapter 3 Discrete Random
An-Najah National University Faculty of Engineering Industrial Engineering Department Course : Quantitative Methods (65211) Instructor: Eng. Tamer Haddad 2 nd Semester 2009/2010 Chapter 3 Discrete Random
a. The sample space consists of all pairs of outcomes:
 Econ 250 Winter 2009 Assignment 1 Due at Midterm February 11, 2009 There are 9 questions with each one worth 10 marks. 1. The time (in seconds) that a random sample of employees took to complete a task
EDEXCEL S2 PAPERS MARK SCHEMES AVAILABLE AT:
 EDEXCEL S2 PAPERS 2009-2007. MARK SCHEMES AVAILABLE AT: http://www.physicsandmathstutor.com/a-level-maths-papers/s2-edexcel/ JUNE 2009 1. A bag contains a large number of counters of which 15% are coloured
Discrete Probability Distributions
 Discrete Probability Distributions Chapter 6 McGraw-Hill/Irwin Copyright 2012 by The McGraw-Hill Companies, Inc. All rights reserved. LO5 Describe and compute probabilities for a binomial distribution.
Outline PMF, CDF and PDF Mean, Variance and Percentiles Some Common Distributions. Week 5 Random Variables and Their Distributions
 Week 5 Random Variables and Their Distributions Week 5 Objectives This week we give more general definitions of mean value, variance and percentiles, and introduce the first probability models for discrete
( ) P A B : Probability of A given B. Probability that A happens
 P A B : Probability of A given B. Probability that A happens") A B A or B One or the other or both occurs At least one of A or B occurs Probability Review A B A and B Both A and B occur ( ) P A B : Probability of A given B. Probability that A happens given that B
A B A or B One or the other or both occurs At least one of A or B occurs Probability Review A B A and B Both A and B occur ( ) P A B : Probability of A given B. Probability that A happens given that B
Math st Homework. First part of Chapter 2. Due Friday, September 17, 1999.
 Math 447. 1st Homework. First part of Chapter 2. Due Friday, September 17, 1999. 1. How many different seven place license plates are possible if the first 3 places are to be occupied by letters and the
Stat 2300 International, Fall 2006 Sample Midterm. Friday, October 20, Your Name: A Number:
 Stat 2300 International, Fall 2006 Sample Midterm Friday, October 20, 2006 Your Name: A Number: The Midterm consists of 35 questions: 20 multiple-choice questions (with exactly 1 correct answer) and 15
Chapter 6 Continuous Probability Distributions
 Math 3 Chapter 6 Continuous Probability Distributions The observations generated by different statistical experiments have the same general type of behavior. The followings are the probability distributions
Discrete Distributions
 A simplest example of random experiment is a coin-tossing, formally called Bernoulli trial. It happens to be the case that many useful distributions are built upon this simplest form of experiment, whose
EXAM. Exam #1. Math 3342 Summer II, July 21, 2000 ANSWERS
 EXAM Exam # Math 3342 Summer II, 2 July 2, 2 ANSWERS i pts. Problem. Consider the following data: 7, 8, 9, 2,, 7, 2, 3. Find the first quartile, the median, and the third quartile. Make a box and whisker
Discrete probability distributions
 Discrete probability s BSAD 30 Dave Novak Fall 08 Source: Anderson et al., 05 Quantitative Methods for Business th edition some slides are directly from J. Loucks 03 Cengage Learning Covered so far Chapter
Business Statistics Winter Quarter 2013 Practice Midterm Exam
 Business Statistics 4000 Winter Quarter 203 Practice Midterm Exam. (a) Answer TRUE or FALSE. A binomial distribution with n = 00 and p = 0.65 is best approximated by a normal distribution with mean µ =
A Probability Primer. A random walk down a probabilistic path leading to some stochastic thoughts on chance events and uncertain outcomes.
 A Probability Primer A random walk down a probabilistic path leading to some stochastic thoughts on chance events and uncertain outcomes. Are you holding all the cards?? Random Events A random event, E,
S2 QUESTIONS TAKEN FROM JANUARY 2006, JANUARY 2007, JANUARY 2008, JANUARY 2009
 S2 QUESTIONS TAKEN FROM JANUARY 2006, JANUARY 2007, JANUARY 2008, JANUARY 2009 SECTION 1 The binomial and Poisson distributions. Students will be expected to use these distributions to model a real-world
Chapter 3. Discrete Random Variables and Their Probability Distributions
 Chapter 3. Discrete Random Variables and Their Probability Distributions 2.11 Definition of random variable 3.1 Definition of a discrete random variable 3.2 Probability distribution of a discrete random
Math Fall 2010 Some Old Math 302 Exams There is always a danger when distributing old exams for a class that students will rely on them
 Math 302.102 Fall 2010 Some Old Math 302 Exams There is always a danger when distributing old exams for a class that students will rely on them solely for their final exam preparations. The final exam
Assignment 2 SOLUTIONS
 MATHEMATICS 01-10-LW Business Statistics Martin Huard Fall 00 Assignment SOLUTIONS This assignment is due on Friday September 6 at the beginning of the class. Question 1 ( points) In a marketing research,
Known probability distributions
 Known probability distributions Engineers frequently wor with data that can be modeled as one of several nown probability distributions. Being able to model the data allows us to: model real systems design
2.3 Conditional Probability
 Arkansas Tech University MATH 3513: Applied Statistics I Dr. Marcel B. Finan 2.3 Conditional Probability In this section we introduce the concept of conditional probability. So far, the notation P (A)
MATH 250 / SPRING 2011 SAMPLE QUESTIONS / SET 3
 MATH 250 / SPRING 2011 SAMPLE QUESTIONS / SET 3 1. A four engine plane can fly if at least two engines work. a) If the engines operate independently and each malfunctions with probability q, what is the
ST 371 (IX): Theories of Sampling Distributions
: Theories of Sampling Distributions") ST 371 (IX): Theories of Sampling Distributions 1 Sample, Population, Parameter and Statistic The major use of inferential statistics is to use information from a sample to infer characteristics about
ST 371 (IX): Theories of Sampling Distributions 1 Sample, Population, Parameter and Statistic The major use of inferential statistics is to use information from a sample to infer characteristics about
A survey of Probability concepts. Chapter 5
 A survey of Probability concepts Chapter 5 Learning Objectives Define probability. Explain the terms experiment, event, outcome. Define the terms conditional probability and joint probability. Calculate
Q1 Own your learning with flash cards.
 For this data set, find the mean, mode, median and inter-quartile range. 2, 5, 6, 4, 7, 4, 7, 2, 8, 9, 4, 11, 9, 9, 6 Q1 For this data set, find the sample variance and sample standard deviation. 89, 47,
Notes for Math 324, Part 19
 48 Notes for Math 324, Part 9 Chapter 9 Multivariate distributions, covariance Often, we need to consider several random variables at the same time. We have a sample space S and r.v. s X, Y,..., which
Probability and Discrete Distributions
 AMS 7L LAB #3 Fall, 2007 Objectives: Probability and Discrete Distributions 1. To explore relative frequency and the Law of Large Numbers 2. To practice the basic rules of probability 3. To work with the
STAT 2507 H Assignment # 2 (Chapters 4, 5, and 6) Due: Monday, March 2, 2015, in class
 Due: Monday, March 2, 2015, in class") STAT 2507 H Assignment # 2 (Chapters 4, 5, and 6) Due: Monday, March 2, 2015, in class Last Name First Name - Student # LAB Section - Note: Use spaces left to answer all questions. The total of marks for
STAT 2507 H Assignment # 2 (Chapters 4, 5, and 6) Due: Monday, March 2, 2015, in class Last Name First Name - Student # LAB Section - Note: Use spaces left to answer all questions. The total of marks for
Basic Concepts of Probability. Section 3.1 Basic Concepts of Probability. Probability Experiments. Chapter 3 Probability
 Chapter 3 Probability 3.1 Basic Concepts of Probability 3.2 Conditional Probability and the Multiplication Rule 3.3 The Addition Rule 3.4 Additional Topics in Probability and Counting Section 3.1 Basic
IE 336 Seat # Name (clearly) < KEY > Open book and notes. No calculators. 60 minutes. Cover page and five pages of exam.
 < KEY > Open book and notes. No calculators. 60 minutes. Cover page and five pages of exam.") Open book and notes. No calculators. 60 minutes. Cover page and five pages of exam. This test covers through Chapter 2 of Solberg (August 2005). All problems are worth five points. To receive full credit,
Open book and notes. No calculators. 60 minutes. Cover page and five pages of exam. This test covers through Chapter 2 of Solberg (August 2005). All problems are worth five points. To receive full credit,
DISTRIBUTIONAL APPROXIMATIONS
 DISTRIBUTIONAL APPROXIMATIONS BINOMIAL TO POISSON Question 1 (**) The discrete random variable X has probability distribution X ~ B( 125,0.02). Use a distributional approximation, to find P( 2 X 6)
PRACTICE PROBLEMS FOR EXAM 2
 PRACTICE PROBLEMS FOR EXAM 2 Math 3160Q Fall 2015 Professor Hohn Below is a list of practice questions for Exam 2. Any quiz, homework, or example problem has a chance of being on the exam. For more practice,
Topic 5 Part 3 [257 marks]
![Topic 5 Part 3 [257 marks]](/thumbs/89/98286032.jpg "Topic 5 Part 3 [257 marks]") Topic 5 Part 3 [257 marks] Let 0 3 A = ( ) and 2 4 4 0 B = ( ). 5 1 1a. AB. 1b. Given that X 2A = B, find X. The following table shows the probability distribution of a discrete random variable X. 2a.
Topic 5 Part 3 [257 marks] Let 0 3 A = ( ) and 2 4 4 0 B = ( ). 5 1 1a. AB. 1b. Given that X 2A = B, find X. The following table shows the probability distribution of a discrete random variable X. 2a.
Lecture 20 Random Samples 0/ 13
 0/ 13 One of the most important concepts in statistics is that of a random sample. The definition of a random sample is rather abstract. However it is critical to understand the idea behind the definition,
Name of the Student: Problems on Discrete & Continuous R.Vs
 SUBJECT NAME : Probability & Random Processes SUBJECT CODE : MA645 MATERIAL NAME : Additional Problems MATERIAL CODE : JM08AM004 REGULATION : R03 UPDATED ON : March 05 (Scan the above QR code for the direct
Notes for Math 324, Part 17
 126 Notes for Math 324, Part 17 Chapter 17 Common discrete distributions 17.1 Binomial Consider an experiment consisting by a series of trials. The only possible outcomes of the trials are success and
Given a experiment with outcomes in sample space: Ω Probability measure applied to subsets of Ω: P[A] 0 P[A B] = P[A] + P[B] P[AB] = P(AB)
![Given a experiment with outcomes in sample space: Ω Probability measure applied to subsets of Ω: P[A] 0 P[A B] = P[A] + P[B] P[AB] = P(AB)](/thumbs/85/93046753.jpg "Given a experiment with outcomes in sample space: Ω Probability measure applied to subsets of Ω: P[A] 0 P[A B] = P[A] + P[B] P[AB] = P(AB)") 1 16.584: Lecture 2 : REVIEW Given a experiment with outcomes in sample space: Ω Probability measure applied to subsets of Ω: P[A] 0 P[A B] = P[A] + P[B] if AB = P[A B] = P[A] + P[B] P[AB] P[A] = 1 P[A
1 16.584: Lecture 2 : REVIEW Given a experiment with outcomes in sample space: Ω Probability measure applied to subsets of Ω: P[A] 0 P[A B] = P[A] + P[B] if AB = P[A B] = P[A] + P[B] P[AB] P[A] = 1 P[A
STAT509: Discrete Random Variable
 University of South Carolina September 16, 2014 Motivation So far, we have already known how to calculate probabilities of events. Suppose we toss a fair coin three times, we know that the probability
Math 151. Rumbos Fall Solutions to Review Problems for Final Exam
 Math 5. Rumbos Fall 23 Solutions to Review Problems for Final Exam. Three cards are in a bag. One card is red on both sides. Another card is white on both sides. The third card in red on one side and white
Conditional probability
 CHAPTER 4 Conditional probability 4.1. Introduction Suppose there are 200 men, of which 100 are smokers, and 100 women, of which 20 are smokers. What is the probability that a person chosen at random will
Chapter 2. Probability
 2-1 Chapter 2 Probability 2-2 Section 2.1: Basic Ideas Definition: An experiment is a process that results in an outcome that cannot be predicted in advance with certainty. Examples: rolling a die tossing
Conditional Probability
 Conditional Probability Conditional Probability The Law of Total Probability Let A 1, A 2,..., A k be mutually exclusive and exhaustive events. Then for any other event B, P(B) = P(B A 1 ) P(A 1 ) + P(B
Probability Exercises. Problem 1.
 Probability Exercises. Ma 162 Spring 2010 Ma 162 Spring 2010 April 21, 2010 Problem 1. ˆ Conditional Probability: It is known that a student who does his online homework on a regular basis has a chance
STAT/MA 416 Answers Homework 6 November 15, 2007 Solutions by Mark Daniel Ward PROBLEMS
 STAT/MA 4 Answers Homework November 5, 27 Solutions by Mark Daniel Ward PROBLEMS Chapter Problems 2a. The mass p, corresponds to neither of the first two balls being white, so p, 8 7 4/39. The mass p,
STAT/MA 416 Midterm Exam 2 Thursday, October 18, Circle the section you are enrolled in:
 STAT/MA 46 Midterm Exam 2 Thursday, October 8, 27 Name Purdue student ID ( digits) Circle the section you are enrolled in: STAT/MA 46-- STAT/MA 46-2- 9: AM :5 AM 3: PM 4:5 PM REC 4 UNIV 23. The testing
II. The Binomial Distribution
 88 CHAPTER 4 PROBABILITY DISTRIBUTIONS 進佳數學團隊 Dr. Herbert Lam 林康榮博士 HKDSE Mathematics M1 II. The Binomial Distribution 1. Bernoulli distribution A Bernoulli eperiment results in any one of two possible
Example. What is the sample space for flipping a fair coin? Rolling a 6-sided die? Find the event E where E = {x x has exactly one head}
 Chapter 7 Notes 1 (c) Epstein, 2013 CHAPTER 7: PROBABILITY 7.1: Experiments, Sample Spaces and Events Chapter 7 Notes 2 (c) Epstein, 2013 What is the sample space for flipping a fair coin three times?
Math 10 - Compilation of Sample Exam Questions + Answers
 Math 10 - Compilation of Sample Exam Questions + Sample Exam Question 1 We have a population of size N. Let p be the independent probability of a person in the population developing a disease. Answer the
Lecture Notes for BUSINESS STATISTICS - BMGT 571. Chapters 1 through 6. Professor Ahmadi, Ph.D. Department of Management
 Lecture Notes for BUSINESS STATISTICS - BMGT 571 Chapters 1 through 6 Professor Ahmadi, Ph.D. Department of Management Revised May 005 Glossary of Terms: Statistics Chapter 1 Data Data Set Elements Variable
2) Are the events A and B independent? Say why or why not [Sol] No : P (A B) =0.12 is not equal to P (A) P (B) = =
![2) Are the events A and B independent? Say why or why not [Sol] No : P (A B) =0.12 is not equal to P (A) P (B) = =](/thumbs/88/114746665.jpg "2) Are the events A and B independent? Say why or why not [Sol] No : P (A B) =0.12 is not equal to P (A) P (B) = =") Stat 516 (Spring 2012) Hw 1 (due Feb. 2, Thursday) Question 1 Suppose P (A) =0.45, P (B) =0.32 and P (Ā B) =0.20. 1) Find P (A B) [Sol] Since P (B) =P (A B)+P (Ā B), P (A B) =P (B) P (Ā B) =0.32 0.20 =
Stat 516 (Spring 2012) Hw 1 (due Feb. 2, Thursday) Question 1 Suppose P (A) =0.45, P (B) =0.32 and P (Ā B) =0.20. 1) Find P (A B) [Sol] Since P (B) =P (A B)+P (Ā B), P (A B) =P (B) P (Ā B) =0.32 0.20 =
Brief Review of Probability
 Maura Department of Economics and Finance Università Tor Vergata Outline 1 Distribution Functions Quantiles and Modes of a Distribution 2 Example 3 Example 4 Distributions Outline Distribution Functions
MATH 3200 PROBABILITY AND STATISTICS M3200FL081.1
 MATH 3200 PROBABILITY AND STATISTICS M3200FL081.1 This examination has twenty problems, of which the first seventeen are modifications of the recommended homework problems. The remaining three problems
MAT 2379, Introduction to Biostatistics, Sample Calculator Questions 1. MAT 2379, Introduction to Biostatistics
 MAT 2379, Introduction to Biostatistics, Sample Calculator Questions 1 MAT 2379, Introduction to Biostatistics Sample Calculator Problems for the Final Exam Note: The exam will also contain some problems
Paper Reference. Statistics S2 Advanced/Advanced Subsidiary. Monday 1 June 2009 Morning Time: 1 hour 30 minutes
 Centre No. Candidate No. Paper Reference(s) 6684/01 Edexcel GCE Statistics S2 Advanced/Advanced Subsidiary Monday 1 June 2009 Morning Time: 1 hour 30 minutes Materials required for examination Mathematical
CONTINUOUS RANDOM VARIABLES
 the Further Mathematics network www.fmnetwork.org.uk V 07 REVISION SHEET STATISTICS (AQA) CONTINUOUS RANDOM VARIABLES The main ideas are: Properties of Continuous Random Variables Mean, Median and Mode
PROBABILITY.
 PROBABILITY PROBABILITY(Basic Terminology) Random Experiment: If in each trial of an experiment conducted under identical conditions, the outcome is not unique, but may be any one of the possible outcomes,
MIT : Quantitative Reasoning and Statistical Methods for Planning I
 MIT 11.220 Spring 06 March 2, 2006 MIT - 11.220: Quantitative Reasoning and Statistical Methods for Planning I I. Probability Recitation #2: Spring 2006 Probability, Normal Distribution, and Binomial Distribution
Chapter (4) Discrete Probability Distributions Examples
 Discrete Probability Distributions Examples") Chapter (4) Discrete Probability Distributions Examples Example () Two balanced dice are rolled. Let X be the sum of the two dice. Obtain the probability distribution of X. Solution When the two balanced
Chapter (4) Discrete Probability Distributions Examples Example () Two balanced dice are rolled. Let X be the sum of the two dice. Obtain the probability distribution of X. Solution When the two balanced
Engineering Mathematics : Probability & Queueing Theory SUBJECT CODE : MA 2262 X find the minimum value of c.
 SUBJECT NAME : Probability & Queueing Theory SUBJECT CODE : MA 2262 MATERIAL NAME : University Questions MATERIAL CODE : SKMA104 UPDATED ON : May June 2013 Name of the Student: Branch: Unit I (Random Variables)
Math 2311 Test 1 Review. 1. State whether each situation is categorical or quantitative. If quantitative, state whether it s discrete or continuous.
 Math 2311 Test 1 Review Know all definitions! 1. State whether each situation is categorical or quantitative. If quantitative, state whether it s discrete or continuous. a. The amount a person grew (in
Week 04 Discussion. a) What is the probability that of those selected for the in-depth interview 4 liked the new flavor and 1 did not?
 What is the probability that of those selected for the in-depth interview 4 liked the new flavor and 1 did not?") STAT Wee Discussion Fall 7. A new flavor of toothpaste has been developed. It was tested by a group of people. Nine of the group said they lied the new flavor, and the remaining 6 indicated they did not.
STAT Wee Discussion Fall 7. A new flavor of toothpaste has been developed. It was tested by a group of people. Nine of the group said they lied the new flavor, and the remaining 6 indicated they did not.
SL - Binomial Questions
 IB Questionbank Maths SL SL - Binomial Questions 262 min 244 marks 1. A random variable X is distributed normally with mean 450 and standard deviation 20. Find P(X 475). Given that P(X > a) = 0.27, find
Mathematics 102 Solutions for HWK 22 SECTION 7.6 P (R 1 )=0.05
=0.05") Mathematics 102 Solutions for HWK 22 SECTION 7.6 p 368 Problem 3. Assume R 1, R 2, and R 3 are mutually exclusive events and we have P (R 1 )0.05 P (R 2 )0.6 P (R 3 )0.35 P (Q R 1 )0.4 P (Q R 2 )0.3 P
Mathematics 102 Solutions for HWK 22 SECTION 7.6 p 368 Problem 3. Assume R 1, R 2, and R 3 are mutually exclusive events and we have P (R 1 )0.05 P (R 2 )0.6 P (R 3 )0.35 P (Q R 1 )0.4 P (Q R 2 )0.3 P
MATH Introduction to MATLAB
 KINGDOM OF SAUDI ARABIA - AL-IMAM MUHAMMAD BIN SAUD ISLAMIC UNIVERSITY - FACULTY OF SCIENCES - - May 9, 2011 Semester 2, 1431-1432 (2010-20111) MATH 251 - Introduction to MATLAB Exercise sheet 6 Dr. Samy
Section 4.2 Basic Concepts of Probability
 Section 4.2 Basic Concepts of Probability 2012 Pearson Education, Inc. All rights reserved. 1 of 88 Section 4.2 Objectives Identify the sample space of a probability experiment Identify simple events Use
1. Summarize the sample categorical data by creating a frequency table and bar graph. Y Y N Y N N Y Y Y N Y N N N Y Y Y N Y Y
 Lesson 2 1. Summarize the sample categorical data by creating a frequency table and bar graph. Y Y N Y N N Y Y Y N Y N N N Y Y Y N Y Y 2. Explain sample quantitative data summary using CUSS. 3. Sketch
Tribhuvan University Institute of Science and Technology 2065
 1CSc. Stat. 108-2065 Tribhuvan University Institute of Science and Technology 2065 Bachelor Level/First Year/ First Semester/ Science Full Marks: 60 Computer Science and Information Technology (Stat. 108)
1. Consider the independent events A and B. Given that P(B) = 2P(A), and P(A B) = 0.52, find P(B). (Total 7 marks)
 = 2P(A), and P(A B) = 0.52, find P(B). (Total 7 marks)") 1. Consider the independent events A and B. Given that P(B) = 2P(A), and P(A B) = 0.52, find P(B). (Total 7 marks) 2. In a school of 88 boys, 32 study economics (E), 28 study history (H) and 39 do not
1. Consider the independent events A and B. Given that P(B) = 2P(A), and P(A B) = 0.52, find P(B). (Total 7 marks) 2. In a school of 88 boys, 32 study economics (E), 28 study history (H) and 39 do not
Counting principles, including permutations and combinations.
 1 Counting principles, including permutations and combinations. The binomial theorem: expansion of a + b n, n ε N. THE PRODUCT RULE If there are m different ways of performing an operation and for each
Statistics 2. Revision Notes
 Statistics 2 Revision Notes June 2016 2 S2 JUNE 2016 SDB Statistics 2 1 The Binomial distribution 5 Factorials... 5 Combinations... 5 Properties of n C r... 5 Binomial Theorem... 6 Binomial coefficients...
Test 2 VERSION B STAT 3090 Spring 2017
 Multiple Choice: (Questions 1 20) Answer the following questions on the scantron provided using a #2 pencil. Bubble the response that best answers the question. Each multiple choice correct response is
Discrete Distributions
 Discrete Distributions STA 281 Fall 2011 1 Introduction Previously we defined a random variable to be an experiment with numerical outcomes. Often different random variables are related in that they have
Sketch the graph of the function. You are not required to find the coordinates of the maximum. (1) (b) Find the value of k. (5) (Total 6 marks)
 (b) Find the value of k. (5) (Total 6 marks)") 1. The random variable X has probability density function f where kx( x 1)(2 x), 0 x 2 0, otherwise. Sketch the graph of the function. You are not required to find the coordinates of the maximum. (1) Find
1. The random variable X has probability density function f where kx( x 1)(2 x), 0 x 2 0, otherwise. Sketch the graph of the function. You are not required to find the coordinates of the maximum. (1) Find
Chapter 6 Continuous Probability Distributions
 Continuous Probability Distributions Learning Objectives 1. Understand the difference between how probabilities are computed for discrete and continuous random variables. 2. Know how to compute probability
System Simulation Part II: Mathematical and Statistical Models Chapter 5: Statistical Models
 System Simulation Part II: Mathematical and Statistical Models Chapter 5: Statistical Models Fatih Cavdur fatihcavdur@uludag.edu.tr March 20, 2012 Introduction Introduction The world of the model-builder
Mathematics 375 Probability and Statistics I Final Examination Solutions December 14, 2009
 Mathematics 375 Probability and Statistics I Final Examination Solutions December 4, 9 Directions Do all work in the blue exam booklet. There are possible regular points and possible Extra Credit points.
MTH302 Long Solved Questions By
 MTH30 Long Solved uestions By www.vuattach.ning.com If you toss a die and observe the number of dots that appears on top face then write the events that the even number occurs. Number of Possible outcomes
AP Statistics Review Ch. 7
 AP Statistics Review Ch. 7 Name 1. Which of the following best describes what is meant by the term sampling variability? A. There are many different methods for selecting a sample. B. Two different samples
Point Estimation and Confidence Interval
 Chapter 8 Point Estimation and Confidence Interval 8.1 Point estimator The purpose of point estimation is to use a function of the sample data to estimate the unknown parameter. Definition 8.1 A parameter
Discrete Probability Distributions
 Discrete Probability Distributions EGR 260 R. Van Til Industrial & Systems Engineering Dept. Copyright 2013. Robert P. Van Til. All rights reserved. 1 What s It All About? The behavior of many random processes
Math P (A 1 ) =.5, P (A 2 ) =.6, P (A 1 A 2 ) =.9r
 =.5, P (A 2 ) =.6, P (A 1 A 2 ) =.9r") Math 3070 1. Treibergs σιι First Midterm Exam Name: SAMPLE January 31, 2000 (1. Compute the sample mean x and sample standard deviation s for the January mean temperatures (in F for Seattle from 1900 to
Math 3070 1. Treibergs σιι First Midterm Exam Name: SAMPLE January 31, 2000 (1. Compute the sample mean x and sample standard deviation s for the January mean temperatures (in F for Seattle from 1900 to