Introduction to repairable systems STK4400 Spring 2011
|
|
|
- Osborne Douglas
- 5 years ago
- Views:
Transcription
1 Introduction to repairable systems STK4400 Spring 2011 Bo Lindqvist bo/ Bo Lindqvist Introduction to repairable systems

2 Definition of repairable system Ascher and Feingold (1984): A repairable system is a system which, after failing to perform one or more of its functions satisfactorily, can be restored to fully satisfactory performance by any method, other than replacement of the entire system. Bo Lindqvist The trend-renewal process
3 Ascher and Feingold s mission in 1984 Ascher and Feingold presented the following example of a happy and sad system: Their claim: Reliability engineers do not recognize the difference between these cases since they always treat times between failures as i.i.d. and fit probability models like Weibull. Use nonstationary stochastic point process models to analyze repairable systems data! Bo Lindqvist The trend-renewal process
4 Today: Recurrent events extensively studied 0 T 1 T 2 T N τ Observe events occurring in time Applications: engineering and reliability studies, public health, clinical trials, politics, finance, insurance, sociology, etc. Reliability applications: breakdown or failure of a mechanical or electronic system discovery of a bug in an operating system software the occurrence of a crack in concrete structures the breakdown of a fiber in fibrous composites Warranty claims of manufactured products Bo Lindqvist The trend-renewal process
5 Important aspects for modelling and analysis 0 T 1 T 2 T N τ Trend in times between events? Renewals at events? Randomness of events? Dependence on covariates? Unobserved heterogeneity ( frailty, random effects ) among individual processes? Dependence between event process and the censoring at τ? Bo Lindqvist The trend-renewal process
6 Typical data format 0 T 11 T 21 T N11 τ 1 0 T 1j T 2j T Nj j τ j. 0 T 1m T 2m T Nmm τ m Covariates if available (fixed or time-varying):. X j (t); j = 1, 2,...,m Bo Lindqvist The trend-renewal process
7 Proschan (1963): The classical aircondition data Times of failures of aircondition system in a fleet of Boeing 720 airplanes Bo Lindqvist The trend-renewal process
8 Nelson (1995): Valve seat data Times of valve-seat replacements in a fleet of 41 diesel engines Event Plot for Valve Seat Replacements Diesel Engine Time Bo Lindqvist The trend-renewal process
9 Barlow and Davis (1977): Tractor data Bo Lindqvist The trend-renewal process
10 Basic models for repairable systems 0 T 1 T 2 T N τ RP(F): Renewal process with interarrival distribution F. Defining property: Times between events are i.i.d. with distribution F NHPP(λ( )): Nonhomogeneous Poisson process with intensity λ(t). Defining property: 1 Number of events in (0,t] is Poisson-distributed with expectation t 0 λ(u)du 2 Number of events in disjoint time intervals are stochastically independent Bo Lindqvist The trend-renewal process
11 Point process modelling of recurrent event processes t 0 T 1 T 2 T N τ φ(t F t ) F t = history of events until time t. Conditional intensity at t given history until time t, φ(t F t ) = lim t 0 Pr(failure in [t, t + t) F t ) t Bo Lindqvist The trend-renewal process
12 Special cases: The basic models NHPP(λ( )): φ(t F t ) = λ(t) so conditional intensity is independent of history. Interpreted as minimal repair at failures RP(F) (where F has hazard rate z( )): φ(t F t ) = z(t T N(t ) ) so conditional intensity depends (only) on time since last event. Interpreted as perfect repair at failures Between minimal and perfect repair? Imperfect repair models. Bo Lindqvist The trend-renewal process
13 Trend Renewal Process TRP (BL, Elvebakk and Heggland 2003) Trend function: λ(t) (cumulative Λ(t) = t 0 λ(u)du) Renewal distribution: F with expected value 1 (for uniqueness) 0 T 1 T 2 T 3 t TRP(F, λ( )) RP(F) 0 Λ(T 1 ) Λ(T 2 ) Λ(T 3 ) SPECIAL CASES: NHPP: F is standard exponential distribution RP: λ(t) is constant in t Bo Lindqvist The trend-renewal process
14 Motivation for TRP: Well known property of NHPP 0 T 1 T 2 T 3 t NHPP(λ( )) HPP(1) 0 Λ(T 1 ) Λ(T 2 ) Λ(T 3 ) Bo Lindqvist The trend-renewal process
15 Point process formulation of TRP: Conditional intensity of TRP(F, λ( )): φ(t F t ) = z(λ(t) Λ(T N(t ) ))λ(t) where z( ) is hazard rate of F Recall special cases: NHPP: z( ) 1, implies φ(t F t ) = λ(t) RP: λ( ) 1, implies φ(t F t ) = z(t T N(t ) ) Bo Lindqvist The trend-renewal process
16 Comparison of NHPP, TRP and RP: Conditional intensities Conditional intensity Time Example: Failures observed at times 1.0 and Conditional intensities for NHPP (solid); TRP (dashed); RP (dotted) Bo Lindqvist The trend-renewal process
17 Conditional intensities of TRP with DFR renewal distribution and increasing trend function Failures observed at times 1.0 and Renewal: F Weibull, shape 0.5 Trend: λ(t) = t 2 Bo Lindqvist The trend-renewal process
18 Interpretation of Λ(t) 0 T 1 T 2 T 3 t TRP(F, λ( )) RP(F) 0 Λ(T 1 ) Λ(T 2 ) Λ(T 3 ) By using results from renewal theory: N(t) lim t Λ(t) = 1 (a.s.) E(N(t)) lim = 1 t Λ(t) since F is assumed to have expected value 1. Bo Lindqvist The trend-renewal process
19 Alternative models: Cox modulated renewal model Cox (1972): φ(t F t ) = z(t T N(t ) )λ(t) Compare to TRP: φ(t F t ) = z(λ(t) Λ(T N(t ) ))λ(t) Bo Lindqvist The trend-renewal process
20 Alternative models: The model by Lawless and Thiagarajah Lawless and Thiagarajah (1996): φ(t F t ) = e θ h(t) where h(t) is a vector of observable functions, depending on t and possibly also on the history F t, and θ is a vector of parameters. This model allows the use of various dynamic covariates, such as number of previous failures of the system, N(t ) time since last event, t T N(t ) Bo Lindqvist The trend-renewal process
21 Alternative models: The model by Pena and Hollander Pena and Hollander (2004): φ(t F t, a) = a λ 0 (E(t)) ρ(n(t ); α) g(x(t), β) where a is a positive unobserved random variable (frailty) λ 0 ( ) is a baseline hazard rate function E(t) is effective age process, a predictable process modeling impact of performed interventions after each event. Possible choices Minimal intervention on repair: E(t) = t Perfect intervention on repair: E(t) = t T N(t ) Imperfect repair: E(t) = time since last perfect repair Age reduction models: E(t) is reduced by a certain factor at each repair ρ( ; ) can for example be on geometric form, ρ(k; α) = α k g(x(t), β) models impact of covariates, for example on Cox-form Bo Lindqvist The trend-renewal process
22 CONDITIONAL ROCOF BY MINIMAL REPAIR (NHPP) AND PERFECT REPAIR (RENEWAL PROCESS) 167
23 SIMPLE EXAMPLE WITH THREE SYSTEMS Sys. 1: 0 S 11 =5 S 21 =12 S 31 =17 τ 1 =20 Sys. 2: 0 S 12 =9 S 22 =23 τ 2 =30 Sys. 3: 0 S 13 =4 τ 3 =10 Proj: t Y(t): Y (t) =3 Y (t) =2 Y (t) =1 168
24 COMPUTATIONS FOR THE NELSON-AALEN ESTIMATOR t 1/Y (t) 1/Y (t) 2 Ŵ (t) VarŴ (t) SDŴ (t) 4 1/3 1/9 1/3 1/ /3 1/9 2/3 2/ /3 1/9 1 1/ /2 1/4 3/2 7/ /2 1/4 2 5/ /
25 ESTIMATED W (t) with 95% confidence limits (Nelson-Aalen) W(t) t 170
26 Simple Example With 3 Systems 174
27 Nelson-Aalen estimator for Cumulative ROCOF W (t) 1. Order all failure times as t 1 <t 2 <...t n. 2. Let d j (t i ) = # events in system j at t i. 3. Let d(t i )= m j=1 d j(t i ) = # events in all systems at t i. 4. Let Y j (t) = { 1 if system j is under observation at time t 0 otherwise 5. Let Y (t) = m j=1 Y j(t) = # systems under observation at time t. Then Under general assumptions: Ŵ (t) = Assuming NHPP: Var Ŵ (t) = t i t t i t d(t i ) {Y (t i )} 2 d(t i ) Y (t i ). Under general assumptions (MINITAB): Var Ŵ (t) = { m j=1 t i t Y j (t i ) Y (t i ) [ d j (t i ) d(t ] } 2 i) Y (t i ) 175
28 Illustration of last formula for Simple NHPP Example (Compare with MINITAB Output): Var Ŵ (4) = { 1 3 [ { 1 + 3]} 3 [ { 1 + 3]} 3 [ ]} 2 = 6 81 = Var Ŵ (5) = + + { 1 3 { 1 3 { 1 3 [ ] [ ] [ ] [ 1 1 ]} 2 3 [ 0 1 ]} 2 3 [ 0 1 ]} 2 3 = 6 81 =
29 Var Ŵ (9) = { 1 3 { { = 0 [ ] [ ] [ ] [ ] [ ] [ ] [ 0 1 ]} 2 3 [ 1 1 ]} 2 3 [ 0 1 ]} 2 3 Var Ŵ (12) = + + { 1 3 { 1 3 { 1 3 [ ] [ ] [ ] [ ] [ ] [ ] [ ] [ ] [ ]} [ 1 1 ]} 2 2 [ 0 1 ]} 2 2 = 1 8 =
30 Simple Example With 3 Systems Power Law NHPP Model: W (t; α, θ) =(t/θ) α 178

31 Simple Example With 3 Systems 179
32 RESIDUAL PROCESS: SIMPLE EXAMPLE. Data points (and endpoints on axes) are transformed with the estimated cumulative ROCOF, Ŵ (t) = t 1.20 Sys. 1: Sys. 2: Sys. 3: Times between events, plus censored times at the end of each axis, are on the next slide anlysed by MINITAB as a set of censored exponential variables. 180
33 181
34 182
35 VALVESEAT DATA 183

36 VALVESEAT DATA 185
37 VALVESEAT DATA 186
38 188
39 189
40 Grampus- data: Plot of (T i,t i+1 ) to investigate whether times between failures can be assumed independent. The figure does not indicate a correlation between successive times. 190
41 191
42 192
43 PROFILE LIKELIHOOD FOR BETA ( SIMPLE EXAMPLE ) ˆβ =1.20, ˆλ = profile beta 193
44 CONNECTION BETWEEN LAMBDA OG BETA ( SIMPLE EXAMPLE ) ˆβ =1.20, ˆλ = lambda beta 194
45 195
46 196
47 197
48 198

49 Valveseat Data 199
50 Valveseat Data 200
51 TTT-analysis Simple Example Row STTT ID Scaled , , , , , , ,00000 Parameter Estimates Standard 95% Normal CI Parameter Estimate Error Lower Upper Shape 1, ,511 0, ,25186 Scale 0, ,160-0, , Trend Tests MIL-Hdbk-189 Laplace s Anderson-Darling Test Statistic 9,59 0,12 0,24 P-Value 0,697 0,906 0,977 DF
52 Total Time on Test Plot for Simple Example System Column in ID 1,0 P arameter, M LE Shape Scale 1, , Scaled Total Time on Test 0,8 0,6 0,4 0,2 0,0 0,0 0,2 0,4 0,6 Scaled Failure Number 0,8 1,0 202
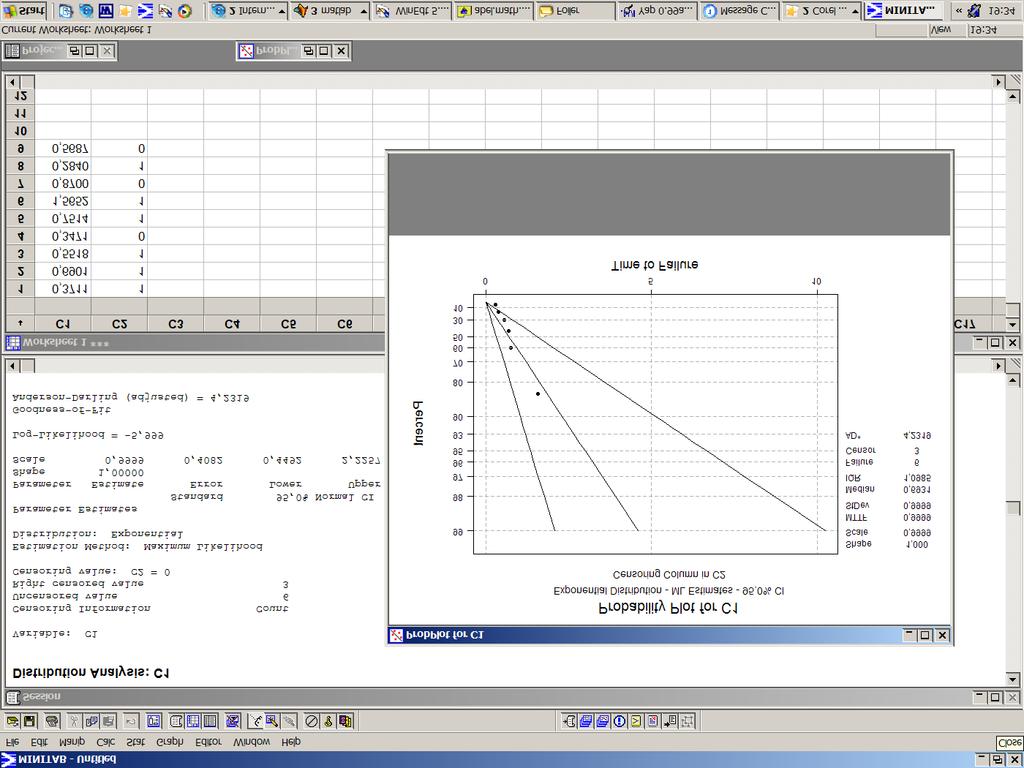
53 TTT-analysis of Valve Seat Data Parametric Growth Curve: C1 Model: Power-Law Process Estimation Method: Maximum Likelihood Parameter Estimates Standard 95% Normal CI Parameter Estimate Error Lower Upper Shape 1, ,202 1, ,79229 Scale 0, ,026 0, , Trend Tests MIL-Hdbk-189 Laplace s Anderson-Darling Test Statistic 68,72 2,03 3,17 P-Value 0,032 0,043 0,022 DF
54 Total Time on Test Plot for Valve Seat Data 1,0 Parameter, MLE Shape Scale 1, , Scaled Total Time on Test 0,8 0,6 0,4 0,2 0,0 0,0 0,2 0,4 0,6 Scaled Failure Number 0,8 1,0 204
e 4β e 4β + e β ˆβ =0.765
 SIMPLE EXAMPLE COX-REGRESSION i Y i x i δ i 1 5 12 0 2 10 10 1 3 40 3 0 4 80 5 0 5 120 3 1 6 400 4 1 7 600 1 0 Model: z(t x) =z 0 (t) exp{βx} Partial likelihood: L(β) = e 10β e 10β + e 3β + e 5β + e 3β
Maintenance of Repairable Systems
 1 Maintenance of Repairable Systems Bo Henry Lindqvist 1.1 Introduction A commonly used definition of a repairable system (Ascher and Feingold [3]) states that this is a system which, after failing to
A STATISTICAL TEST FOR MONOTONIC AND NON-MONOTONIC TREND IN REPAIRABLE SYSTEMS
 A STATISTICAL TEST FOR MONOTONIC AND NON-MONOTONIC TREND IN REPAIRABLE SYSTEMS Jan Terje Kvaløy Department of Mathematics and Science, Stavanger University College, P.O. Box 2557 Ullandhaug, N-491 Stavanger,
A nonparametric monotone maximum likelihood estimator of time trend for repairable systems data
 A nonparametric monotone maximum likelihood estimator of time trend for repairable systems data Knut Heggland 1 and Bo H Lindqvist Department of Mathematical Sciences Norwegian University of Science and
Examination paper for TMA4275 Lifetime Analysis
 Department of Mathematical Sciences Examination paper for TMA4275 Lifetime Analysis Academic contact during examination: Ioannis Vardaxis Phone: 95 36 00 26 Examination date: Saturday May 30 2015 Examination
Reliability Growth in JMP 10
 Reliability Growth in JMP 10 Presented at Discovery Summit 2012 September 13, 2012 Marie Gaudard and Leo Wright Purpose of Talk The goal of this talk is to provide a brief introduction to: The area of
arxiv: v1 [stat.me] 22 Feb 2018
![arxiv: v1 [stat.me] 22 Feb 2018](/thumbs/83/88163813.jpg "arxiv: v1 [stat.me] 22 Feb 2018") A Class of Tests for Trend in Time Censored Recurrent Event Data Jan Terje Kvaløy Department of Mathematics and Physics University of Stavanger, Norway arxiv:182.8339v1 [stat.me] 22 Feb 218 Bo Henry Lindqvist
A Class of Tests for Trend in Time Censored Recurrent Event Data Jan Terje Kvaløy Department of Mathematics and Physics University of Stavanger, Norway arxiv:182.8339v1 [stat.me] 22 Feb 218 Bo Henry Lindqvist
A novel repair model for imperfect maintenance
 IMA Journal of Management Mathematics (6) 7, 35 43 doi:.93/imaman/dpi36 Advance Access publication on July 4, 5 A novel repair model for imperfect maintenance SHAOMIN WU AND DEREK CLEMENTS-CROOME School
Department of Mathematical Sciences, Norwegian University of Science and Technology, Trondheim
 Tests for trend in more than one repairable system. Jan Terje Kvaly Department of Mathematical Sciences, Norwegian University of Science and Technology, Trondheim ABSTRACT: If failure time data from several
An Integral Measure of Aging/Rejuvenation for Repairable and Non-repairable Systems
 An Integral Measure of Aging/Rejuvenation for Repairable and Non-repairable Systems M.P. Kaminskiy and V.V. Krivtsov Abstract This paper introduces a simple index that helps to assess the degree of aging
Mahdi karbasian* & Zoubi Ibrahim
 International Journal of Industrial Engineering & Production Research (010) pp. 105-110 September 010, Volume 1, Number International Journal of Industrial Engineering & Production Research ISSN: 008-4889
Computer Simulation of Repairable Processes
 SEMATECH 1996 Applied Reliability Tools Workshop (ARTWORK IX) Santa Fe Computer Simulation of Repairable Processes Dave Trindade, Ph.D. Senior AMD Fellow Applied Statistics Introduction Computer simulation!
AN INTEGRAL MEASURE OF AGING/REJUVENATION FOR REPAIRABLE AND NON REPAIRABLE SYSTEMS
 R&RAA # 1 (Vol.1) 8, March AN INEGRAL MEASURE OF AGING/REJUVENAION FOR REPAIRABLE AND NON REPAIRABLE SYSEMS M.P. Kaminskiy and V.V. Krivtsov Abstract his paper introduces a simple index that helps to assess
Introduction to Reliability Theory (part 2)
") Introduction to Reliability Theory (part 2) Frank Coolen UTOPIAE Training School II, Durham University 3 July 2018 (UTOPIAE) Introduction to Reliability Theory 1 / 21 Outline Statistical issues Software
Introduction to Reliability Theory (part 2) Frank Coolen UTOPIAE Training School II, Durham University 3 July 2018 (UTOPIAE) Introduction to Reliability Theory 1 / 21 Outline Statistical issues Software
CHAPTER 1 A MAINTENANCE MODEL FOR COMPONENTS EXPOSED TO SEVERAL FAILURE MECHANISMS AND IMPERFECT REPAIR
 CHAPTER 1 A MAINTENANCE MODEL FOR COMPONENTS EXPOSED TO SEVERAL FAILURE MECHANISMS AND IMPERFECT REPAIR Helge Langseth and Bo Henry Lindqvist Department of Mathematical Sciences Norwegian University of
Statistics 262: Intermediate Biostatistics Non-parametric Survival Analysis
 Statistics 262: Intermediate Biostatistics Non-parametric Survival Analysis Jonathan Taylor & Kristin Cobb Statistics 262: Intermediate Biostatistics p.1/?? Overview of today s class Kaplan-Meier Curve
Modelling of Indian Stock Prices using Nonhomogeneous Poisson Processes with Time Trends
 IOSR Journal of Business and Management (IOSR-JBM) e-issn: 2278-487X, p-issn: 2319-7668. Volume 13, Issue 4 (Sep. - Oct. 2013), PP 73-86 Modelling of Indian Stock Prices using Nonhomogeneous Poisson Processes
Lecture 5 Models and methods for recurrent event data
 Lecture 5 Models and methods for recurrent event data Recurrent and multiple events are commonly encountered in longitudinal studies. In this chapter we consider ordered recurrent and multiple events.
Time-varying failure rate for system reliability analysis in large-scale railway risk assessment simulation
 Time-varying failure rate for system reliability analysis in large-scale railway risk assessment simulation H. Zhang, E. Cutright & T. Giras Center of Rail Safety-Critical Excellence, University of Virginia,
Repairable Systems Reliability Trend Tests and Evaluation
 Repairable Systems Reliability Trend Tests and Evaluation Peng Wang, Ph.D., United Technologies Research Center David W. Coit, Ph.D., Rutgers University Keywords: repairable system, reliability trend test,
Dynamic Models in Reliability and Survival Analysis
 Dynamic Models in Reliability and Survival Analysis Edsel A. Peña Department of Statistics University of South Carolina (USC) Joint work with E. Slate (MUSC) MMR 2004, June 21-24, 2004 pena@stat.sc.edu
XLVII SIMPÓSIO BRASILEIRO DE PESQUISA OPERACIONAL
 Static and Dynamics Maintenance Policies for Repairable Systems under Imperfect Repair Models Maria Luíza Guerra de Toledo Escola Nacional de Ciências Estatísticas - IBGE Rua André Cavalcanti, 106 - Santa
Modelling and Analysis of Recurrent Event Data
 Modelling and Analysis of Recurrent Event Data Edsel A. Peña Department of Statistics University of South Carolina Research support from NIH, NSF, and USC/MUSC Collaborative Grants Joint work with Prof.
1 Glivenko-Cantelli type theorems
 STA79 Lecture Spring Semester Glivenko-Cantelli type theorems Given i.i.d. observations X,..., X n with unknown distribution function F (t, consider the empirical (sample CDF ˆF n (t = I [Xi t]. n Then
A Multi-level Trend-Renewal Process for Modeling Systems with Recurrence Data
 Statistics Preprints Statistics 4-2015 A Multi-level Trend-Renewal Process for Modeling Systems with Recurrence Data Zhibing Xu Virginia Tech Yili Hong Virginia Tech William Q. Meeker Iowa State University,
Estimating a parametric lifetime distribution from superimposed renewal process data
 Graduate Theses and Dissertations Iowa State University Capstones, Theses and Dissertations 2013 Estimating a parametric lifetime distribution from superimposed renewal process data Ye Tian Iowa State
Other Survival Models. (1) Non-PH models. We briefly discussed the non-proportional hazards (non-ph) model
 Non-PH models. We briefly discussed the non-proportional hazards (non-ph) model") Other Survival Models (1) Non-PH models We briefly discussed the non-proportional hazards (non-ph) model λ(t Z) = λ 0 (t) exp{β(t) Z}, where β(t) can be estimated by: piecewise constants (recall how);
Other Survival Models (1) Non-PH models We briefly discussed the non-proportional hazards (non-ph) model λ(t Z) = λ 0 (t) exp{β(t) Z}, where β(t) can be estimated by: piecewise constants (recall how);
Reliability Engineering I
 Happiness is taking the reliability final exam. Reliability Engineering I ENM/MSC 565 Review for the Final Exam Vital Statistics What R&M concepts covered in the course When Monday April 29 from 4:30 6:00
Link to published article: (Access to content may be restricted)
") Kvaløy, J.T. (2002) Covariate Order Tests for Covariate Effect. Lifetime Data Analysis, 8(1), pp. 35-51 Link to published article: http://link.springer.com/article/10.1023/a:1013518815447 (Access to content
Kvaløy, J.T. (2002) Covariate Order Tests for Covariate Effect. Lifetime Data Analysis, 8(1), pp. 35-51 Link to published article: http://link.springer.com/article/10.1023/a:1013518815447 (Access to content
Models for Multivariate Panel Count Data
 Semiparametric Models for Multivariate Panel Count Data KyungMann Kim University of Wisconsin-Madison kmkim@biostat.wisc.edu 2 April 2015 Outline 1 Introduction 2 3 4 Panel Count Data Motivation Previous
Reliability analysis of power systems EI2452. Lifetime analysis 7 May 2015
 Reliability analysis of power systems EI2452 Lifetime analysis 7 May 2015 Agenda Summary of content: Introduction nonreparable/reparable General information about statistical surveys Lifetime data Nonparametric
Multistate Modeling and Applications
 Multistate Modeling and Applications Yang Yang Department of Statistics University of Michigan, Ann Arbor IBM Research Graduate Student Workshop: Statistics for a Smarter Planet Yang Yang (UM, Ann Arbor)
Modeling and Analysis of Recurrent Event Data
 Edsel A. Peña (pena@stat.sc.edu) Department of Statistics University of South Carolina Columbia, SC 29208 New Jersey Institute of Technology Conference May 20, 2012 Historical Perspective: Random Censorship
Frailty Modeling for clustered survival data: a simulation study
 Frailty Modeling for clustered survival data: a simulation study IAA Oslo 2015 Souad ROMDHANE LaREMFiQ - IHEC University of Sousse (Tunisia) souad_romdhane@yahoo.fr Lotfi BELKACEM LaREMFiQ - IHEC University
Lecture 22 Survival Analysis: An Introduction
 University of Illinois Department of Economics Spring 2017 Econ 574 Roger Koenker Lecture 22 Survival Analysis: An Introduction There is considerable interest among economists in models of durations, which
Modelling the risk process
 Modelling the risk process Krzysztof Burnecki Hugo Steinhaus Center Wroc law University of Technology www.im.pwr.wroc.pl/ hugo Modelling the risk process 1 Risk process If (Ω, F, P) is a probability space
Software Reliability Growth Modelling using a Weighted Laplace Test Statistic
 Software Reliability Growth Modelling using a Weighted Laplace Test Statistic Yan Luo Torsten Bergander A. Ben Hamza Concordia Institute for Information Systems Engineering Concordia University, Montréal,
Survival Analysis Math 434 Fall 2011
 Survival Analysis Math 434 Fall 2011 Part IV: Chap. 8,9.2,9.3,11: Semiparametric Proportional Hazards Regression Jimin Ding Math Dept. www.math.wustl.edu/ jmding/math434/fall09/index.html Basic Model Setup
Lecture 6 PREDICTING SURVIVAL UNDER THE PH MODEL
 Lecture 6 PREDICTING SURVIVAL UNDER THE PH MODEL The Cox PH model: λ(t Z) = λ 0 (t) exp(β Z). How do we estimate the survival probability, S z (t) = S(t Z) = P (T > t Z), for an individual with covariates
ST745: Survival Analysis: Nonparametric methods
 ST745: Survival Analysis: Nonparametric methods Eric B. Laber Department of Statistics, North Carolina State University February 5, 2015 The KM estimator is used ubiquitously in medical studies to estimate
Estimation for Modified Data
 Definition. Estimation for Modified Data 1. Empirical distribution for complete individual data (section 11.) An observation X is truncated from below ( left truncated) at d if when it is at or below d
Time-to-Event Modeling and Statistical Analysis
 PeñaTalkGT) p. An Appetizer The important thing is not to stop questioning. Curiosity has its own reason for existing. One cannot help but be in awe when he contemplates the mysteries of eternity, of life,
Lecture 7. Poisson and lifetime processes in risk analysis
 Lecture 7. Poisson and lifetime processes in risk analysis Jesper Rydén Department of Mathematics, Uppsala University jesper.ryden@math.uu.se Statistical Risk Analysis Spring 2014 Example: Life times of
Statistical Inference and Methods
 Department of Mathematics Imperial College London d.stephens@imperial.ac.uk http://stats.ma.ic.ac.uk/ das01/ 31st January 2006 Part VI Session 6: Filtering and Time to Event Data Session 6: Filtering and
Exercises. (a) Prove that m(t) =
 Prove that m(t) =") Exercises 1. Lack of memory. Verify that the exponential distribution has the lack of memory property, that is, if T is exponentially distributed with parameter λ > then so is T t given that T > t for
Exercises 1. Lack of memory. Verify that the exponential distribution has the lack of memory property, that is, if T is exponentially distributed with parameter λ > then so is T t given that T > t for
Investigation of some tests for homogeneity of intensity with applications to insurance data
 U.U.D.M. Project Report 2011:26 Investigation of some tests for homogeneity of intensity with applications to insurance data Sara Gustin Examensarbete i matematik, 15 hp Handledare och examinator: Jesper
Modeling of Dependence Between Critical Failure and Preventive Maintenance: The Repair Alert Model
 Modeling of Dependence Between Critical Failure and Preventive Maintenance: The Repair Alert Model Bo Lindqvist Helge Langseth Bård Støve bo@math.ntnu.no Department of Mathematical Sciences Norwegian University
Variability within multi-component systems. Bayesian inference in probabilistic risk assessment The current state of the art
 PhD seminar series Probabilistics in Engineering : g Bayesian networks and Bayesian hierarchical analysis in engeering g Conducted by Prof. Dr. Maes, Prof. Dr. Faber and Dr. Nishijima Variability within
Concepts and Tests for Trend in Recurrent Event Processes
 JIRSS (2013) Vol. 12, No. 1, pp 35-69 Concepts and Tests for Trend in Recurrent Event Processes R. J. Cook, J. F. Lawless Department of Statistics and Actuarial Science, University of Waterloo, Ontario,
UNIVERSITY OF CALIFORNIA, SAN DIEGO
 UNIVERSITY OF CALIFORNIA, SAN DIEGO Estimation of the primary hazard ratio in the presence of a secondary covariate with non-proportional hazards An undergraduate honors thesis submitted to the Department
Frailty Models and Copulas: Similarities and Differences
 Frailty Models and Copulas: Similarities and Differences KLARA GOETHALS, PAUL JANSSEN & LUC DUCHATEAU Department of Physiology and Biometrics, Ghent University, Belgium; Center for Statistics, Hasselt
Chapter 9 Part II Maintainability
 Chapter 9 Part II Maintainability 9.4 System Repair Time 9.5 Reliability Under Preventive Maintenance 9.6 State-Dependent Systems with Repair C. Ebeling, Intro to Reliability & Maintainability Chapter
Competing risks for repairable systems: A data study
 Competing risks for repairable systems: A data study Helge Langseth and Bo Henry Lindqvist Department of Mathematical Sciences, Norwegian University of Science and Technology, Norway Abstract We analyze
Multistate models and recurrent event models
 Multistate models Multistate models and recurrent event models Patrick Breheny December 10 Patrick Breheny Survival Data Analysis (BIOS 7210) 1/22 Introduction Multistate models In this final lecture,
DAGStat Event History Analysis.
 DAGStat 2016 Event History Analysis Robin.Henderson@ncl.ac.uk 1 / 75 Schedule 9.00 Introduction 10.30 Break 11.00 Regression Models, Frailty and Multivariate Survival 12.30 Lunch 13.30 Time-Variation and
Semiparametric Estimation for a Generalized KG Model with R. Model with Recurrent Event Data
 Semiparametric Estimation for a Generalized KG Model with Recurrent Event Data Edsel A. Peña (pena@stat.sc.edu) Department of Statistics University of South Carolina Columbia, SC 29208 MMR Conference Beijing,
Reliability of Safety-Critical Systems Chapter 9. Average frequency of dangerous failures
 Reliability of Safety-Critical Systems Chapter 9. Average frequency of dangerous failures Mary Ann Lundteigen and Marvin Rausand mary.a.lundteigen@ntnu.no &marvin.rausand@ntnu.no RAMS Group Department
Multi-state Models: An Overview
 Multi-state Models: An Overview Andrew Titman Lancaster University 14 April 2016 Overview Introduction to multi-state modelling Examples of applications Continuously observed processes Intermittently observed
A generalized Brown-Proschan model for preventive and corrective maintenance. Laurent DOYEN.
 A generalized Brown-Proschan model for preventive and corrective maintenance laurent.doyen@iut2.upmf-grenoble.fr Jean Kuntzmann Laboratory Grenoble University France 1 of 28 I. Introduction The dependability
RENEWAL PROCESSES AND POISSON PROCESSES
 1 RENEWAL PROCESSES AND POISSON PROCESSES Andrea Bobbio Anno Accademico 1997-1998 Renewal and Poisson Processes 2 Renewal Processes A renewal process is a point process characterized by the fact that the
Determination of the optimal periodic maintenance policy under imperfect repair assumption
 Universidade Federal de Minas Gerais Escola de Engenharia Departamento de Engenharia de Produção Programa de Pós-Graduação em Engenharia de Produção Determination of the optimal periodic maintenance policy
Step-Stress Models and Associated Inference
 Department of Mathematics & Statistics Indian Institute of Technology Kanpur August 19, 2014 Outline Accelerated Life Test 1 Accelerated Life Test 2 3 4 5 6 7 Outline Accelerated Life Test 1 Accelerated
Software Reliability & Testing
 Repairable systems Repairable system A reparable system is obtained by glueing individual non-repairable systems each around a single failure To describe this gluing process we need to review the concept
STAT Sample Problem: General Asymptotic Results
 STAT331 1-Sample Problem: General Asymptotic Results In this unit we will consider the 1-sample problem and prove the consistency and asymptotic normality of the Nelson-Aalen estimator of the cumulative
I I FINAL, 01 Jun 8.4 to 31 May TITLE AND SUBTITLE 5 * _- N, '. ', -;
 R AD-A237 850 E........ I N 11111IIIII U 1 1I!til II II... 1. AGENCY USE ONLY Leave 'VanK) I2. REPORT DATE 3 REPORT TYPE AND " - - I I FINAL, 01 Jun 8.4 to 31 May 88 4. TITLE AND SUBTITLE 5 * _- N, '.
A hidden semi-markov model for the occurrences of water pipe bursts
 A hidden semi-markov model for the occurrences of water pipe bursts T. Economou 1, T.C. Bailey 1 and Z. Kapelan 1 1 School of Engineering, Computer Science and Mathematics, University of Exeter, Harrison
Approximation of Survival Function by Taylor Series for General Partly Interval Censored Data
 Malaysian Journal of Mathematical Sciences 11(3): 33 315 (217) MALAYSIAN JOURNAL OF MATHEMATICAL SCIENCES Journal homepage: http://einspem.upm.edu.my/journal Approximation of Survival Function by Taylor
A Simulation Study on Confidence Interval Procedures of Some Mean Cumulative Function Estimators
 Statistics Preprints Statistics -00 A Simulation Study on Confidence Interval Procedures of Some Mean Cumulative Function Estimators Jianying Zuo Iowa State University, jiyizu@iastate.edu William Q. Meeker
Optimal maintenance for minimal and imperfect repair models
 Optimal maintenance for minimal and imperfect repair models Gustavo L. Gilardoni Universidade de Brasília AMMSI Workshop Grenoble, January 2016 Belo Horizonte Enrico Colosimo Marta Freitas Rodrigo Padilha
A Regression Model For Recurrent Events With Distribution Free Correlation Structure
 A Regression Model For Recurrent Events With Distribution Free Correlation Structure J. Pénichoux(1), A. Latouche(2), T. Moreau(1) (1) INSERM U780 (2) Université de Versailles, EA2506 ISCB - 2009 - Prague
Multistate models and recurrent event models
 and recurrent event models Patrick Breheny December 6 Patrick Breheny University of Iowa Survival Data Analysis (BIOS:7210) 1 / 22 Introduction In this final lecture, we will briefly look at two other
Survival Analysis. Stat 526. April 13, 2018
 Survival Analysis Stat 526 April 13, 2018 1 Functions of Survival Time Let T be the survival time for a subject Then P [T < 0] = 0 and T is a continuous random variable The Survival function is defined
Stochastic Renewal Processes in Structural Reliability Analysis:
 Stochastic Renewal Processes in Structural Reliability Analysis: An Overview of Models and Applications Professor and Industrial Research Chair Department of Civil and Environmental Engineering University
CIMAT Taller de Modelos de Capture y Recaptura Known Fate Survival Analysis
 CIMAT Taller de Modelos de Capture y Recaptura 2010 Known Fate urvival Analysis B D BALANCE MODEL implest population model N = λ t+ 1 N t Deeper understanding of dynamics can be gained by identifying variation
Reliability Meets Big Data: Opportunities and Challenges
 Reliability Meets Big Data: Opportunities and Challenges William Q. Meeker Department of Statistics Center for Nondestructive Evaluation Iowa State University Ames, IA 50011 Email: wqmeeker@iastate.edu
Estimating and Simulating Nonhomogeneous Poisson Processes
 Estimating and Simulating Nonhomogeneous Poisson Processes Larry Leemis Department of Mathematics The College of William & Mary Williamsburg, VA 2387 8795 USA 757 22 234 E-mail: leemis@math.wm.edu May
Modelling Supercomputer Maintenance Interrupts: Maintenance Policy Recommendations
 University of Tennessee, Knoxville Trace: Tennessee Research and Creative Exchange Masters Theses Graduate School 8-2015 Modelling Supercomputer Maintenance Interrupts: Maintenance Policy Recommendations
Analysis of Time-to-Event Data: Chapter 6 - Regression diagnostics
 Analysis of Time-to-Event Data: Chapter 6 - Regression diagnostics Steffen Unkel Department of Medical Statistics University Medical Center Göttingen, Germany Winter term 2018/19 1/25 Residuals for the
You know I m not goin diss you on the internet Cause my mama taught me better than that I m a survivor (What?) I m not goin give up (What?
 I m not goin give up (What?") You know I m not goin diss you on the internet Cause my mama taught me better than that I m a survivor (What?) I m not goin give up (What?) I m not goin stop (What?) I m goin work harder (What?) Sir David
You know I m not goin diss you on the internet Cause my mama taught me better than that I m a survivor (What?) I m not goin give up (What?) I m not goin stop (What?) I m goin work harder (What?) Sir David
Semiparametric Regression
 Semiparametric Regression Patrick Breheny October 22 Patrick Breheny Survival Data Analysis (BIOS 7210) 1/23 Introduction Over the past few weeks, we ve introduced a variety of regression models under
Survival Analysis: Weeks 2-3. Lu Tian and Richard Olshen Stanford University
 Survival Analysis: Weeks 2-3 Lu Tian and Richard Olshen Stanford University 2 Kaplan-Meier(KM) Estimator Nonparametric estimation of the survival function S(t) = pr(t > t) The nonparametric estimation
Survival Analysis. Lu Tian and Richard Olshen Stanford University
 1 Survival Analysis Lu Tian and Richard Olshen Stanford University 2 Survival Time/ Failure Time/Event Time We will introduce various statistical methods for analyzing survival outcomes What is the survival
Practice Exam 1. (A) (B) (C) (D) (E) You are given the following data on loss sizes:
 (B) (C) (D) (E) You are given the following data on loss sizes:") Practice Exam 1 1. Losses for an insurance coverage have the following cumulative distribution function: F(0) = 0 F(1,000) = 0.2 F(5,000) = 0.4 F(10,000) = 0.9 F(100,000) = 1 with linear interpolation
Practice Exam 1 1. Losses for an insurance coverage have the following cumulative distribution function: F(0) = 0 F(1,000) = 0.2 F(5,000) = 0.4 F(10,000) = 0.9 F(100,000) = 1 with linear interpolation
Recurrent Event Data: Models, Analysis, Efficiency
 Recurrent Event Data: Models, Analysis, Efficiency Edsel A. Peña Department of Statistics University of South Carolina Columbia, SC 29208 Talk at Brown University March 10, 2008 Recurrent Event Data:Models,
 Goodness-of-Fit Tests With Right-Censored Data by Edsel A. Pe~na Department of Statistics University of South Carolina Colloquium Talk August 31, 2 Research supported by an NIH Grant 1 1. Practical Problem
Estimating Load-Sharing Properties in a Dynamic Reliability System. Paul Kvam, Georgia Tech Edsel A. Peña, University of South Carolina
 Estimating Load-Sharing Properties in a Dynamic Reliability System Paul Kvam, Georgia Tech Edsel A. Peña, University of South Carolina Modeling Dependence Between Components Most reliability methods are
Multivariate Survival Analysis
 Multivariate Survival Analysis Previously we have assumed that either (X i, δ i ) or (X i, δ i, Z i ), i = 1,..., n, are i.i.d.. This may not always be the case. Multivariate survival data can arise in
Weibull Reliability Analysis
 Weibull Reliability Analysis = http://www.rt.cs.boeing.com/mea/stat/reliability.html Fritz Scholz (425-865-3623, 7L-22) Boeing Phantom Works Mathematics &Computing Technology Weibull Reliability Analysis
Weibull Reliability Analysis
 Weibull Reliability Analysis = http://www.rt.cs.boeing.com/mea/stat/scholz/ http://www.rt.cs.boeing.com/mea/stat/reliability.html http://www.rt.cs.boeing.com/mea/stat/scholz/weibull.html Fritz Scholz (425-865-3623,
CHAPTER 3 MATHEMATICAL AND SIMULATION TOOLS FOR MANET ANALYSIS
 44 CHAPTER 3 MATHEMATICAL AND SIMULATION TOOLS FOR MANET ANALYSIS 3.1 INTRODUCTION MANET analysis is a multidimensional affair. Many tools of mathematics are used in the analysis. Among them, the prime
Chapter 1 Statistical Reasoning Why statistics? Section 1.1 Basics of Probability Theory
 Chapter 1 Statistical Reasoning Why statistics? Uncertainty of nature (weather, earth movement, etc. ) Uncertainty in observation/sampling/measurement Variability of human operation/error imperfection
Part III. Hypothesis Testing. III.1. Log-rank Test for Right-censored Failure Time Data
 1 Part III. Hypothesis Testing III.1. Log-rank Test for Right-censored Failure Time Data Consider a survival study consisting of n independent subjects from p different populations with survival functions
arxiv: v1 [stat.ap] 11 Jan 2013
![arxiv: v1 [stat.ap] 11 Jan 2013](/thumbs/94/120084425.jpg "arxiv: v1 [stat.ap] 11 Jan 2013") The Annals of Applied Statistics 2012, Vol. 6, No. 4, 1641 166 DOI: 10.1214/12-AOAS560 c Institute of Mathematical Statistics, 2012 arxiv:101.2411v1 [stat.ap] 11 Jan 201 ASSESSING TRANSIENT CARRYOVER EFFECTS
The Annals of Applied Statistics 2012, Vol. 6, No. 4, 1641 166 DOI: 10.1214/12-AOAS560 c Institute of Mathematical Statistics, 2012 arxiv:101.2411v1 [stat.ap] 11 Jan 201 ASSESSING TRANSIENT CARRYOVER EFFECTS
Likelihood Construction, Inference for Parametric Survival Distributions
 Week 1 Likelihood Construction, Inference for Parametric Survival Distributions In this section we obtain the likelihood function for noninformatively rightcensored survival data and indicate how to make
Survival Distributions, Hazard Functions, Cumulative Hazards
 BIO 244: Unit 1 Survival Distributions, Hazard Functions, Cumulative Hazards 1.1 Definitions: The goals of this unit are to introduce notation, discuss ways of probabilistically describing the distribution
Ústav teorie informace a automatizace. Academy of Sciences of the Czech Republic Institute of Information Theory and Automation RESEARCH REPORT
 Akademie věd České republiky Ústav teorie informace a automatizace Academy of Sciences of the Czech Republic Institute of Information Theory and Automation RESEARCH REPORT Jaroslav Ševčík and Petr Volf
Checking the Reliability of Reliability Models.
 Checking the Reliability of Reliability Models. Seminario de Estadística, CIMAT Abril 3, 007. Víctor Aguirre Torres Departmento de Estadística, ITAM Área de Probabilidad y Estadística, CIMAT Credits. Partially
\ fwf The Institute for Integrating Statistics in Decision Sciences
 # \ fwf The Institute for Integrating Statistics in Decision Sciences Technical Report TR-2007-8 May 22, 2007 Advances in Bayesian Software Reliability Modelling Fabrizio Ruggeri CNR IMATI Milano, Italy
Chapter 5. System Reliability and Reliability Prediction.
 Chapter 5. System Reliability and Reliability Prediction. Problems & Solutions. Problem 1. Estimate the individual part failure rate given a base failure rate of 0.0333 failure/hour, a quality factor of
Chapter 5. Statistical Models in Simulations 5.1. Prof. Dr. Mesut Güneş Ch. 5 Statistical Models in Simulations
 Chapter 5 Statistical Models in Simulations 5.1 Contents Basic Probability Theory Concepts Discrete Distributions Continuous Distributions Poisson Process Empirical Distributions Useful Statistical Models