Design and Analysis of Experiments
|
|
|
- Virginia Snow
- 5 years ago
- Views:
Transcription

1 Design and Analysis of Experiments Part VIII: Plackett-Burman, 3 k, Mixed Level, Nested, and Split-Plot Designs Prof. Dr. Anselmo E de Oliveira anselmo.quimica.ufg.br anselmo.disciplinas@gmail.com
 and in the case of a fractional factorial, the effects that cannot be estimated are completely aliased with the other effects (e.")
2 Plackett-Burman Designs Two-level fractional factorial designs developed for studying k = N 1 variables in N runs, where N is a multiple of 4 Nongeometric designs (cannot be represented as cubes) Nonregular designs Regular design is one in which all effects can be estimated independently of the other effects (e.g. 2 k design) and in the case of a fractional factorial, the effects that cannot be estimated are completely aliased with the other effects (e.g. 2 k-p design) Screening Main effects are, in general, heavily confounded with two-factor interactions Plackett-Burman designs are very efficient screening designs when only main effects are of interest. Web of Science: 2017/04: : 202
3 Plus and minus signs for the Plackett-Burman Designs The design is obtained by writing down the appropriate row in the table below as a column (or row) A second column (or row) is then generated from this first one by moving the elements of the column (or row) down (or to the right) one position and placing the last element in the first position. A third column... N k Signs After the column k a row of minus sings is then added, completing the design

4 Plackett-Burman Design for N = 12, k = 11 X 1 X 2 X 3 X 4 X 5 X 6 X 7 X 8 X 9 X 10 X
5
6 k = 8 N = 12 row of minus signs
7

8 ? x 2

9
10 > library(frf2) > design<-pb(nruns=12,nfactos=11,randomize=false) > y<-c(0.371,0.336,0.576,0.216,0.228,0.328, ,0.562,0.389,0.438,0.430,0.292) > model<-aov(y~(.), data=design) > coef(model) (Intercept) A1 B1 C D1 E1 F1 G H1 J1 K1 L
11 3 k Factorial Design Three levels: low(-1), intermediate(0), and high(+1) Regression Model y = β 0 + β 1 x 1 + β 2 x 2 + β 12 x 1 x 2 + β 11 x β 22 x 22 Possible choice to model a curvature in the response function It is not the most efficient way to model a quadratic relationship Response surface designs 2 k design augmented with central points (curvature)
12 The effects model y ijk = μ + τ i + β j + τβ ij + ε ijk The means model y ijk = μ ijk + ε ijk i = 1,2,, a j = 1,2,, b k = 1,2,, n where the mean of the ijth cell is μ ij = μ + τ i + β j + τβ ij i = 1,2,, a j = 1,2,, b k = 1,2,, n
13 In the two-factor factorial design we are interested in testing hypothesis abou the equality of row treatment effects, say H 0 : τ 1 = τ 2 = = τ a H 1 : at least one τ i 0 and the equality of column treatment effects, say H 0 : β 1 = β 2 = = β a H 1 : at least one β i 0 We are also interested in determining whether row and column treatment interact H 0 : τβ ij = 0 for all i, j H 1 : at least one τβ ij 0
14 Source of Variation Sum of Squares Degrees of Freedom Mean Square F 0 A treatments SS A a 1 SS A a 1 B treatments SS B b 1 SS B b 1 Interaction SS AB a 1 b 1 SS AB a 1 b 1 MS A MS E MS B MS E MS AB MS E Error SS E ab n 1 SS E ab n 1 Total SS T abn 1 SS A = 1 bn SS B = 1 an a i=1 b j=1 y 2 i.. y 2... abn y 2.j. y 2... abn SS AB = SS Subtotals SS A SS B SS Subtotals = 1 n a b i=1 j=1 y 2 ij. y 2... abn SS E = SS T SS A SS B SS AB SS T = a b n i=1 j=1 k=1 2 y ijk y 2... abn
15 A battery design experiment An engineer is designing a battery for use in a device that will be subjected to some extreme variations in temperature Three plate materials for the battery 3 2 factorial design Material Type Temperature ( F)
16 Material Type y.j. Temperature ( F) y i y... = 3799 SS Material = 1 bn a i=1 y 2 i.. y 2... abn = = 10, SS Temperature = = 39, SS Interaction = , , SS T = = 77, SS E = 77, , , , = 18,230.75
17 Source of Variation Sum of Squares Degrees of Freedom Mean Square F 0 P-Value Material types 10, , Temperature 39, , < Interaction 9, , Error 18, Total 77, The main effects of material type and temperature are significant; The interaction effect is also significant
18 > library(doe.base) > design<-fac.design(nlevels=3, nfactors=2, + factor.names = list(temp=c(-1,0,1), + Mat=c(-1,0,1)), + replications=4, randomize=false) > design run.no run.no.std.rp Temp Mat Blocks class=design, type= full factorial NOTE: columns run.no and run.no.std.rp are annotation, not part of the data frame
19 > y<-c(130,34,20,150,136,25,138,174,96, + 155,40,70,188,122,70,110,120,104, + 74,80,82,159,106,58,168,150,82, + 180,75,58,126,115,45,160,139,60) > design<-add.response(design=design,response=y) > summary(aov(y~temp*mat, data=design)) Df Sum Sq Mean Sq F value Pr(>F) Temp e-07 *** Mat ** Temp:Mat * Residuals Signif. codes: 0 *** ** 0.01 *
20 Tukey s Test Interaction is significant and comparisons between the means of one factor (e.g., A) may be obscured by the AB interaction One approach is to fix factor B at a specific level and apply Tukey s test to the means of factor A at that level Ex: To detect the differences among the means of the three material types: temperature level 2 (70 F) y 12. = 57.25; y 22. = ; y 32. = [XLS] Statistical Tables & Calculators T 0.05 = q 0.05,3,27 MS E n = vs 1: = vs 2: = vs 1: = = 45.47
21 > x1<-as.numeric(levels(design$temp)[design$temp]) > x2<-as.numeric(levels(design$mat)[design$mat]) > x1x1<-x1*x1 > x2x2<-x2*x2 > model<-lm(y~x1*x2+x1x1+x2x2) > summary(model) Call: lm.default(formula = y ~ x1 * x2 + x1x1 + x2x2) Residuals: Min 1Q Median 3Q Max Coefficients: Estimate Std. Error t value Pr(> t ) (Intercept) e-11 *** x e-07 *** x ** x1x x2x x1:x Signif. codes: 0 *** ** 0.01 * Residual standard error: on 30 degrees of freedom Multiple R-squared: , Adjusted R-squared: F-statistic: on 5 and 30 DF, p-value: 4.638e-06
22 Model Adequacy Checking model1<-lm(y~x1+x2, data=design) summary(model1) par(mfrow=c(2,2)) plot(model1)
 > M<-mesh(x,y) > par(mar = c(2, 2, 2, 2)) > surf3d(x=m$x,y=m$y, + z=110.389-40.333*m$x+20.")
23 > library(plot3d) > x<-seq(-1,1,by=.1) > y<-seq(-1,1,by=.1) > M<-mesh(x,y) > par(mar = c(2, 2, 2, 2)) > surf3d(x=m$x,y=m$y, + z= *m$x *m$y, + bty="b2",xlab="x1",ylab="x2", + zlab="y", + main=expression("y= x"[1]*" x"[2]))
24 Montgomery, pg. 398
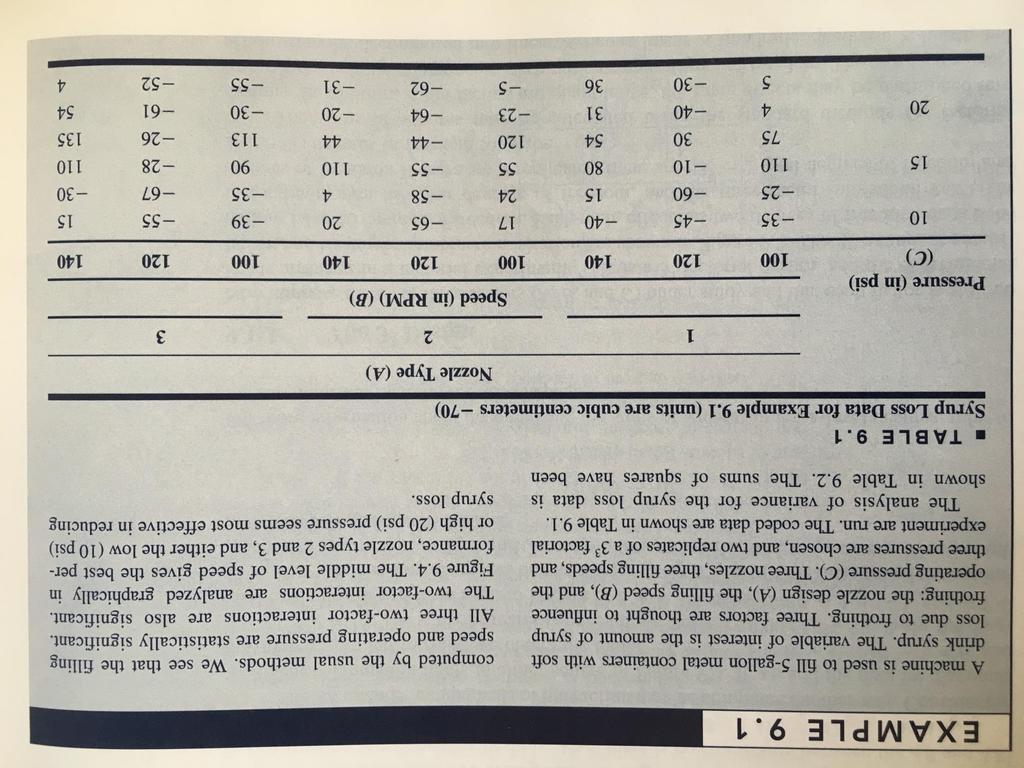
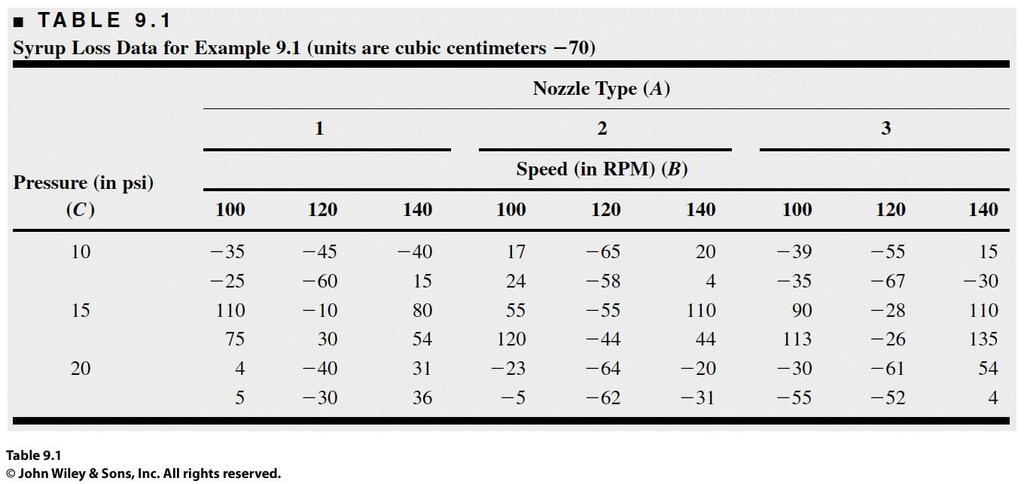
25 > design<-fac.design(nlevels=3, nfactors=3, + factor.names = list(noozle=c(-1,0,1), + Speed=c(-1,0,1), + Pressure=c(-1,0,1)), + replications=2, randomize=false) > y<-c(-35,17,-39,-45,-65,-55,-40,20,15, + 110,55,90,-10,-55,-28,80,110,110, + 4,-23,-30,-40,-64,-61,31,-20,54, + -25,24,-35,-60,-58,-67,15,4,-30, + 75,120,113,30,-44,-26,54,44,135, + 5,-5,-55,-30,-62,-52,36,-31,4) > design<-add.response(design=design,response=y) > summary(aov(y~noozle*speed*pressure, data=design)) Df Sum Sq Mean Sq F value Pr(>F) Noozle Speed e-11 *** Pressure e-12 *** Noozle:Speed * Noozle:Pressure ** Speed:Pressure *** Noozle:Speed:Pressure Residuals Signif. codes: 0 *** ** 0.01 *
26 > x1<-as.numeric(levels(design$noozle)[design$noozle]) > x2<-as.numeric(levels(design$speed)[design$speed]) > x3<-as.numeric(levels(design$pressure)[design$pressure]) > x1x1<-x1*x1 > x2x2<-x2*x2 > x3x3<-x3*x3 > model<-lm(y~x1*x2*x3+x1x1+x2x2+x3x3) > summary(model) Call: lm.default(formula = y ~ x1 * x2 * x3 + x1x1 + x2x2 + x3x3) Residuals: Min 1Q Median 3Q Max Coefficients: Estimate Std. Error t value Pr(> t ) (Intercept) x x x x1x x2x e-10 *** x3x e-11 *** x1:x x1:x x2:x x1:x2:x Signif. codes: 0 *** ** 0.01 * Residual standard error: on 43 degrees of freedom Multiple R-squared: , Adjusted R-squared: F-statistic: on 10 and 43 DF, p-value: 8.554e-11
27 Regression Model (x 1 = nozzle, x 2 = speed, x 3 = pressure in coded units) y = x x x x 1 x x 1 x x 2 x x x x x 1 x 2 x 3 Nozzle Type (qualitative factor) 1 (x 1 = 1): y = x x x 2 x x x (x 1 = 0): y = x x x 2 x x x (x 1 = +1): y = x x x 2 x x x 3 2
 > M<-mesh(x,y) > par(mar = c(2, 2, 2, 2)) > surf3d(x=m$x,y=m$y, + z=70.583*m$x*m$x+-75.")
28 > library(plot3d) > x<-seq(-1,1,by=.1) > y<-seq(-1,1,by=.1) > M<-mesh(x,y) > par(mar = c(2, 2, 2, 2)) > surf3d(x=m$x,y=m$y, + z=70.583*m$x*m$x *m$y*m$y, + bty="b2",xlab="x2",ylab="x3", + zlab="y", + main=expression("y=70.583x"[2]^2*" x"[3]^2))
29 > contour2d(x=x,y=y, + z=70.583*m$x*m$x *m$y*m$y, + xlab="x2",ylab="x3",lwd=3, + drape = FALSE, + main=expression("y=70.583x"[2]^2*" X"[3]^2)) The smallest observed contour is -60 (the objetive is to minimize syrup loss)
30 Factorial with Mixed Levels Two-level factorial and fractional designs are of great practical importance The three-level system is much less useful because the designs are relatively large even for a modest number of factors In some situations it is necessary to include a factor (or a few factors) that has more than two levels
31 Example Data As an example, assume that you conducted an experiment in which you were interested in the extent to which visual distraction affects younger and older people's learning and remembering. To do this, you obtained a group of younger adults and a separate group of older adults and had them learn under three conditions (eyes closed, eyes open looking at a blank field, eyes open looking at a distracting field of pictures). This is a 2 (age) x 3 (distraction condition) mixed factorial design. The scores on the data sheet below represent the number of words recalled out of ten under each distraction condition.
32 > design2x3 <- regular.design(factors=list(age=1:2,distraction=1:3), + model=~age*distraction, + nunits=24) > print(design2x3@design) Age Distraction
33 > + 7,6,6, + 8,7,6, + 7,5,4, + 6,5,2, + 5,5,4, + 5,4,3, + 6,3,2) > design2x3.aov <- aov(y~age*distraction, data=design2x3) > summary(design2x3.aov) Df Sum Sq Mean Sq F value Pr(>F) Age *** Distraction e-05 *** Age:Distraction Residuals Signif. codes: 0 *** ** 0.01 * The test indicates: a) there is a significant effect of the age condition on word memory. b) that there is a significant effect of the distraction condition on word memorization; c) the lack of an interaction between distraction and age indicates that this effect is consistent for both younger and older participants.
34 Additional Designs Nested (or Hierarchical) Designs The levels of one factor (e.g. B) are similar but not identical for different levels of another factor (e.g. A) The levels of factor B are nested under the levels of factor A Example Two-stage nested design: suppliers batches observation» A company purchases raw material from three different suppliers» Is the purity of the raw material the same from each supplier?» There are four batches of raw material available from each supplier, and three determinations of purity from each batch
35 Why it is not a factorial example?» The batches from each supplier are unique from that particular supplier Batch 1 from supplier 1 has no connection with batch 1 from supplier 2, batch 2 from supplier 1 has no connection with batch 2 from supplier 2, and so forth.» To emphasize the fact that the batches from each supplier are different batches we may rename the batches:

36 Consider a company that buys raw material in batches from three different suppliers. The purity of this raw material varies considerably, which causes problems in manufacturing the finished product. We wish to determine whether the variability in purity is attributable to differences between suppliers. Four batches of raw material are selected at random from each supplier, and three determinations of purity are made on each batch.

37 P-Values: There is no signficant effect on purity due to suppliers The purity of batches of raw material from the same supplier does differ significantly

38 Split-Plot Designs In some experiments, we may be unable to completely randomize the order of the run Whole plots or main treatments Subplots or split-plots
39 Ex: a paper manufacturer is interested in three different pulp preparation methods and four differen cooking temperatures to study these effects on the tensile strength of the paper Each replicate requires 12 observations, and the experimenter has decided to run 3 replicates 36 runs A batch of pulp is produced by one of the three methods This batch is divided into four samples, and each sample is cooked at one of the four temperatures Then a second batch of pulp is made up using another of the three methods...
40 Why it is not a factorial example (three levels of preparation method, factor A, four levels of temperature, factor B)? If this is the case, then the order of the experimentation within each replicate should be completely randomized Treatment combinations (preparation method and temperature) should be randomly selected But, the experimenter did no collect the data this way He made up a batch of pulp and obtained observations for all temperatures from that batch The only feasible way to run this experiment: preparing the bathes (economics) and the size of the batches A completely randomized factorial experiment: 36 batches of pulp Split-plot design: 9 batches total
41 9 whole plots (preparation methods) 4 subplot treatments (temperatures)
42 The linear model y ijk = μ + τ i + β j + τβ ij + γ k + τγ ik + βγ jk + τβγ ijk + ε ijk i = 1,2,, r j = 1,2,, a k = 1,2,, b where τ i, β j, and τβ ij represent the whole plot and correspond, respectively, to replicates, main treatments (factor A), and whole-plot error (replicates A); and γ k, τγ ik, βγ jk, and τβγ ijk represent the subplot and correspond, respectively, to the subplot treatment (factor B), the replicates B and AB interactions, and the subplot error (replicates AB).
43
44
, one variety to a field Each field could be divided into, say, four subplots, and each subplot could be treated with different type os fertilizer.")
45 The split-plot design has an agricultural heritage Whole plots: large areas of land Subplots: smaller areas of land within large areas Ex: several varieties of a crop could be planted in different fields (whole plots), one variety to a field Each field could be divided into, say, four subplots, and each subplot could be treated with different type os fertilizer. Here the crop varietes are the main treatments and the different fertilizers are the subtreatments.
46 Lab
Lec 5: Factorial Experiment
 November 21, 2011 Example Study of the battery life vs the factors temperatures and types of material. A: Types of material, 3 levels. B: Temperatures, 3 levels. Example Study of the battery life vs the
Lecture 11: Nested and Split-Plot Designs
 Lecture 11: Nested and Split-Plot Designs Montgomery, Chapter 14 1 Lecture 11 Page 1 Crossed vs Nested Factors Factors A (a levels)and B (b levels) are considered crossed if Every combinations of A and
Lecture 10. Factorial experiments (2-way ANOVA etc)
") Lecture 10. Factorial experiments (2-way ANOVA etc) Jesper Rydén Matematiska institutionen, Uppsala universitet jesper@math.uu.se Regression and Analysis of Variance autumn 2014 A factorial experiment
Lecture 10. Factorial experiments (2-way ANOVA etc) Jesper Rydén Matematiska institutionen, Uppsala universitet jesper@math.uu.se Regression and Analysis of Variance autumn 2014 A factorial experiment
Design and Analysis of Experiments
 Design and Analysis of Experiments Part IX: Response Surface Methodology Prof. Dr. Anselmo E de Oliveira anselmo.quimica.ufg.br anselmo.disciplinas@gmail.com Methods Math Statistics Models/Analyses Response
Chapter 5 Introduction to Factorial Designs
 Chapter 5 Introduction to Factorial Designs 5. Basic Definitions and Principles Stud the effects of two or more factors. Factorial designs Crossed: factors are arranged in a factorial design Main effect:
Design of Engineering Experiments Chapter 5 Introduction to Factorials
 Design of Engineering Experiments Chapter 5 Introduction to Factorials Text reference, Chapter 5 page 170 General principles of factorial experiments The two-factor factorial with fixed effects The ANOVA
These are multifactor experiments that have
 Design of Engineering Experiments Nested Designs Text reference, Chapter 14, Pg. 525 These are multifactor experiments that have some important industrial applications Nested and split-plot designs frequently
Factorial designs. Experiments
 Chapter 5: Factorial designs Petter Mostad mostad@chalmers.se Experiments Actively making changes and observing the result, to find causal relationships. Many types of experimental plans Measuring response
Contents. TAMS38 - Lecture 8 2 k p fractional factorial design. Lecturer: Zhenxia Liu. Example 0 - continued 4. Example 0 - Glazing ceramic 3
 Contents TAMS38 - Lecture 8 2 k p fractional factorial design Lecturer: Zhenxia Liu Department of Mathematics - Mathematical Statistics Example 0 2 k factorial design with blocking Example 1 2 k p fractional
Lecture 9: Factorial Design Montgomery: chapter 5
 Lecture 9: Factorial Design Montgomery: chapter 5 Page 1 Examples Example I. Two factors (A, B) each with two levels (, +) Page 2 Three Data for Example I Ex.I-Data 1 A B + + 27,33 51,51 18,22 39,41 EX.I-Data
Chapter 5 Introduction to Factorial Designs Solutions
 Solutions from Montgomery, D. C. (1) Design and Analysis of Experiments, Wiley, NY Chapter 5 Introduction to Factorial Designs Solutions 5.1. The following output was obtained from a computer program that
Design & Analysis of Experiments 7E 2009 Montgomery
 Chapter 5 1 Introduction to Factorial Design Study the effects of 2 or more factors All possible combinations of factor levels are investigated For example, if there are a levels of factor A and b levels
Reference: Chapter 14 of Montgomery (8e)
") Reference: Chapter 14 of Montgomery (8e) 99 Maghsoodloo The Stage Nested Designs So far emphasis has been placed on factorial experiments where all factors are crossed (i.e., it is possible to study the
Reference: Chapter 14 of Montgomery (8e) 99 Maghsoodloo The Stage Nested Designs So far emphasis has been placed on factorial experiments where all factors are crossed (i.e., it is possible to study the
Factorial Treatment Structure: Part I. Lukas Meier, Seminar für Statistik
 Factorial Treatment Structure: Part I Lukas Meier, Seminar für Statistik Factorial Treatment Structure So far (in CRD), the treatments had no structure. So called factorial treatment structure exists if
STAT Final Practice Problems
 STAT 48 -- Final Practice Problems.Out of 5 women who had uterine cancer, 0 claimed to have used estrogens. Out of 30 women without uterine cancer 5 claimed to have used estrogens. Exposure Outcome (Cancer)
3. Factorial Experiments (Ch.5. Factorial Experiments)
") 3. Factorial Experiments (Ch.5. Factorial Experiments) Hae-Jin Choi School of Mechanical Engineering, Chung-Ang University DOE and Optimization 1 Introduction to Factorials Most experiments for process
3. Factorial Experiments (Ch.5. Factorial Experiments) Hae-Jin Choi School of Mechanical Engineering, Chung-Ang University DOE and Optimization 1 Introduction to Factorials Most experiments for process
Solution to Final Exam
 Stat 660 Solution to Final Exam. (5 points) A large pharmaceutical company is interested in testing the uniformity (a continuous measurement that can be taken by a measurement instrument) of their film-coated
Contents. TAMS38 - Lecture 6 Factorial design, Latin Square Design. Lecturer: Zhenxia Liu. Factorial design 3. Complete three factor design 4
 Contents Factorial design TAMS38 - Lecture 6 Factorial design, Latin Square Design Lecturer: Zhenxia Liu Department of Mathematics - Mathematical Statistics 28 November, 2017 Complete three factor design
1 Use of indicator random variables. (Chapter 8)
") 1 Use of indicator random variables. (Chapter 8) let I(A) = 1 if the event A occurs, and I(A) = 0 otherwise. I(A) is referred to as the indicator of the event A. The notation I A is often used. 1 2 Fitting
1 Use of indicator random variables. (Chapter 8) let I(A) = 1 if the event A occurs, and I(A) = 0 otherwise. I(A) is referred to as the indicator of the event A. The notation I A is often used. 1 2 Fitting
SMA 6304 / MIT / MIT Manufacturing Systems. Lecture 10: Data and Regression Analysis. Lecturer: Prof. Duane S. Boning
 SMA 6304 / MIT 2.853 / MIT 2.854 Manufacturing Systems Lecture 10: Data and Regression Analysis Lecturer: Prof. Duane S. Boning 1 Agenda 1. Comparison of Treatments (One Variable) Analysis of Variance
Reference: Chapter 13 of Montgomery (8e)
") Reference: Chapter 1 of Montgomery (8e) Maghsoodloo 89 Factorial Experiments with Random Factors So far emphasis has been placed on factorial experiments where all factors are at a, b, c,... fixed levels
Reference: Chapter 1 of Montgomery (8e) Maghsoodloo 89 Factorial Experiments with Random Factors So far emphasis has been placed on factorial experiments where all factors are at a, b, c,... fixed levels
STATISTICS 368 AN EXPERIMENT IN AIRCRAFT PRODUCTION Christopher Wiens & Douglas Wiens
 STATISTICS 368 AN EXPERIMENT IN AIRCRAFT PRODUCTION Christopher Wiens & Douglas Wiens April 21, 2005 The progress of science. 1. Preliminary description of experiment We set out to determine the factors
Design and Analysis of Experiments
 Design and Analysis of Experiments Part VII: Fractional Factorial Designs Prof. Dr. Anselmo E de Oliveira anselmo.quimica.ufg.br anselmo.disciplinas@gmail.com 2 k : increasing k the number of runs required
Section 4.6 Simple Linear Regression
 Section 4.6 Simple Linear Regression Objectives ˆ Basic philosophy of SLR and the regression assumptions ˆ Point & interval estimation of the model parameters, and how to make predictions ˆ Point and interval
FACTORIAL DESIGNS and NESTED DESIGNS
 Experimental Design and Statistical Methods Workshop FACTORIAL DESIGNS and NESTED DESIGNS Jesús Piedrafita Arilla jesus.piedrafita@uab.cat Departament de Ciència Animal i dels Aliments Items Factorial
Addition of Center Points to a 2 k Designs Section 6-6 page 271
 to a 2 k Designs Section 6-6 page 271 Based on the idea of replicating some of the runs in a factorial design 2 level designs assume linearity. If interaction terms are added to model some curvature results
Stat 579: Generalized Linear Models and Extensions
 Stat 579: Generalized Linear Models and Extensions Mixed models Yan Lu Feb, 2018, week 7 1 / 17 Some commonly used experimental designs related to mixed models Two way or three way random/mixed effects
Written Exam (2 hours)
") M. Müller Applied Analysis of Variance and Experimental Design Summer 2015 Written Exam (2 hours) General remarks: Open book exam. Switch off your mobile phone! Do not stay too long on a part where you
M. Müller Applied Analysis of Variance and Experimental Design Summer 2015 Written Exam (2 hours) General remarks: Open book exam. Switch off your mobile phone! Do not stay too long on a part where you
2-way analysis of variance
 2-way analysis of variance We may be considering the effect of two factors (A and B) on our response variable, for instance fertilizer and variety on maize yield; or therapy and sex on cholesterol level.
Design and Analysis of Experiments. David Yanez Department of Biostatistics University of Washington
 Design and Analysis of Experiments David Yanez Department of Biostatistics University of Washington Outline Basic Ideas Definitions Structures of an Experimental Design Design Structure Treatment Structure
MODELS WITHOUT AN INTERCEPT
 Consider the balanced two factor design MODELS WITHOUT AN INTERCEPT Factor A 3 levels, indexed j 0, 1, 2; Factor B 5 levels, indexed l 0, 1, 2, 3, 4; n jl 4 replicate observations for each factor level
Part 5 Introduction to Factorials
 More Statistics tutorial at www.dumblittledoctor.com Lecture notes on Experiment Design & Data Analysis Design of Engineering Experiments Part 5 Introduction to Factorials Text reference, Chapter 5 General
Comparing Nested Models
 Comparing Nested Models ST 370 Two regression models are called nested if one contains all the predictors of the other, and some additional predictors. For example, the first-order model in two independent
Stat 217 Final Exam. Name: May 1, 2002
 Stat 217 Final Exam Name: May 1, 2002 Problem 1. Three brands of batteries are under study. It is suspected that the lives (in weeks) of the three brands are different. Five batteries of each brand are
Inference for Regression
 Inference for Regression Section 9.4 Cathy Poliak, Ph.D. cathy@math.uh.edu Office in Fleming 11c Department of Mathematics University of Houston Lecture 13b - 3339 Cathy Poliak, Ph.D. cathy@math.uh.edu
3. Design Experiments and Variance Analysis
 3. Design Experiments and Variance Analysis Isabel M. Rodrigues 1 / 46 3.1. Completely randomized experiment. Experimentation allows an investigator to find out what happens to the output variables when
Key Features: More than one type of experimental unit and more than one randomization.
 1 SPLIT PLOT DESIGNS Key Features: More than one type of experimental unit and more than one randomization. Typical Use: When one factor is difficult to change. Example (and terminology): An agricultural
Multiple Regression: Example
 Multiple Regression: Example Cobb-Douglas Production Function The Cobb-Douglas production function for observed economic data i = 1,..., n may be expressed as where O i is output l i is labour input c
Contents. 2 2 factorial design 4
 Contents TAMS38 - Lecture 10 Response surface methodology Lecturer: Zhenxia Liu Department of Mathematics - Mathematical Statistics 12 December, 2017 2 2 factorial design Polynomial Regression model First
Stat 412/512 TWO WAY ANOVA. Charlotte Wickham. stat512.cwick.co.nz. Feb
 Stat 42/52 TWO WAY ANOVA Feb 6 25 Charlotte Wickham stat52.cwick.co.nz Roadmap DONE: Understand what a multiple regression model is. Know how to do inference on single and multiple parameters. Some extra
Process/product optimization using design of experiments and response surface methodology
 Process/product optimization using design of experiments and response surface methodology Mikko Mäkelä Sveriges landbruksuniversitet Swedish University of Agricultural Sciences Department of Forest Biomaterials
Exercise I.1 I.2 I.3 I.4 II.1 II.2 III.1 III.2 III.3 IV.1 Question (1) (2) (3) (4) (5) (6) (7) (8) (9) (10) Answer
 (2) (3) (4) (5) (6) (7) (8) (9) (10) Answer") Solutions to Exam in 02402 December 2012 Exercise I.1 I.2 I.3 I.4 II.1 II.2 III.1 III.2 III.3 IV.1 Question (1) (2) (3) (4) (5) (6) (7) (8) (9) (10) Answer 3 1 5 2 5 2 3 5 1 3 Exercise IV.2 IV.3 IV.4 V.1
Solutions to Exam in 02402 December 2012 Exercise I.1 I.2 I.3 I.4 II.1 II.2 III.1 III.2 III.3 IV.1 Question (1) (2) (3) (4) (5) (6) (7) (8) (9) (10) Answer 3 1 5 2 5 2 3 5 1 3 Exercise IV.2 IV.3 IV.4 V.1
STAT 135 Lab 10 Two-Way ANOVA, Randomized Block Design and Friedman s Test
 STAT 135 Lab 10 Two-Way ANOVA, Randomized Block Design and Friedman s Test Rebecca Barter April 13, 2015 Let s now imagine a dataset for which our response variable, Y, may be influenced by two factors,
3.4. A computer ANOVA output is shown below. Fill in the blanks. You may give bounds on the P-value.
 3.4. A computer ANOVA output is shown below. Fill in the blanks. You may give bounds on the P-value. One-way ANOVA Source DF SS MS F P Factor 3 36.15??? Error??? Total 19 196.04 Completed table is: One-way
MEMORIAL UNIVERSITY OF NEWFOUNDLAND DEPARTMENT OF MATHEMATICS AND STATISTICS FINAL EXAM - STATISTICS FALL 1999
 MEMORIAL UNIVERSITY OF NEWFOUNDLAND DEPARTMENT OF MATHEMATICS AND STATISTICS FINAL EXAM - STATISTICS 350 - FALL 1999 Instructor: A. Oyet Date: December 16, 1999 Name(Surname First): Student Number INSTRUCTIONS
Unit 9: Confounding and Fractional Factorial Designs
 Unit 9: Confounding and Fractional Factorial Designs STA 643: Advanced Experimental Design Derek S. Young 1 Learning Objectives Understand what it means for a treatment to be confounded with blocks Know
Topic 9: Factorial treatment structures. Introduction. Terminology. Example of a 2x2 factorial
 Topic 9: Factorial treatment structures Introduction A common objective in research is to investigate the effect of each of a number of variables, or factors, on some response variable. In earlier times,
Chapter 9 Other Topics on Factorial and Fractional Factorial Designs
 Chapter 9 Other Topics on Factorial and Fractional Factorial Designs 許湘伶 Design and Analysis of Experiments (Douglas C. Montgomery) hsuhl (NUK) DAE Chap. 9 1 / 26 The 3 k Factorial Design 3 k factorial
Analysis of Variance and Design of Experiments-I
 Analysis of Variance and Design of Experiments-I MODULE VIII LECTURE - 35 ANALYSIS OF VARIANCE IN RANDOM-EFFECTS MODEL AND MIXED-EFFECTS MODEL Dr. Shalabh Department of Mathematics and Statistics Indian
Stat 5031 Quadratic Response Surface Methods (QRSM) Sanford Weisberg November 30, 2015
 Sanford Weisberg November 30, 2015") Stat 5031 Quadratic Response Surface Methods (QRSM) Sanford Weisberg November 30, 2015 One Variable x = spacing of plants (either 4, 8 12 or 16 inches), and y = plant yield (bushels per acre). Each condition
Stat 5031 Quadratic Response Surface Methods (QRSM) Sanford Weisberg November 30, 2015 One Variable x = spacing of plants (either 4, 8 12 or 16 inches), and y = plant yield (bushels per acre). Each condition
Design and Analysis of Experiments Prof. Jhareshwar Maiti Department of Industrial and Systems Engineering Indian Institute of Technology, Kharagpur
 Design and Analysis of Experiments Prof. Jhareshwar Maiti Department of Industrial and Systems Engineering Indian Institute of Technology, Kharagpur Lecture 51 Plackett Burman Designs Hello, welcome. We
Open book and notes. 120 minutes. Covers Chapters 8 through 14 of Montgomery and Runger (fourth edition).
.") IE 330 Seat # Open book and notes 10 minutes Covers Chapters 8 through 14 of Montgomery and Runger (fourth edition) Cover page and eight pages of exam No calculator ( points) I have, or will, complete
IE 330 Seat # Open book and notes 10 minutes Covers Chapters 8 through 14 of Montgomery and Runger (fourth edition) Cover page and eight pages of exam No calculator ( points) I have, or will, complete
In a one-way ANOVA, the total sums of squares among observations is partitioned into two components: Sums of squares represent:
 Activity #10: AxS ANOVA (Repeated subjects design) Resources: optimism.sav So far in MATH 300 and 301, we have studied the following hypothesis testing procedures: 1) Binomial test, sign-test, Fisher s
Chap The McGraw-Hill Companies, Inc. All rights reserved.
 11 pter11 Chap Analysis of Variance Overview of ANOVA Multiple Comparisons Tests for Homogeneity of Variances Two-Factor ANOVA Without Replication General Linear Model Experimental Design: An Overview
2.830J / 6.780J / ESD.63J Control of Manufacturing Processes (SMA 6303) Spring 2008
 Spring 2008") MIT OpenCourseWare http://ocw.mit.edu 2.830J / 6.780J / ESD.63J Control of Processes (SMA 6303) Spring 2008 For information about citing these materials or our Terms of Use, visit: http://ocw.mit.edu/terms.
MIT OpenCourseWare http://ocw.mit.edu 2.830J / 6.780J / ESD.63J Control of Processes (SMA 6303) Spring 2008 For information about citing these materials or our Terms of Use, visit: http://ocw.mit.edu/terms.
psyc3010 lecture 2 factorial between-ps ANOVA I: omnibus tests
 psyc3010 lecture 2 factorial between-ps ANOVA I: omnibus tests last lecture: introduction to factorial designs next lecture: factorial between-ps ANOVA II: (effect sizes and follow-up tests) 1 general
Two-Way Factorial Designs
 81-86 Two-Way Factorial Designs Yibi Huang 81-86 Two-Way Factorial Designs Chapter 8A - 1 Problem 81 Sprouting Barley (p166 in Oehlert) Brewer s malt is produced from germinating barley, so brewers like
What If There Are More Than. Two Factor Levels?
 What If There Are More Than Chapter 3 Two Factor Levels? Comparing more that two factor levels the analysis of variance ANOVA decomposition of total variability Statistical testing & analysis Checking
Cuckoo Birds. Analysis of Variance. Display of Cuckoo Bird Egg Lengths
 Cuckoo Birds Analysis of Variance Bret Larget Departments of Botany and of Statistics University of Wisconsin Madison Statistics 371 29th November 2005 Cuckoo birds have a behavior in which they lay their
Stat 401B Final Exam Fall 2015
 Stat 401B Final Exam Fall 015 I have neither given nor received unauthorized assistance on this exam. Name Signed Date Name Printed ATTENTION! Incorrect numerical answers unaccompanied by supporting reasoning
Multiple Linear Regression
 Multiple Linear Regression ST 430/514 Recall: a regression model describes how a dependent variable (or response) Y is affected, on average, by one or more independent variables (or factors, or covariates).
Statistics GIDP Ph.D. Qualifying Exam Methodology
 Statistics GIDP Ph.D. Qualifying Exam Methodology January 9, 2018, 9:00am 1:00pm Instructions: Put your ID (not your name) on each sheet. Complete exactly 5 of 6 problems; turn in only those sheets you
Chemical Engineering: 4C3/6C3 Statistics for Engineering McMaster University: Final examination
 Chemical Engineering: 4C3/6C3 Statistics for Engineering McMaster University: Final examination Duration of exam: 3 hours Instructor: Kevin Dunn 07 April 2012 dunnkg@mcmaster.ca This exam paper has 8 pages
TWO-LEVEL FACTORIAL EXPERIMENTS: IRREGULAR FRACTIONS
 STAT 512 2-Level Factorial Experiments: Irregular Fractions 1 TWO-LEVEL FACTORIAL EXPERIMENTS: IRREGULAR FRACTIONS A major practical weakness of regular fractional factorial designs is that N must be a
Biostatistics 380 Multiple Regression 1. Multiple Regression
 Biostatistics 0 Multiple Regression ORIGIN 0 Multiple Regression Multiple Regression is an extension of the technique of linear regression to describe the relationship between a single dependent (response)
Chapter 12. Analysis of variance
 Serik Sagitov, Chalmers and GU, January 9, 016 Chapter 1. Analysis of variance Chapter 11: I = samples independent samples paired samples Chapter 1: I 3 samples of equal size J one-way layout two-way layout
Two (or more) factors, say A and B, with a and b levels, respectively.
 factors, say A and B, with a and b levels, respectively.") Factorial Designs ST 516 Two (or more) factors, say A and B, with a and b levels, respectively. A factorial design uses all ab combinations of levels of A and B, for a total of ab treatments. When both
Factorial Designs ST 516 Two (or more) factors, say A and B, with a and b levels, respectively. A factorial design uses all ab combinations of levels of A and B, for a total of ab treatments. When both
Multiple Predictor Variables: ANOVA
 Multiple Predictor Variables: ANOVA 1/32 Linear Models with Many Predictors Multiple regression has many predictors BUT - so did 1-way ANOVA if treatments had 2 levels What if there are multiple treatment
Exam Applied Statistical Regression. Good Luck!
 Dr. M. Dettling Summer 2011 Exam Applied Statistical Regression Approved: Tables: Note: Any written material, calculator (without communication facility). Attached. All tests have to be done at the 5%-level.
Regression. Marc H. Mehlman University of New Haven
 Regression Marc H. Mehlman marcmehlman@yahoo.com University of New Haven the statistician knows that in nature there never was a normal distribution, there never was a straight line, yet with normal and
Linear Model Specification in R
 Linear Model Specification in R How to deal with overparameterisation? Paul Janssen 1 Luc Duchateau 2 1 Center for Statistics Hasselt University, Belgium 2 Faculty of Veterinary Medicine Ghent University,
ANOVA: Comparing More Than Two Means
 1 ANOVA: Comparing More Than Two Means 10.1 ANOVA: The Completely Randomized Design Elements of a Designed Experiment Before we begin any calculations, we need to discuss some terminology. To make this
Analysis of Variance (ANOVA)
") Analysis of Variance (ANOVA) Two types of ANOVA tests: Independent measures and Repeated measures Comparing 2 means: X 1 = 20 t - test X 2 = 30 How can we Compare 3 means?: X 1 = 20 X 2 = 30 X 3 = 35 ANOVA
Analysis of Variance (ANOVA) Two types of ANOVA tests: Independent measures and Repeated measures Comparing 2 means: X 1 = 20 t - test X 2 = 30 How can we Compare 3 means?: X 1 = 20 X 2 = 30 X 3 = 35 ANOVA
UNIVERSITY OF TORONTO Faculty of Arts and Science
 UNIVERSITY OF TORONTO Faculty of Arts and Science December 2013 Final Examination STA442H1F/2101HF Methods of Applied Statistics Jerry Brunner Duration - 3 hours Aids: Calculator Model(s): Any calculator
TWO OR MORE RANDOM EFFECTS. The two-way complete model for two random effects:
 TWO OR MORE RANDOM EFFECTS Example: The factors that influence the breaking strength of a synthetic fiber are being studied. Four production machines and three operators are randomly selected. A two-way
ST430 Exam 1 with Answers
 ST430 Exam 1 with Answers Date: October 5, 2015 Name: Guideline: You may use one-page (front and back of a standard A4 paper) of notes. No laptop or textook are permitted but you may use a calculator.
STAT 213 Interactions in Two-Way ANOVA
 STAT 213 Interactions in Two-Way ANOVA Colin Reimer Dawson Oberlin College 14 April 2016 Outline Last Time: Two-Way ANOVA Interaction Terms Reading Quiz (Multiple Choice) If there is no interaction present,
RESPONSE SURFACE MODELLING, RSM
 CHEM-E3205 BIOPROCESS OPTIMIZATION AND SIMULATION LECTURE 3 RESPONSE SURFACE MODELLING, RSM Tool for process optimization HISTORY Statistical experimental design pioneering work R.A. Fisher in 1925: Statistical
Increasing precision by partitioning the error sum of squares: Blocking: SSE (CRD) à SSB + SSE (RCBD) Contrasts: SST à (t 1) orthogonal contrasts
 à SSB + SSE (RCBD) Contrasts: SST à (t 1) orthogonal contrasts") Lecture 13 Topic 9: Factorial treatment structures (Part II) Increasing precision by partitioning the error sum of squares: s MST F = = MSE 2 among = s 2 within SST df trt SSE df e Blocking: SSE (CRD)
Lecture 13 Topic 9: Factorial treatment structures (Part II) Increasing precision by partitioning the error sum of squares: s MST F = = MSE 2 among = s 2 within SST df trt SSE df e Blocking: SSE (CRD)
Unit 8: 2 k Factorial Designs, Single or Unequal Replications in Factorial Designs, and Incomplete Block Designs
 Unit 8: 2 k Factorial Designs, Single or Unequal Replications in Factorial Designs, and Incomplete Block Designs STA 643: Advanced Experimental Design Derek S. Young 1 Learning Objectives Revisit your
Workshop 7.4a: Single factor ANOVA
 -1- Workshop 7.4a: Single factor ANOVA Murray Logan November 23, 2016 Table of contents 1 Revision 1 2 Anova Parameterization 2 3 Partitioning of variance (ANOVA) 10 4 Worked Examples 13 1. Revision 1.1.
Allow the investigation of the effects of a number of variables on some response
 Lecture 12 Topic 9: Factorial treatment structures (Part I) Factorial experiments Allow the investigation of the effects of a number of variables on some response in a highly efficient manner, and in a
. Example: For 3 factors, sse = (y ijkt. " y ijk
 ANALYSIS OF BALANCED FACTORIAL DESIGNS Estimates of model parameters and contrasts can be obtained by the method of Least Squares. Additional constraints must be added to estimate non-estimable parameters.
Institutionen för matematik och matematisk statistik Umeå universitet November 7, Inlämningsuppgift 3. Mariam Shirdel
 Institutionen för matematik och matematisk statistik Umeå universitet November 7, 2011 Inlämningsuppgift 3 Mariam Shirdel (mash0007@student.umu.se) Kvalitetsteknik och försöksplanering, 7.5 hp 1 Uppgift
Factorial and Unbalanced Analysis of Variance
 Factorial and Unbalanced Analysis of Variance Nathaniel E. Helwig Assistant Professor of Psychology and Statistics University of Minnesota (Twin Cities) Updated 04-Jan-2017 Nathaniel E. Helwig (U of Minnesota)
7. Response Surface Methodology (Ch.10. Regression Modeling Ch. 11. Response Surface Methodology)
") 7. Response Surface Methodology (Ch.10. Regression Modeling Ch. 11. Response Surface Methodology) Hae-Jin Choi School of Mechanical Engineering, Chung-Ang University 1 Introduction Response surface methodology,
7. Response Surface Methodology (Ch.10. Regression Modeling Ch. 11. Response Surface Methodology) Hae-Jin Choi School of Mechanical Engineering, Chung-Ang University 1 Introduction Response surface methodology,
Stat 6640 Solution to Midterm #2
 Stat 6640 Solution to Midterm #2 1. A study was conducted to examine how three statistical software packages used in a statistical course affect the statistical competence a student achieves. At the end
IE 316 Exam 1 Fall 2011
 IE 316 Exam 1 Fall 2011 I have neither given nor received unauthorized assistance on this exam. Name Signed Date Name Printed 1 1. Suppose the actual diameters x in a batch of steel cylinders are normally
STAT22200 Spring 2014 Chapter 8A
 STAT22200 Spring 2014 Chapter 8A Yibi Huang May 13, 2014 81-86 Two-Way Factorial Designs Chapter 8A - 1 Problem 81 Sprouting Barley (p166 in Oehlert) Brewer s malt is produced from germinating barley,
Biostatistics for physicists fall Correlation Linear regression Analysis of variance
 Biostatistics for physicists fall 2015 Correlation Linear regression Analysis of variance Correlation Example: Antibody level on 38 newborns and their mothers There is a positive correlation in antibody
Suppose we needed four batches of formaldehyde, and coulddoonly4runsperbatch. Thisisthena2 4 factorial in 2 2 blocks.
 58 2. 2 factorials in 2 blocks Suppose we needed four batches of formaldehyde, and coulddoonly4runsperbatch. Thisisthena2 4 factorial in 2 2 blocks. Some more algebra: If two effects are confounded with
Contents. TAMS38 - Lecture 10 Response surface. Lecturer: Jolanta Pielaszkiewicz. Response surface 3. Response surface, cont. 4
 Contents TAMS38 - Lecture 10 Response surface Lecturer: Jolanta Pielaszkiewicz Matematisk statistik - Matematiska institutionen Linköpings universitet Look beneath the surface; let not the several quality
MSc / PhD Course Advanced Biostatistics. dr. P. Nazarov
 MSc / PhD Course Advanced Biostatistics dr. P. Nazarov petr.nazarov@crp-sante.lu 04-1-013 L4. Linear models edu.sablab.net/abs013 1 Outline ANOVA (L3.4) 1-factor ANOVA Multifactor ANOVA Experimental design
Analysis of Variance
 Analysis of Variance Blood coagulation time T avg A 62 60 63 59 61 B 63 67 71 64 65 66 66 C 68 66 71 67 68 68 68 D 56 62 60 61 63 64 63 59 61 64 Blood coagulation time A B C D Combined 56 57 58 59 60 61
Response Surface Methodology
 Response Surface Methodology Bruce A Craig Department of Statistics Purdue University STAT 514 Topic 27 1 Response Surface Methodology Interested in response y in relation to numeric factors x Relationship
Part II { Oneway Anova, Simple Linear Regression and ANCOVA with R
 Part II { Oneway Anova, Simple Linear Regression and ANCOVA with R Gilles Lamothe February 21, 2017 Contents 1 Anova with one factor 2 1.1 The data.......................................... 2 1.2 A visual
EXAM IN TMA4255 EXPERIMENTAL DESIGN AND APPLIED STATISTICAL METHODS
 Norges teknisk naturvitenskapelige universitet Institutt for matematiske fag Side 1 av 8 Contact during exam: Bo Lindqvist Tel. 975 89 418 EXAM IN TMA4255 EXPERIMENTAL DESIGN AND APPLIED STATISTICAL METHODS
Stat 401B Exam 2 Fall 2015
 Stat 401B Exam Fall 015 I have neither given nor received unauthorized assistance on this exam. Name Signed Date Name Printed ATTENTION! Incorrect numerical answers unaccompanied by supporting reasoning
ST430 Exam 2 Solutions
 ST430 Exam 2 Solutions Date: November 9, 2015 Name: Guideline: You may use one-page (front and back of a standard A4 paper) of notes. No laptop or textbook are permitted but you may use a calculator. Giving
Nature vs. nurture? Lecture 18 - Regression: Inference, Outliers, and Intervals. Regression Output. Conditions for inference.
 Understanding regression output from software Nature vs. nurture? Lecture 18 - Regression: Inference, Outliers, and Intervals In 1966 Cyril Burt published a paper called The genetic determination of differences