~ "'~ ,~ ~.., 0,(",,- ':. C I \..," "'471S Of. Thomas C. Walsh Chief, Demographic Surveys Division " '-
|
|
|
- Bethanie Paul
- 5 years ago
- Views:
Transcription

1 .. ("-..y "' ':. C.. f. \.." "'471S Of UNTED STATES DEPARTMENT OF COMMERCE Bureau of the Census Washngton. D.C 2233 December MEMORANDUM FOR From: Thomas C. Walsh Chef Demographc Surveys Dvson " '- Paula J. Schneder :.":::: ;- Chef Populaton Dvson ;-- t::) Subject: Post Edt Completeness and Consstency Checks for the Work Experence Earnngs and Longest Job Porton of the March 1988 CPS ncome Supplement Rewrte Attached are the proposed specfcatons for determnng completeness and consstency of post edted work experence earnngs and longest job data for the March 1988 CPS ncome supplement rewrte. Please revew and return all comments to Ed Welnak of the ncome Statstcs Branch. Attachment cc: G. Russell (DSD B. Fnk D. Rccn K. Creghton T. Varhach S. Gajewsk R. Tucker D. Alexander G. Green (POP) T. Scopp J. Prebe T. Palumbo J. Coder C. Nelson E. Welnak Pop. Dv. Fles Chron POP:EWeln;ak:sls
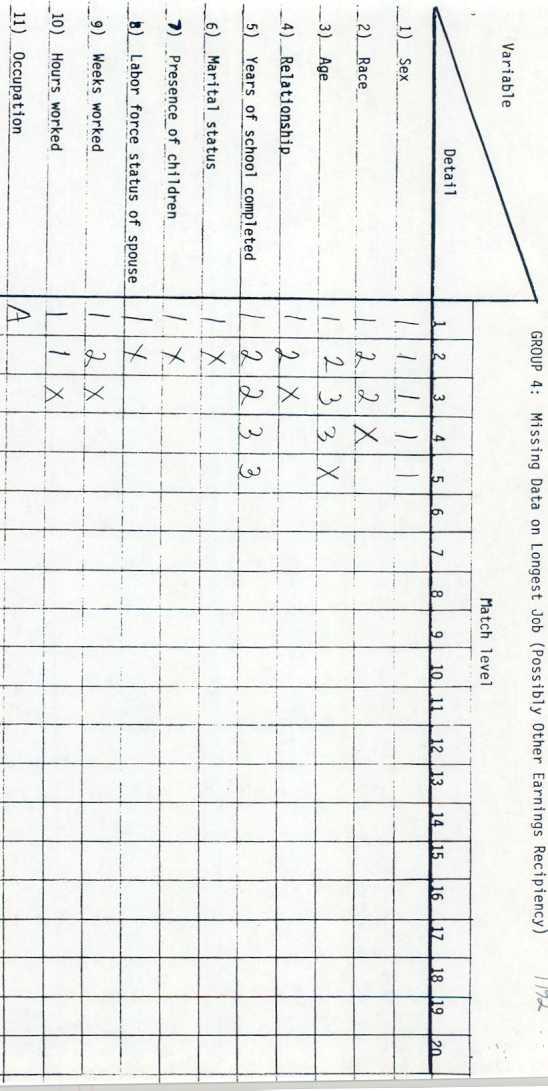
2 Post Edt Completeness and Consstency Checks After havng completed the ndvdual work experence earnngs and longest job edts each ncome supplement s checked for completeness and consstency among the edted data tems (see Fgure 1). nconsstent response patterns nvoke error condtons. ncomplete supplements are flagged for allocaton of mssng responses durng the jont work experence earnngs longest job statstcal match. The seres of flags carred on each ncomplete supplement ndcate specfc peces of nformaton are mssng and n need of allocaton. Collectvely the value of the flags set represents a nonresponse pattern that can be classfed nto one of 12 groups (see Table 9). Each group uses a unque set of varables to match donors (complete supplements) wth recpents (ncomplete supplements) for the purpose of fllng mssng data. The set of match varables used can be found n Table 1. To try and acheve the best match possble between donors and recpents each recpent goes through a seres of steps systematcally reducng the match detal wthn certan key varables and elmnatng others. Each of these steps s called a "match level." The last level s desgned to assure a match and stll mantan some degree of covarance between varables (see Fgures 61 through 612). n addton each group remans ndependent durng the match process. That s only the nformaton that was orgnally mssng wll be allocated and no reported data wll be lost n an effort to acheve a match.
3 Table 9. Group Assgnment and Flag Value by Nonresponse Pattern for the Jont Work Experence and Longest Job Allocaton System Earnngs x ndcates not reported and needng allocaton
 1) SEX 2) RACE Male Female Race-l")
 or other Black non-black 3) AGE Under 18 years 18 to 24 years 25 to 34 years 35 to 44 years 45")
 RELATONSHP Relatonshp-l Relatonshp-2 Famly Householder Spouse of")
4 Table 1. Dctonary of Match Varables Used for the Jont Work Experence Earnngs and Longest Job Allocaton System (Persons) 1) SEX 2) RACE Male Female Race-l SE" 4 M F 3 "'" 4 F tl/ ev'a.f. A..c. A-F /'JON..+F Race-2 Whte (Non-Hspanc Whte Hspanc Black ) or other Black non-black 3) AGE Under 18 years 18 to 24 years 25 to 34 years 35 to 44 years 45 to 54 years 55 to 61 years 62 to 64 years 65 to 69 years 7 years and over Under 18 years 18 to 24 years 25 to 34 years 35 to 54 years 55 to 64 years 65 years and over Under 25 years 25 to 54 years 55 years and over 4) RELATONSHP Relatonshp-l Relatonshp-2 Famly Householder Spouse of householder Chld of householder Other relatve of householder Unrelated subfamly member Prmary unrelated ndvdual Secondary unrelated ndvdua Householder/spouse Other relatve of householder Prmary Unrelated ndvdual nonrelatve of householder


 MARTAL STATUS Marred")


5 2 5) Years of School Completed-l 8 years or less 9 to 11 years 12 years 13 to 15 years 16 years 17 years or more Yrs of School Completed-2 Less than 12 years 12 years 13 to 15 years 16 years 17 years or more Yrs of School Completed-3 Less than 12 years 12 years 13 to 15 years 16 years or more 6) MARTAL STATUS Marred Wdowed Dvorced/Separated Never marred 7) PRESENCE OF RELATED CHLDREN No chldren under 18 years/nu Some chldren under 6 years All chldren 6 to 17 years 8) LABOR FORCE STATUS OF SPOUSE n labor force Not n labor force Not n unverse (not marred) 9) WEEKS WORKED -- Weeks Worked-l Weeks Worked-2 Under 12 weeks 12 to 25 weeks 26 to 38 weeks 39 to 49 weeks 5 weeks or more Under 2 weeks 2 to 34 weeks 35 to 49 weeks 5 weeks or more D (.. a.p 3.1>+ 1\ j -
 Occupaton of Longest Job-2 (Use Recode POCCU2 about 52 categores) CLASS OF WORKER Class of Worker-l Class")

6 3 HOURS WORKED - J : C\ t OJ l '" 1 to 19 hours 2 to 34 hours 35 hours or more p <3 o3;r OCCUPATON OF LONGEST JOB occupaton of Longest Job-l (3-dgt occupaton code) Occupaton of Longest Job-2 (Use Recode POCCU2 about 52 categores) CLASS OF WORKER Class of Worker-l Class of Worker-2 Prvate Federal Government State or Local Government Self-employed Wthout pay Wage and salary Self-employed Wthout pay OTHER EARNNGS RECPENCY Wage and Salary No No No ro Yes Yes Yes Yes Self-Employed No No Yes Yes No No Yes Yes Farm No Yes No Yes No Yes No Yes
/'9 $25 to $4999 $5 to $9999 $1 to $14999 $15 to $19999 $2 to $29999 $3 to $39999 $4 to")
 TYPE OF RESDENCE Type of Resdence-l Type of Resdence-2 Farm «} Nonfarm nsde SA (1")
 Nonfarm outsdrmsa nsde Outsde MSA MSA REGON Northeast Mdwest South")
7 4 EARN NGS OF LONGEST JOB- Loss p $2596-.$/- )/'9 $25 to $4999 $5 to $9999 $1 to $14999 $15 to $19999 $2 to $29999 $3 to $39999 $4 to $49999 $5 to $59999 $6 to $74999 $75 or more -- > Loss.. ".:- ;:::=: g 5".t L).5 6J a5 L 5 'J'. (Households) TYPE OF RESDENCE Type of Resdence-l Type of Resdence-2 Farm «} Nonfarm nsde SA (1 mllon+ pop) Nonfarm nsde.'msa (less than 1 mllon pop) Nonfarm outsdrmsa nsde Outsde MSA MSA REGON Northeast Mdwest South West TRANSFER PAYMENTS Wth transfer payments Wthout/not coded transfer payments ( -r f\" s L.w + f tr3 9- Fs ss::' fhv 1J'- t..o \c: \ -e.. )

8 .: 'lqll'f 1. Post Edt ";upeteness and ':;onsstenc..;llec{s

9 .; Fgure l. t'ost.d t CoMpleteness and ";onslstenc ";necxs.cont... : Er'O' Condton' l- N \ r r";"-
10 .: "" t"'" 11. "...t "'t ' c ;' lete nnr;c nn "' n-j.::."n.-.. ';"' C """"c lj ' ":JU"..w -Ar "JJ""u""_J."w-."'"' r N N 3 "-.. v U'OJ' Condton " R'V"


11 M 11.'1."' l'" t' """" "" 1 t "'n "ro n s " " c'nc l S t nc " '}O C "C r.r.n'.of""."" 'VJ..-"._A..-""-"""vU- "."v.'" v-c. P " Error Condton.J Error' Condton N Error Condton 1- Flag fol' Wo'X Expel'ence Mputaton Y Error Condton M ; -

12 'gur'' 1. Post Edt ;opletene5s 1nd Consstency ;;:ecks'.:on:. E%'ror.:Cndton 11 j r--- 3a l J ị r: 1311> l J '..'


13 Fgu: 19. 'last. Edt ';:Dftete:1eS5?nd :'::l)nslsterjc";:ec(stcont r- r V R "'" Error Condton r- N.
14 .;
15
16
17
18
19

20
21 - ;- t rt1 C - to lt - to lt ; (... 1 CO İ t 1) -- cot- 'n1- ;g :'" '" j l"'t '/ "'t ' j rx ; c l-s n ' -s ; a.. ;.1 b J-< td 1 :111 g. ' ' 1-;: 1 3 "'C '- 'td td Co ; w- t k r ị : < Q -s Q C".-- C'D "" ; a c= - - T r =1= rr3 OJ -'. V V -'. -. COCO V r- O m nco -'. m "tjv -'.co.- m c:... r T :: -D ('"to C") --' C1) < C1) --' no co OJ co.- OJ OJ - rr OJ -. V -t 3 r- co mv co.- c:... co - -c V V -. co --- ṃ. - r 1=1 - -r T: F
22 .- "-.j of. Q tt -. " Q c:? tt. n " c:? -1 ' m CO "" ; f 1. - U1 t- - '< "- ro "'1 ro V.. ro n ro 1-...:.. rt1 C. to V) -tt '- J ln r+ t - fa" ị - 1.) - on l- D/ Ct 'Ct : """ "'5 1 ; l"'t.- 1 n n C :D 1 j- ' r- ; C j'" llt.. :. S - 2: :. ) '"'5 : Q. :. j. j -"--'."' -S td V td.n td ' ;ooft 'n. -.. c. -s td :\ j- :z a :"1 '-- : a Ut Ut a c: ī r; (A 1-' r :N OJ n. 1 j ; ;. )C. 1 ;. Ị ; <: Q.. Q - 'D t--- x '" ; c= -c.. -'. V) V) -'. \ - --j-- t r -- :: - Q/ co+- n ' cn < cn r"'1 X " -'- n OJ Q. c-to r"'1 OJ -'- \ -V) -c V) V) -'- CO --' «r"'1 OJ -'- Q V - t...o r- Q.- Fl=l= p-r..c. V) C"t" " -
23
24 -- g ('... ro "C g (""to 1/1 ro n ro -' " (""to '- \ :- td 1- : f :..... V) --. a. (') rt1 "'1 --. lq 1/1 :-.. 'lq -.. c+ c 1 a- '- -- j- :'::1:> fl'> t- - t :n ;g tjt tjt -tt.. (.. j c ;- ;x ; jc" :.. : -"-'.." '". n ; 'n -- Q. 1\ '- g :"'1 1C"t' g '- jlt C"t' g C"t' C lt -r-- l- - a. to) k r N t:q n m '- t- 1(1) : :)( Ị <: C C CT 'D C) C - t- O r ;c t) -'. n(/) -'. (/) " -'. -'. t)<a n o : +-t 1 rtt X " t) -'. t) ::1 Q n C"+ t) n Q ---f j - --' c.. t) < t) --' <a t) (/) c+ c:.- O C- O Q C"+ Q r.-:;"c "F' ;::-:--f= (/) (/) -'. c- --' C"+ t) """"rtt -'. <a (/)
25 OF G..." - - Q V -t) " Q (""t- V n " (""t- ị "" :w r' g; j 1""1 1 1""1 l ;n - :- '.c " Q t+ j r- X O C "'l :111 "' m. j "- a. to) Ī r E :g n 1 ' c (/) co :x ị <: 1 -'. 1 C" CO F - -; G") c= fy-r 1- T... rj- rt1 ; g "'1 :; :;:; lolo -l "'1"'1 OA 3 rt1 X " :;' lo"'1 :3 -g c-t-:;' c-t- (') (') c... :.. CT < :; lo -"" c-tc... CT g c-tg.. g :; - c-t- "'1 -:; rt1 g "'1 :; - ' CT «
.")
26 t t C po- C) c: 1/1 1/1 or- or- N.-4 c.. => J --1;1 > C1J..C1J roc U +-' to s:: OJ s... 1 >- \" > QJ c t )(1 GJ; V)' r 4)' U 1: -4-jl j _1- - J.-J. C 41 s.. ; 4 u' 41' V 41' s....' - f'- &/ QJ &/' : ' c.. _.1 "1 r :fjj + &/ QJ. V s..1 cfl s..1 '.a' G -J:.J ---: -oj GJ ' '"" "' GJ' GJ 3: ; -' \" " j - c - :: ; ' :J: OJ' -" '-' 1 -;;1 r s..1 QJ S '1- C C' - fa - -: _. -f (..). -j 81 la' cj c: U. C -'Q)' U f U '- la.oj O """j +'1 "'t all g'( - "- '" g'1...: LJoJ..' -' x r ('\1 Xf Q.-' s.. QJ QJ c: U) +..) - to s.. c: U) s.. QJ t- - to -' \: GJ" Q) cl -'' - - QJ U C QJ --'" QJ S- t- t- - -\ U') ( )' :J -..al -1 -:;:;(J<::.; '><1 'X -=j f..c -C/ 'too' t- +oj - ' : -J \g t U; +oj fo +oj' ' U c - O -' -:;:;'1 V): c' s... - E ' u OJ j..- oct +' -l-- X M J d d J
Chapter 8 Multivariate Regression Analysis
 Chapter 8 Multvarate Regresson Analyss 8.3 Multple Regresson wth K Independent Varables 8.4 Sgnfcance tests of Parameters Populaton Regresson Model For K ndependent varables, the populaton regresson and
The young are not forever young:
 The young are not forever young: the assmlaton of young persons n the labour market n France Stephen Bazen and Khald Maman Wazr Paper presented at AMSE-Banque de France Labour Economcs Conference December
Chapter 5 Multilevel Models
 Chapter 5 Multlevel Models 5.1 Cross-sectonal multlevel models 5.1.1 Two-level models 5.1.2 Multple level models 5.1.3 Multple level modelng n other felds 5.2 Longtudnal multlevel models 5.2.1 Two-level
Online Appendix to: Axiomatization and measurement of Quasi-hyperbolic Discounting
 Onlne Appendx to: Axomatzaton and measurement of Quas-hyperbolc Dscountng José Lus Montel Olea Tomasz Strzaleck 1 Sample Selecton As dscussed before our ntal sample conssts of two groups of subjects. Group
A Simple Inventory System
 A Smple Inventory System Lawrence M. Leems and Stephen K. Park, Dscrete-Event Smulaton: A Frst Course, Prentce Hall, 2006 Hu Chen Computer Scence Vrgna State Unversty Petersburg, Vrgna February 8, 2017
Cathy Walker March 5, 2010
 Cathy Walker March 5, 010 Part : Problem Set 1. What s the level of measurement for the followng varables? a) SAT scores b) Number of tests or quzzes n statstcal course c) Acres of land devoted to corn
Econometrics: What's It All About, Alfie?
 ECON 351* -- Introducton (Page 1) Econometrcs: What's It All About, Ale? Usng sample data on observable varables to learn about economc relatonshps, the unctonal relatonshps among economc varables. Econometrcs
LINEAR REGRESSION ANALYSIS. MODULE IX Lecture Multicollinearity
 LINEAR REGRESSION ANALYSIS MODULE IX Lecture - 30 Multcollnearty Dr. Shalabh Department of Mathematcs and Statstcs Indan Insttute of Technology Kanpur 2 Remedes for multcollnearty Varous technques have
Statistics and Quantitative Analysis U4320. Segment 3: Probability Prof. Sharyn O Halloran
 Statstcs and Quanttatve Analyss U430 Segment 3: Probablty Prof. Sharyn O Halloran Revew: Descrptve Statstcs Code book for Measures Sample Data Relgon Employed 1. Catholc 0. Unemployed. Protestant 1. Employed
DO NOT OPEN THE QUESTION PAPER UNTIL INSTRUCTED TO DO SO BY THE CHIEF INVIGILATOR. Introductory Econometrics 1 hour 30 minutes
 25/6 Canddates Only January Examnatons 26 Student Number: Desk Number:...... DO NOT OPEN THE QUESTION PAPER UNTIL INSTRUCTED TO DO SO BY THE CHIEF INVIGILATOR Department Module Code Module Ttle Exam Duraton
Topic- 11 The Analysis of Variance
 Topc- 11 The Analyss of Varance Expermental Desgn The samplng plan or expermental desgn determnes the way that a sample s selected. In an observatonal study, the expermenter observes data that already
Weighted Estimating Equations with Response Propensities in Terms of Covariates Observed only for Responders
 Weghted Estmatng Equatons wth Response Propenstes n Terms of Covarates Observed only for Responders Erc V. Slud, U.S. Census Bureau, CSRM Unv. of Maryland, Mathematcs Dept. NISS Mssng Data Workshop, November
Chapter 8 Indicator Variables
 Chapter 8 Indcator Varables In general, e explanatory varables n any regresson analyss are assumed to be quanttatve n nature. For example, e varables lke temperature, dstance, age etc. are quanttatve n
Online Appendix to The Allocation of Talent and U.S. Economic Growth
 Onlne Appendx to The Allocaton of Talent and U.S. Economc Growth Not for publcaton) Chang-Ta Hseh, Erk Hurst, Charles I. Jones, Peter J. Klenow February 22, 23 A Dervatons and Proofs The propostons n the
Reminder: Nested models. Lecture 9: Interactions, Quadratic terms and Splines. Effect Modification. Model 1
 Lecture 9: Interactons, Quadratc terms and Splnes An Manchakul amancha@jhsph.edu 3 Aprl 7 Remnder: Nested models Parent model contans one set of varables Extended model adds one or more new varables to
Module 9. Lecture 6. Duality in Assignment Problems
 Module 9 1 Lecture 6 Dualty n Assgnment Problems In ths lecture we attempt to answer few other mportant questons posed n earler lecture for (AP) and see how some of them can be explaned through the concept
STATISTICS QUESTIONS. Step by Step Solutions.
 STATISTICS QUESTIONS Step by Step Solutons www.mathcracker.com 9//016 Problem 1: A researcher s nterested n the effects of famly sze on delnquency for a group of offenders and examnes famles wth one to
III. Econometric Methodology Regression Analysis
 Page Econ07 Appled Econometrcs Topc : An Overvew of Regresson Analyss (Studenmund, Chapter ) I. The Nature and Scope of Econometrcs. Lot s of defntons of econometrcs. Nobel Prze Commttee Paul Samuelson,
UNIVERSITY OF TORONTO Faculty of Arts and Science. December 2005 Examinations STA437H1F/STA1005HF. Duration - 3 hours
 UNIVERSITY OF TORONTO Faculty of Arts and Scence December 005 Examnatons STA47HF/STA005HF Duraton - hours AIDS ALLOWED: (to be suppled by the student) Non-programmable calculator One handwrtten 8.5'' x
Dummy variables in multiple variable regression model
 WESS Econometrcs (Handout ) Dummy varables n multple varable regresson model. Addtve dummy varables In the prevous handout we consdered the followng regresson model: y x 2x2 k xk,, 2,, n and we nterpreted
Chapter 15 - Multiple Regression
 Chapter - Multple Regresson Chapter - Multple Regresson Multple Regresson Model The equaton that descrbes how the dependent varable y s related to the ndependent varables x, x,... x p and an error term
University of California at Berkeley Fall Introductory Applied Econometrics Final examination
 SID: EEP 118 / IAS 118 Elsabeth Sadoulet and Daley Kutzman Unversty of Calforna at Berkeley Fall 01 Introductory Appled Econometrcs Fnal examnaton Scores add up to 10 ponts Your name: SID: 1. (15 ponts)
Lecture 6: Introduction to Linear Regression
 Lecture 6: Introducton to Lnear Regresson An Manchakul amancha@jhsph.edu 24 Aprl 27 Lnear regresson: man dea Lnear regresson can be used to study an outcome as a lnear functon of a predctor Example: 6
Lecture 9: Linear regression: centering, hypothesis testing, multiple covariates, and confounding
 Recall: man dea of lnear regresson Lecture 9: Lnear regresson: centerng, hypothess testng, multple covarates, and confoundng Sandy Eckel seckel@jhsph.edu 6 May 8 Lnear regresson can be used to study an
Lecture 9: Linear regression: centering, hypothesis testing, multiple covariates, and confounding
 Lecture 9: Lnear regresson: centerng, hypothess testng, multple covarates, and confoundng Sandy Eckel seckel@jhsph.edu 6 May 008 Recall: man dea of lnear regresson Lnear regresson can be used to study
ECON 626: Applied Microeconomics. Lecture 4: Instrumental Variables
 ECON 626: Appled Mcroeconomcs Lecture 4: Instrumental Varables Professors: Pamela Jakela and Owen Ozer Department of Economcs Unversty of Maryland, College Park Wald When two varables are measured wth
Topic 23 - Randomized Complete Block Designs (RCBD)
") Topc 3 ANOVA (III) 3-1 Topc 3 - Randomzed Complete Block Desgns (RCBD) Defn: A Randomzed Complete Block Desgn s a varant of the completely randomzed desgn (CRD) that we recently learned. In ths desgn,
Topc 3 ANOVA (III) 3-1 Topc 3 - Randomzed Complete Block Desgns (RCBD) Defn: A Randomzed Complete Block Desgn s a varant of the completely randomzed desgn (CRD) that we recently learned. In ths desgn,
3/3/2014. CDS M Phil Econometrics. Vijayamohanan Pillai N. CDS Mphil Econometrics Vijayamohan. 3-Mar-14. CDS M Phil Econometrics.
 Dummy varable Models an Plla N Dummy X-varables Dummy Y-varables Dummy X-varables Dummy X-varables Dummy varable: varable assumng values 0 and to ndcate some attrbutes To classfy data nto mutually exclusve
: 5: ) A
 A") Revew 1 004.11.11 Chapter 1: 1. Elements, Varable, and Observatons:. Type o Data: Qualtatve Data and Quanttatve Data (a) Qualtatve data may be nonnumerc or numerc. (b) Quanttatve data are always numerc.
Revew 1 004.11.11 Chapter 1: 1. Elements, Varable, and Observatons:. Type o Data: Qualtatve Data and Quanttatve Data (a) Qualtatve data may be nonnumerc or numerc. (b) Quanttatve data are always numerc.
x = , so that calculated
 Stat 4, secton Sngle Factor ANOVA notes by Tm Plachowsk n chapter 8 we conducted hypothess tests n whch we compared a sngle sample s mean or proporton to some hypotheszed value Chapter 9 expanded ths to
~,. :'lr. H ~ j. l' ", ...,~l. 0 '" ~ bl '!; 1'1. :<! f'~.., I,," r: t,... r':l G. t r,. 1'1 [<, ."" f'" 1n. t.1 ~- n I'>' 1:1 , I. <1 ~'..
 ,, 'l t (.) :;,/.I I n ri' ' r l ' rt ( n :' (I : d! n t, :?rj I),.. fl.),. f!..,,., til, ID f-i... j I. 't' r' t II!:t () (l r El,, (fl lj J4 ([) f., () :. -,,.,.I :i l:'!, :I J.A.. t,.. p, - ' I I I
PhysicsAndMathsTutor.com
 1. A random sample of 100 people were asked f ther fnances were worse, the same or better than ths tme last year. The sample was splt accordng to ther annual ncome and the results are shown n the table
Consistent Aggregation With Superlative and Other Price Indices
 Consstent Aggregaton Wth Superlatve and Other Prce Indces (revsed verson, 4 May 207) Ludwg von Auer (Unverstät Trer) Jochen Wengenroth (Unverstät Trer) Eltvlle, May 207 / 20 Consstent Aggregaton Wth Superlatve
January Examinations 2015
 24/5 Canddates Only January Examnatons 25 DO NOT OPEN THE QUESTION PAPER UNTIL INSTRUCTED TO DO SO BY THE CHIEF INVIGILATOR STUDENT CANDIDATE NO.. Department Module Code Module Ttle Exam Duraton (n words)
An (almost) unbiased estimator for the S-Gini index
 unbiased estimator for the S-Gini index") An (almost unbased estmator for the S-Gn ndex Thomas Demuynck February 25, 2009 Abstract Ths note provdes an unbased estmator for the absolute S-Gn and an almost unbased estmator for the relatve S-Gn for
An (almost unbased estmator for the S-Gn ndex Thomas Demuynck February 25, 2009 Abstract Ths note provdes an unbased estmator for the absolute S-Gn and an almost unbased estmator for the relatve S-Gn for
Chapter 3 Describing Data Using Numerical Measures
 Chapter 3 Student Lecture Notes 3-1 Chapter 3 Descrbng Data Usng Numercal Measures Fall 2006 Fundamentals of Busness Statstcs 1 Chapter Goals To establsh the usefulness of summary measures of data. The
Exercises of Chapter 2
 Exercses of Chapter Chuang-Cheh Ln Department of Computer Scence and Informaton Engneerng, Natonal Chung Cheng Unversty, Mng-Hsung, Chay 61, Tawan. Exercse.6. Suppose that we ndependently roll two standard
Introduction to information theory and data compression
 Introducton to nformaton theory and data compresson Adel Magra, Emma Gouné, Irène Woo March 8, 207 Ths s the augmented transcrpt of a lecture gven by Luc Devroye on March 9th 207 for a Data Structures
Department of Statistics University of Toronto STA305H1S / 1004 HS Design and Analysis of Experiments Term Test - Winter Solution
 Department of Statstcs Unversty of Toronto STA35HS / HS Desgn and Analyss of Experments Term Test - Wnter - Soluton February, Last Name: Frst Name: Student Number: Instructons: Tme: hours. Ads: a non-programmable
LINEAR REGRESSION ANALYSIS. MODULE VIII Lecture Indicator Variables
 LINEAR REGRESSION ANALYSIS MODULE VIII Lecture - 7 Indcator Varables Dr. Shalabh Department of Maematcs and Statstcs Indan Insttute of Technology Kanpur Indcator varables versus quanttatve explanatory
FINANCIAL DISCLOSURE REPORT FOR CALENDAR YEAR '1C '1. Initial V Annual Final. Sb. _ Amended Report
 A010 (W) Rev. 1/007 FNANCAL DSCLOSURE REPORT FOR CALENDAR YEAR 1C1 Report Requred by the Ethcs n Government Act of 1978, (5 US.C. app. 101111). Person Reportng (Last name, frst, mddle ntal). Court or Organzaton.
Chapter 13: Multiple Regression
 Chapter 13: Multple Regresson 13.1 Developng the multple-regresson Model The general model can be descrbed as: It smplfes for two ndependent varables: The sample ft parameter b 0, b 1, and b are used to
Department of Quantitative Methods & Information Systems. Time Series and Their Components QMIS 320. Chapter 6
 Department of Quanttatve Methods & Informaton Systems Tme Seres and Ther Components QMIS 30 Chapter 6 Fall 00 Dr. Mohammad Zanal These sldes were modfed from ther orgnal source for educatonal purpose only.
ANOVA. The Observations y ij
 ANOVA Stands for ANalyss Of VArance But t s a test of dfferences n means The dea: The Observatons y j Treatment group = 1 = 2 = k y 11 y 21 y k,1 y 12 y 22 y k,2 y 1, n1 y 2, n2 y k, nk means: m 1 m 2
FY 13 TDC Revenue Report 31-Dec-2012
 CLLR CNTY TRST TAX RVN CAC January 10, 2013 V-1 Staff Reprts 1 f 18 Budget escriptin und Y 13 Adpted Budget Y 13 (5%) Reserved by Law Y 13 Net Budget Y 13 recast Variance t Y 13 Budget Beach acilities
Section 8.1 Exercises
 Secton 8.1 Non-rght Trangles: Law of Snes and Cosnes 519 Secton 8.1 Exercses Solve for the unknown sdes and angles of the trangles shown. 10 70 50 1.. 18 40 110 45 5 6 3. 10 4. 75 15 5 6 90 70 65 5. 6.
Continuous vs. Discrete Goods
 CE 651 Transportaton Economcs Charsma Choudhury Lecture 3-4 Analyss of Demand Contnuous vs. Dscrete Goods Contnuous Goods Dscrete Goods x auto 1 Indfference u curves 3 u u 1 x 1 0 1 bus Outlne Data Modelng
χ x B E (c) Figure 2.1.1: (a) a material particle in a body, (b) a place in space, (c) a configuration of the body
 Figure 2.1.1: (a) a material particle in a body, (b) a place in space, (c) a configuration of the body") Secton.. Moton.. The Materal Body and Moton hyscal materals n the real world are modeled usng an abstract mathematcal entty called a body. Ths body conssts of an nfnte number of materal partcles. Shown
Secton.. Moton.. The Materal Body and Moton hyscal materals n the real world are modeled usng an abstract mathematcal entty called a body. Ths body conssts of an nfnte number of materal partcles. Shown
i;\-'i frz q > R>? >tr E*+ [S I z> N g> F 'x sa :r> >,9 T F >= = = I Y E H H>tr iir- g-i I * s I!,i --' - = a trx - H tnz rqx o >.F g< s Ire tr () -s
 -s") 5 C /? >9 T > ; '. ; J ' ' J. \ ;\' \.> ). L; c\ u ( (J ) \ 1 ) : C ) (... >\ > 9 e!) T C). '1!\ /_ \ '\ ' > 9 C > 9.' \( T Z > 9 > 5 P + 9 9 ) :> : + (. \ z : ) z cf C : u 9 ( :!z! Z c (! $ f 1 :.1 f.
5 C /? >9 T > ; '. ; J ' ' J. \ ;\' \.> ). L; c\ u ( (J ) \ 1 ) : C ) (... >\ > 9 e!) T C). '1!\ /_ \ '\ ' > 9 C > 9.' \( T Z > 9 > 5 P + 9 9 ) :> : + (. \ z : ) z cf C : u 9 ( :!z! Z c (! $ f 1 :.1 f.
Population element: 1 2 N. 1.1 Sampling with Replacement: Hansen-Hurwitz Estimator(HH)
") Chapter 1 Samplng wth Unequal Probabltes Notaton: Populaton element: 1 2 N varable of nterest Y : y1 y2 y N Let s be a sample of elements drawn by a gven samplng method. In other words, s s a subset of
Chapter 1 Samplng wth Unequal Probabltes Notaton: Populaton element: 1 2 N varable of nterest Y : y1 y2 y N Let s be a sample of elements drawn by a gven samplng method. In other words, s s a subset of
The Geometry of Logit and Probit
 The Geometry of Logt and Probt Ths short note s meant as a supplement to Chapters and 3 of Spatal Models of Parlamentary Votng and the notaton and reference to fgures n the text below s to those two chapters.
APPENDIX F WATER USE SUMMARY
 APPENDX F WATER USE SUMMARY From Past Projects Town of Norman Wells Water Storage Facltes Exstng Storage Requrements and Tank Volume Requred Fre Flow 492.5 m 3 See Feb 27/9 letter MACA to Norman Wells
APPH 4200 Physics of Fluids
 APPH 42 Physics of Fluids Problem Solving and Vorticity (Ch. 5) 1.!! Quick Review 2.! Vorticity 3.! Kelvin s Theorem 4.! Examples 1 How to solve fluid problems? (Like those in textbook) Ç"Tt=l I $T1P#(
STAT 3014/3914. Semester 2 Applied Statistics Solution to Tutorial 13
 STAT 304/394 Semester Appled Statstcs 05 Soluton to Tutoral 3. Note that s the total mleage for branch. a) -stage cluster sample Cluster branches N ; n 4) Element cars M 80; m 40) Populaton mean no. of
Dr. Shalabh Department of Mathematics and Statistics Indian Institute of Technology Kanpur
 Analyss of Varance and Desgn of Experment-I MODULE VIII LECTURE - 34 ANALYSIS OF VARIANCE IN RANDOM-EFFECTS MODEL AND MIXED-EFFECTS EFFECTS MODEL Dr Shalabh Department of Mathematcs and Statstcs Indan
Econ107 Applied Econometrics Topic 3: Classical Model (Studenmund, Chapter 4)
") I. Classcal Assumptons Econ7 Appled Econometrcs Topc 3: Classcal Model (Studenmund, Chapter 4) We have defned OLS and studed some algebrac propertes of OLS. In ths topc we wll study statstcal propertes
I. Classcal Assumptons Econ7 Appled Econometrcs Topc 3: Classcal Model (Studenmund, Chapter 4) We have defned OLS and studed some algebrac propertes of OLS. In ths topc we wll study statstcal propertes
MPM 2D Final Exam Prep 2, June b) Y = 2(x + 1)2-18. ~..: 2. (xl- 1:'}")( t J') -' ( B. vi::: 2 ~ 1-'+ 4 1<. -t-:2 -( 6! '.
 Y = 2(x + 1)2-18. ~..: 2. (xl- 1:'})( t J') -' ( B. vi::: 2 ~ 1-'+ 4 1<. -t-:2 -( 6! '.") MPM 2D Final Exam Prep 2 June 2017 1. Express each equation in standard form and factored form: ~ ~ +et's 'leu t W (.. ".>tak( a) y = (x + 5)2 + 1 on ::t~'t.{1'" ~heeh v 1' K 1 C'. T.) '. (J. lr lov J
MPM 2D Final Exam Prep 2 June 2017 1. Express each equation in standard form and factored form: ~ ~ +et's 'leu t W (.. ".>tak( a) y = (x + 5)2 + 1 on ::t~'t.{1'" ~heeh v 1' K 1 C'. T.) '. (J. lr lov J
Design Equations. ν ij r i V R. ν ij r i. Q n components. = Q f c jf Qc j + Continuous Stirred Tank Reactor (steady-state and constant phase)
") Desgn Equatons Batch Reactor d(v R c j ) dt = ν j r V R n dt dt = UA(T a T) r H R V R ncomponents V R c j C pj j Plug Flow Reactor d(qc j ) dv = ν j r 2 dt dv = R U(T a T) n r H R Q n components j c j
Desgn Equatons Batch Reactor d(v R c j ) dt = ν j r V R n dt dt = UA(T a T) r H R V R ncomponents V R c j C pj j Plug Flow Reactor d(qc j ) dv = ν j r 2 dt dv = R U(T a T) n r H R Q n components j c j
Predictive Analytics : QM901.1x Prof U Dinesh Kumar, IIMB. All Rights Reserved, Indian Institute of Management Bangalore
 Sesson Outlne Introducton to classfcaton problems and dscrete choce models. Introducton to Logstcs Regresson. Logstc functon and Logt functon. Maxmum Lkelhood Estmator (MLE) for estmaton of LR parameters.
Parametric fractional imputation for missing data analysis. Jae Kwang Kim Survey Working Group Seminar March 29, 2010
 Parametrc fractonal mputaton for mssng data analyss Jae Kwang Km Survey Workng Group Semnar March 29, 2010 1 Outlne Introducton Proposed method Fractonal mputaton Approxmaton Varance estmaton Multple mputaton
Dimension Reduction and Visualization of the Histogram Data
 The 4th Workshop n Symbolc Data Analyss (SDA 214): Tutoral Dmenson Reducton and Vsualzaton of the Hstogram Data Han-Mng Wu ( 吳漢銘 ) Department of Mathematcs Tamkang Unversty Tamsu 25137, Tawan http://www.hmwu.dv.tw
Systems of Equations (SUR, GMM, and 3SLS)
") Lecture otes on Advanced Econometrcs Takash Yamano Fall Semester 4 Lecture 4: Sstems of Equatons (SUR, MM, and 3SLS) Seemngl Unrelated Regresson (SUR) Model Consder a set of lnear equatons: $ + ɛ $ + ɛ
Lecture otes on Advanced Econometrcs Takash Yamano Fall Semester 4 Lecture 4: Sstems of Equatons (SUR, MM, and 3SLS) Seemngl Unrelated Regresson (SUR) Model Consder a set of lnear equatons: $ + ɛ $ + ɛ
Statistics II Final Exam 26/6/18
 Statstcs II Fnal Exam 26/6/18 Academc Year 2017/18 Solutons Exam duraton: 2 h 30 mn 1. (3 ponts) A town hall s conductng a study to determne the amount of leftover food produced by the restaurants n the
1-FACTOR ANOVA (MOTIVATION) [DEVORE 10.1]
![1-FACTOR ANOVA (MOTIVATION) [DEVORE 10.1]](/thumbs/96/128694172.jpg "1-FACTOR ANOVA (MOTIVATION) [DEVORE 10.1]") 1-FACTOR ANOVA (MOTIVATION) [DEVORE 10.1] Hgh varance between groups Low varance wthn groups s 2 between/s 2 wthn 1 Factor A clearly has a sgnfcant effect!! Low varance between groups Hgh varance wthn
1-FACTOR ANOVA (MOTIVATION) [DEVORE 10.1] Hgh varance between groups Low varance wthn groups s 2 between/s 2 wthn 1 Factor A clearly has a sgnfcant effect!! Low varance between groups Hgh varance wthn
Why? Chemistry Crunch #4.1 : Name: KEY Phase Changes. Success Criteria: Prerequisites: Vocabulary:
 Chemstry Crunch #4.1 : Name: KEY Phase Changes Why? Most substances wll eventually go through a phase change when heated or cooled (sometmes they chemcally react nstead). Molecules of a substance are held
'NOTAS"CRITICAS PARA UNA TEDRIA DE M BUROCRACIA ESTATAL * Oscar Oszlak
 OVí "^Ox^ OqAÍ"^ Dcument SD-11 \ 'NOTAS"CRTCAS PARA UNA TEDRA DE M BUROCRACA ESTATAL * Oscr Oszlk * El presente dcument que se reprduce pr us exclusv de ls prtcpntes de curss de Prrms de Cpctcón, se h
Comparison of Regression Lines
 STATGRAPHICS Rev. 9/13/2013 Comparson of Regresson Lnes Summary... 1 Data Input... 3 Analyss Summary... 4 Plot of Ftted Model... 6 Condtonal Sums of Squares... 6 Analyss Optons... 7 Forecasts... 8 Confdence
Introduction to Regression
 Introducton to Regresson Dr Tom Ilvento Department of Food and Resource Economcs Overvew The last part of the course wll focus on Regresson Analyss Ths s one of the more powerful statstcal technques Provdes
Interpreting Slope Coefficients in Multiple Linear Regression Models: An Example
 CONOMICS 5* -- Introducton to NOT CON 5* -- Introducton to NOT : Multple Lnear Regresson Models Interpretng Slope Coeffcents n Multple Lnear Regresson Models: An xample Consder the followng smple lnear
4 Analysis of Variance (ANOVA) 5 ANOVA. 5.1 Introduction. 5.2 Fixed Effects ANOVA
 5 ANOVA. 5.1 Introduction. 5.2 Fixed Effects ANOVA") 4 Analyss of Varance (ANOVA) 5 ANOVA 51 Introducton ANOVA ANOVA s a way to estmate and test the means of multple populatons We wll start wth one-way ANOVA If the populatons ncluded n the study are selected
4 Analyss of Varance (ANOVA) 5 ANOVA 51 Introducton ANOVA ANOVA s a way to estmate and test the means of multple populatons We wll start wth one-way ANOVA If the populatons ncluded n the study are selected
Maximizing Overlap of Large Primary Sampling Units in Repeated Sampling: A comparison of Ernst s Method with Ohlsson s Method
 Maxmzng Overlap of Large Prmary Samplng Unts n Repeated Samplng: A comparson of Ernst s Method wth Ohlsson s Method Red Rottach and Padrac Murphy 1 U.S. Census Bureau 4600 Slver Hll Road, Washngton DC
A L A BA M A L A W R E V IE W
 A L A BA M A L A W R E V IE W Volume 52 Fall 2000 Number 1 B E F O R E D I S A B I L I T Y C I V I L R I G HT S : C I V I L W A R P E N S I O N S A N D TH E P O L I T I C S O F D I S A B I L I T Y I N
BOOTSTRAP METHOD FOR TESTING OF EQUALITY OF SEVERAL MEANS. M. Krishna Reddy, B. Naveen Kumar and Y. Ramu
 BOOTSTRAP METHOD FOR TESTING OF EQUALITY OF SEVERAL MEANS M. Krshna Reddy, B. Naveen Kumar and Y. Ramu Department of Statstcs, Osmana Unversty, Hyderabad -500 007, Inda. nanbyrozu@gmal.com, ramu0@gmal.com
3.1 Expectation of Functions of Several Random Variables. )' be a k-dimensional discrete or continuous random vector, with joint PMF p (, E X E X1 E X
' be a k-dimensional discrete or continuous random vector, with joint PMF p (, E X E X1 E X") Statstcs 1: Probablty Theory II 37 3 EPECTATION OF SEVERAL RANDOM VARIABLES As n Probablty Theory I, the nterest n most stuatons les not on the actual dstrbuton of a random vector, but rather on a number
Statstcs 1: Probablty Theory II 37 3 EPECTATION OF SEVERAL RANDOM VARIABLES As n Probablty Theory I, the nterest n most stuatons les not on the actual dstrbuton of a random vector, but rather on a number
1. Inference on Regression Parameters a. Finding Mean, s.d and covariance amongst estimates. 2. Confidence Intervals and Working Hotelling Bands
 Content. Inference on Regresson Parameters a. Fndng Mean, s.d and covarance amongst estmates.. Confdence Intervals and Workng Hotellng Bands 3. Cochran s Theorem 4. General Lnear Testng 5. Measures of
Chapter 2 - The Simple Linear Regression Model S =0. e i is a random error. S β2 β. This is a minimization problem. Solution is a calculus exercise.
 Chapter - The Smple Lnear Regresson Model The lnear regresson equaton s: where y + = β + β e for =,..., y and are observable varables e s a random error How can an estmaton rule be constructed for the
This model contains two bonds per unit cell (one along the x-direction and the other along y). So we can rewrite the Hamiltonian as:
. So we can rewrite the Hamiltonian as:") 1 Problem set #1 1.1. A one-band model on a square lattce Fg. 1 Consder a square lattce wth only nearest-neghbor hoppngs (as shown n the fgure above): H t, j a a j (1.1) where,j stands for nearest neghbors
1 Problem set #1 1.1. A one-band model on a square lattce Fg. 1 Consder a square lattce wth only nearest-neghbor hoppngs (as shown n the fgure above): H t, j a a j (1.1) where,j stands for nearest neghbors
Multiple Imputation of Missing Categorical and. Continuous Values via Bayesian Mixture Models with. Local Dependence
 Multple Imputaton of Mssng Categorcal and Contnuous Values va Bayesan Mxture Models wth arxv:1410.0438v2 [stat.ap] 13 Oct 2015 Local Dependence Jared S. Murray and Jerome P. Reter October 14, 2015 Abstract
SOUTHWESTERN ELECTRIC POWER COMPANY SCHEDULE H-6.1b NUCLEAR UNIT OUTAGE DATA. For the Test Year Ended March 31, 2009
 Schedule H-6.lb SOUTHWSTRN LCTRIC POWR COMPANY SCHDUL H-6.1b NUCLAR UNIT OUTAG DATA For the Test Year nded March 31, 29 This schedule is not applicable to SVvPCO. 5 Schedule H-6.1 c SOUTHWSTRN LCTRIC POWR
PROCEEDINGS OF THE AMERICAN MATHEMATICAL SOCIETY Volume 125, Number 7, July 1997, Pages 2119{2125 S (97) THE STRONG OPEN SET CONDITION
 THE STRONG OPEN SET CONDITION") PROCDINGS OF TH AMRICAN MATHMATICAL SOCITY Volume 125, Number 7, July 1997, Pages 2119{2125 S 0002-9939(97)03816-1 TH STRONG OPN ST CONDITION IN TH RANDOM CAS NORBRT PATZSCHK (Communcated by Palle. T.
PROCDINGS OF TH AMRICAN MATHMATICAL SOCITY Volume 125, Number 7, July 1997, Pages 2119{2125 S 0002-9939(97)03816-1 TH STRONG OPN ST CONDITION IN TH RANDOM CAS NORBRT PATZSCHK (Communcated by Palle. T.
Classification Bayesian Classifiers
 lassfcaton Bayesan lassfers Jeff Howbert Introducton to Machne Learnng Wnter 2014 1 Bayesan classfcaton A robablstc framework for solvng classfcaton roblems. Used where class assgnment s not determnstc,.e.
Psychology 282 Lecture #24 Outline Regression Diagnostics: Outliers
 Psychology 282 Lecture #24 Outlne Regresson Dagnostcs: Outlers In an earler lecture we studed the statstcal assumptons underlyng the regresson model, ncludng the followng ponts: Formal statement of assumptons.
,.*Hffi;;* SONAI, IUERCANTII,N I,IMITDII REGD- 0FFICE: 105/33, VARDHMAN GotD[N PLNLA,R0AD No.44, pitampura, DELHI *ffigfk"
 $ S, URCT,,MTD RGD 0C: 10/, VRDM G[ LL,R0D.44, ptmpur, DL114 C: l22ldll98l,c0224gb, eb:.nlmernte.m T, Dte: 17h tber, 201 BS Lmted hre ]eejeebhy Ter Dll Street Mumb 41 The Mnger (Ltng) Delh Stk xhnge /1,
Financing Innovation: Evidence from R&D Grants
 Fnancng Innovaton: Evdence from R&D Grants Sabrna T. Howell Onlne Appendx Fgure 1: Number of Applcants Note: Ths fgure shows the number of losng and wnnng Phase 1 grant applcants over tme by offce (Energy
PBAF 528 Week Theory Is the variable s place in the equation certain and theoretically sound? Most important! 2. T-test
 PBAF 528 Week 6 How do we choose our model? How do you decde whch ndependent varables? If you want to read more about ths, try Studenmund, A.H. Usng Econometrcs Chapter 7. (ether 3 rd or 4 th Edtons) 1.
LOGIT ANALYSIS. A.K. VASISHT Indian Agricultural Statistics Research Institute, Library Avenue, New Delhi
 LOGIT ANALYSIS A.K. VASISHT Indan Agrcultural Statstcs Research Insttute, Lbrary Avenue, New Delh-0 02 amtvassht@asr.res.n. Introducton In dummy regresson varable models, t s assumed mplctly that the dependent
Statistics for Economics & Business
 Statstcs for Economcs & Busness Smple Lnear Regresson Learnng Objectves In ths chapter, you learn: How to use regresson analyss to predct the value of a dependent varable based on an ndependent varable
Chapter 12. Ordinary Differential Equation Boundary Value (BV) Problems
 Problems") Chapter. Ordnar Dfferental Equaton Boundar Value (BV) Problems In ths chapter we wll learn how to solve ODE boundar value problem. BV ODE s usuall gven wth x beng the ndependent space varable. p( x) q(
Chapter. Ordnar Dfferental Equaton Boundar Value (BV) Problems In ths chapter we wll learn how to solve ODE boundar value problem. BV ODE s usuall gven wth x beng the ndependent space varable. p( x) q(
ECONOMETRICS - FINAL EXAM, 3rd YEAR (GECO & GADE)
") ECONOMETRICS - FINAL EXAM, 3rd YEAR (GECO & GADE) June 7, 016 15:30 Frst famly name: Name: DNI/ID: Moble: Second famly Name: GECO/GADE: Instructor: E-mal: Queston 1 A B C Blank Queston A B C Blank Queston
ECONOMETRICS - FINAL EXAM, 3rd YEAR (GECO & GADE) June 7, 016 15:30 Frst famly name: Name: DNI/ID: Moble: Second famly Name: GECO/GADE: Instructor: E-mal: Queston 1 A B C Blank Queston A B C Blank Queston
A New Evolutionary Computation Based Approach for Learning Bayesian Network
 Avalable onlne at www.scencedrect.com Proceda Engneerng 15 (2011) 4026 4030 Advanced n Control Engneerng and Informaton Scence A New Evolutonary Computaton Based Approach for Learnng Bayesan Network Yungang
~i~, ~';J M.1 "A.X;t7~~
 Ci1 ;w -,IL I MX-- AA.R- v-r ';t ""lz"""" f 7ll\1. 13/cd Vt.dJt-l (l{ t f1.)-: ) -;::- r,.o.
Statistics for Business and Economics
 Statstcs for Busness and Economcs Chapter 11 Smple Regresson Copyrght 010 Pearson Educaton, Inc. Publshng as Prentce Hall Ch. 11-1 11.1 Overvew of Lnear Models n An equaton can be ft to show the best lnear
Econ107 Applied Econometrics Topic 9: Heteroskedasticity (Studenmund, Chapter 10)
") I. Defnton and Problems Econ7 Appled Econometrcs Topc 9: Heteroskedastcty (Studenmund, Chapter ) We now relax another classcal assumpton. Ths s a problem that arses often wth cross sectons of ndvduals,
I. Defnton and Problems Econ7 Appled Econometrcs Topc 9: Heteroskedastcty (Studenmund, Chapter ) We now relax another classcal assumpton. Ths s a problem that arses often wth cross sectons of ndvduals,
e i is a random error
 Chapter - The Smple Lnear Regresson Model The lnear regresson equaton s: where + β + β e for,..., and are observable varables e s a random error How can an estmaton rule be constructed for the unknown
Tracking with Kalman Filter
 Trackng wth Kalman Flter Scott T. Acton Vrgna Image and Vdeo Analyss (VIVA), Charles L. Brown Department of Electrcal and Computer Engneerng Department of Bomedcal Engneerng Unversty of Vrgna, Charlottesvlle,
AP Physics 1 & 2 Summer Assignment
 AP Physcs 1 & 2 Summer Assgnment AP Physcs 1 requres an exceptonal profcency n algebra, trgonometry, and geometry. It was desgned by a select group of college professors and hgh school scence teachers
BIO Lab 2: TWO-LEVEL NORMAL MODELS with school children popularity data
 Lab : TWO-LEVEL NORMAL MODELS wth school chldren popularty data Purpose: Introduce basc two-level models for normally dstrbuted responses usng STATA. In partcular, we dscuss Random ntercept models wthout
APPH 4200 Physics of Fluids
 APPH 4200 Physics of Fluids Rotating Fluid Flow October 6, 2011 1.!! Hydrostatics of a Rotating Water Bucket (again) 2.! Bath Tub Vortex 3.! Ch. 5: Problem Solving 1 Key Definitions & Concepts Ω U Cylindrical
Free-Standing Office/Retail Newport News, Virginia
 Free-Standng Offce/Reta Newport News, Vrgna Locaton: 645 J Cyde Morrs Bvd, Newport News, Vrgna 2361 Descrpton: Stuated at the "Far Rght" corner of the sgnazed ntersecton of Woods Road and J Cyde Morrs
Negative Binomial Regression
 STATGRAPHICS Rev. 9/16/2013 Negatve Bnomal Regresson Summary... 1 Data Input... 3 Statstcal Model... 3 Analyss Summary... 4 Analyss Optons... 7 Plot of Ftted Model... 8 Observed Versus Predcted... 10 Predctons...